


Languages
Pages
Legal


2010 Massachusetts


County Health Rankings: 2010 Massachusetts
www.countyhealthrankings.org/massachusetts 1
Introduction
Where we live matters to our health. The health of a
community depends on many different factors, including
quality of health care, individual behavior, education and
jobs, and the environment. We can improve a
community’s health through programs and policies. For
example, people who live in communities with ample
park and recreation space are more likely to exercise,
which reduces heart disease risk. People who live in
communities with smoke-free laws are less likely to
smoke or to be exposed to second-hand smoke, which
reduces lung cancer risk.
The problem is that there are big differences in health
across communities, with some places being much
healthier than others. And up to now, it has been hard to
get a standard way to measure how healthy a county is
and see where they can improve.
The Robert Wood Johnson Foundation and the
University of Wisconsin Population Health Institute are
pleased to present the 2010 County Health Rankings, a
collection of 50 reports that reflect the overall health of
counties in every state across the country. For the first
time, counties can get a snapshot of how healthy their
residents are by comparing their overall health and the
factors that influence their health, with other counties in
their state. This will allow them to see county-to-county
where they are doing well and where they need to
improve. Everyone has a stake in community health. We
all need to work together to find solutions. The County
Health Rankings serve as both a call to action and a
needed tool in this effort.
All of the County Health Rankings are based upon this
model of population health improvement:
In this model, health outcomes are measures that
describe the current health status of a county. These
health outcomes are influenced by a set of health factors.
These health factors and their outcomes may also be
affected by community-based programs and policies
designed to alter their distribution in the community.
Counties can improve health outcomes by addressing all
health factors with effective, evidence-based programs
and policies.
Institute of Medicine, 2002
To compile the Rankings, we built on our prior work in
Wisconsin, worked closely with staff from the Centers for
Disease Control and Prevention and Dartmouth College,
and obtained input from a team of expert advisors.
Together we selected a number of population health
measures based on scientific relevance, importance, and
availability of data at the county level. For a more
detailed explanation of the choice of measures, see
www.countyhealthrankings.org.

County Health Rankings: 2010 Massachusetts
2 www.countyhealthrankings.org/massachusetts
The Rankings
This report ranks Massachusetts counties according to
their summary measures of health outcomes and
health factors, as well as the components used to
create each summary measure. The figure below depicts
the structure of the Rankings model. Counties receive a
rank for each population health component; those having
high ranks (e.g., 1 or 2) are estimated to be the
“healthiest.”
Our summary health outcomes rankings are based on
an equal weighting of mortality and morbidity measures.
The summary health factors rankings are based on
weighted scores of four types of factors: behavioral,
clinical, social and economic, and environmental. The
weights for the factors (shown in parentheses in the
figure) are based upon a review of the literature and
expert input but represent just one way of combining
these factors.

County Health Rankings: 2010 Massachusetts
www.countyhealthrankings.org/massachusetts 3
The maps on this page display Massachusetts’s counties
divided into groups by health rank. The lighter colors
indicate better performance in the respective summary
rankings. The green map shows the distribution of
summary health outcomes. The blue displays the
distribution of the summary rank for health factors.
Maps help locate the healthiest and least healthy
counties in the state. The health factors map appears
similar to the health outcomes map, showing how health
factors and health outcomes are closely related.
HEALTH OUTCOMES
HEALTH FACTORS
County Health Rankings: 2010 Massachusetts
4 www.countyhealthrankings.org/massachusetts
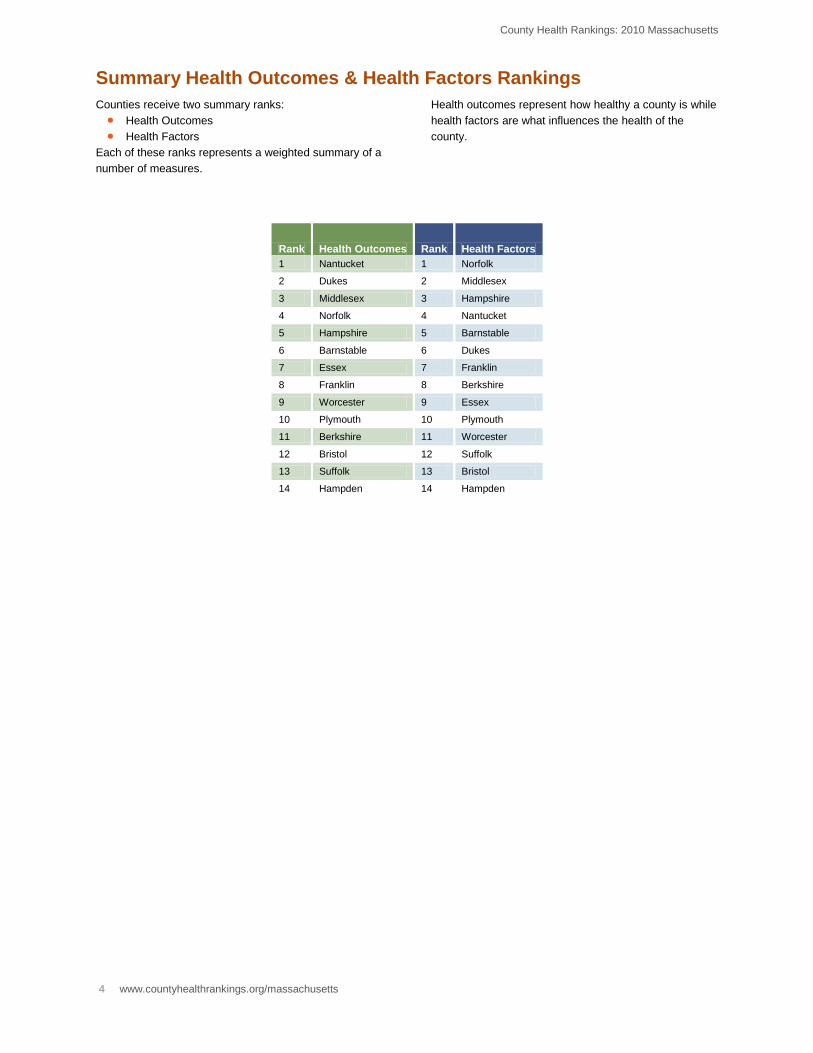
Summary Health Outcomes & Health Factors Rankings
Counties receive two summary ranks:
Health Outcomes
Health Factors
Each of these ranks represents a weighted summary of a
number of measures.
Health outcomes represent how healthy a county is while
health factors are what influences the health of the
county.
Rank Health Outcomes Rank Health Factors
1 Nantucket 1 Norfolk
2 Dukes 2 Middlesex
3 Middlesex 3 Hampshire
4 Norfolk 4 Nantucket
5 Hampshire 5 Barnstable
6 Barnstable 6 Dukes
7 Essex 7 Franklin
8 Franklin 8 Berkshire
9 Worcester 9 Essex
10 Plymouth 10 Plymouth
11 Berkshire 11 Worcester
12 Bristol 12 Suffolk
13 Suffolk 13 Bristol
14 Hampden 14 Hampden
County Health Rankings: 2010 Massachusetts
www.countyhealthrankings.org/massachusetts 5
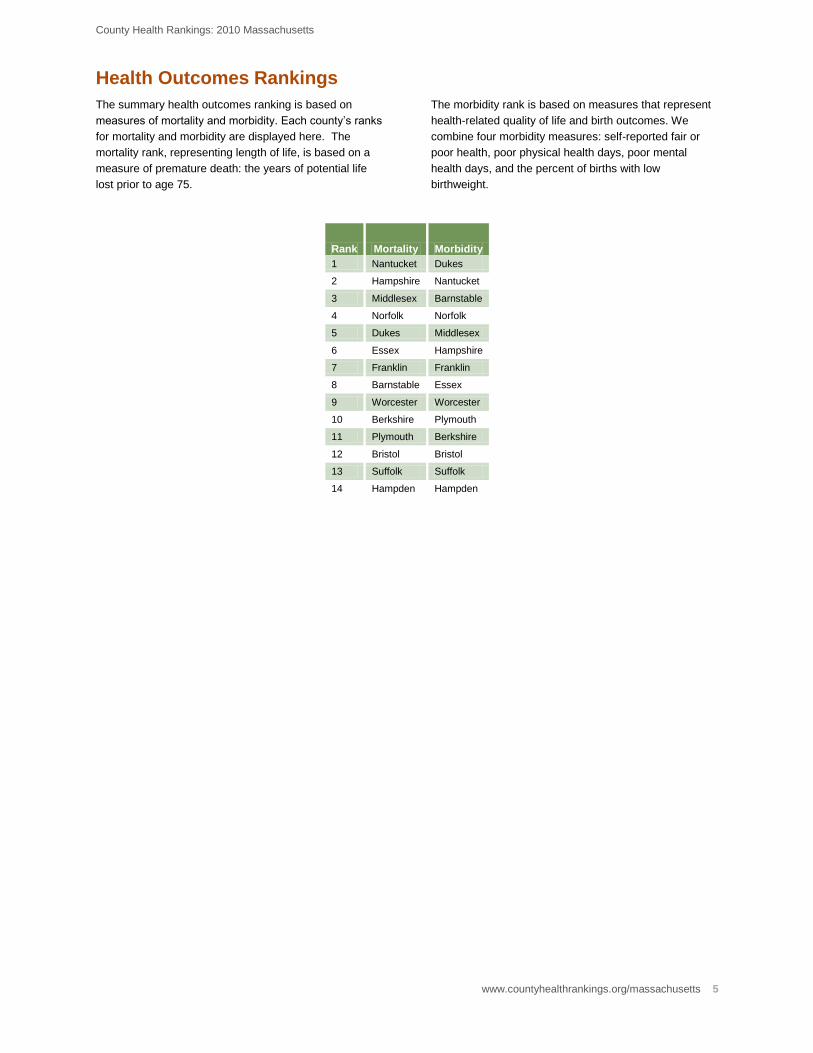
Health Outcomes Rankings
The summary health outcomes ranking is based on
measures of mortality and morbidity. Each county’s ranks
for mortality and morbidity are displayed here. The
mortality rank, representing length of life, is based on a
measure of premature death: the years of potential life
lost prior to age 75.
The morbidity rank is based on measures that represent
health-related quality of life and birth outcomes. We
combine four morbidity measures: self-reported fair or
poor health, poor physical health days, poor mental
health days, and the percent of births with low
birthweight.
Rank Mortality Morbidity
1 Nantucket Dukes
2 Hampshire Nantucket
3 Middlesex Barnstable
4 Norfolk Norfolk
5 Dukes Middlesex
6 Essex Hampshire
7 Franklin Franklin
8 Barnstable Essex
9 Worcester Worcester
10 Berkshire Plymouth
11 Plymouth Berkshire
12 Bristol Bristol
13 Suffolk Suffolk
14 Hampden Hampden

County Health Rankings: 2010 Massachusetts
6 www.countyhealthrankings.org/massachusetts
Health Factors Rankings
The summary health factors ranking is based on four
factors: health behaviors, clinical care, social and
economic, and physical environment factors. In turn,
each of these factors is based on several measures.
Health behaviors include measures of smoking, diet and
exercise, alcohol use, and risky sex behavior. Clinical
care includes measures of access to care and quality of
care. Social and economic factors include measures of
education, employment, income, family and social
support, and community safety. The physical
environment includes measures of environmental quality
and the built environment.
Rank Health Behaviors Clinical Care Social & Economic Factors Physical Environment
1 Norfolk Berkshire Nantucket Bristol
2 Dukes Barnstable Middlesex Plymouth
3 Middlesex Hampshire Norfolk Middlesex
4 Barnstable Norfolk Hampshire Franklin
5 Hampshire Franklin Barnstable Worcester
6 Nantucket Middlesex Dukes Norfolk
7 Franklin Essex Plymouth Essex
8 Essex Suffolk Franklin Hampshire
9 Plymouth Hampden Worcester Dukes
10 Suffolk Worcester Essex Nantucket
11 Berkshire Plymouth Berkshire Hampden
12 Worcester Bristol Bristol Berkshire
13 Hampden Dukes Suffolk Suffolk
14 Bristol Nantucket Hampden Barnstable
County Health Rankings: 2010 Massachusetts
www.countyhealthrankings.org/massachusetts 7
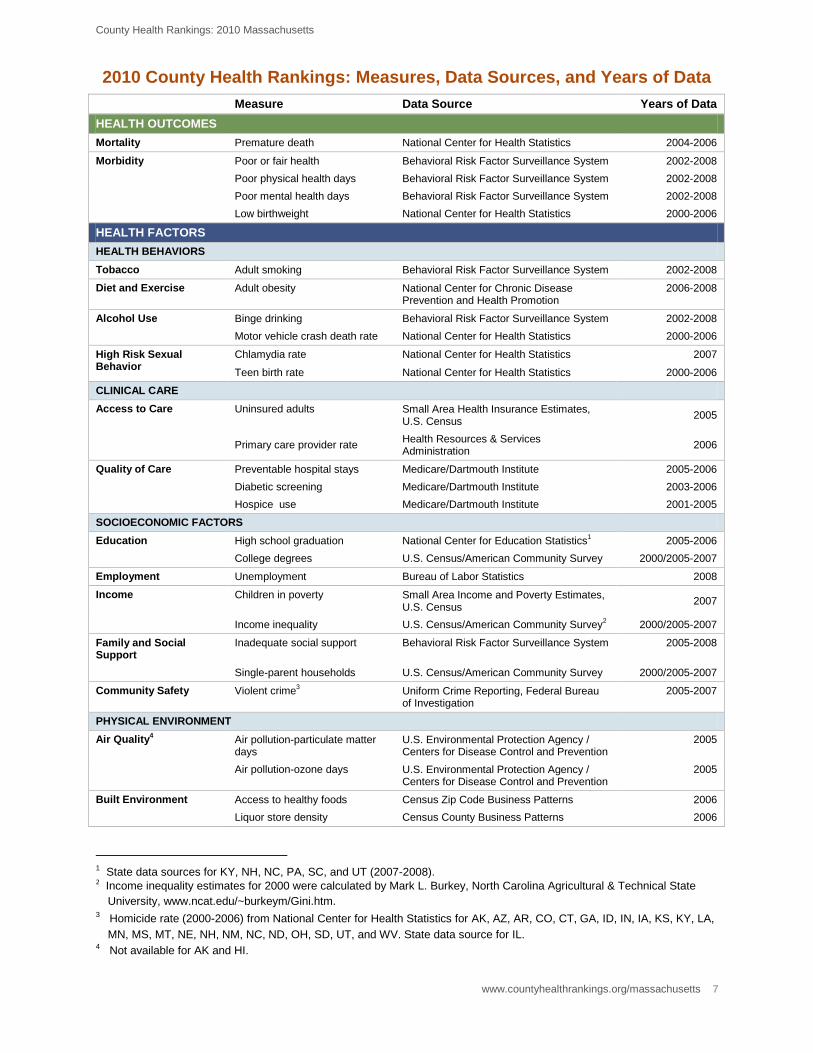
2010 County Health Rankings: Measures, Data Sources, and Years of Data
Measure Data Source Years of Data
HEALTH OUTCOMES
Mortality Premature death National Center for Health Statistics 2004-2006
Morbidity Poor or fair health Behavioral Risk Factor Surveillance System 2002-2008
Poor physical health days Behavioral Risk Factor Surveillance System 2002-2008
Poor mental health days Behavioral Risk Factor Surveillance System 2002-2008
Low birthweight National Center for Health Statistics 2000-2006
HEALTH FACTORS
HEALTH BEHAVIORS
Tobacco Adult smoking Behavioral Risk Factor Surveillance System 2002-2008
Diet and Exercise Adult obesity National Center for Chronic Disease Prevention and Health Promotion
2006-2008
Alcohol Use Binge drinking Behavioral Risk Factor Surveillance System 2002-2008
Motor vehicle crash death rate National Center for Health Statistics 2000-2006
High Risk Sexual Behavior
Chlamydia rate National Center for Health Statistics 2007
Teen birth rate National Center for Health Statistics 2000-2006
CLINICAL CARE
Access to Care Uninsured adults Small Area Health Insurance Estimates, U.S. Census
2005
Primary care provider rate
Health Resources & Services Administration
2006
Quality of Care Preventable hospital stays Medicare/Dartmouth Institute 2005-2006
Diabetic screening Medicare/Dartmouth Institute 2003-2006
Hospice use Medicare/Dartmouth Institute 2001-2005
SOCIOECONOMIC FACTORS
Education High school graduation National Center for Education Statistics1 2005-2006
College degrees U.S. Census/American Community Survey 2000/2005-2007
Employment Unemployment Bureau of Labor Statistics 2008
Income Children in poverty Small Area Income and Poverty Estimates, U.S. Census
2007
Income inequality U.S. Census/American Community Survey2 2000/2005-2007
Family and Social Support
Inadequate social support Behavioral Risk Factor Surveillance System 2005-2008
Single-parent households U.S. Census/American Community Survey 2000/2005-2007
Community Safety Violent crime3 Uniform Crime Reporting, Federal Bureau
of Investigation 2005-2007
PHYSICAL ENVIRONMENT
Air Quality4 Air pollution-particulate matter
days U.S. Environmental Protection Agency / Centers for Disease Control and Prevention
2005
Air pollution-ozone days U.S. Environmental Protection Agency / Centers for Disease Control and Prevention
2005
Built Environment Access to healthy foods Census Zip Code Business Patterns 2006
Liquor store density Census County Business Patterns 2006
1 State data sources for KY, NH, NC, PA, SC, and UT (2007-2008). 2 Income inequality estimates for 2000 were calculated by Mark L. Burkey, North Carolina Agricultural & Technical State
University, www.ncat.edu/~burkeym/Gini.htm. 3 Homicide rate (2000-2006) from National Center for Health Statistics for AK, AZ, AR, CO, CT, GA, ID, IN, IA, KS, KY, LA,
MN, MS, MT, NE, NH, NM, NC, ND, OH, SD, UT, and WV. State data source for IL. 4 Not available for AK and HI.

County Health Rankings: 2010 Massachusetts
8 www.countyhealthrankings.org/massachusetts
CREDITS
Report Editors University of Wisconsin-Madison School of Medicine and Public Health Population Health Institute Bridget Booske, PhD, MHSA Jessica Athens, MS Patrick Remington, MD, MPH
This publication would not have been possible without the following contributions: Conceptual Development David Kindig, MD, PhD Paul Peppard, PhD Patrick Remington, MD, MPH Technical Advisors Amy Bernstein, ScD, Centers for Disease Control and Prevention Michele Bohm, MPH, Centers for Disease Control and Prevention Vickie Boothe, MPH, Centers for Disease Control and Prevention Ethan Burke, MD, MPH, Dartmouth Institute for Health Policy and Clinical Practice Research Assistance Clare O’Connor Karen Odegaard Hyojun Park Matthew Rodock
Production and Editing Chuck Alexander Alex Field Joan Fischer Irene Golembiewski Jennifer Robinson
Design Forum One, Alexandria, VA Media Solutions, UW School of Medicine and Public Health Metrics Advisory Group Yukiko Asada, PhD, Associate Professor, Community Health and Epidemiology, Dalhousie University, Halifax, Nova Scotia Tom Eckstein, MBA, Principal, Arundel Street Consulting Inc, St. Paul, MN Elliott Fisher, MD, MPH, Director, Center for Population Health, Dartmouth Institute for Health Policy and Clinical Practice, and
Professor of Medicine and Community and Family Medicine, Dartmouth Medical School, Lebanon, NH Howard Frumkin, MD, MPH, Dr. PH, Director of the National Center for Environmental Health, ATSDR, CDC, Atlanta, GA Thomas Kottke, MD, MSPH, Medical Director for Evidence-Based Health, HealthPartners, Minneapolis, MN Ali Mokdad, PhD, Professor of Global Health, Institute for Health Metrics and Evaluation, University of Washington, Seattle, WA Roy Gibson Parrish, MD, Consultant in Population Health Information Systems, Peacham, VT Robert M. (Bobby) Pestronk, MPH, Executive Director, National Association of County and City Health Officials (NACCHO),
Washington, DC Tom Ricketts, PhD, Professor of Health Policy and Administration, University of North Carolina Steven Teutsch, MD, MPH, Chief Science Officer, Los Angeles County Public Health, Los Angeles, CA Julie Willems Van Dijk, PhD, RN, former Marathon County, WI Health Officer
Suggested citation: University of Wisconsin Population Health Institute. County Health Rankings 2010.

University of Wisconsin Population Health Institute
610 Walnut St, #524, Madison, WI 53726
(608) 265-6370 / [email protected]
Top Related