![2014 Minerals Yearbook · 2014 Minerals Yearbook U.S. Department of the Interior U.S. Geological Survey IRON ORE [ADVANCE RELEASE] April 2017. Iron ore—2014 [ADVAnCe reLeASe] 39.1](https://static.fdocuments.us/doc/165x107/5c3b7e2293f3c37a7704c6f0/2014-minerals-yearbook-2014-minerals-yearbook-us-department-of-the-interior.jpg)


Languages
Pages
Legal


August 2011
2009 Minerals Yearbook
U.S. Department of the InteriorU.S. Geological Survey
CEMENT

CEMENT—2009 16.1
CEMENTBy Hendrik G. van Oss
Domestic survey tables were prepared by Michelle B. Blackwell, statistical assistant, and the world production table was prepared by Glenn J. Wallace, international data coordinator.
Combined production of portland and masonry cement in the United States in 2009 was 63.9 million metric tons (Mt). This was a 25.9% decline from production in 2008, a 35.6% decrease from the record output in 2005 (table 1), and the lowest level of output since 1983. Consumption of portland and masonry cement as measured by sales to domestic fi nal customers decreased in 2009 by 26.7% to 71.0 Mt (table 9), also the lowest level since 1983 and nearly 57 Mt or 44.5% lower than the 2005 record. In contrast, the decline in sales prices (mill net valuation basis) in 2009 was comparatively modest (tables 1, 11–13). Overall, the value of cement sales totaled $7.0 billion, down by about 30% from that of 2008. Based on typical portland cement mixing ratios in concrete, the delivered value of concrete (excluding mortar) in the United States was estimated to be at least $47 billion in 2009.
Percentage or other changes expressed in this report compare activity in 2009 with that of 2008 unless specifi ed otherwise. Except where otherwise indicated, activity levels in this report exclude those in Puerto Rico. Cements covered in this report are mainly limited to those hydraulic varieties broadly classifi ed as portland cement (including blended cement and other varieties listed in table 15) and (or) masonry cement (including portland-lime and plastic cements); these are the binding agents in concrete and most mortars. A few other types of hydraulic cements and (or) clinker (notably aluminous cement) are included in some of the trade data (tables 16–18 and 21) and within the world production data (table 22). Except where incorporated as components within fi nished portland (blended) or masonry cements, this report’s tables exclude supplementary cementitious materials (SCM), such as fl y ash, other pozzolans, and ground granulated blast furnace slag (GGBFS). Sales data for blended (also called composite) cements listed separately from portland cement are available in the monthly Mineral Industry Surveys reports of the U.S. Geological Survey (USGS).
The bulk of this report is based on data compiled from USGS annual questionnaires sent to cement and clinker manufacturing plants and associated distribution facilities and import terminals, and some terminals that are independent of U.S. cement manufacturers. For 2009, questionnaires were received from 152 of 156 facilities canvassed, a response rate of 97%, which included all of the production sites. For 2008, questionnaires were received from 149 of 152 facilities canvassed, a response rate of 98%, including all of the production sites. If missing data could not be obtained by followup telephone inquiries, they were estimated based on monthly data or past annual reporting. For both years, the data exclude several importers that have yet to participate in the surveys. To the degree that they are independent of the participating companies, sales by the missing importers for 2008 and 2009 are estimated to be equivalent to an additional 1% of the total portland cement sales tonnages
shown in this report. Background information on cement and its manufacture and on the USGS cement canvasses can be found in van Oss (2005).
Government Programs and Environmental Issues
A number of ongoing Government programs provide funding and direction for public sector construction and were thus of importance to cement consumption levels. In 2009, stimulus program spending allotments, including those related to the American Recovery and Reinvestment Act (ARRA) of 2009, were being compared to individual State spending of the appropriated monies as a means to predict increases in cement demand. By late 2009, it was evident that very little of the stimulus spending during the year had been for cement (concrete) but it was anticipated that the concrete industry would signifi cantly benefi t from ARRA funding in 2010 (Sullivan, 2010).
Environmental issues associated with the cement industry mostly result from the manufacture of the intermediate product called clinker. In clinker manufacture, the burning of large amounts of raw materials and fuels leads to signifi cant emissions of carbon dioxide (CO2), and can yield signifi cant emissions of nitrogen oxides (NOx), sulfur oxides (SOx), mercury and some other metals, volatile organic carbon compounds, and particulates. Increasingly, these emissions are regulated or are being considered for regulation or reregulation. The largest volume emissions are of CO2; the cement industry is one of the leading industrial emitters of this greenhouse gas (GHG). Overall, generation of CO2 by the U.S. cement industry in 2009 was calculated to be in the range of 0.87 to 0.92 metric ton (t) of CO2 per ton of clinker produced; the high end incorporates fuel combustion emissions calculated using “standard” heat values for the fuels consumed (table 7), and the low end incorporates heat values actually reported by the individual plants. Both ratios include a standard emissions factor from calcination of limestone of 0.51 t of CO2 per ton of clinker as detailed by the Intergovernmental Panel on Climate Change (Hanle and others, 2006), but exclude any correction for cement kiln dust (CKD) not recycled to the kiln (for which data are lacking). However, the standard calcination component of CO2 emissions can be reduced in the calculation in proportion to the calcium oxide contributed by noncarbonate alternative raw materials such as ferrous slags and coal combustion ashes. This incorporation would allow a reduction of calcination-related emissions of about 2.4% (0.7 Mt of CO2) in 2009 and 2.7% (nearly 1.1 Mt of CO2) in 2008; relative reductions can be signifi cantly larger for the subset of individual plants that actually burn these alternative raw materials. Certain fuels, including alternative or waste fuels, can either directly reduce plant-level CO2 emissions or may lead to reductions in reported

16.2 U.S. GEOLOGICAL SURVEY MINERALS YEARBOOK—2009
emissions from combustion because the fuels are considered to be carbon-neutral (certain biofuels) or because credits may be allowed for their use (certain waste fuels). Plant-level emissions can be reduced through upgrading to more fuel-effi cient kiln line technology. Unit emissions can also be reduced by use of SCM in fi nished cement and in concrete to reduce the clinker content of these products and (or) by allowing the addition of “inert” fi llers to boost cement output without simultaneously boosting clinker output.
In past years, the U.S. Environmental Protection Agency (EPA) used methods similar to those used above to calculate and report overall U.S. levels of GHG emissions by various industries; for cement, these methods made use of national-level clinker production data published by the USGS. However, to more accurately determine U.S. emissions of GHG, in October, the EPA released a fi nal rule for mandatory site/plant-specifi c reporting of GHG emissions (to begin in 2010) (U.S. Environmental Protection Agency, 2009b). For the cement industry’s CO2 emissions, relevant calculation procedures for fuel combustion are covered under Part 98, subpart C (p. 56397–56411) and, for calcination and related process emissions, in subpart H (p. 56420–56422).
In May, the EPA proposed new, very low, limits on individual plant emissions of mercury, total hydrocarbons, particulate matter, and hydrochloric acid within a set of national emissions standards for hazardous air pollutants (NESHAP) for the U.S. cement industry (U.S. Environmental Protection Agency, 2009a). It was unclear how many U.S. cement plants would be able to comply with the new NESHAP limits for all four listed pollutants. The new standards for mercury were set so stringent (for existing plants, 43 pounds of mercury per million short tons of clinker produced; and for new plants, 14 pounds of mercury per million short tons of clinker produced) as to possibly preclude, absent the installation of mercury scrubbers, which could be very expensive, the use at many plants of their normal raw materials and of coal as a fuel. The NESHAP could end the use of fl y ash as an alternative raw material for clinker manufacture; fl y ash commonly has a high mercury content and this content was expected to increase as coal-fi red powerplants installed their own scrubbers. The mercury-scrubbing technology most commonly discussed makes use of activated carbon, and this mercury-laden carbon (at a powerplant) would report to the fl y ash. A discussion of the cement NESHAP is provided by O’Hare (2009).
The EPA was evaluating changing the regulatory classifi cation of coal combustion byproducts, particularly fl y ash, under conditions of long-term or permanent storage (disposal) and for various usage purposes. Concern in the construction sector was that if fl y ash were to be reclassifi ed as a hazardous waste, even under restricted circumstances, the material would be stigmatized and demand for it would decrease or cease altogether (Goss, 2010).
Production
Continued declining sales of cement, together with an apparent drawdown of cement stockpiles, and despite a major decline in cement imports, led to a 25.6% decrease in portland cement production in 2009 to just 62.0 Mt (table 3). This was
the lowest production since 1983 and was nearly 32 Mt less than the record output in 2005. Production fell in all districts except Indiana. Yearend stocks of portland cement fell by 28%. Owing to two plants coming online during the year (Florida and Missouri) and of some new mills at existing plants, overall grinding capacity increased by about 6%. The capacities and plant counts listed in table 3 for 2009 are, however, somewhat uncertain because of diffi culties differentiating between plants reported as “idle” (or “indefi nitely idle”) and those that were permanently “closed.” At least in terms of sales, some such plants continued to operate as distribution terminals. Likewise, plants that closed their kilns in late 2008 may have continued to grind remaining clinker stocks until they were exhausted in early 2009 after which the fi nish mills were closed as well. The USGS policy has been to count as active all plants having production for at least 1 day during the year, but this policy may not be realistic for plants idle all year and which offered few prospects of ever reopening. Thus, in a few locations, a decision was made for the 2009 tally to exclude plants that were “idle” throughout 2009–10 and for which a formal closure announcement was made in 2010. In one district, an ultimately closed plant was retained in the 2009 count because it made a small quantity of masonry cement early in the year, thus still having active grinding capacity. Another plant, seemingly closed, retained the possibility of restarting its fi nish mill. One plant in Florida that had been announced as closed in late 2008 was retained in the 2009 count despite no production during the year because its status was confi rmed as idled, rather than closed.
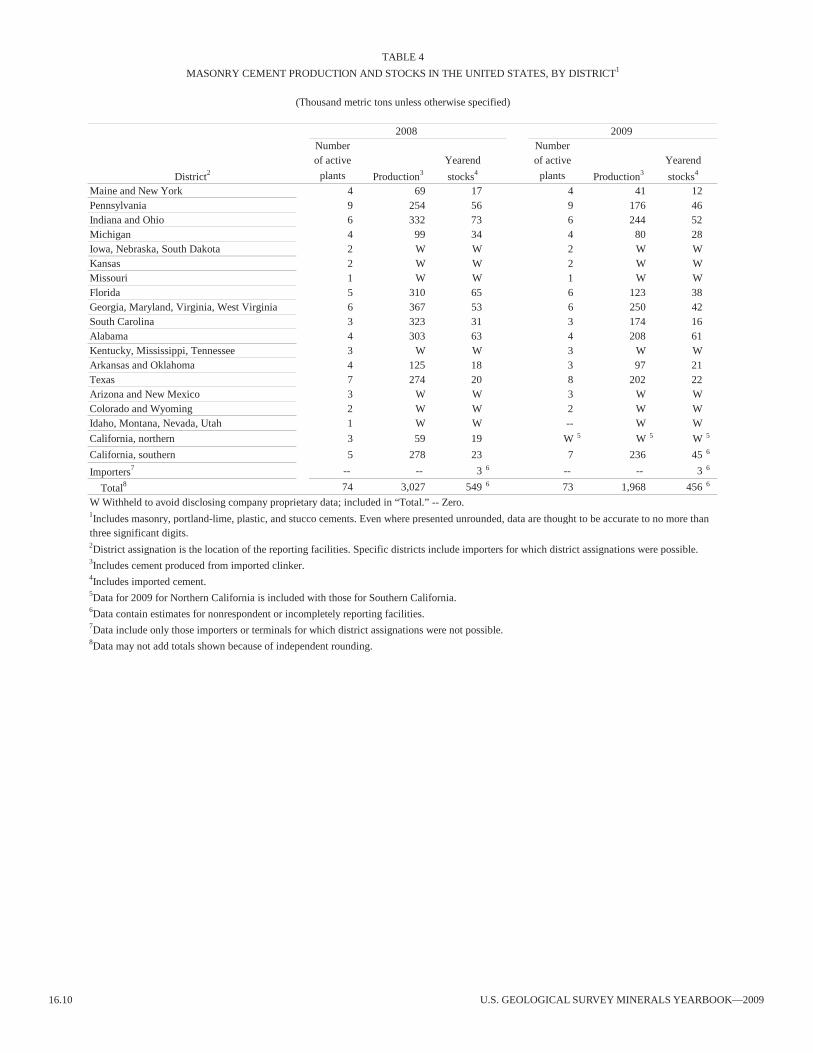
For masonry cement, a stagnant housing construction sector during the year led to a decline in cement production of 35% to just 2.0 Mt, the lowest level since at least 1954.
With common parents combined under the larger subsidiary’s name and with joint ventures apportioned, the 10 leading companies at yearend 2009, in descending order of portland cement production, were Holcim (US) Inc., CEMEX, Inc., Lafarge North America Inc., Lehigh Cement Co., Buzzi Unicem USA Inc. (including Alamo Cement Co.), Ash Grove Cement Co., Texas Industries, Inc. (TXI), Essroc Cement Corp., CalPortland Co., and St. Marys Cement Inc. The listing was unchanged from that of 2008. The U.S. industry continued to be heavily consolidated—the leading 5 cement companies, combined, contributed 59% of total U.S. portland cement production, and the leading 10 companies accounted for 81% of total production. Of the above named companies, all except Ash Grove and TXI were foreign owned as of yearend, and for the industry overall, about 77% of total cement output was by foreign-owned companies.
Clinker output in 2009 fell by 28.4% to 56.1 Mt (tables 1, 5). This was the lowest level since 1982. Production fell in all months, and for the year overall in all districts. Owing to a new plant coming online, the commencement of production from a plant that was completed at yearend 2008, and upgrades at some existing plants, apparent annual capacity increased by 6.5%; this was despite the removal in the 2009 total of plants or kilns closed during 2008. Utilization of clinker production capacity was only about 49% in 2009, well down from the 73% of the previous year and the presumed “full practicable” capacity utilization of 85% or more experienced during years
CEMENT—2009 16.3
of high cement sales volumes. The performance in 2009 refl ected a combination of permanent kiln or plant closures and long-term idling of “extra” kilns at multikiln plants. However, the utilization statistic is dependent on the reported downtime for routine maintenance. Many plants reported much longer than normal downtimes for this purpose in 2009; where this was obvious, corrections were made after consultation with the plants to remove the extra downtime (a result of slow sales) from the statistic. Yearend clinker stockpiles decreased by nearly 30%, likely refl ecting yet more kiln idlings late in the year.
Nonfuel raw materials consumed to make clinker and cement are listed in table 6. Ratios among clinker raw materials consumed in 2009 appear to be broadly similar to those in 2008. For fl y ash and bottom ash, the data are similar to those published by the American Coal Ash Association (ACAA) for sales for use in making clinker and cement (combined), namely 2.210 Mt of fl y ash and 0.654 Mt of bottom ash (American Coal Ash Association, 2010; Goss, 2010). The ACAA also noted sales of 0.382 Mt of synthetic gypsum to the cement industry; this is less than the 0.47 Mt or more of this material included within the “Gypsum and anhydrite” data in table 6, but could refl ect the fact that the ACAA does not survey the cement plants’ own manufacture of this material.
Data on fuel consumption by the cement industry are listed in table 7. Data shifts can refl ect activities at just a few plants. In terms of overall mass ratios among fuels in total and relative to clinker production, signifi cant changes in 2009 were evident for several fuels but in part refl ected closure and full-year idling of several wet kilns and some less effi cient long dry kilns during the year. A much smaller percentage of clinker was contributed by wet kilns in 2009, for example. The signifi cant increase in the consumption of natural gas refl ects a combination of the incorporation of large amounts of landfi ll gas at two plants, and a shift from gas as a warm up fuel to a major use fuel reported at two facilities. Some of the other apparent shifts refl ect upgrades, including conversions from wet to dry kiln technology at some plants.
Although not revealed in table 7, overall heat consumption (gross heat basis) in 2009 was about 3.9 billion joules (GJ) per metric ton of clinker, down by about 9% from that in 2008. The reduction refl ected the closure or idling of wet kilns and less effi cient dry kilns during the year. Heat energy consumption at the remaining operational wet kilns averaged 6.0 GJ per ton of clinker, down by nearly 8%. Dry kilns averaged 3.6 GJ per ton of clinker, down by 10%. Thus, effi ciency apparently improved despite much longer and perhaps more frequent than normal total downtimes (for all reasons) on the operational kilns. It is possible that further reductions in unit energy consumption will be realized if and when the industry resumes more normal operating schedules. As in past years, coal supplied the largest share of the heat consumed (60%, down by about 7%), followed by petroleum coke (about 21%, unchanged), and waste fuels (13%, up by 22%). As noted above, natural gas, including landfi ll gas, use increased markedly; it contributed about 5% of total heat in 2009, up by 74%.
The average unit electricity consumption increased again in 2009 (table 8); this most likely refl ects operational disruptions (idlings and closures, repairs, plant upgrades) at many plants,
and a greater reliance on dry plants. Dry plants, commonly, have higher unit electricity consumption than do wet plants.
There were no signifi cant ownership changes in the U.S. cement industry in 2009. Two new plants were brought into production during the year. American Cement Co., LLC began operations early in the year at its 1.0-million-metric-ton-per-year (Mt/yr) plant at Sumterville, FL; plant construction had been completed at yearend 2008. Initial cement production was from purchased clinker, but the plant started its own clinker production in May. American Cement was a joint venture between Oldcastle Materials, Inc. and New Jersey-based Trap Rock Industries, Inc. In July, Holcim fi red the 4.0-Mt/yr precalciner kiln at its new plant in St. Genevieve County, MO; this kiln was said to have the largest annual capacity of any in the world and was expected, at full output levels, to put Missouri at or near the forefront of U.S. clinker production.
The litany of plant closures and long-term or indefi nite idlings of plants that began in 2008 continued in 2009, although many of the facilities continued to operate as storage, packaging, and transshipment terminals for cement sourced elsewhere. At the end of January, Ash Grove indefi nitely idled the wet kilns at its Inkom, ID, plant, but the facility continued to produce cement from clinker stockpiles and from clinker brought in from another Ash Grove plant. CalPortland idled the long dry kilns at its Colton, CA, plant during the course of the year but continued to make cement from clinker brought in from the company’s Mojave, CA, facility. CEMEX confi rmed that its Brooksville “North” plant in Florida was on indefi nite idle status in 2009, and had not been closed as had been reported in 2008. Essroc closed the wet kilns at its Bessemer, PA, plant at the end of April and shut the fi nish mill there at the end of September. At the end of April, Holcim shut its wet plants at Dundee, MI, and Clarksville, MO; the Clarksville plant’s kiln was the longest in the world. At the same time, the company indefi nitely idled its wet plant at Artesia, MS, and in September, indefi nitely idled its dry plant at Mason City, IA. In addition to these plant closures and (or) indefi nite idlings, many multikiln plants had one or more kilns idle for all or part of the year.
Major kiln line upgrades were completed at three cement plants in 2009. In August, Buzzi Unicem fi red the new 1.2 Mt/yr precalciner kiln at its River (also known as the Festus or Selma plant), at Festus, MO; the new kiln replaced the existing pair of long dry kilns (Buzzi Unicem, 2009). Also in November, Keystone Cement Co. fi red its new precalciner kiln line at Bath, PA; the new 1.2-Mt/yr line replaced the plant’s pair of wet kilns, which were shut down at the same time. In August, Essroc closed the three wet kilns at its Martinsburg, WV, plant and in November fi red the plant’s new 2.0-Mt/yr precalciner kiln that had been under construction.
Some ongoing upgrade projects were cancelled or postponed in light of poor cement sales. An example was the January announcement by TXI that it was postponing further work on the expansion project at its cement plant at Hunter, TX (Texas Industries, 2009); the project was expected to resume once market conditions improved.

16.4 U.S. GEOLOGICAL SURVEY MINERALS YEARBOOK—2009
Consumption
Cement consumption data for the United States were surveyed and reported monthly by the USGS in terms of sales to fi nal customers and are summarized in table 9. Although the national sales totals in table 9 are similar to the shipments totals in tables 11, 12, and 14, only the table 9 breakout tonnages represent State-level consumption. The regional breakouts in tables 11, 12, and 14 simply pertain to the locations of the reporting entities (chiefl y the production sites), not the locations of consumption. It is very common for shipments to cross State lines.
The U.S. cement market in 2009 continued a decline that began in early to mid-2006; this refl ected ongoing stagnation in several construction sectors, particularly in housing, a tight loan market, and continued declines in State property tax revenues. Decreases in sales of cement were experienced in all months during the year. Total sales of portland cement to domestic fi nal customers fell by 26.5% to 68.9 Mt, the lowest level since 1983. Sales declined in all districts; those into the three traditionally leading consuming States (California, Florida, and Texas) were down by about 32% in 2009. Although sensitive to the accuracy of the population data, per capita consumption of portland cement was just 220 kg in 2009, the lowest level since 1947; the amount in 2008 was 413 kg. Masonry cement consumption decreased by 31.0% to 2.1 Mt, the lowest level since 1949.
Sales by some importers that did not participate in the USGS monthly and annual surveys were not included in the portland cement consumption data in this report. An estimate of these missing importers’ sales can be made by comparing offi cial (U.S. Census Bureau) trade data (tables 17, 21) with the import origins of sales (table 9). The offi cial cement imports were about 0.3 Mt higher than the foreign origin tonnages in 2009 and 1.5 Mt higher than those in 2008; however, the discrepancy in 2009 appears to be too small based on known missing data for cement from the Republic of Korea into the Philadelphia, PA, customs district (0.139 Mt), and of much of the material from Colombia into the Houston, TX, and Wilmington, NC, districts (0.369 Mt). It appears that part of the reason for the difference in 2009 is that the table 9 import origins of sales data include a large component of drawdown of stocks, as suggested by the large yearend stockpile decline for importers listed in table 3. Adjusting for both years for cement varieties that are in the trade tables but not covered by the USGS canvasses (chiefl y aluminous cement) and for apparent drawdown of stocks, which cannot fully distinguish between imported and domestic cement, it becomes evident that the annual tables are missing about 0.5 Mt of cement sales in 2009 and about 1 Mt in 2008.
As the binder in concrete, cement consumption levels within a given category of construction will broadly refl ect levels of construction spending, although signifi cant time lags may exist between the onset or cutoff of spending and changes in the consumption of cement. In terms of 1996 constant dollars, overall construction spending in 2009 fell by 15% to $552 billion (Portland Cement Association, 2011). Within this spending, public sector construction was the largest share, at $184 billion, down by 0.8% only. Residential construction, which had been the dominant sector in 2008, fell in 2009 by 25% to $168 billion. Nonresidential construction spending was $133 billion, down by 21%.
Portland cement sales broken out by customer type are listed in table 14. Sales to ready-mixed concrete producers accounted for about 71% of total shipments, but the true tonnage for this type of concrete was larger because some of it was recorded under other customer categories, such as road paving contractors. As listed, the sales to ready-mixed customers declined by 27%, in line with the decrease in overall portland cement sales. The decline in residential construction spending noted above is in line with the 34% decline in sales tonnages of cement for brick and block; and the decline in nonresidential private and public sector spending noted is in line with reduced sales of cement for precast–prestressed concrete products (down by 28%), and for road paving (down by 22%). Sales of cement for oil well and gas well drilling fell by 45%, in line with sharply reduced oil and gas prices and drilling activities in 2009.
Sales of different types of portland cement are broken out in table 15. As in past years, sales were dominated by Types I and II cements and sulfate-resistant varieties of cement (Type V and Type II/V hybrids reported as Type V). Sales of these cements fell more or less proportionately to overall portland cement sales. Oil well cement sales fell by 42%, a result similar to that in table 14 noted above. White cement sales fell by 30%. As in past years, the white cement sales tonnage was signifi cantly less than the imports of white cement (table 20) and would seemingly preclude any need for domestic production of the material. The discrepancy is partly explained by the use of some imported white cement for masonry cement (sales not included in table 15), and by the fact that some imported white cement is blended with domestically produced white cement.
Blended cement sales in table 15 fell by about 34% to 1.3 Mt, but this tonnage is signifi cantly less than the blended cement sales reported for 2009 in the monthly reports of the USGS (1.6 Mt). It is unclear why this difference exists, except that there could be inconsistent reporting between the monthly and annual surveys of cement sold under the general performance standard ASTM C–1157, which at one time applied only to blended cements but which now applies to hydraulic cements in general.
Data on the mill net values for shipments to fi nal customers by plants and import terminals (terminal nets) are provided in tables 11 to 13. Despite the large drop in sales tonnages, unit prices for portland and masonry cement declined relatively modestly.
Foreign Trade
Trade data from the U.S. Census Bureau are presented in tables 16–21. Although at the highest tonnage level since 1948, exports of cement and clinker continued to be small compared with imports. Canada remained by far the dominant destination of the exports, taking about 76% of the total in 2009.
Total imports of cement and clinker in 2009 fell by 40.5% to 6.8 Mt (table 17), the lowest total since 1992 and a decline of 28.8 Mt from the record level of 2006. The dominant share of imports was gray portland cement, imports of which fell by nearly 44% to 5.4 Mt (table 19). Canada continued to be the dominant source of U.S. imports. The tonnage of portland cement imported from Canada in 2009 fell by nearly 20%, but this was a small relative decline compared with those of most other countries. The relative regional sourcing of imports has

CEMENT—2009 16.5
changed dramatically in recent years. For example, Canada’s share of the U.S. cement and clinker import market was 50% in 2009, much higher than the 14% share it held in 2006. By comparison, Asia, which had accounted for 19.5 Mt or 54% of total imports in 2006, supplied just 1.8 Mt or 26% of the imports in 2009. China alone supplied nearly 30% of total U.S. imports in 2006 but accounted for only 9% of the imports in 2009.
Offi cial imports of clinker fell by 10.5% to 0.56 Mt (table 21). The clinker data are incomplete, however, with regard to overland imports from Canada; the tonnages listed are insuffi cient to have fully supplied the grinding plants in Michigan and Washington, all of which imported their clinker from Canada. The unreported Canadian clinker appeared mostly to be coming in by truck, at a value of less than $2,000 (customs value) per truckload; such shipments are classifi ed as “informal entries” and data on them are not routinely transmitted by the U.S. Customs Service to the U.S. Census Bureau for recordation into the offi cial trade data (reproduced in tables 17–21). This problem presumably does not exist for imports by rail or by ship because these shipments are larger. Clinker imports from Canada were estimated to be higher than those reported in tables 1 and 21 by about 0.7 Mt in 2008 and by about 0.2 Mt in 2009.
With the decline in imports, especially from Asia, several of the once-busiest import locations have fallen from prominence, and overland import locations have become relatively dominant. For cement and clinker combined, the 10 busiest customs districts of entry in 2009 were, in descending order of tonnage, Detroit, MI; Houston-Galveston, TX; Seattle, WA; Buffalo, NY; Cleveland, OH; Columbia-Snake, OR and WA; Honolulu, HI; El Paso, TX; Ogdensburg, NY; and Savannah, GA (table 18). These leading districts accounted for about 71% of the total imports for the year.
World Review
World hydraulic cement production data are listed in table 22. The data are intended to include all forms of hydraulic cement; however, the data for the United States are for portland and masonry cement only, and data for some other countries also may be incomplete. For some countries, the production data may include exports of clinker.
World cement output in 2009 was an estimated 3.04 billion metric tons (Gt), up by 6.7%. Production was from more than 150 countries. China was again the world’s leading producer by far, with an output of 1.63 Gt or nearly 54% of the world total. The remaining top 20 producers were, in descending order of tonnage, India, the United States, Japan, Turkey, Brazil, the Republic of Korea, Iran, Vietnam, Egypt, Russia, Indonesia and Saudi Arabia (tied), Italy, Mexico, Pakistan, Thailand, Germany, Spain, and Malaysia. Cumulatively, the top 5 countries had about 66% of total world output, the top 10 countries, about 74%, and the top 20 countries, about 85%.
Regionally, Asia and the Pacifi c contributed about 71% of world production, included 9 of the 20 leading producing countries, and continued to experience the greatest growth rate of all regions. The Middle East (including Turkey), had 6.8% of world output; Western Europe, 6.1%; Africa, 4.3%; Central America and South America, combined, 3.8%; North America
(including Mexico), 3.7%; the Commonwealth of Independent States, 2.5%; and Eastern Europe, 1.5%.
Outlook
A modest increase in concrete construction in 2010 was expected, based on projected benefi cial downstream effects of stimulus funding on the general economy and the housing construction sector in particular, and on expected access to ARRA funding. Relatively little ARRA funding had gone to public sector construction projects involving concrete in 2009 and many States still had signifi cant fractions of their respective ARRA allotments as yet unspent at yearend 2009. However, low revenues to the States from property taxes were expected to continue to hamper State contributions to construction projects funded jointly by State governments and the Federal Government. It was recognized that a return to cement consumption levels approaching those of the peak 2005–06 period was many years away. Of great concern to the cement industry was the proposed portland cement NESHAP, which would impose very low, stringent, limits on mercury and certain other emissions by cement plants. The NESHAP would be diffi cult to comply with owing to high cost of emissions control equipment and potential problems of suffi cient control equipment availability within the 3-year NESHAP compliance window. According to some industry analysts, a large number of plants—representing perhaps 25% of U.S. production capacity—might have to close as a result of the NESHAP, forcing the concrete industry to increasingly rely on imported cement. Further, should fl y ash become stigmatized as a result of an EPA reclassifi cation of it as a hazardous material, the construction sector might lose this material as an alternative raw material or SCM, and thus hamper efforts to reduce the GHG “footprint” associated with concrete construction.
References Cited
American Coal Ash Association, 2010, 2009 coal combustion product (CCP) production and use survey report: Aurora, CO, American Coal Ash Association fact sheet, 1 p.
Buzzi Unicem, 2009, The largest line of the group: Casale Monferrato, Italy, Buzzi Unicem press release, September 24, 1 p.
Goss, D.C., 2010, Usage declines may signal beginning of troubling trend: Ash at work, issue 2, p. 14–17.
Hanle, Lisa, Maldonado, Pedro, Onuma, Eiichi, Tichy, Milos, and van Oss, H.G., 2006, Mineral industry emissions, chap. 2 of Eggleston, Simon, Buenda, Leandro, Miwa, Kyoko, Ngara, Todd, and Tanabe, Kiyoto, eds., Industrial processes and product use: Intergovernmental Panel on Climate Change, 2006 IPCC Guidelines for National Greenhouse Gas Inventories,
v. 3, CD-ROM.O’Hare, A.T., 2009, Proposed portland cement NESHAP—A cure worse than
the disease?: World Cement, v. 41, no. 3, March, p. 27–32. Portland Cement Association, 2011, Construction put in place: Monitor, v. 21,
no. 2, February, p. 10.Sullivan, Ed, 2010, There is light at the end of the tunnel—It’s just a really long
tunnel: World Cement, v. 41, no. 3, March, p. 22–26.Texas Industries, 2009, TXI reports second quarter results and announces delay
of central Texas cement plant expansion: Dallas, TX, Texas Industries, Inc. press release, January 8, 6 p.
U.S. Environmental Protection Agency, 2009a, 40 CFR Parts 60 and 63—National emissions standards for hazardous air pollutants from the portland cement industry (Proposed rule): Federal Register, May 6, v. 74, no. 86,
p. 21136–21192.

16.6 U.S. GEOLOGICAL SURVEY MINERALS YEARBOOK—2009
U.S. Environmental Protection Agency, 2009b, 40 CFR Part 98—Mandatory greenhouse gas reporting (Final rule): Federal Register, October 30, v. 74,
no. 209, p. 56374–56519. van Oss, H.G., 2005, Background facts and issues concerning cement and
cement data: U.S. Geological Survey Open-File Report 2005–1152, 88 p. (Accessed January 2, 2010, at http://pubs.usgs.gov/of/2005/1152/).
GENERAL SOURCES OF INFORMATION
U.S. Geological Survey Publications
Cement. Ch. in Mineral Commodity Summaries, annual.Cement. Mineral Industry Surveys, monthly.
Other
American Coal Ash Association, annual survey.Cement. Ch. in Mineral Facts and Problems, U.S. Bureau of
Mines Bulletin 675, 1985.
Cement Americas, bimonthly.Concrete Products, monthly. European Cement Association, The.Global Cement Magazine, monthly.International Cement Review, monthly.North American Cement Directory, Cement Americas, annual.Portland Cement Association:
Monitor, The, monthly.North American Cement Industry Annual Yearbook.U.S. and Canadian Portland Cement Industry, Plant Information Summary, annual.
Rock Products, monthly.Slag Cement Association, annual survey.World Cement, monthly.
TABLE 1SALIENT CEMENT STATISTICS FOR THE UNITED STATES1, 2
(Thousand metric tons unless otherwise specified)
2005 2006 2007 2008 2009Production:
Cement3 99,319 98,167 95,464 86,310 63,929Clinker 87,405 88,555 86,130 78,382 56,116
Shipments from mills and terminals:3, 4, 5
Quantity 128,000 127,000 114,000 96,700 71,100Value6 (thousands dollars) 11,700,000 12,900,000 11,900,000 9,990,000 7,020,000Average value6 (dollars per metric ton) 91.00 101.50 104.00 103.50 99.00
Stocks, yearend:Cement 7,450 9,380 8,890 8,360 6,080Clinker 3,520 5,370 6,550 7,070 5,130
Exports 766 723 7 886 7 823 884Imports:8
Cement 30,403 32,141 21,496 10,744 6,211Clinker 2,858 3,425 972 621 556
Total9 33,261 35,566 22,468 11,365 6,767Consumption, apparent10 128,250 127,660 116,550 96,760 71,530
World productione, 11 2,350,000 2,610,000 2,810,000 2,850,000 r 3,040,000eEstimated. rRevised.1Unless otherwise indicated, data are for portland (including blended) and masonry cements only. Even where presented unrounded, data are thought tobe accurate to no more than three significant digits.2Excludes Puerto Rico.3Includes cement made from imported clinker.4Includes imported cement.5Shipments to final domestic customers. Data are from an annual survey of plants and terminals and may differ from the totals in table 9, which are based on consolidated monthly surveys from companies.6Value free on board mill or independently reporting terminal.7Official export data have been corrected to remove an apparent excess of aluminous cement from Laredo, TX, of 943,939 metric tons in 2006 and 653,255 metric tons in 2007.8All forms of hydraulic cement or clinker.9Data may not add to totals shown because of independent rounding.10Production (including that from imported clinker) of cement plus imports of hydraulic cement minus exports of hydraulic cement minus the change in yearend cement stocks. 11Total hydraulic cement. May include clinker exports for some countries.

CEMENT—2009 16.7
TABLE 2COUNTY BASIS OF SUBDIVISION OF STATES IN CEMENT TABLES
State subdivision Defining countiesCalifornia, northern Alpine, Fresno, Kings, Madera, Mariposa, Monterey, Tulare, Tuolumne, and all counties
farther north.California, southern Inyo, Kern, Mono, San Luis Obispo, and all counties farther south.Illinois, metropolitan Chicago Cook, DuPage, Kane, Kendall, Lake, McHenry, and Will Counties in Illinois.Illinois, excluding Chicago All counties other than those in metropolitan Chicago.New York, eastern Delaware, Franklin, Hamilton, Herkimer, Otsego, and all counties farther east and south,
except those within Metropolitan New York.New York, western Broome, Chenango, Lewis, Madison, Oneida, St. Lawrence, and all counties farther west.New York, metropolitan New York City (Bronx, Kings, New York, Queens, and Richmond), Nassau, Rockland,
Suffolk, and Westchester.Pennsylvania, eastern Adams, Cumberland, Juniata, Lycoming, Mifflin, Perry, Tioga, Union, and all counties
farther east.Pennsylvania, western Centre, Clinton, Franklin, Huntingdon, Potter, and all counties farther west.Texas, northern Angelina, Bell, Concho, Crane, Culberson, El Paso, Falls, Houston, Hudspeth, Irion,
Lampasas, Leon, Limestone, McCulloch, Reagan, Reeves, Sabine, San Augustine, San Saba, Tom Green, Trinity, Upton, Ward, and all counties farther north.
Texas, southern Brazos, Burnet, Crockett, Jasper, Jeff Davis, Llano, Madison, Mason, Menard, Milam,Newton, Pecos, Polk, Robertson, San Jacinto, Schleicher, Tyler, Walker, Williamson,and all counties farther south.

16.8 U.S. GEOLOGICAL SURVEY MINERALS YEARBOOK—2009
TAB
LE 3
POR
TLA
ND
AN
D B
LEN
DED
CEM
ENT
PRO
DU
CTI
ON
, CA
PAC
ITY
, AN
D S
TOC
KS
IN T
HE
UN
ITED
STA
TES,
BY
DIS
TRIC
T1
(Tho
usan
d m
etric
tons
unl
ess o
ther
wis
e sp
ecifi
ed)
2008
2009
Num
ber
Grin
ding
Perc
enta
geY
eare
nd
Num
ber
Grin
ding
Perc
enta
geY
eare
nd
Dis
trict
2of
pla
nts
Prod
uctio
nca
paci
ty3
utili
zed4
stoc
ks5
of p
lant
sPr
oduc
tion
capa
city
3ut
ilize
d4st
ocks
5
Mai
ne a
nd N
ew Y
ork
53,
061
4,20
472
.823
46
52,
118
4,34
148
.821
96
Penn
sylv
ania
, eas
tern
73,
826
5,14
06
74.5
285
73,
064
5,42
06
56.5
247
Penn
sylv
ania
, wes
tern
31,
327
1,80
573
.514
03
678
1,80
537
.610
3Ill
inoi
s4
2,65
53,
390
78.3
268
31,
487
3,39
043
.923
7In
dian
a4
2,58
73,
653
70.8
237
42,
685
3,74
06
71.7
188
Mic
higa
n 5
4,92
87,
332
67.2
287
53,
548
6,98
350
.816
3O
hio
276
21,
166
65.4
642
550
1,16
647
.225
Iow
a, N
ebra
ska,
Sou
th D
akot
a5
3,98
75,
840
668
.345
85
2,99
15,
840
651
.226
6K
ansa
s4
2,39
63,
230
674
.224
73
1,66
92,
940
656
.816
6M
isso
uri
54,
651
7,23
064
.353
26
4,41
813
,035
33.9
622
Flor
ida7
74,
979
7,30
168
.238
96
73,
145
7,61
06
41.3
260
Geo
rgia
, Mar
ylan
d, V
irgin
ia, W
est V
irgin
ia7
5,05
76,
780
674
.659
56
63,
859
7,18
06
53.7
334
Sout
h C
arol
ina
32,
925
5,08
557
.513
76
31,
868
5,08
536
.777
Ala
bam
a5
4,63
57,
074
65.5
242
53,
416
7,29
246
.823
16
Ken
tuck
y, M
issi
ssip
pi, T
enne
ssee
43,
045
3,70
282
.328
24
1,95
83,
702
52.9
147
Ark
ansa
s and
Okl
ahom
a4
2,62
33,
130
683
.919
84
2,06
73,
127
66.1
182
Texa
s, no
rther
n6
6,30
37,
618
82.7
1,32
46
3,83
37,
580
650
.560
9Te
xas,
sout
hern
64,
778
6,33
06
75.5
260
66
4,51
96,
505
69.5
226
6
Ariz
ona
and
New
Mex
ico
32,
097
3,11
667
.310
23
1,46
43,
116
47.0
91C
olor
ado
and
Wyo
min
g4
2,61
04,
449
58.7
173
42,
165
4,51
747
.914
9Id
aho,
Mon
tana
, Nev
ada,
Uta
h6
2,72
73,
728
73.1
221
66
2,05
03,
728
55.0
156
Ala
ska
and
Haw
aii
----
----
82--
----
--55
Cal
iforn
ia, n
orth
ern
31,
678
2,85
358
.818
8W
8W
8W
8W
8W
8
Cal
iforn
ia, s
outh
ern
88,
201
10,8
5575
.631
06
118
7,15
38
13,6
006,
852
.78
417
6, 8
Ore
gon
and
Was
hing
ton
41,
443
2,43
559
.324
86
41,
254
2,43
551
.427
56
Impo
rters
9--
----
--31
06
----
----
182
6
Tota
l1011
483
,283
117,
000
670
.97,
810
611
261
,961
124,
000
649
.95,
620
6
Puer
to R
ico
21,
301
1,89
868
.544
293
61,
780
52.6
476
Gra
nd to
tal10
116
84,5
8411
9,00
06
70.9
7,86
06
114
62,8
9712
6,00
06
50.0
5,67
06
See
foot
note
s at e
nd o
f tab
le.

CEMENT—2009 16.9
TAB
LE 3
—C
ontin
ued
POR
TLA
ND
AN
D B
LEN
DED
CEM
ENT
PRO
DU
CTI
ON
, CA
PAC
ITY
, AN
D S
TOC
KS
IN T
HE
UN
ITED
STA
TES,
BY
DIS
TRIC
T1
W W
ithhe
ld to
avo
id d
iscl
osin
g co
mpa
ny p
ropr
ieta
ry d
ata;
incl
uded
in “
Tota
l.” --
Zer
o.1 Ev
en w
here
pre
sent
ed u
nrou
nded
, dat
a ar
e th
ough
t to
be a
ccur
ate
to n
o m
ore
than
thre
e si
gnifi
cant
dig
its. I
nclu
des d
ata
for w
hite
cem
ent.
Incl
udes
cem
ent m
ade
from
impo
rted
clin
ker.
2 Dis
trict
ass
igna
tion
is th
e lo
catio
n of
the
repo
rting
faci
litie
s. Sp
ecifi
c di
stric
ts in
clud
e im
porte
rs fo
r whi
ch d
istri
ct a
ssig
natio
ns w
ere
poss
ible
.3 G
rindi
ng c
apac
ity is
bas
ed o
n fin
enes
s nee
ded
to p
rodu
ce a
pla
nt’s
nor
mal
out
put m
ix, i
nclu
ding
mas
onry
cem
ent,
and
allo
win
g fo
r dow
ntim
e fo
r rou
tine
mai
nten
ance
.4 C
alcu
late
d re
lativ
e to
por
tland
cem
ent o
utpu
t; ut
iliza
tion
wou
ld b
e hi
gher
if c
alcu
late
d to
incl
ude
outp
ut o
f mas
onry
cem
ent.
5 Incl
udes
impo
rted
cem
ent.
Incl
udes
stoc
ks a
t mill
s, te
rmin
als,
and
in tr
ansi
t.6 D
ata
cont
ain
estim
ates
for n
onre
spon
dent
or i
ncom
plet
ely
repo
rting
faci
litie
s and
hav
e be
en ro
unde
d to
no
mor
e th
an th
ree
sign
ifica
nt d
igits
.7 Pr
oduc
tion
and
capa
city
dat
a ex
clud
e a
plan
t tha
t pro
duce
d on
ly m
ason
ry c
emen
t.8 D
ata
for N
orth
ern
Cal
iforn
ia fo
r 200
9 ar
e in
clud
ed w
ith th
ose
for S
outh
ern
Cal
iforn
ia.
9 Dat
a in
clud
e on
ly th
ose
impo
rters
or t
erm
inal
s for
whi
ch d
istri
ct a
ssig
natio
ns w
ere
not p
ossi
ble.
10D
ata
may
not
add
to to
tals
show
n be
caus
e of
inde
pend
ent r
ound
ing.
16.10 U.S. GEOLOGICAL SURVEY MINERALS YEARBOOK—2009
TABLE 4MASONRY CEMENT PRODUCTION AND STOCKS IN THE UNITED STATES, BY DISTRICT1
(Thousand metric tons unless otherwise specified)
2008 2009Number Numberof active Yearend of active Yearend
District2 plants Production3 stocks4 plants Production3 stocks4
Maine and New York 4 69 17 4 41 12Pennsylvania 9 254 56 9 176 46Indiana and Ohio 6 332 73 6 244 52Michigan 4 99 34 4 80 28Iowa, Nebraska, South Dakota 2 W W 2 W WKansas 2 W W 2 W WMissouri 1 W W 1 W WFlorida 5 310 65 6 123 38Georgia, Maryland, Virginia, West Virginia 6 367 53 6 250 42South Carolina 3 323 31 3 174 16Alabama 4 303 63 4 208 61Kentucky, Mississippi, Tennessee 3 W W 3 W WArkansas and Oklahoma 4 125 18 3 97 21Texas 7 274 20 8 202 22Arizona and New Mexico 3 W W 3 W WColorado and Wyoming 2 W W 2 W WIdaho, Montana, Nevada, Utah 1 W W -- W WCalifornia, northern 3 59 19 W 5 W 5 W 5
California, southern 5 278 23 7 236 45 6
Importers7 -- -- 3 6 -- -- 3 6
Total8 74 3,027 549 6 73 1,968 456 6
W Withheld to avoid disclosing company proprietary data; included in “Total.” -- Zero.1Includes masonry, portland-lime, plastic, and stucco cements. Even where presented unrounded, data are thought to be accurate to no more than three significant digits.2District assignation is the location of the reporting facilities. Specific districts include importers for which district assignations were possible.3Includes cement produced from imported clinker.4Includes imported cement.5Data for 2009 for Northern California is included with those for Southern California.6Data contain estimates for nonrespondent or incompletely reporting facilities.7Data include only those importers or terminals for which district assignations were not possible.8Data may not add totals shown because of independent rounding.

CEMENT—2009 16.11
TAB
LE 5
CLI
NK
ER C
APA
CIT
Y A
ND
PR
OD
UC
TIO
N IN
TH
E U
NIT
ED S
TATE
S IN
200
9, B
Y D
ISTR
ICT1
Dai
lyA
vera
geA
ppar
ent a
nnua
lY
eare
ndN
umbe
r of a
ctiv
e pl
ants
2ca
paci
ty4,
5da
ys o
fca
paci
ty4,
7Pr
oduc
tion
Perc
enta
gest
ocks
Proc
ess u
sed
Num
ber
(thou
sand
rout
ine
(thou
sand
(thou
sand
of c
apac
ity(th
ousa
ndD
istri
ctW
etD
ryB
oth3
Tota
lof
kiln
s4m
etric
tons
)m
aint
enan
ce6
met
ric to
ns)
met
ric to
ns)
utili
zed
met
ric to
ns)
Mai
ne a
nd N
ew Y
ork
22
--4
511
.326
.83,
817
1,85
648
.610
0Pe
nnsy
lvan
ia3
51
918
22.8
13.9
88,
000
83,
523
44.2
271
Illin
ois
--3
--3
67.
77.
52,
728
1,31
148
.113
48
Indi
ana
13
9--
48
10.2
25.8
3,43
02,
578
75.2
198
Mic
higa
n1
2--
38
14.1
18.6
4,79
62,
587
53.9
132
Ohi
o1
1--
23
3.3
25.8
1,15
946
740
.323
Iow
a, N
ebra
ska,
Sou
th D
akot
a--
41
59
14.1
17.9
84,
850
82,
614
53.9
230
Kan
sas
12
--3
58.
218
.52,
746
1,68
261
.363
Mis
sour
i1
5--
68
36.3
25.6
812
,400
84,
123
33.3
434
Flor
ida
--7
--7
823
.818
.18
8,35
08
2,98
435
.733
8G
eorg
ia, M
aryl
and,
Virg
inia
, Wes
t Virg
inia
--4
15
822
.119
.38
7,57
08
3,61
147
.726
1So
uth
Car
olin
a--
3--
33
12.3
26.6
4,18
51,
770
42.3
325
Ala
bam
a--
5--
55
16.9
31.0
5,67
08
3,24
057
.119
6K
entu
cky,
Mis
siss
ippi
, Ten
ness
ee1
3--
44
10.5
17.5
3,63
51,
773
48.8
47A
rkan
sas a
nd O
klah
oma
22
--4
108.
120
.52,
796
1,77
563
.566
Texa
s, no
rther
n2
410
--10
612
19.0
18.6
6,58
63,
480
52.8
649
Texa
s, so
uthe
rn--
5--
56
16.2
15.7
5,64
84,
128
73.1
366
Ariz
ona
and
New
Mex
ico
--3
--3
78.
611
.63,
022
1,12
537
.213
6C
olor
ado
and
Wyo
min
g--
4--
45
11.5
26.8
3,90
71,
992
51.0
228
Idah
o, M
onta
na, N
evad
a, U
tah
33
--6
88.
520
.32,
876
1,67
158
.115
48
Cal
iforn
ia--
9--
911
40.4
26.0
13,6
676,
612
48.4
717
Ore
gon
and
Was
hing
ton
12
--3
36.
034
.42,
019
1,21
360
.164
Tota
l1119
813
103
160
332.
120
.18
114,
000
856
,116
49.3
5,13
08
Puer
to R
ico
--2
--2
25.
342
.51,
731
802
46.3
75G
rand
tota
l1119
833
105
162
337.
420
.48
116,
000
856
,918
49.3
5,21
08
See
foot
note
s at e
nd o
f tab
le.
16.12 U.S. GEOLOGICAL SURVEY MINERALS YEARBOOK—2009
TAB
LE 5
—C
ontin
ued
CLI
NK
ER C
APA
CIT
Y A
ND
PR
OD
UC
TIO
N IN
TH
E U
NIT
ED S
TATE
S IN
200
9, B
Y D
ISTR
ICT1
-- Ze
ro.
1 Even
whe
re p
rese
nted
unr
ound
ed, d
ata
are
thou
ght t
o be
acc
urat
e to
no
mor
e th
an th
ree
sign
ifica
nt d
igits
.2 In
clud
es w
hite
cem
ent p
lant
s. In
clud
es a
ll pl
ants
that
pro
duce
d cl
inke
r for
at l
east
one
day
dur
ing
the
year
.3 Pl
ants
that
can
ope
rate
bot
h w
et a
nd d
ry k
ilns,
whe
ther
or n
ot b
oth
type
s wer
e ac
tive
durin
g th
e ye
ar.
4 Incl
udes
kiln
s act
ive
for a
t lea
st o
ne d
ay d
urin
g th
e ye
ar. F
or k
ilns i
dle
all y
ear,
excl
udes
thos
e th
at c
anno
t be
rest
arte
d, fu
lly p
erm
itted
, in
less
than
6 m
onth
s.5 Su
m o
f rep
orte
d ki
ln c
apac
ities
for e
ach
plan
t in
a di
stric
t.6 To
tal d
ays o
f rou
tine
mai
nten
ance
(sum
med
for a
ll ki
lns)
div
ided
by
the
num
ber o
f kiln
s.7 Su
m o
f app
aren
t ann
ual c
apac
ities
for e
ach
kiln
. For
eac
h ki
ln, t
he st
atis
tic is
cal
cula
ted
as 3
66 d
ays (
leap
yea
r) m
inus
day
s rep
orte
d fo
r rou
tine
mai
nten
ance
and
then
mul
tiplie
d by
the
unro
unde
d da
ily c
apac
ity.
8 Dat
a co
ntai
n es
timat
es fo
r non
resp
onde
nts a
nd in
com
plet
ely
repo
rting
faci
litie
s and
hav
e be
en ro
unde
d to
no
mor
e th
an th
ree
sign
ifica
nt d
igits
.9 In
clud
es o
ne se
miw
et k
iln.
10In
clud
es a
s a d
ry o
pera
tion
one
plan
t, fo
rmer
ly o
pera
ting
both
wet
and
dry
kiln
s, w
hose
wet
kiln
s wer
e id
le a
ll ye
ar (2
009)
and
whi
ch, i
n 20
10, w
ere
decl
ared
per
man
ently
clo
sed.
11D
ata
may
not
add
to to
tals
show
n be
caus
e of
inde
pend
ent r
ound
ing.
CEMENT—2009 16.13
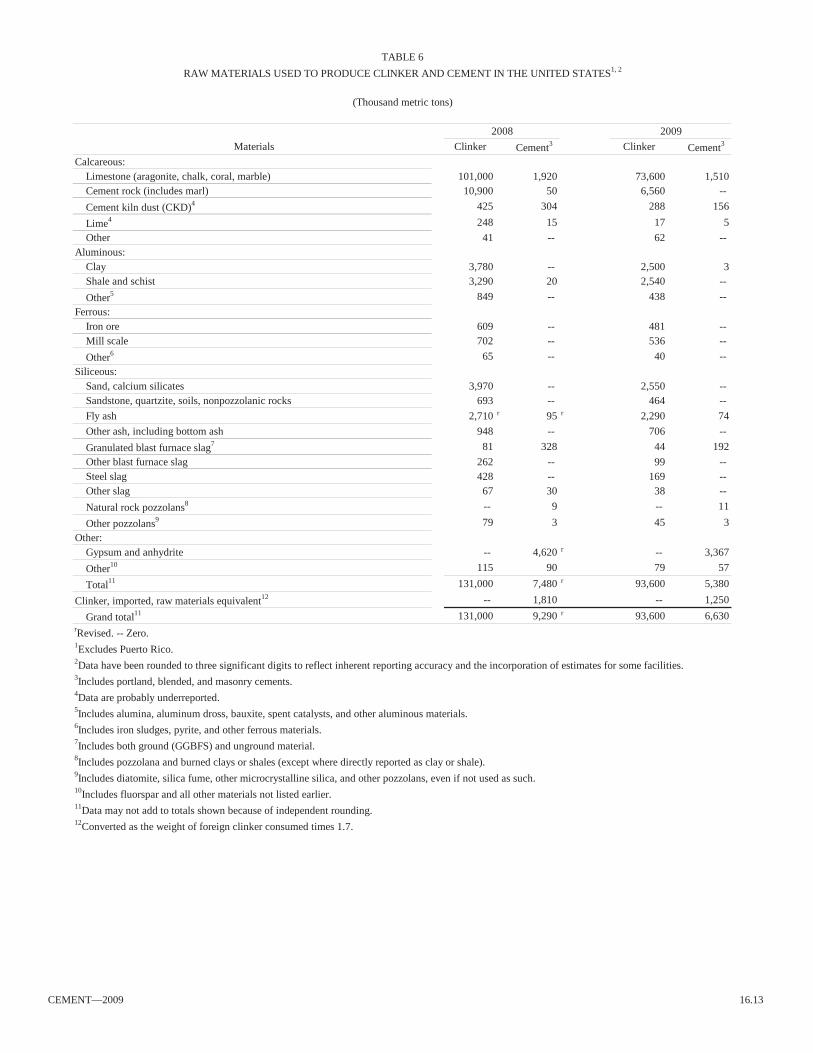
TABLE 6RAW MATERIALS USED TO PRODUCE CLINKER AND CEMENT IN THE UNITED STATES1, 2
(Thousand metric tons)
2008 2009 Materials Clinker Cement3 Clinker Cement3
Calcareous:Limestone (aragonite, chalk, coral, marble) 101,000 1,920 73,600 1,510Cement rock (includes marl) 10,900 50 6,560 --Cement kiln dust (CKD)4 425 304 288 156Lime4 248 15 17 5Other 41 -- 62 --
Aluminous:Clay 3,780 -- 2,500 3Shale and schist 3,290 20 2,540 --Other5 849 -- 438 --
Ferrous:Iron ore 609 -- 481 --Mill scale 702 -- 536 --Other6 65 -- 40 --
Siliceous:Sand, calcium silicates 3,970 -- 2,550 --Sandstone, quartzite, soils, nonpozzolanic rocks 693 -- 464 --Fly ash 2,710 r 95 r 2,290 74Other ash, including bottom ash 948 -- 706 --Granulated blast furnace slag7 81 328 44 192Other blast furnace slag 262 -- 99 --Steel slag 428 -- 169 --Other slag 67 30 38 --Natural rock pozzolans8 -- 9 -- 11Other pozzolans9 79 3 45 3
Other:Gypsum and anhydrite -- 4,620 r -- 3,367Other10 115 90 79 57Total11 131,000 7,480 r 93,600 5,380
Clinker, imported, raw materials equivalent12 -- 1,810 -- 1,250Grand total11 131,000 9,290 r 93,600 6,630
rRevised. -- Zero.1Excludes Puerto Rico.2Data have been rounded to three significant digits to reflect inherent reporting accuracy and the incorporation of estimates for some facilities.3Includes portland, blended, and masonry cements.4Data are probably underreported.5Includes alumina, aluminum dross, bauxite, spent catalysts, and other aluminous materials.6Includes iron sludges, pyrite, and other ferrous materials.7Includes both ground (GGBFS) and unground material.8Includes pozzolana and burned clays or shales (except where directly reported as clay or shale).9Includes diatomite, silica fume, other microcrystalline silica, and other pozzolans, even if not used as such.10Includes fluorspar and all other materials not listed earlier.11Data may not add to totals shown because of independent rounding.12Converted as the weight of foreign clinker consumed times 1.7.

16.14 U.S. GEOLOGICAL SURVEY MINERALS YEARBOOK—2009
TAB
LE 7
CLI
NK
ER P
RO
DU
CED
AN
D F
UEL
CO
NSU
MED
BY
TH
E U
.S. C
EMEN
T IN
DU
STR
Y, B
Y K
ILN
PR
OC
ESS1
Clin
ker p
rodu
ctio
n2C
onve
ntio
nal f
uels3
Was
te fu
els3
Qua
ntity
Coa
l4Pe
tcok
eO
il5N
atur
al g
as6
Tire
sSo
lidLi
quid
Num
ber
(thou
sand
Perc
enta
ge(th
ousa
nd(th
ousa
nd(th
ousa
nd(th
ousa
nd(th
ousa
nd(th
ousa
nd(th
ousa
ndK
iln p
roce
ssof
pla
nts
met
ric to
ns)
of to
tal
met
ric to
ns)
met
ric to
ns)
liter
s)cu
bic
met
ers)
met
ric to
ns)
met
ric to
ns)
liter
s)20
08:
Wet
229,
930
12.7
1,23
051
824
,300
23,2
0091
1037
0,00
0D
ry81
64,6
6482
.56,
440
1,61
028
,000
218,
000
341
335
354,
000
Bot
h73
3,78
84.
856
1--
--38
,900
69
67,2
00To
tal8
106
78,3
8210
0.0
8,24
02,
130
52,3
0028
0,00
043
835
479
1,00
020
09:
Wet
194,
866
8.7
569
157
7,31
096
,200
5016
256,
000
Dry
981
50,1
1289
.34,
690
1,30
026
,500
247,
000
263
307
493,
000
Bot
h73
1,13
82.
018
633
1,81
01,
190
----
34,6
00To
tal8
103
56,1
1610
0.0
5,45
01,
490
35,6
0034
4,00
031
332
478
4,00
0 --
Zer
o.1 Ex
clud
es P
uerto
Ric
o.2 C
linke
r pro
duct
ion
data
are
all
repo
rted.
Alth
ough
unr
ound
ed, d
ata
are
thou
ght t
o be
acc
urat
e to
no
mor
e th
an th
ree
sign
ifica
nt d
igits
.3 A
ll fu
el d
ata
have
bee
n ro
unde
d to
no
mor
e th
an th
ree
sign
ifica
nt d
igits
.4 Es
sent
ially
all
repo
rted
to b
e bi
tum
inou
s.5 D
istil
liate
and
resi
dual
fuel
oils
. Exc
lude
s use
d oi
ls th
at w
ere
repo
rted
unde
r liq
uid
was
tes.
6 Incl
udes
land
fill g
as a
nd p
ropa
ne.
7 Plan
ts th
at c
an o
pera
te b
oth
wet
and
dry
kiln
s, w
heth
er o
r not
bot
h ty
pes w
ere
activ
e du
ring
the
year
. Inc
lude
s pla
nts t
hat c
onve
rted
from
wet
to d
ry te
chno
logy
dur
ing
the
year
.Fo
r 200
9, e
xclu
des o
ne p
lant
as n
oted
in fo
otno
te 9
.8 D
ata
may
not
add
to to
tals
show
n be
caus
e of
inde
pend
ent r
ound
ing.
9 Incl
udes
one
pla
nt th
at o
pera
ted
a dr
y ki
ln in
200
9 th
at h
ad w
et k
ilns w
hich
, alth
ough
tech
nica
lly id
le a
ll ye
ar, w
ere
deem
ed a
s clo
sed.

CEMENT—2009 16.15
TAB
LE 8
ELEC
TRIC
ITY
CO
NSU
MED
BY
U.S
. CEM
ENT
PLA
NTS
, BY
KIL
N P
RO
CES
S1
Elec
trici
ty c
onsu
med
2A
vera
geG
ener
ated
Pu
rcha
sed
Tota
l3C
emen
tco
nsum
ptio
nQ
uant
ityQ
uant
ityQ
uant
itypr
oduc
ed4
(kilo
wat
thou
rsN
umbe
r(m
illio
nN
umbe
r(m
illio
nN
umbe
r(m
illio
nPe
rcen
tage
(thou
sand
per t
on o
fPl
ant p
roce
ssof
pla
nts
kilo
wat
thou
rs)
of p
lant
ski
low
atth
ours
)of
pla
nts
kilo
wat
thou
rs)
of to
tal
met
ric to
ns)
cem
ent p
rodu
ced)
2008
:In
tegr
ated
pla
nts:
Wet
----
221,
530
221,
530
12.4
10,5
9814
5D
ry3
236
835
9,96
083
510
,200
82.9
70,2
7914
5B
oth6
----
356
33
563
4.6
3,73
615
1To
tal o
r ave
rage
33
236
108
512
,100
108
512
,300
100.
084
,612
145
Grin
ding
pla
nts7
----
513
05
130
--1,
481
88Ex
clus
ions
8--
--3
XX
3X
X--
216
XX
2009
:In
tegr
ated
pla
nts:
Wet
----
1981
519
815
8.8
5,80
414
0D
ry9
222
383
58,
000
835
8,21
088
.655
,739
148
Bot
h6--
--3
222
322
22.
41,
334
166
Tota
l or a
vera
ge3
222
310
55
9,03
010
55
9,26
010
0.0
62,8
7714
7G
rindi
ng p
lant
s7--
--5
916
91--
908
99Ex
clus
ions
8--
--3
XX
3X
X--
143
XX
XX
Not
app
licab
le. -
- Zer
o.
1 Excl
udes
Pue
rto R
ico.
2 Elec
trici
ty d
ata
are
roun
ded
to n
o m
ore
than
thre
e si
gnifi
cant
dig
its b
ecau
se th
ey c
onta
in e
stim
ates
.3 D
ata
may
not
add
to to
tals
show
n be
caus
e of
inde
pend
ent r
ound
ing.
4 Portl
and
and
mas
onry
cem
ent.
Dat
a ar
e al
l rep
orte
d an
d ar
e un
roun
ded.
5 Incl
udes
two
grin
ding
pla
nts w
hose
dat
a w
ere
incl
uded
with
the
inte
grat
ed p
lant
s. 6 Pl
ants
that
can
ope
rate
bot
h w
et a
nd d
ry k
ilns,
whe
ther
or n
ot b
oth
type
s wer
e ac
tive
durin
g th
e ye
ar. I
nclu
des p
lant
s tha
t con
verte
d fro
m w
et to
dry
tech
nolo
gy d
urin
g th
e ye
ar. F
or20
09, e
xclu
des o
ne p
lant
as n
oted
in fo
otno
te 9
.7 Pl
ants
that
did
not
pro
duce
clin
ker b
ut g
roun
d cl
inke
r fro
m o
utsi
de so
urce
s. Ex
clud
es p
lant
s tha
t onl
y m
ade
mas
onry
cem
ent o
r jus
t reg
roun
d on
e ty
pe o
f por
tland
cem
ent i
nto
anot
her,
or w
hich
also
repo
rted
a si
gnifi
cant
com
pone
nt o
f grin
ding
of e
xces
s gra
nula
ted
blas
t fur
nace
slag
.8 Pl
ants
who
se p
rodu
ctio
n of
por
tland
cem
ent w
as b
y si
mpl
y re
grin
ding
of o
ne ty
pe in
to a
noth
er, o
r whi
ch re
porte
d pr
oduc
tion
only
of m
ason
ry c
emen
t. 9 In
clud
es o
ne p
lant
that
ope
rate
d a
dry
kiln
in 2
009
that
had
wet
kiln
s whi
ch, a
lthou
gh te
chni
cally
idle
all
year
, wer
e de
emed
as c
lose
d.

16.16 U.S. GEOLOGICAL SURVEY MINERALS YEARBOOK—2009
TABLE 9CEMENT SHIPMENTS TO FINAL CUSTOMER, BY DESTINATION AND ORIGIN1, 2
(Thousand metric tons)
Portland cement Masonry cementDestination and origin 2008 2009 2008 2009
Destination:Alabama 1,559 1,140 122 85Alaska3 148 146 -- --Arizona 2,778 1,727 44 26Arkansas 902 732 49 40California, northern 3,179 2,133 73 45California, southern 6,189 4,395 238 170Colorado 2,156 1,403 14 7Connecticut3 640 478 12 11Delaware3 217 159 7 5District of Columbia3 168 129 (4) (4)
Florida 5,875 3,946 351 231Georgia 3,112 1,887 235 131Hawaii3 397 306 4 2Idaho 507 367 1 (4)
Illinois, excluding Chicago 1,656 1,397 13 10Illinois, metropolitan Chicago3 1,636 1,181 31 19Indiana 1,719 1,454 56 39Iowa 1,658 1,448 2 1Kansas 1,430 1,133 10 7Kentucky 1,085 870 68 49Louisiana3 2,477 2,135 62 49Maine 239 185 3 2Maryland 1,223 902 59 42Massachusetts3 919 702 15 11Michigan 1,858 1,384 59 42Minnesota3 1,374 1,135 13 12Mississippi 1,063 805 59 40Missouri 2,079 1,728 26 19Montana 349 256 1 1Nebraska 1,134 1,018 3 2Nevada 1,651 1,008 15 12New Hampshire3 269 198 4 7New Jersey3 1,594 1,152 59 43New Mexico 709 534 9 7New York, eastern 573 476 13 10New York, western3 748 652 23 16New York, metropolitan3 1,637 1,304 73 59North Carolina3 2,343 1,612 229 135North Dakota3 391 375 1 1Ohio 2,817 2,232 99 78Oklahoma 1,570 1,338 54 39Oregon 923 663 1 (4)
Pennsylvania, eastern 1,722 1,270 48 37Pennsylvania, western 1,082 913 42 33Rhode Island3 139 106 2 1South Carolina 1,242 822 103 70South Dakota 453 450 1 1Tennessee 1,692 1,223 164 108Texas, northern 6,580 4,255 123 79Texas, southern 7,668 5,344 198 157Utah 1,313 1,058 (4) (4)
See footnotes at end of table.

CEMENT—2009 16.17
TABLE 9—ContinuedCEMENT SHIPMENTS TO FINAL CUSTOMER, BY DESTINATION AND ORIGIN1, 2
(Thousand metric tons)
Portland cement Masonry cementDestination and origin 2008 2009 2008 2009
Destination—Continued:Vermont3 116 95 3 2Virginia 2,019 1,526 118 80Washington 2,044 1,437 1 1West Virginia 504 402 21 14Wisconsin3 1,729 1,410 13 10Wyoming 497 348 (4) (4)
Total5 93,751 68,885 3,047 2,102Foreign countries6 564 502 (4) (4)
Puerto Rico 1,397 979 -- (4)
Grand total5 95,710 70,366 3,047 2,102Origin:
United States 83,178 63,486 2,995 2,070Foreign countries7 11,197 5,948 52 32Puerto Rico 1,335 932 -- --
Total shipments5 95,710 70,366 3,047 2,102 -- Zero.1Includes cement produced from imported clinker and imported cement shipped by domestic producers and importers.2Data are developed from consolidated monthly surveys of shipments by companies and may differ from data in tables 1, 10–12, and 14–15, which are from annual surveys of individual plants and importers. Although presented unrounded, data are thoughtto be accurate to no more than three significant digits.3Has no cement plants.4Less than ½ unit.5Data may not add to totals shown because of independent rounding.6Includes shipments to U.S. possessions and territories.7Imported cement sold to final customers in the United States as reported by domestic producers and other importers. Data do not match the imports in tables 17–20.
TABLE 10SHIPMENTS OF PORTLAND CEMENT IN THE UNITED STATES, BY TYPE OF CARRIER1, 2
(Thousand metric tons)
Plant to terminal Plant to customer Terminal to customer Total toIn bulk In bags3 In bulk In bags3 In bulk In bags3 customers4
2008:Railroad 10,700 108 1,870 3 438 2 2,310Truck 5,350 308 49,000 1,310 39,900 644 90,900Barge and boat 7,230 3 323 43 37 -- 403
Total4 23,300 419 51,200 1,360 40,400 647 93,600 5
2009:Railroad 9,580 8 1,460 2 528 4 2,000Truck 4,000 116 36,000 1,040 29,400 400 66,900Barge and boat 7,120 -- 55 -- -- -- 55
Total4 20,700 125 37,500 1,040 30,000 404 69,000 5
-- Zero.1Includes imported cement and cement made from imported clinker. Excludes Puerto Rico. 2Data are rounded to no more than three significant digits because they contain estimates. 3Includes packages, bags, and supersacks.4Data may not add to totals shown because of independent rounding.5Shipments are based on an annual survey of plants and importers; may differ from totals in table 9, which are basedon consolidated monthly data.

16.18 U.S. GEOLOGICAL SURVEY MINERALS YEARBOOK—2009
TABLE 11PORTLAND CEMENT SHIPPED IN THE UNITED STATES, BY DISTRICT1
2008 2009Value2 Value2
Quantity3 Average Quantity3 Average(thousand Total (per (thousand Total (per
District4 metric tons) (thousands) metric ton) metric tons) (thousands) metric ton)Maine and New York 3,820 5 $403,000 5 $105.50 5 2,580 5 $250,000 5 $97.00 5
Pennsylvania, eastern 3,838 382,000 5 99.50 5 2,995 285,000 5 95.00 5
Pennsylvania, western 1,248 121,000 5 97.00 5 949 90,800 5 95.50 5
Illinois 2,810 279,000 5 99.00 5 2,014 191,586 95.11Indiana 2,346 205,153 87.46 1,951 169,069 86.66Michigan 4,986 508,000 5 102.00 5 4,114 406,143 98.72Ohio 733 71,200 97.20 582 55,691 95.69Iowa, Nebraska, South Dakota 4,366 453,124 103.79 3,382 365,298 108.01Kansas 2,115 217,519 102.85 1,627 166,000 5 102.00 5
Missouri 5,058 490,008 96.89 4,219 414,000 5 98.00 5
Florida 5,763 599,000 5 104.00 5 3,790 5 371,000 5 98.00 5
Georgia, Virginia, West Virginia 2,299 243,026 105.71 4,141 6 367,335 6 88.70 6
Maryland 2,957 240,275 81.25 W 6 W 6 W 6
South Carolina 2,756 267,411 97.02 1,826 165,160 90.46Alabama 4,444 432,000 5 97.00 5 3,515 315,408 89.72Kentucky, Mississippi, Tennessee 2,673 268,412 100.43 1,885 187,660 99.53Arkansas and Oklahoma 2,643 262,806 99.44 2,300 231,363 100.60Texas, northern 7,316 733,000 5 100.00 5 4,557 453,000 5 99.50 5
Texas, southern 6,417 645,641 100.61 4,730 452,380 95.65Arizona and New Mexico 3,106 391,316 125.97 2,173 255,708 117.68Colorado and Wyoming 2,554 273,303 107.02 1,932 190,508 98.63Idaho, Montana, Nevada, Utah 2,589 260,250 100.53 2,063 199,834 96.87Alaska and Hawaii 497 86,882 174.79 406 66,690 164.27California, northern 2,481 256,000 5 103.00 5 W 7 W 7 W 7
California, southern 7,540 784,938 104.10 6,835 7 618,000 5, 7 90.50 5, 7
Oregon and Washington 2,196 212,013 96.53 1,651 150,011 90.85Importers8 4,060 5 478,000 5 117.50 5 2,747 315,000 5 115.00 5
Total or average9 93,600 5, 10 9,560,000 5 102.00 5 69,000 5, 10 6,730,000 5 97.50 5
Puerto Rico 1,381 W W 978 5 W WGrand total9 95,000 5, 10 W W 69,900 5, 10 W W
W Withheld to avoid disclosing company proprietary data.1Includes gray and white portland cement. Includes cement made from imported clinker. Even where presented unrounded, data are thought to be accurate to no more than three significant digits.2Values are mill net or ex-plant (free on board) valuations of total sales to final customers, including sales from plants’ external distributionterminals. The data are ex-terminal for independently reporting terminals. Data include all varieties of portland cement and both bulk andbag shipments. Unless otherwise specified, data are presented unrounded. Unrounded or not, unit value data should be viewed as value indicators, good to no better than the nearest $0.50 or $1.00 per metric ton.3Tonnages are those by reporting entities in the district but may include shipments into other districts. They differ from the data in table 9, which arethe actual reported sales into the specific States. 4District is the location of the reporting entities, not necessarily the location of sales (see table 9 for sales data, by State). Specific districts includeshipments by importers where district assignations were possible.5Data are rounded (unit values to the nearest $0.50) because they include estimates.6For 2009, data for Maryland are included with Georgia, Virginia, West Virginia district.7For 2009, data for Northern California are included with those for Southern California.8Importers for which district assignations were not possible.9Data may not add to totals shown because of independent rounding.10Shipments are based on an annual survey of plants and importers; may differ from totals in table 9, which are based on consolidated monthly data.

CEMENT—2009 16.19
TABLE 12MASONRY CEMENT SHIPPED IN THE UNITED STATES, BY DISTRICT1, 2
2008 2009Value3 Value3
Quantity4 Average Quantity4 Average(thousand Total (per (thousand Total (per
District5 metric tons) (thousands) metric ton) metric tons) (thousands) metric ton)Maine and New York 82 $10,100 6 $124.50 6 56 $6,265 $112.54Pennsylvania 241 32,300 6 134.00 6 187 25,300 6 135.00 6
Illinois, Indiana, Ohio 335 47,725 142.55 230 33,900 6 147.50 6
Michigan 136 16,400 6 121.00 6 95 11,538 121.87Iowa, Nebraska, South Dakota 19 2,161 114.53 15 1,921 128.09Kansas and Missouri 84 13,427 159.64 51 6,353 124.50Florida 282 42,800 6 151.50 6 192 6 29,100 6 151.50 6
Georgia, Maryland, Virginia, West Virginia 320 57,900 6 180.50 6 214 36,547 170.78South Carolina 305 39,409 129.07 169 21,376 126.43Alabama 353 44,247 125.38 242 29,735 122.90Kentucky, Mississippi, Tennessee 80 11,784 146.57 57 8,360 146.39Arkansas and Oklahoma 125 15,070 120.65 93 11,100 6 119.00 6
Texas, northern 155 26,100 6 168.00 6 W 7 W 7 W 7
Texas, southern 146 18,300 6 125.50 6 221 7 31,000 7 140.40 7
Arizona, Colorado, Idaho, Montana, Nevada, New Mexico, Utah, Wyoming 67 9,259 137.47 42 5,387 129.76
Alaska and Hawaii 3 946 279.55 2 620 289.54California, northern; Oregon; Washington 51 6,511 128.31 W 8 W 8 W 8
California, southern 279 36,213 129.87 232 6, 8 27,700 6, 8 119.50 6, 8
Importers9 10 6 1,950 6 196.00 6 6 6 1,220 6 191.50 6
Total or average10 3,070 6, 11 433,000 6 140.50 6 2,100 6, 11 287,000 6 136.50 6
W Witheld to avoid disclosing company proprietary data; included in “Total.”1Shipments are those by cement companies to final customers and include imported cement and cement made from imported clinker. Sales are those by cement plants and exclude masonry cement made by portland cement customers from purchased portland cement and which was thenresold and (or) consumed. Data exclude Puerto Rico, which did not record any masonry cement sales. Even where presented unrounded, data arethought to be accurate to no more than three significant digits.2Data include true masonry, plastic, portland-lime, and stucco cements. 3Values are mill net or ex-plant (free on board) valuations of total sales to final customers, including sales from plants external distribution terminals. The data are ex-terminal for independently reporting terminals. Data include both bulk and bag shipments. Unless otherwise specified, data arepresented unrounded. Unrounded or not, unit value data should be viewed as value indicators, good to no better than the nearest $0.50 or even $1.00 per metric ton.4Tonnages are those by reporting entities in the district but may include shipments into other districts. They differ from the data in table 9, which arethe actual reported sales into the specific States. 5District is the location of the reporting entities, not necessarily the location of sales (see table 9 for sales data, by State). Specific districts include importers for which district assignations were possible. 6Data are rounded (unit values to the nearest $0.50) because they include estimates.7For 2009, data for Northern Texas are included with those for Southern Texas.8For 2009, data for Northern California, Oregon, and Washington are included with those for Southern California.9Importers for which district assignations were not possible.10Data may not add to totals shown because of independent rounding.11Shipments are based on an annual survey of plants and importers; may differ from totals in table 9, which are based on consolidated monthly data.

16.20 U.S. GEOLOGICAL SURVEY MINERALS YEARBOOK—2009
TABLE 13AVERAGE MILL NET VALUE OF CEMENT SOLD IN THE UNITED STATES1, 2
(Dollars per metric ton)
Portland cement Masonry AllYear Gray White3 Total cement cement
2008 101.00 221.50 102.00 141.00 103.502009 96.50 211.00 97.50 136.50 99.001Values are average of sales to final customers, free on board the plant or independently reportingterminal. Values include any bagging charges, but exclude delivery charges to customers or to exterminal terminals. Data exclude Puerto Rico.2Data are rounded to the nearest $0.50 per metric ton because they contain estimates.3Data for white cement include a component of resales showing significant price markups.
TABLE 14PORTLAND CEMENT SHIPMENTS IN 2009, BY DISTRICT AND TYPE OF CUSTOMER1
(Thousand metric tons)
Oil well,Ready- Concrete Building mining, Governmentmixed product material waste and
District2 concrete manufacturers Contractors dealers stabilization other3 Total4, 5
Maine and New York 1,930 288 77 220 -- 60 2,580Pennsylvania, eastern 1,750 739 182 206 -- 115 2,995Pennsylvania, western 625 159 113 12 7 32 949Illinois 1,390 182 164 25 164 91 2,014Indiana 1,480 254 157 42 6 11 1,951Michigan 3,300 387 309 80 14 29 4,114Ohio 442 71 58 10 1 -- 582Iowa, Nebraska, South Dakota 2,520 301 418 32 51 62 3,382Kansas 1,250 173 96 49 38 19 1,627Missouri 3,080 390 579 56 64 47 4,219Florida 2,640 783 261 98 -- 6 3,790Georgia, Maryland, Virginia, West Virginia 2,970 702 231 124 5 106 4,141South Carolina 1,250 297 116 37 3 123 1,826Alabama 2,460 458 370 111 15 99 3,515Kentucky, Mississippi, Tennessee 1,480 220 90 61 23 14 1,885Arkansas and Oklahoma 1,490 90 530 103 75 16 2,300Texas, northern 2,870 367 662 114 456 84 4,557Texas, southern 3,150 441 598 220 315 6 4,730Arizona and New Mexico 1,680 310 125 38 18 2 2,173Colorado and Wyoming 1,410 132 170 52 142 28 1,932Idaho, Montana, Nevada, Utah 1,440 157 137 70 217 43 2,063Alaska and Hawaii 317 61 9 18 -- -- 406California 4,930 1,150 346 306 89 20 6,835Oregon and Washington 1,280 186 83 73 24 4 1,651Importers6 2,020 272 258 54 49 99 2,747
Total5 49,100 8,570 6,140 2,210 1,780 1,120 69,000Puerto Rico 504 91 5 377 -- -- 978
Grand total5 49,700 8,660 7 6,150 8 2,590 1,780 9 1,120 69,900-- Zero.1Includes imported cement and cement made from imported clinker. Except for district totals, data have been rounded to three significant digits, but are likelyaccurate to only two significant digits. District totals are likely accurate to no more than three significant digits.2District is the location of the reporting entity, not the location of sales (see table 9 for sales data, by State). Specific districts include shipments by importersfor which district assignations were possible.3Includes shipments to miscellaneous customer types and for which customer types were not specified.4District totals are unrounded except in accord with table 11.5Data may not add to totals shown because of independent rounding.6Shipments by importers for which district assignations were not possible.7Grand total shipments to concrete product manufacturers include brick and block—3,090; precast and prestressed—2,330; pipe—929; and other or unspecified—2,300.8Grand total shipments to contractors include airport—156; road paving—2,910; soil cement—1,575; and other or unspecified—1,500.9Grand total shipments include oil well drilling—1,380; mining—228; and waste stabilization—173.

CEMENT—2009 16.21
TABLE 15PORTLAND CEMENT SHIPMENTS IN THE UNITED STATES,
BY TYPE OF CEMENT1, 2, 3
(Thousand metric tons)
Type4 2008 2009General use and moderate heat (Types I and II)5, 6 73,600 55,000High early strength (Type III) 3,450 2,460Sulfate resisting (Type V)5 11,800 8,610Block 509 167Oil well 1,470 846White7 823 577Blended:8
Portland, natural pozzolans 38 34Portland, ground granulated blast furnace slag 981 580Portland, fly ash 381 357Portland, other pozzolans9 563 325
Total blended10 1,960 1,300Expansive and regulated fast setting 36 13Miscellaneous11 (12) 27
Grand total10 93,600 69,0001Includes sales of imported cement. Excludes Puerto Rico.2Data are rounded to no more than three significant digits.3Gray portland-type cements unless otherwise specified.4Sold mostly under specifications ASTM C–150, ASTM C–595, and ASTM C–1157.5Type II/V and similar sulfate-resisting cement hybrids are included within Type V.6Includes ASTM C–1157 general use cements that contain no pozzolans.7White or colored portland-type cements. Most are Types I or II but may include Types III and V and block cements.8Cements sold under ASTM C–590 and those under ASTM C–1157 that contain pozzolans.9Includes blends with cement kiln dust, silica fume, or other pozzolans, and blends containing multiple pozzolans.10Data may not add to totals shown because of independent rounding.11Includes low heat (Type IV), waterproof, and other portland-type cements.12Less than ½ unit.

16.22 U.S. GEOLOGICAL SURVEY MINERALS YEARBOOK—2009
TABLE 16U.S. EXPORTS OF HYDRAULIC CEMENT AND CLINKER, BY COUNTRY1
(Thousand metric tons and thousand dollars)
2008 2009Country Quantity Value2 Quantity Value2
United States:Angola 1 183 2 323Anguilla 1 42 4 255Aruba 1 352 2 336Bahamas 28 3,853 48 5,628Barbados 1 153 (3) 61Belize 1 224 36 1,513Bermuda 16 1,430 (3) 224Brazil 1 136 (3) 39Canada 711 82,814 674 79,836Cayman Islands 3 293 (3) 95China 1 354 (3) 133Colombia 1 675 1 680Costa Rica 1 89 (3) 19Dominica -- -- 1 12Dominican Republic 3 322 2 219Greece 7 352 15 729Haiti 10 726 1 62Hong Kong (3) 98 1 326Ireland (3) 101 4 225Jamaica (3) 25 26 2,737Japan (3) 26 1 225Mexico 23 4,540 23 5,915Netherlands Antilles 1 187 1 196Nicaragua 1 414 (3) 3Niger 2 114 -- --Pakistan (3) 3 1 43Panama 3 413 28 3,794Peru 1 255 1 198Russia (3) 8 1 47Saudi Arabia 1 259 1 844St. Christopher and Nevis (3) 133 2 102Sweden 1 90 1 77Taiwan 1 366 (3) 149Turks and Caicos Islands 1 267 (3) 55Other 5 r 3,169 r 5 2,230
Total4 823 102,466 884 107,330Puerto Rico:
Anguilla 12 846 -- --British Virgin Islands 13 1,778 15 1,807Netherlands Antilles 1 332 (3) 5Turks and Caicos Islands 8 545 1 152Other 1 r 131 r (3) 30
Total4 34 3,631 16 1,994Grand total4 858 106,097 900 109,323
rRevised. -- Zero.1Includes portland and masonry cements.2Free alongside ship value. The value of exports at the U.S. seaport or border point of export is based on the transaction price, including inland freight, insurance, and other charges incurred in placing the merchandise alongside the carrier. The value excludes the cost of loading.3Less than ½ unit.4Data may not add to totals shown because of independent rounding.
Source: U.S. Census Bureau.

CEMENT—2009 16.23
TABLE 17U.S. IMPORTS FOR CONSUMPTION OF HYDRAULIC CEMENT AND CLINKER,
BY COUNTRY1
(Thousand metric tons and thousand dollars)
2008 2009Value Value
Country Quantity Customs2 C.i.f.3 Quantity Customs2 C.i.f.3
United States:Algeria 4 316 520 14 1,576 2,123Brazil 36 2,780 3,225 -- -- --Canada 4,104 338,225 356,325 3,426 272,829 291,298China 2,020 103,055 164,401 608 35,251 50,161Colombia 964 67,117 90,608 654 39,799 56,216Croatia 34 10,048 13,061 15 5,687 6,890Denmark 99 9,768 14,898 69 9,924 12,302Dominican Republic 11 786 1,082 4 307 381Egypt 57 4,873 7,331 55 6,345 7,965France 108 22,266 24,999 65 20,373 21,607Germany 1 464 564 (4) 265 340Greece 213 11,717 18,514 186 10,705 12,429India 1 98 153 1 151 209Japan 6 773 1,038 1 523 654Korea, Republic of 1,229 50,550 85,899 855 34,694 56,700Mexico 1,071 84,714 99,673 366 35,342 39,132Netherlands 4 3,894 4,800 2 1,925 2,539Norway 20 897 897 -- -- --Peru 92 4,727 7,509 -- -- --Sweden 261 13,192 24,583 74 3,821 7,074Taiwan 855 36,424 55,867 254 11,332 16,677Thailand 77 5,165 7,909 21 2,594 3,801Turkey 96 5,257 12,201 95 7,858 12,220United Kingdom 4 1,712 2,076 1 153 281Other (4) r 69 r 74 r (4) 138 148
Total5 11,365 778,888 998,208 6,767 501,592 601,148Puerto Rico:
China 78 3,270 5,701 (4) 5 7Colombia 4 529 665 5 674 862Korea, Republic of 54 3,861 5,812 27 1,350 2,322Mexico 17 1,981 2,808 14 1,641 2,216Spain (4) 25 33 81 5,694 7,064Other (4) 14 r 18 r (4) 169 174
Total5 153 9,681 15,037 127 9,532 12,645Grand total5 11,519 788,569 1,013,244 6,894 511,125 613,793
rRevised. -- Zero.1Includes portland, masonry, and other hydraulic cements.2Customs value. The price actually paid or payable for merchandise when sold for exportation to the United States, excluding U.S. import duties, freight, insurance, and other charges incurred in bringing the merchandise to the United States.3Cost, insurance, and freight. The import value represents the customs value plus insurance, freight, and other delivery charges to the first port of entry.4Less than ½ unit.5Data may not add to totals shown because of independent rounding.
Source: U.S. Census Bureau.

16.24 U.S. GEOLOGICAL SURVEY MINERALS YEARBOOK—2009
TABLE 18U.S. IMPORTS FOR CONSUMPTION OF HYDRAULIC CEMENT
AND CLINKER, BY CUSTOMS DISTRICT AND COUNTRY1
(Thousand metric tons and thousand dollars)
2008 2009Value Value
Customs district and country Quantity Customs2 C.i.f.3 Quantity Customs2 C.i.f.3
United States:Anchorage, AK:
Canada 7 419 1,479 9 745 2,267China 1 98 106 15 1,036 1,561Japan 5 187 282 -- -- --Korea, Republic of 102 4,471 8,689 72 3,165 5,658Taiwan -- -- -- 16 1,047 1,066
Total4 114 5,175 10,556 112 5,994 10,552Baltimore, MD:
Germany (5) 13 15 -- -- --Netherlands (5) 229 259 (5) 42 48United Kingdom -- -- -- (5) 20 21
Total4 (5) 242 274 (5) 62 70Boston, MA, Canada 45 2,537 4,584 77 4,196 6,824Buffalo, NY:
Canada 707 57,564 60,681 574 48,103 52,028France (5) 60 61 -- -- --Germany (5) 3 3 -- -- --Japan -- -- -- (5) 13 13
Total4 708 57,627 60,744 574 48,116 52,041Charleston, SC:
China -- -- -- (5) 5 9Germany -- -- -- (5) 12 13Netherlands -- -- -- (5) 41 47
Total4 -- -- -- (5) 59 70Chicago, IL:
Croatia (5) 38 53 -- -- --Denmark (5) 15 16 -- -- --France (5) 3 25 -- -- --Germany (5) 2 3 -- -- --Japan (5) 220 259 (5) 107 117Netherlands (5) 231 296 (5) 92 141Poland (5) 41 44 (5) 19 22
Total4 1 551 696 (5) 218 280Cleveland, OH:
Canada 485 40,608 41,506 493 34,399 36,894China (5) 13 17 -- -- --Croatia 1 261 354 -- -- --Netherlands (5) 37 57 (5) 137 158Poland -- -- -- (5) 21 24
Total4 485 40,919 41,935 494 34,558 37,077Columbia-Snake, OR-WA
Canada 135 8,012 8,756 55 4,256 4,503China 653 26,857 44,713 237 13,016 19,757Thailand (5) 2 4 -- -- --
Total4 788 34,872 53,473 292 17,272 24,259See footnotes at end of table.

CEMENT—2009 16.25
TABLE 18—ContinuedU.S. IMPORTS FOR CONSUMPTION OF HYDRAULIC CEMENT
AND CLINKER, BY CUSTOMS DISTRICT AND COUNTRY1
(Thousand metric tons and thousand dollars)
2008 2009Value Value
Customs district and country Quantity Customs2 C.i.f.3 Quantity Customs2 C.i.f.3
United States—Continued:Dallas, Fort Worth, TX:
Italy (5) 3 4 -- -- --Netherlands -- -- -- (5) 34 95
Total4 (5) 3 4 (5) 34 95Detroit, MI:
Canada 837 76,193 77,285 841 66,897 68,458China -- -- -- (5) 41 42Germany (5) 5 5 -- -- --Netherlands (5) 260 356 (5) 60 100
Total4 838 76,457 77,645 841 66,998 68,600El Paso, TX, Mexico 384 31,680 35,277 275 23,449 25,875Great Falls, MT:
Canada 9 468 r 503 (5) 20 21China (5) 24 r 32 (5) 143 171Germany (5) 13 21 -- -- --Japan -- -- -- (5) 2 2United Kingdom -- -- -- (5) 23 33
Total4 9 505 r 556 (5) 189 227Honolulu, HI:
China 10 705 1,597 (5) 14 47Korea, Republic of -- -- -- 84 3,569 7,329Taiwan 373 16,848 25,388 188 8,281 12,233Thailand (5) 3 6 3 188 552
Total4 383 17,556 26,991 276 12,052 20,160Houston-Galveston, TX:
Algeria 1 94 122 6 728 1,022China 93 4,219 6,940 2 186 274Colombia 403 30,692 39,484 235 14,822 20,624Croatia (5) 11 12 -- -- --Denmark -- -- -- (5) 3 3Egypt 22 1,892 2,774 28 3,230 3,988France (5) 69 79 (5) 44 50Germany (5) 109 133 (5) 78 93Korea, Republic of 799 31,413 51,352 472 19,219 30,821Sweden 108 6,076 8,957 -- -- --Taiwan 449 16,972 27,229 49 1,968 3,198Turkey 1 58 89 -- -- --
Total4 1,876 91,605 137,171 793 40,278 60,074Laredo, TX, Mexico 133 15,994 16,939 85 11,467 12,646Los Angeles, CA:
Algeria 2 179 328 -- -- --China 505 23,241 42,027 21 2,408 2,876Colombia (5) 28 43 -- -- --
See footnotes at end of table.

16.26 U.S. GEOLOGICAL SURVEY MINERALS YEARBOOK—2009
TABLE 18—ContinuedU.S. IMPORTS FOR CONSUMPTION OF HYDRAULIC CEMENT
AND CLINKER, BY CUSTOMS DISTRICT AND COUNTRY1
(Thousand metric tons and thousand dollars)
2008 2009Value Value
Customs district and country Quantity Customs2 C.i.f.3 Quantity Customs2 C.i.f.3
United States—Continued:Los Angeles, CA—Continued:
Croatia (5) 109 180 (5) 220 273Egypt 11 964 1,667 1 68 72Germany (5) 188 206 (5) 53 72India -- -- -- (5) 24 25Japan (5) 36 51 -- -- --Lithuania (5) 13 13 (5) 26 28Thailand 19 2,285 3,521 12 1,629 2,202United Kingdom (5) 12 12 (5) 80 194
Total4 538 27,055 48,048 35 4,508 5,741Miami, FL:
Algeria 1 43 70 7 848 1,101China (5) 23 36 (5) 41 73Colombia 11 1,464 1,837 6 790 997Denmark 3 414 529 -- -- --Egypt 23 1,971 2,811 19 2,197 2,807Italy (5) 2 2 -- -- --Mexico 98 9,869 12,580 5 410 590Sweden 239 10,596 20,770 73 3,270 6,455Turkey -- -- -- 74 6,618 9,585
Total4 375 24,382 38,636 185 14,174 21,609Minneapolis, MN:
Canada 154 17,524 17,541 113 12,105 12,117China -- -- -- (5) 15 15Denmark (5) 6 6 -- -- --United Kingdom (5) 11 11 (5) 15 15
Total4 154 17,541 17,558 113 12,136 12,148Mobile, AL, Mexico -- -- -- (5) 7 12New Orleans, LA:
China 26 5,076 6,461 5 1,062 1,269Croatia 27 7,929 9,887 15 5,410 6,542Korea, Republic of 45 1,506 2,412 34 1,273 1,961Peru 62 3,205 4,652 -- -- --Taiwan -- -- -- 1 36 180Turkey 95 5,199 12,112 21 1,240 2,634
Total4 256 22,915 35,525 75 9,021 12,586New York, NY:
Colombia 16 777 1,650 (5) 68 116Croatia (5) 9 11 (5) 57 75Denmark 38 4,440 6,564 24 2,804 3,655France -- -- -- 3 107 110Germany (5) 14 19 (5) 22 23
See footnotes at end of table.

CEMENT—2009 16.27
TABLE 18—ContinuedU.S. IMPORTS FOR CONSUMPTION OF HYDRAULIC CEMENT
AND CLINKER, BY CUSTOMS DISTRICT AND COUNTRY1
(Thousand metric tons and thousand dollars)
2008 2009Value Value
Customs district and country Quantity Customs2 C.i.f.3 Quantity Customs2 C.i.f.3
United States—Continued:New York, NY—Continued:
Greece 213 11,717 18,514 186 10,705 12,429Netherlands (5) 336 398 (5) 79 105Norway 20 897 897 -- -- --Portugal -- -- -- (5) 34 35Sweden 3 1,670 1,856 -- -- --United Kingdom (5) 41 72 -- -- --
Total4 291 19,902 29,982 214 13,876 16,550Nogales, AZ, Mexico 348 21,095 25,919 (5) 9 10Norfolk, VA:
Canada 113 8,044 8,940 53 5,003 5,373China (5) 9 11 -- -- --Egypt -- -- -- 3 389 482France 108 22,121 24,818 63 20,222 21,447Germany (5) 14 17 -- -- --Netherlands (5) 353 464 (5) 34 39Sweden (5) 79 89 1 551 619United Kingdom 4 1,647 1,980 -- -- --
Total4 225 32,267 36,319 120 26,198 27,961Ogdensburg, NY:
Canada 399 41,749 42,237 248 23,489 23,989Germany -- -- -- (5) 3 3South Africa -- -- -- (5) 2 2
Total4 399 41,749 42,237 248 23,494 23,994Pembina, ND
Canada 173 10,174 10,293 162 12,370 12,455France (5) 5 5 -- -- --
Total4 173 10,179 10,298 162 12,370 12,455Philadelphia, PA:
Belgium (5) 6 7 (5) 5 5China (5) 33 33 -- -- --Germany (5) 104 143 (5) 92 131Korea, Republic of 137 5,032 11,590 139 4,988 7,063Netherlands 1 1,275 1,463 1 814 937Thailand 48 1,629 2,379 -- -- --United Kingdom -- -- -- (5) 14 17
Total4 187 8,079 15,616 140 5,913 8,153Portland, ME, Canada 75 9,765 10,410 37 4,469 4,954Providence, RI:
Canada 80 4,572 8,488 62 4,069 6,273See footnotes at end of table.

16.28 U.S. GEOLOGICAL SURVEY MINERALS YEARBOOK—2009
TABLE 18—ContinuedU.S. IMPORTS FOR CONSUMPTION OF HYDRAULIC CEMENT
AND CLINKER, BY CUSTOMS DISTRICT AND COUNTRY1
(Thousand metric tons and thousand dollars)
2008 2009Value Value
Customs district and country Quantity Customs2 C.i.f.3 Quantity Customs2 C.i.f.3
United States—Continued:Providence, RI—Continued:
Colombia 48 2,502 3,909 -- -- --Peru 29 1,522 2,857 -- -- --
Total4 158 8,596 15,253 62 4,069 6,273San Diego, CA, Taiwan 13 515 517 -- -- --San Francisco, CA:
China 370 16,786 27,248 211 10,114 13,216Egypt 1 46 79 1 108 173France (5) 9 12 -- -- --India 1 98 153 1 127 184Netherlands (5) 18 37 -- -- --Taiwan 20 1,036 1,679 -- -- --Thailand 9 1,150 1,806 6 777 1,047
Total4 400 19,143 31,013 219 11,126 14,620Savannah, GA:
China (5) 10 12 -- -- --Colombia 258 17,005 23,652 221 12,861 18,609Egypt -- -- -- 3 354 443Japan -- -- -- (5) 2 2Netherlands 1 537 713 (5) 223 364Portugal -- -- -- (5) 31 31Thailand 1 96 194 -- -- --
Total4 259 17,649 24,570 224 13,471 19,450Seattle, WA:
Canada 757 45,848 48,079 611 42,802 44,572China 362 25,961 35,167 117 7,158 10,833Japan 1 331 447 1 398 519Korea, Republic of 123 6,170 9,308 54 2,480 3,869Netherlands (5) 188 257 (5) 40 61Taiwan (5) 1,053 1,055 -- -- --
Total4 1,243 79,551 94,312 783 52,879 59,853St. Albans, VT:
Canada 126 14,748 15,543 89 9,904 10,571Germany -- -- -- (5) 4 4
Total4 126 14,748 15,543 89 9,907 10,575St. Louis, MO:
China -- -- -- (5) 11 18Croatia 6 1,690 2,564 -- -- --Netherlands (5) 430 500 (5) 329 442
Total4 6 2,120 3,064 (5) 340 459See footnotes at end of table.

CEMENT—2009 16.29
TABLE 18—ContinuedU.S. IMPORTS FOR CONSUMPTION OF HYDRAULIC CEMENT
AND CLINKER, BY CUSTOMS DISTRICT AND COUNTRY1
(Thousand metric tons and thousand dollars)
2008 2009Value Value
Customs district and country Quantity Customs2 C.i.f.3 Quantity Customs2 C.i.f.3
United States—Continued:Tampa, FL:
Brazil 36 2,780 3,225 -- -- --Colombia 39 2,103 2,865 58 3,225 4,557Denmark 58 4,893 7,782 45 7,117 8,644Korea, Republic of 24 1,958 2,548 -- -- --Spain (5) 4 4 -- -- --Sweden 19 847 1,868 -- -- --
Total4 175 12,584 18,292 103 10,342 13,201U.S. Virgin Islands:
Colombia 2 213 219 -- -- --Dominican Republic 11 786 1,082 4 307 381
Total4 13 998 1,300 4 307 381Wilmington, NC, Colombia 186 12,333 16,952 134 8,033 11,313
U.S. total4 11,365 778,888 998,208 6,767 501,592 601,148Puerto Rico (San Juan):
China 78 3,270 5,701 (5) 5 7Colombia 4 529 665 5 674 862Dominican Republic -- -- -- (5) 169 174Korea, Republic of 54 3,861 5,812 27 1,350 2,322Mexico 17 1,981 2,808 14 1,641 2,216Peru (5) 14 18 -- -- --Spain (5) 25 33 81 5,694 7,064
Total4 153 9,681 15,037 127 9,532 12,645Grand total4 11,519 788,569 1,013,244 6,894 511,125 613,793
rRevised. -- Zero.1Includes all varieties of hydraulic cement and clicker.2Customs value. The price actually paid or payable for merchandise when sold for exportation to the United States, excluding U.S. import duties,freight, insurance, and other charges incurred in bringing the merchandise to the United States. 3Cost, insurance, and freight. The import value represents the customs value plus insurance, freight, and other delivery charges to the first port of entry.4Data may not add to totals shown because of independent rounding.5Less than ½ unit.
Source: U.S. Census Bureau.

16.30 U.S. GEOLOGICAL SURVEY MINERALS YEARBOOK—2009
TABLE 19U.S. IMPORTS FOR CONSUMPTION OF GRAY PORTLAND CEMENT, BY COUNTRY
(Thousand metric tons and thousand dollars)
2008 2009Value Value
Country Quantity Customs1 C.i.f.2 Quantity Customs1 C.i.f.2
United States:Brazil 36 2,780 3,225 -- -- --Canada 3,294 259,073 275,818 2,642 205,197 222,340China 1,906 81,907 137,987 573 30,463 44,369Colombia 891 60,180 81,614 636 37,333 52,800Dominican 11 786 1,082 4 307 381France (3) 27 34 3 107 110Greece 213 11,717 18,514 186 10,705 12,429Japan 5 187 282 (3) 5 5Korea, Republic of 1,227 50,410 85,539 854 34,641 56,563Mexico 744 45,002 55,076 185 11,770 13,305Norway 20 897 897 -- -- --Peru 92 4,727 7,509 -- -- --Sweden 257 11,443 22,638 73 3,270 6,455Taiwan 855 35,371 54,813 254 11,332 16,677Thailand 48 1,629 2,379 3 188 552United Kingdom 1 65 96 (3) 46 50Other (3) r 106 r 126 r (3) 164 269
Total4, 5 9,599 566,307 747,629 5,414 345,529 426,307Puerto Rico:
China 78 3,270 5,701 -- -- --Korea, Republic of 54 3,861 5,812 27 1,350 2,322Spain (3) 6 8 81 5,694 7,064
Total4, 5 132 7,137 11,521 108 7,044 9,386Grand total4, 5 9,731 573,443 759,150 5,521 352,572 435,693
rRevised. -- Zero.1The price actually paid or payable for merchandise when sold for exportation to the United States, excluding U.S. import duties, freight, insurance, and other charges incurred in bringing the merchandise to the United States.2Cost, insurance, and freight. The import value represents the customs value plus insurance, freight, and other delivery charges to the first port of entry.3Less than ½ unit.4Data may not add to totals shown because of independent rounding.5Total imports do not include gray portland cement that was misregistered by importers under the white cement tariff code and which has been included in table 20.
Source: U.S. Census Bureau.

CEMENT—2009 16.31
TABLE 20U.S. IMPORTS FOR CONSUMPTION OF WHITE CEMENT, BY COUNTRY
(Thousand metric tons and thousand dollars)
2008 2009Value Value
Country Quantity Customs1 C.i.f.2, 3 Quantity Customs1 C.i.f.2, 3
United States:Algeria 4 316 520 14 1,576 2,123Canada 296 40,213 41,086 251 33,932 34,681China 88 15,869 19,697 29 3,396 4,125Colombia 58 6,491 8,276 18 2,466 3,415Denmark 99 9,747 14,875 69 9,921 12,300Egypt 55 4,724 7,087 53 6,028 7,628India 1 98 153 1 130 178Korea, Republic of 2 140 360 2 53 137Mexico 237 29,222 32,871 113 15,822 17,357Thailand 29 3,536 5,530 18 2,406 3,249Turkey 96 5,257 12,201 95 7,858 12,220United Kingdom -- -- -- 1 99 219Other (4) r 1,056 r 1,058 r (4) 7 7
Total5 964 6 116,669 143,715 664 6 83,693 97,638Puerto Rico:
Colombia 4 529 665 5 674 862Mexico 17 1,981 2,808 14 1,641 2,216Other (4) r 14 r 18 r -- -- --
Total5 21 2,525 3,491 19 2,315 3,078Grand total5 985 6 119,194 147,206 683 6 86,008 100,715
rRevised. -- Zero.1Customs value. The price actually paid or payable for merchandise when sold for exportation to the United States, excluding U.S. import duties, freight, insurance, and other charges incurred in bringing the merchandise to the United States.2Cost, insurance, and freight. The import value represents the customs value plus insurance, freight, and other delivery charges to the first port of entry.3Values of less than $90.00 (c.i.f.) per metric ton likely indicate the mistaken total or partial inclusion of data for gray portland or similar cement or clinker. This error happens when the importer records the wrong tariff number with the U.S. Customs Service. Values that exceed $200 per ton likely indicate misidentified specialty cement, not white cement.4Less than ½ unit.5Data may not add to totals shown because of independent rounding.6Total imports of white cement include substantial quantities of gray cement that were misregistered by importers under the whitecement tariff code.
Source: U.S. Census Bureau.

16.32 U.S. GEOLOGICAL SURVEY MINERALS YEARBOOK—2009
TABLE 21U.S. IMPORTS FOR CONSUMPTION OF CLINKER, BY COUNTRY1
(Thousand metric tons and thousand dollars)
2008 2009Value Value
Country Quantity Customs2 C.i.f.3 Quantity Customs2 C.i.f.3
United States:Canada 477 35,048 35,310 489 30,192 30,459China 19 3,414 4,285 3 709 855Colombia 16 446 718 -- -- --Egypt 2 149 244 3 318 337France 107 20,976 23,550 62 19,571 20,732Other (4) 21 33 -- -- --
Total5 621 60,054 64,141 556 50,789 52,383 -- Zero.1For all types of hydraulic cement.2Customs value. The price actually paid or payable for merchandise when sold for exportation to the United States, excludingU.S. import duties, freight, insurance, and other charges incurred in bringing in the merchandise to the United States.3Cost, insurance, and freight. The import value represents the customs value plus insurance, freight, and other delivery charges to the first port of entry.4Less than ½ unit.5Data may not add to totals shown because of independent rounding.
Source: U.S. Census Bureau.

CEMENT—2009 16.33
Country 2005 2006 2007 2008 2009e
Afghanistane 60 50 50 50 50Albania 489 525 889 737 r 740Algeria 12,800 14,702 15,886 17,398 r 18,000Angola 1,315 1,373 1,400 e 1,780 r 1,800Argentina 7,595 8,929 9,602 9,703 10,000Armenia 605 625 722 770 750Australiae 8,475 r, 3 9,000 9,500 r 9,000 r 8,500Austria 4,560 4,852 5,203 5,309 4,600Azerbaijan 1,538 1,622 1,691 r 1,595 r 1,283 3
Bahrain 400 400 400 438 r 800Bangladeshe 5,100 5,100 5,100 5,000 5,000Barbados 341 338 294 300 e 300Belarus 3,131 3,495 3,820 e 4,219 4,350 3
Belgium 7,594 8,192 8,200 e 8,200 e 8,200Benine 250 1,489 3 1,550 3 1,500 r 1,500Bhutane 170 180 180 180 r 180Bolivia 1,440 1,636 1,739 1,985 r 2,292 3
Bosnia and Herzegovina 1,026 1,226 1,283 1,406 1,074 3
Brazil 38,705 r 41,895 r 46,551 r 51,970 r 51,748 p, 3
Bruneie 266 3 240 200 240 r 220Bulgaria 3,618 4,093 4,413 4,903 r 2,662 3
Burkina Fasoe 30 30 30 30 30Burma4 543 570 608 676 670 3
Cambodia -- -- 87 772 r 774 3
Cameroone 1,000 1,000 1,000 1,000 1,000Canada 14,179 14,336 15,078 13,672 10,985 3
Chile 3,999 4,112 4,440 4,622 3,876 3
China 1,068,850 1,236,770 1,361,170 1,400,000 r 1,629,000 p, 3
Colombia 9,959 10,038 5 11,068 5 10,456 5 10,000Congo (Brazzaville)e 100 3 100 100 100 r 100Congo (Kinshasa) 521 r 519 r 530 r 411 r 444 3
Costa Rica 2,000 r, e 1,900 r 2,300 r 2,500 r 2,500Côte d’Ivoiree 650 650 650 650 650Croatia 3,481 3,598 3,587 r 3,637 r 2,800Cuba 1,567 1,705 1,805 1,707 r 1,700Cyprus 1,805 1,786 1,873 1,870 e 1,800Czech Republic 3,978 4,239 4,899 4,710 r 3,637 3
Denmark 2,120 2,115 2,100 e 2,100 e 2,000Dominican Republic 2,779 3,777 4,100 e 4,000 e 3,000Ecuador 3,690 4,110 4,420 5,493 r 5,000Egypt 32,458 36,200 38,400 40,000 e 46,500El Salvador 1,131 1,311 1,300 e 1,300 e 1,300Eritreae 45 45 45 45 45Estonia 726 849 937 808 326 3
Ethiopia 1,569 1,731 r 1,626 r 1,834 r 2,300Fijie 143 3 143 145 143 110Finland 1,357 1,685 1,743 1,745 1,750France 21,277 22,540 22,300 e 21,700 18,300French Guianae 60 60 60 62 62Gabone 260 260 229 3 230 230Georgiae 450 450 450 450 450
TABLE 22HYDRAULIC CEMENT: WORLD PRODUCTION, BY COUNTRY1, 2
(Thousand metric tons)
See footnotes at end of table.

16.34 U.S. GEOLOGICAL SURVEY MINERALS YEARBOOK—2009
Country 2005 2006 2007 2008 2009e
Germany 31,009 33,630 33,382 33,581 30,441 3
Ghanae 1,800 r 1,800 r 1,800 r 1,800 r 1,800Greece 15,166 15,674 16,667 16,500 e 16,000Guadeloupee 240 230 230 230 230Guatemalae 2,400 2,500 2,500 2,500 1,500Guineae -- r -- r -- r -- r --Haitie 300 300 300 300 300Hondurase 1,384 3 1,800 1,800 1,800 1,800Hong Konge 1,005 3 1,010 1,000 1,000 1,000Hungary 3,371 3,724 3,552 3,544 3,200Iceland 132 141 90 e 100 e 100Indiae 145,000 160,000 170,000 185,000 r 205,000Indonesiae 33,917 3 35,000 36,000 36,000 r 40,000Irane 32,650 3 35,300 41,000 r 44,400 3 50,000Iraqe 3,000 3,500 4,500 6,453 r, 3 8,000Ireland 5,083 4,981 5,000 5,000 e 5,000Israel 5,093 5,089 5,000 e 4,819 r 4,759 3
Italy 40,284 47,814 47,542 43,030 36,317 3
Jamaica 845 761 592 725 r 700Japan 69,629 69,942 67,685 62,810 54,800 3
Jordan 4,046 3,967 4,051 4,375 r 5,000Kazakhstan 3,975 4,880 5,699 5,223 5,000Kenya 2,123 2,174 2,546 2,829 r 3,320 3
Korea, Northe 5,700 6,160 6,130 6,415 r, 3 6,400Korea, Republic of 51,391 53,971 52,182 r 51,653 r 50,127 3
Kosovo6 450 450 e 470 590 600Kuwaite 2,145 3 2,200 2,200 2,200 2,000Kyrgyzstan 973 r 1,060 r 1,230 r 1,218 r 1,100Laose 250 400 400 400 400Latviae 280 280 300 310 300Lebanon 4,600 4,400 4,900 e 5,000 e 5,000Liberia 144 155 157 94 r 95Libya 3,621 5,300 e 5,206 5,509 r 6,000Lithuania 832 1,065 1,105 1,100 e 1,100Luxembourge 760 3 800 780 780 780Macedonia 887 r 924 r 945 r 916 r 909 3
Madagascare 150 150 270 3 270 240Malawi 166 188 185 240 e 240Malaysia 17,860 18,400 e 19,480 19,000 r, e 18,500Martiniquee 220 220 220 220 220Mauritania 300 e 374 410 446 r 500Mexico 37,452 40,362 40,670 47,609 35,160 3
Moldova 641 837 800 e 750 e 700Mongolia 112 141 180 r 269 r 140Moroccoe 11,000 11,000 11,000 11,000 12,000Mozambiquee 490 600 800 730 830Nepale, 4 290 295 300 295 r 300Netherlands 2,496 2,790 2,700 e 2,700 e 2,700New Caledonia 119 133 134 e 134 e 130New Zealande 1,100 1,120 3 1,100 1,100 1,100Nicaraguae 530 3 530 530 530 530
(Thousand metric tons)
See footnotes at end of table.
TABLE 22—ContinuedHYDRAULIC CEMENT: WORLD PRODUCTION, BY COUNTRY1, 2

CEMENT—2009 16.35
Country 2005 2006 2007 2008 2009e
Nigere 59 r 83 r 62 r 42 r 40Nigeriae 2,700 3,300 4,700 5,000 4,500Norway 1,613 1,695 1,700 e 1,700 e 1,650Oman 2,686 3,611 3,880 3,991 r 4,000Pakistane 17,000 20,652 3 27,000 r 31,000 r 32,000Panamae 1,050 3 1,050 1,050 1,050 1,050Paraguaye 550 600 600 600 600Peru 5,107 5,782 6,231 6,922 6,862 3
Philippines 15,494 12,033 13,048 13,369 r 14,865 3
Poland 12,646 14,688 17,120 17,207 15,537 3
Portugal 8,438 8,340 12,631 12,650 r 12,700Qatar 1,500 1,568 2,500 e 3,500 e 4,150Réunione 380 400 400 400 375Romania 7,032 8,253 10,000 r, e 11,000 r, e 7,800Russia 48,500 54,700 59,900 53,600 44,300 3
Rwanda 101 103 103 103 r 100Saudi Arabia 26,064 27,056 30,369 31,823 40,000Senegal 2,623 2,884 3,152 3,084 r 3,000Serbia7 2,276 8 2,565 2,677 2,843 2,232 3
Sierra Leone 172 234 236 254 r 250Slovakia 3,499 3,593 3,718 4,157 3,011 3
Slovenia 1,114 1,269 1,300 e 1,300 e 1,000South Africa, sales9 11,464 12,658 13,651 13,341 11,500Spain, including Canary Islands 50,347 54,033 54,720 42,088 29,505 3
Sri Lankae 1,500 1,600 1,700 1,800 1,900Sudan 331 202 326 370 r, e 1,000Surinamee 65 65 65 65 65Sweden 2,709 2,952 2,950 2,900 e 2,950Switzerland 4,022 4,040 4,000 e 4,000 e 4,000Syria 4,700 e 4,804 5,104 5,336 5,605 3
Taiwan 19,891 19,294 18,957 17,330 15,918 3
Tajikistan 253 282 313 190 r 190Tanzania 1,366 1,370 r 1,630 r 1,756 r 1,700Thailand 37,872 39,408 35,668 31,651 r 31,181 3
Togoe 800 800 800 800 800Trinidad and Tobago 686 883 1,992 r 958 r 950Tunisia 6,691 6,932 7,052 7,559 8,000Turkey 42,787 47,499 49,553 54,027 r 53,973 3
Turkmenistane 650 800 900 900 900Ugandae 630 630 650 650 650Ukraine 12,183 13,732 15,000 14,918 9,496 3
United Arab Emiratese 10,000 r 11,000 r 12,000 r 13,200 r 16,000United Kingdom 11,216 11,471 r 11,887 r 10,071 r 7,622 3
United States, including Puerto Rico10 100,903 99,712 96,850 87,610 64,864 3
Uruguaye 620 620 620 620 620Uzbekistan 5,068 5,700 e 6,500 6,600 e 6,600Venezuelae 5,800 7,200 9,000 9,000 9,000Vietnam 30,808 32,690 37,102 r 40,009 r 47,900Yemen 1,550 1,470 1,728 3,000 e 4,000Zambiae 435 650 650 700 600See footnotes at end of table.
TABLE 22—ContinuedHYDRAULIC CEMENT: WORLD PRODUCTION, BY COUNTRY1, 2
(Thousand metric tons)

16.36 U.S. GEOLOGICAL SURVEY MINERALS YEARBOOK—2009
Country 2005 2006 2007 2008 2009e
Zimbabwee 600 700 400 400 300Total 2,350,000 2,610,000 2,810,000 2,850,000 r 3,040,000
eEstimated. pPreliminary. rRevised. -- Zero.
3Reported figure.
8Montenegro and Serbia formally declared independence in June 2006 from each other and dissolved their union. Montenegro has no cement plants.9Data have been adjusted to remove sales of cementitious materials other than finished cement. Material sales removed (mostly fly ash and ground granulated blast furnace slag) amounted, in metric tons, to: 2005—1,511,716; 2006—1,599,505; 2007—1,664,304; 2008—1,395,124; and 2009—1,200,000 (estimated).
2Table includes data available through July 23, 2010. Data may include clinker exports for some countries.
10Portland and masonry cements only.
4Data are for fiscal year ending March 31 of the following year.5Data for 2006–08 are for gray cement only; white cement output was likely to have been an additional 50,000 to 100,000 tons per year.6Not included in Serbia data.7Excludes Kosovo data.
1World totals and estimated data are rounded to no more than three significant digits; may not add to totals shown. Even where presented unrounded, reported data are thought to be accurate to no more than three significant digits. Data are from a variety of sources, including the European CementAssociation.
TABLE 22—ContinuedHYDRAULIC CEMENT: WORLD PRODUCTION, BY COUNTRY1, 2
(Thousand metric tons)
Top Related