


Languages
Pages
Legal


2009Annual Report
Trust Investment Bank Limited
Trust Investment Bank LimitedHead Office: 23-D/1-A, Gulberg III, Lahore (Pakistan).Telephones: +92-42-3240 4714-19 Fax: +92-42-3240 4720 Email: [email protected] www.trustbank.com.pk

01
Ann
ual R
epor
t 20
09
Contents
02 Vision & Mission Statement 03 Company Information04 Branch Network05 Notice of the Annual General Meeting 06 Director's Report12 Six Years Financial Summary13 Pattern of Shareholding14 Categories Of Shareholders15 Financial Statements16 Statement of Compliance with Code of Corporate Governance19 Review Report to the Members20 Auditors’ Report to the Members22 Balance Sheet23 Profit and Loss Account24 Cash Flow Statement26 Statement of Changes in Equity27 Notes to the Accounts73 Consolidated Financial Statement74 Auditors’ Report to the Members76 Consolidated Balance Sheet77 Consolidated Profit and Loss Account78 Consolidated Cash Flow Statement80 Consolidated Statement of Changes in Equity81 Consolidated Notes to the Accounts127 Form of Proxy

02
Trus
t In
vest
men
t B
ank
Ltd
Vision & Mission Statement
Our purpose is to help our clients make financial decisions with confidence. We use our resources to develop effective solutions and services for our clients.
Vision
We are determined to be the best financial services company. We focus on wealth, asset management, investment banking and securities businesses. We continually earn recognition and trust from clients, shareholders and staff through our ability to anticipate learn our shape our future. We share a common ambition to succeed by delivering quality in what we do. We foster a distinctive, meritocratic culture of ambition, performance and learning as this attracts, retains and develops the best talent for our company. By growing both our client and our talent team, we add sustainable value for our shareholders.
Our purpose is to help our clients meet their goals. Our goal is to achieve excellence in what we do as individuals and as a firm.
We will succeed if our ideas are the best: our execution of those ideas and our service to clients are second to none: and if we attract the best people and give them the encouragement and opportunity to develop their talents.
We will succeed if we are committed to an open environment that prizes diversity of opinion and encourages every one of us to independent thought and objectively.
We are stronger as a whole than as individuals, and we will succeed if we are collaborative, contributing members of the same team. We are each responsible for the well being of the firm, our integrity will not be compromised.
Mission
03
Ann
ual R
epor
t 20
09
Board of DirectorsMr. Asif Kamal .................................................Chairman/ Non - Executive DirectorMr. Humayun Nabi Jan ....................................Non- Executive DirectorMr. Khalid Niaz Khawaja..................................Non- Executive DirectorMr. Shafiq A. Khan...........................................Non- Executive DirectorMr. Ahmed Ali Riaz .........................................Non- Executive DirectorMr. Yusaf Saeed ..............................................Non-Executive DirectorMr. Shazib Masud............................................Non- Executive DirectorMr. Faqir Ejaz Asghar ......................................Chief Executive Officer
Company Information
Audit CommitteeMr. Humayun Nabi Jan (Chairman)Mr. Shazib MasudMr. Khalid Niaz Khawaja
Chief Financial OfficerMr. Imran Hameed
Company SecretaryMr. Awais Yasin
AuditorsKPMG Taseer Hadi & Co.Chartered Accountants
Legal AdvisorNawaz Kasuri & Rashdeen Law Chambers
Bankers to the CompanyThe Bank of Punjab LimitedFaysal Bank LimitedAllied Bank LimitedHabib Bank Limited Standard Chartered Bank LimitedAtlas Bank LimitedBank Al Habib LimitedHabib Metropolitan LimitedNIB Bank LimitedMCB Bank Limited
RegistrarsVision Consulting Limited1st Floor, 3-C, LDA Flats,Lawrence Road, LahoreTel: 042-36375531, 36375339Fax: 042-326374839
Registered Office & Head Office23-D/1-A, Gulberg-III, Lahore.Tel: 042-322404714-19Fax: 042-32404720Email: [email protected]: www.trustbank.com.pk

04
Trus
t In
vest
men
t B
ank
Ltd
Branch Network
Main Branch 35-A/II, Aziz Avenue, Canal Bank, Lahore.Ph. 042-5710988, 5875412-13 Fax. 042-5713453
Gujrat Branch Ground Floor, Kashmir Plaza, Ram Talai Road,Gujrat. Ph. 0533-510223 Fax 0533-510223
Sargodha Branch60/A Railway Road, Civil Lines (Opp. Solo hotel), Sargodha.Ph. 048-3213836Fax. 048-3740082
Jhelum Branch24-Civil Lines, Opp. Govt GirlsHigh School no. 1, Near Imam Bargah,Jhelum.Ph. 0544-625961Fax.0544-625972
Faisalabad BranchSaeed Arcade, 721-Batala ColonyFaisalabad.Ph. 041-8737431Fax. 041-8739707
Islamabad Branch Ground Floor,Kashmir Commercial Complex 54-E,Fazal-e-Haq Road,Blue Area, Islamabad. Ph. 051-2271544,2272330
Multan Branch1733-B-Ground Floor, LMQ Road,(Central Chungi 8-9 Highway), Multan.Ph. 061-6222008
Mandi Baha-ud-Din BranchNear Alvi Chowk,Mandi Baha-ud-Din.Ph. 0546509568
Gujranwala BranchOpp. Divisional Public School, SamaStop, GT Road, Gujranwala.Ph. 055-3733617Fax 055-3733618
Sialkot BranchKashmir Road, Near Meezan Bank,Sialkot.Ph. 052-4298350Fax. 052-4298350
Sahiwal Branch79-A-F, Canal Colony,Farid Town Road, Sahiwal.Ph. 040-4463990-91Fax. 040-4463987
Peshawar BranchCommercial Building,Jehangirabad,University Road, Peshawar.Ph. 091-5701484
Karachi Branch30-A,Progressive Centre, Ground Floor,PECHS, Block 6, Main Shahrah-e-Faisal,Karachi.Ph. 021-4322128-30
05
Ann
ual R
epor
t 20
09
Notice of the Annual General Meeting
Notice is hereby given that 18th Annual General Meeting of Trust Investment Bank Limited will be held on Thrusday, December 10, 2009 at 11:00 a.m. at 23-D/1-A, Gulberg III, Lahore to transact the following business:
ORDINARY BUSINESS
i) To confirm the minutes of 10th Extra-ordinary General Meeting held on August 25, 2009.
ii) To receive, consider and adopt the audited accounts of the Bank for the year ended June 30, 2009 together with Directors' and Auditors' Report thereon.
iii) To appoint the Auditors of the Bank for the year ending June 30, 2010 and to fix their remuneration.
iv) To transact any other business with the permission of the Chair.
On Behalf of the Board
Lahore Awais YasinNovember 20, 2009 (Company Secretary)
Notes
1) The share transfer books of the Bank will remain closed from December 03, 2009 to December 10, 2009 (Both days inclusive).
2) A member of the Bank entitled to attend and vote at the meeting may appoint another member as his/her proxy to attend and vote in his/her place. Proxies in order to be effective must be received at the registered office of the Bank, duly stamped and signed, not less than 48 hours before the time of the meeting.
A) For Attending the Meeting:
i) In case of individuals, the account holder or sub-account holder shall authenticate his identity by showing his original CNIC or original passport along with Participant's ID number and their account numbers at the time of attending the meeting.
ii) In case of Corporate entity, the board of director's resolution/power of attorney with specimen signature of the nominee shall be produced (unless it has been provided earlier) at the time of the meeting.
B) For Appointing Proxies:
i) The member entitled to attend the meeting is entitled to appoint a proxy to attend for him/her. No person shall act as a proxy, who is not a member of the Bank except corporate entity may appoint a person who is not a member.
ii) The instrument appointing a proxy should be signed by the members or his/her attorney duly authorized on writing. If the member is a corporate entity, its common seal is should be affixed on the instrument.
iii) The proxy form shall be witnessed by two persons whose names, addresses and CNIC numbers shall be mentioned on the form.
iv) Attested copies of CNIC or the passport of the beneficial owners and the proxy shall be furnished with the proxy form.
v) The proxy shall produce his/her original CNIC or original passport at the time of the meeting.
vi) In case of corporate entity, the Board of Director's resolution/power of attorney with specimen signature shall be submitted (unless it has been provided earlier) along with proxy form to the Bank.
06
Trus
t In
vest
men
t B
ank
Ltd
Director's Report
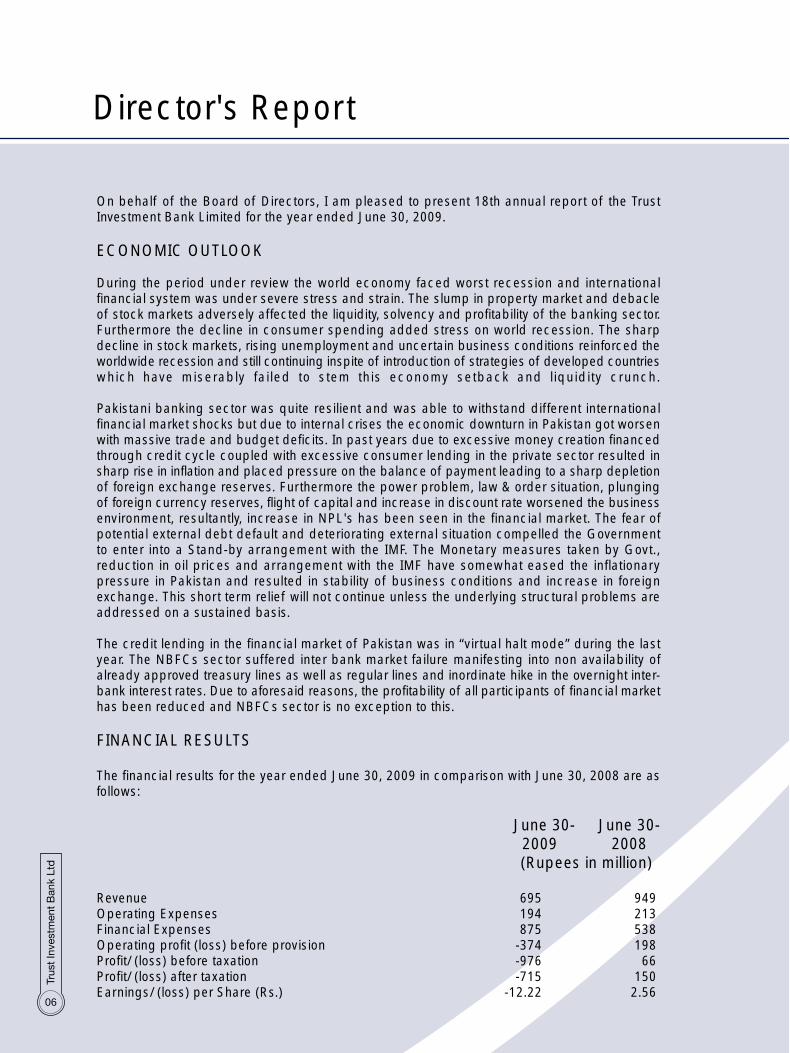
On behalf of the Board of Directors, I am pleased to present 18th annual report of the Trust Investment Bank Limited for the year ended June 30, 2009.
ECONOMIC OUTLOOK
During the period under review the world economy faced worst recession and international financial system was under severe stress and strain. The slump in property market and debacle of stock markets adversely affected the liquidity, solvency and profitability of the banking sector. Furthermore the decline in consumer spending added stress on world recession. The sharp decline in stock markets, rising unemployment and uncertain business conditions reinforced the worldwide recession and still continuing inspite of introduction of strategies of developed countries which have miserably failed to stem this economy setback and liquidity crunch.
Pakistani banking sector was quite resilient and was able to withstand different international financial market shocks but due to internal crises the economic downturn in Pakistan got worsen with massive trade and budget deficits. In past years due to excessive money creation financed through credit cycle coupled with excessive consumer lending in the private sector resulted in sharp rise in inflation and placed pressure on the balance of payment leading to a sharp depletion of foreign exchange reserves. Furthermore the power problem, law & order situation, plunging of foreign currency reserves, flight of capital and increase in discount rate worsened the business environment, resultantly, increase in NPL's has been seen in the financial market. The fear of potential external debt default and deteriorating external situation compelled the Government to enter into a Stand-by arrangement with the IMF. The Monetary measures taken by Govt., reduction in oil prices and arrangement with the IMF have somewhat eased the inflationary pressure in Pakistan and resulted in stability of business conditions and increase in foreign exchange. This short term relief will not continue unless the underlying structural problems are addressed on a sustained basis.
The credit lending in the financial market of Pakistan was in “virtual halt mode” during the last year. The NBFCs sector suffered inter bank market failure manifesting into non availability of already approved treasury lines as well as regular lines and inordinate hike in the overnight inter-bank interest rates. Due to aforesaid reasons, the profitability of all participants of financial market has been reduced and NBFCs sector is no exception to this.
FINANCIAL RESULTS
The financial results for the year ended June 30, 2009 in comparison with June 30, 2008 are as follows:
June 30- June 30-2009 2008
(Rupees in million)
Revenue 695 949Operating Expenses 194 213Financial Expenses 875 538Operating profit (loss) before provision -374 198Profit/ (loss) before taxation -976 66Profit/ (loss) after taxation -715 150Earnings/ (loss) per Share (Rs.) -12.22 2.56
07
Ann
ual R
epor
t 20
09
REVENUE
The Bank succeeded to maintain the income from lease operations but income from investment has been reduced by 84%. The investments in the shares could not be liquidated due to freeze of trading in Stock Exchanges and market values of the investment in shares have declined drastically which resulted in increased loss to the Bank. The unprecedented debacle of capital market and freeze of index in stock exchanges for 111 days had a negative impact on the investments in shares of the Bank. The income from Term Finances showed remarkable improvement. As per the instruction of Securities & Exchange Commission of Pakistan (SECP) the brokerage operations of the Bank has been separated by incorporation of wholly owned subsidiary company Trust Capital (Private) Limited due to which brokerage income/loss is shown only in consolidated accounts.
EXPENDITURE
The NBFCs sector was badly hit and faced severe liquidity crises in money market counter and borrowings/credit was either not available or was available at exorbitant rates. Exorbitant financial charges adversely affected the profitability of our Bank. The financial cost of the Bank is increased by 63% due to liquidity crunch. Due to adverse economic conditions and increase in discount rate the Bank faced problems in recovery and non-performing loans have increased due to overall slow down in economic activities thus the Bank had to recognize additional provisions. The provision for potential lease and term loans losses is increased and had a major negative impact on the earning capacity of the Bank. Furthermore it is important to note that 50% of impairment of loss on available for sale investments amounting to Rs.230 million based on market value of the securities as at June 30, 2009 has been charged to the profit & loss account.
RATING BY EXTERNAL AGENCY
The credit rating of the Bank is reviewed by Pakistan Credit Rating Agency Limited and declared long term credit rating of the Bank at "A - " (A minus) while short term credit rating is "A2" (A two) with under watch. Rating of Term Finance Certificate II and III has been declared as "A".
FUTURE OUTLOOK
The future outlook and earning capacity of NBFC sector is mainly dependent on financial stability of banking system, availability of credit facilities and economic development in the country.
The sponsor shareholders of the Bank have devised a restructuring plan to meet the gap for required equity and also provide substantial liquidity to support the bank's business requirements. This plan is elaborated as follows:
• The sponsors have executed agreement with the management of the Bank and provided the title deeds of the land having market value of Rs.217.00 million in order to use the aforesaid land for enhancement of equity or to use aforesaid land as collateral for obtaining credit lines from the financial institutions.
• In addition a foreign Investment Company has expressed interest to invest in the equity of the Bank with 100% increase in paid-up capital. This process is in advanced stage.

08
Trus
t In
vest
men
t B
ank
Ltd
• Furthermore the shareholders of the Bank have approved the issuance of convertible preference shares of Rs.500.00 million, with green-shoe option of Rs. 200.00 million, vide Extraordinary General Meeting dated August 25, 2009. The management of the Bank is working to market these preference shares shortly.
The index of the capital markets is stabilizing and Board foresees that there will be positive trend in future which will reduce the impairment loss. The management of the Bank is anticipating that year 2009-2010 will be challenging year, however, it will try its level best to take all necessary measures to improve the earning capacity of the Bank. The Board of Directors, management and staff of the Bank are committed in their strive to take new initiative by introducing new products, improving quality of service and efficiency of work in order to strengthen the Bank.
FUNDS MOBILIZATION
During the year under review the Bank make enhanced efforts for the funds mobilization and offered various incentive schemes for this purpose. A dedicated Liability Department has also been established for this purpose. The Bank mobilized additional deposits of Rs. 450 million during the year.
BRANCH NETWORK
In order to obtain maximum economies of scale the Bank has curtailed the branch network recently. The reduced network of branches shall maintain the presence of the Bank in all the major cities of our country and at the same time shall ensure cost reduction and streamlining of operations. The new branches network is as follows:
• Main Branch, Head Office• Northern Region : Islamabad Branch, Gujranwala Branch and Peshawar Branch• Central Region : Multan Branch, Faisalabad Branch and Sargodha Branch• South Region : Karachi Branch
STATEMENT ON CORPORATE AND FINANCIAL REPORTING FRAMEWORK
The Board of Directors and the Company remain committed to the principles of good corporate governance practices with emphasis on transparency and disclosures. The Board and management are fully cognizant with their responsibilities and monitoring Company's operation and performance to enhance the accuracy, comprehensiveness and transparency of financial and non-financial information. The Company is completely compliant of the Code of Corporate Governance issued by the Securities and Exchange Commission of Pakistan. The following statements are a manifestation of its commitment towards compliance with best practices of Code of Corporate Governance:
a) These financial statements, prepared by the management of the Bank, present fairly its state of affairs, the results of its operations, cash flows and changes in equity.
b) Proper books of accounts of the Bank have been maintained as required by the Companies Ordinance, 1984.
09
Ann
ual R
epor
t 20
09
c) Appropriate accounting policies have been consistently applied in preparation of financial statements and accounting estimates are based on reasonable and prudent judgment.
d) International Accounting Standards, as applicable in Pakistan, have been followed in preparation of financial statements.
e) The system of internal control is sound in design and has been effectively implemented by the management and monitored by internal and external auditor as well as Audit Committee. The Board reviews the effectiveness of established internal control through Audit Committee and further improvement in the internal control systems, wherever required.
f) There are no significant doubts upon the Bank's ability to continue as a going concern. The Bank has adequate resources to continue in operation for the foreseeable future.
g) There has been no material departure from the best practices of the Corporate Governance as detailed in the Listing Regulations.
h) Key operating and financial data of last six years, in summarized form, is annexed.
i) Information about outstanding taxes and other government levies are given in related note(s) to the accounts.
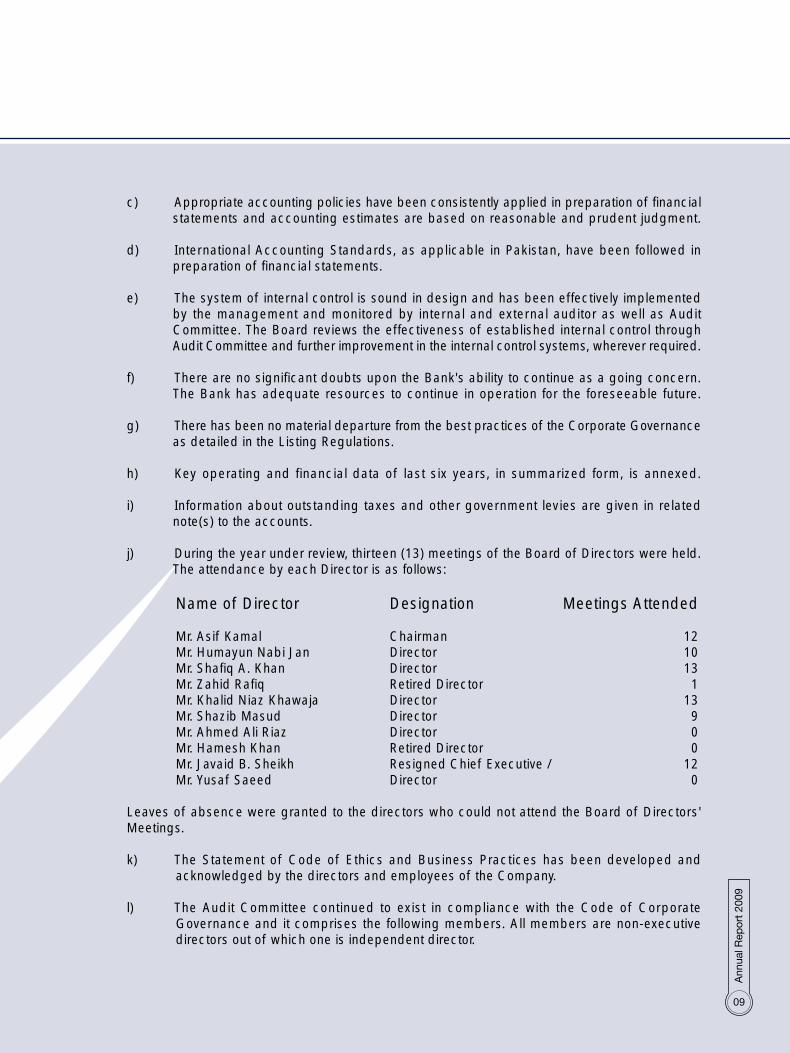
j) During the year under review, thirteen (13) meetings of the Board of Directors were held. The attendance by each Director is as follows:
Name of Director Designation Meetings Attended
Mr. Asif Kamal Chairman 12Mr. Humayun Nabi Jan Director 10Mr. Shafiq A. Khan Director 13Mr. Zahid Rafiq Retired Director 1Mr. Khalid Niaz Khawaja Director 13Mr. Shazib Masud Director 9Mr. Ahmed Ali Riaz Director 0Mr. Hamesh Khan Retired Director 0Mr. Javaid B. Sheikh Resigned Chief Executive / 12Mr. Yusaf Saeed Director 0
Leaves of absence were granted to the directors who could not attend the Board of Directors' Meetings.
k) The Statement of Code of Ethics and Business Practices has been developed and acknowledged by the directors and employees of the Company.
l) The Audit Committee continued to exist in compliance with the Code of Corporate Governance and it comprises the following members. All members are non-executive directors out of which one is independent director.
10
Trus
t In
vest
men
t B
ank
Ltd
Sr. No. Name Designation
1 Mr. Humayun Nabi Jan Chairman2 Mr. Khalid Niaz Khawaja Member3 Mr. Shazib Masud Member
Term of reference of the Audit Committee has been formulated by the Board of Directors in accordance with the Code of Corporate Governance.
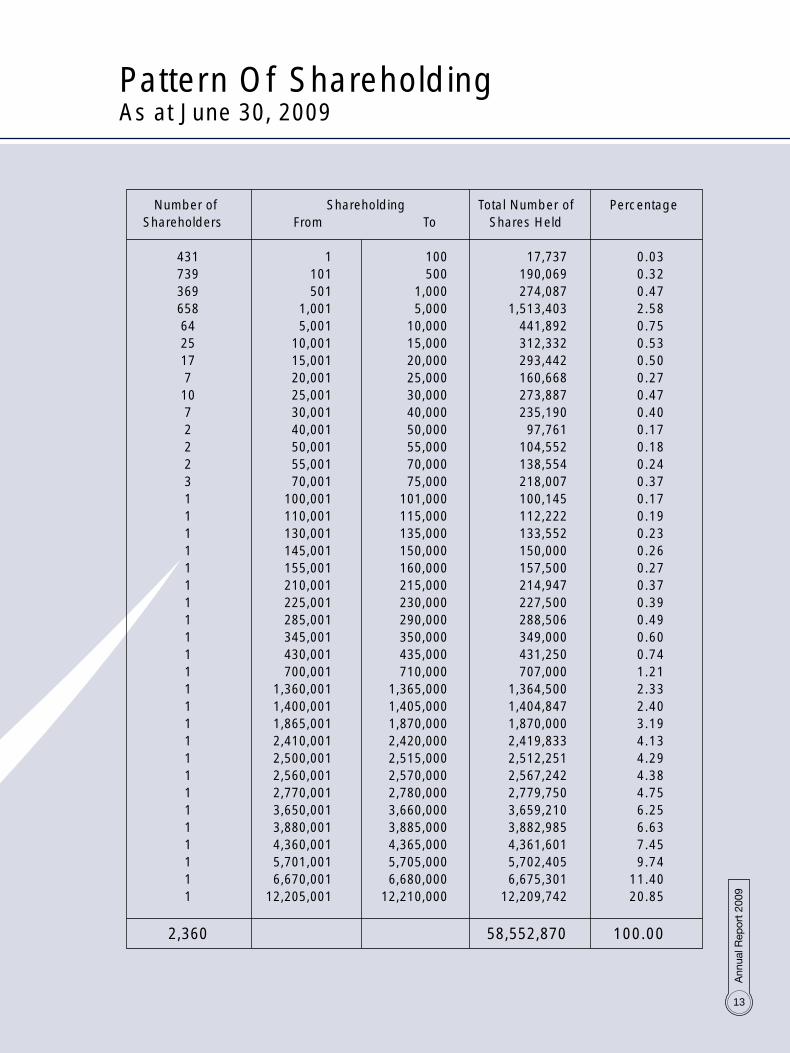
PATTERN OF SHAREHOLDING
A statement of the pattern of shareholdings of certain classes of shareholders as per Section 236 of the Companies Ordinance, 1984, whose disclosure is required under the reporting framework, is annexed.
No trading of shares by the Directors, Chief Executive, Chief Financial Officer, Company Secretary and their spouses & minor children has been carried out during the year. Detail of number of shares held by them is annexed.
All the major decisions relating to investment or disinvestment of funds, changes in significant policies and overall corporate strategies, appointment, remuneration and terms & conditions of appointment of Chief Executive Officer and Executive Directors are taken by the Board of Directors.
INTERNAL AUDIT
The internal control framework has been effectively implemented through an independent in-house Internal Audit Function established by the Board.
The Bank's system of internal control is sound in design and has been subject to continued evaluation for effectiveness and adequacy. The Audit Committee has ensured the achievement of operational, compliance and financial reporting objectives, safeguarding of the assets of the Bank and the shareholders wealth through effective financial, operational and compliance controls and risk management at all levels within the Bank.
The Head of Internal Audit has direct access to the Chairman of the Audit Committee, and has ensured staffing of personnel with sufficient internal control system experience. The coordination between External and Internal Auditors was facilitated to ensure efficiency and contribution to the Bank's objectives, including a reliable financial reporting system and compliance with laws and regulations.
EXTERNAL AUDIT
The statutory auditors of the Bank, KPMG Taseer Hadi & Company, Chartered Accountants, have completed their audit assignment of the “Bank's Financial Statements” and the “Statement of Compliance with the Code of Corporate Governance” for the financial year ended June 30, 2009 and shall retire at the conclusion of the 18th Annual General Meeting. The auditors have also completed the maximum five years audit period as prescribed by the Code of Corporate Governance and are required to be rotated. The auditors attended the general meetings of the Bank during the year.
11
Ann
ual R
epor
t 20
09
The Audit Committee of the Bank have recommended for the appointment of Ford Rhodes Sidat Hyder & Company - EY Pakistan as the external auditors of the bank for the year ended 30 June 2010. The Board of Directors has also endorsed the recommendation made by the Audit Committee. The audit firm has been given satisfactory rating under the Quality Control Review Programme of the of the Institute Chartered Accountants of Pakistan (ICAP) and the firm is fully compliant with the International Federation of Accountants' (IFAC) Guidelines on Code of Ethics, as adopted by the ICAP.
AUDITORS' REPORT
It has been a stated policy of present management to comply with all applicable rules & regulations including NBFC Regulations at all times, in letter & spirit. Based on this philosophy and consistent with practice during previous years, financial statements for the year ended June 30, 2009 are drawn with required provisions in respect of outstanding leases, taking into account forced sale value of the underlying assets, as permissible under rules & regulations. However, auditors KPMG Taseer Hadi & Company have chosen to disagree with this treatment this year and have expressed vide para (a) of the auditors' report that provision should have been made without taking into account the forced sale value of the underlying assets and consequently an additional subjective provision of Rs. 329.522 million should have been made for the year ended June 30, 2009. Based on long experience and understanding of the leasing sector, management is of the view that the provision as provided in financial statements is adequate and additional subjective provisioning is not needed.
EVENTS AFTER BALANCE SHEET DATE
There have not been any material events that occurred subsequent to the date of the balance sheet June 30, 2009 that require adjustments to the enclosed financial statements.
ACKNOWLEDGEMENT
In the end, I would like to avail this opportunity on behalf of the Board of Directors of the Bank to extend sincere gratitude to SECP and SBP for their continued support and sustained efforts extended during the financial crises to strengthen the banking and financial system of the country and improving the governance framework for all Banks. The Board also expresses its appreciation to valuable customers, financial institutions and shareholders for their persistent cooperation and patronage. The Board also acknowledges the significant contributions by the executives and employees of the Bank and Board is confident that with the valuable teamwork and dedicated services of the employees, we shall be able to face the challenging times that lie ahead.
For and on behalf of the Board of Directors
Lahore Faqir Ejaz AsgharNovember 16, 2009 Chief Executive

12
Trus
t In
vest
men
t B
ank
Ltd
Six Years Financial Summary
2009 2008 2007 2006 2005 2004
Operational Result
Total Lease Business and Term Finances 1,910 2,749 1,063 1,727 2,106 1,064 Revenues 695 949 732 733 420 229 Financial expenses 875 538 429 404 150 61 Total Expenses 1,069 750 607 511 204 96Profit / (loss) before tax (976) 66 115 221 216 133Profit / (loss) after tax (715) 149 103 202 225 120
Balance sheet
Total assets 6,523 8,089 6,444 6,162 4,116 2,165 Paid-up-capital 585 585 468 407 339 309 Reserves (205) 510 548 567 466 272 Total Equity 391 1,095 1,023 978 806 580
Earning per share * (12.22) 2.56 2.20 4.96 5.53 4.38Book value per share 6.68 16.78 25.10 24.02 23.74 18.80
Dividend Nil Nil 15% 15% 10% 15%Cash Cash Cash Cash
Dividend Dividend Dividend Dividend
Nil Nil 25% 25% 20% 10%Stock Stock Stock Stock
Dividend Dividend Dividend Dividend
* based on No. of shares outstanding at each year ended
(Rupees in Million)
13
Ann
ual R
epor
t 20
09
Pattern Of ShareholdingAs at June 30, 2009
Number of Shareholding Total Number of PercentageShareholders From To Shares Held
431 1 100 17,737 0.03 739 101 500 190,069 0.32 369 501 1,000 274,087 0.47 658 1,001 5,000 1,513,403 2.58 64 5,001 10,000 441,892 0.75 25 10,001 15,000 312,332 0.53 17 15,001 20,000 293,442 0.50 7 20,001 25,000 160,668 0.27 10 25,001 30,000 273,887 0.47 7 30,001 40,000 235,190 0.40 2 40,001 50,000 97,761 0.17 2 50,001 55,000 104,552 0.18 2 55,001 70,000 138,554 0.24 3 70,001 75,000 218,007 0.37 1 100,001 101,000 100,145 0.17 1 110,001 115,000 112,222 0.19 1 130,001 135,000 133,552 0.23 1 145,001 150,000 150,000 0.26 1 155,001 160,000 157,500 0.27 1 210,001 215,000 214,947 0.37 1 225,001 230,000 227,500 0.39 1 285,001 290,000 288,506 0.49 1 345,001 350,000 349,000 0.60 1 430,001 435,000 431,250 0.74 1 700,001 710,000 707,000 1.21 1 1,360,001 1,365,000 1,364,500 2.33 1 1,400,001 1,405,000 1,404,847 2.40 1 1,865,001 1,870,000 1,870,000 3.19 1 2,410,001 2,420,000 2,419,833 4.13 1 2,500,001 2,515,000 2,512,251 4.29 1 2,560,001 2,570,000 2,567,242 4.38 1 2,770,001 2,780,000 2,779,750 4.75 1 3,650,001 3,660,000 3,659,210 6.25 1 3,880,001 3,885,000 3,882,985 6.63 1 4,360,001 4,365,000 4,361,601 7.45 1 5,701,001 5,705,000 5,702,405 9.74 1 6,670,001 6,680,000 6,675,301 11.40 1 12,205,001 12,210,000 12,209,742 20.85
2,360 58,552,870 100.00

14
Trus
t In
vest
men
t B
ank
Ltd
Categories Of ShareholdersAs at June 30, 2009
Categories of shareholders Shares held Percentage
Directors & Chief Executive
Mr. Asif Kamal 431,250 0.74 Mr. Humayun Nabi Jan 718 - Mr. Khalid Niaz Khawaja 500 - Mr. Shafiq A. Khan 1,943 - Mr. Ahmed Ali Riaz (Nominee of Genesis Securities) 12,209,742 20.85 Mr. Shazib Masud 500 - Mr. Javaid B. Sheikh 718 -
Associated Companies/Persons & related parties
Mr. Zahid Rafiq 5,702,405 9.74 Newage (Pvt.) Limited 6,675,301 11.40 Banks & Financial Institutions 3,917,009 6.69 Insurance Companies 2,568,936 4.39 Modarabas 79,712 0.14 General Public 14,419,599 24.63 IDBP (ICP Unit) 4,100 0.01 Others (Joint Stock & Investment Companies) 12,540,437 21.42
Total 58,552,870 100.00
Total Paid up capital of the Company 58,552,870 Shares10% of the paid up capital of the Company 5,855,287 Shares
Name of shareholders Shares held Percentage
Genesis Securities (Pvt.) Limited 12,209,742 20.85%Newage (Pvt.) Limited 6,675,301 11.40%
Total 18,885,043 32.25%
Share-holders Holding Ten Percent or More
Financial StatementTrust Investment Bank Limited
(for the year ended 30 June 2009)

16
Trus
t In
vest
men
t B
ank
Ltd
Statement of Compliance with the Code of Corporate Governance
This statement is being presented to comply with the best practices of the Code of Corporate Governance (the Code) contained in Regulation No. 37 of Listing Regulation of Karachi and Chapter XIII of the Listing Regulation of Lahore Stock Exchanges for the purpose of establishing a framework of good governance, whereby a listed company is managed in compliance with the best practices of corporate governance.
The Company has applied the principles contained in the Code in the following manner:
1. The Company encourages representation of independent non-executive directors and directors representing minority interests on its Board of Directors. At present the Board includes seven non-executive directors among them two directors are independent non-executive directors.
2. The directors have confirmed that none of them is serving as a director in more than ten listed companies, including this Company.
3. All the directors of the Company are registered as taxpayers and none of them has defaulted in payment of any loan to a banking company, a DFI or an NBFI or, being a member of a stock exchange and has been declared as a defaulter by that stock exchange.
4. During the year election of directors was held and the Company has fulfilled all corporate and legal requirements and file necessary returns in this regard. One casual vacancy of the director was arose during the period which was duly filled during stipulated time period.
5. The Company has prepared a 'Statement of Ethics and Business Practices' which has been signed by all the directors of the Company. The statement has been circulated to all employees of the Company for their awareness and all of them have signed it as acknowledgement of their understanding.
6. The Board has developed a Vision/Mission Statement, Core Values, Strategies & Business Plan, Overall Corporate Strategy and Significant Policies of the Company. A complete record of particulars of Significant Policies and board decision along with the dates on which they were approved or amended has been maintained.
7. All the powers of the Board have been duly exercised and decisions on material transactions, including appointment and determination of remuneration and terms and conditions of employment of the CEO, CFO, Company Secretary, Head of Internal Audit and other executives, have been taken by the Board.
8. The meetings of the Board were presided over by the Chairman and, in his absence, by a director elected by the Board for this purpose and the Board met at least once in every quarter. Written notices of the Board meetings, along with agenda and working papers,

17
Ann
ual R
epor
t 20
09
were circulated at least seven days before the meetings. The minutes of meetings were appropriately recorded and circulated.
9. The directors are conversant with the corporate matters and well aware of their duties and responsibilities. The Board arranged an orientation course for its Directors during the year to apprise of their duties and responsibilities.
10. During the year, the Board of directors has approved the appointment of Chief Executive Officer (CEO). The Board also determined the remuneration, terms and conditions for appointment of new CEO. No new appointment of Chief Financial Officer (CFO) and Company Secretary was made during the year. However any changes to the remuneration, terms and conditions of employment of CFO and Company Secretary have been determined by the CEO with the approval of the Board.
11. The Directors' Report for this year has been prepared in compliance with the requirements of the Code and fully describes the salient matters required to be disclosed.
12. The financial statements of the Company were duly endorsed by CEO and CFO before approval of the Board.
13. The Directors, CEO and executives do not hold any interest in the shares of the Company other than that disclosed in the pattern of shareholding.
14. The Company has complied with all the corporate and financial reporting requirements of the Code.
15. The Board has formed an Audit Committee. It comprises three members, all non-executive directors including the Chairman of the Committee.
16. The meetings of the Audit Committee were held at least once every quarter prior to approval of interim and final results of the Company and as required by the Code. The terms of reference of the committee have been formed and advised to the committee for compliance.
17. The Board has set-up an effective internal audit function managed by suitably qualified and experienced personnel who are conversant with the policies and procedures of the Company and are involved in the internal audit function on a full time basis.
18. The statutory auditors of the Company have confirmed that they have been given a satisfactory rating under the Quality Control Review program of the Institute of Chartered Accountants of Pakistan (ICAP), that they or any of the partners of the firm, their spouses
18
Trus
t In
vest
men
t B
ank
Ltd
and minor children do not hold shares of the Company and that the firm and all its partners are in compliance with International Federation of Accountants (IFAC) guidelines on code of ethics as adopted by ICAP.
19. The statutory auditors or the persons associated with them have not been appointed to provide other services except in accordance with the listing regulations and the auditors have confirmed that they have observed IFAC guidelines in this regard.
20. We confirm that all other material principles contained in the Code have been complied with.
On behalf of the Board Lahore Faqir Ejaz Asghar November 16, 2009 Chief Executive Officer

19
We have reviewed the Statement of Compliance with the best practices contained in the Code of Corporate Governance prepared by the Board of Directors of Trust Investment Bank Limited (”the Company”) to comply with the listing regulations of Karachi, Islamabad and Lahore Stock Exchanges.
The responsibility for compliance with the Code of Corporate Governance is that of the Board of Directors of the Company. Our responsibility is to review, to the extent where such compliance can be objectively verified, whether the Statement of Compliance reflects the status of the Company’s compliance with the provision of the Code of Corporate Governance and report if it does not. A review is limited primarily to inquiries of the Company personnel and review of various documents prepared by the Company to comply with the Code. As part of our audit of financial statements we are required to obtain an understanding of the accounting and internal control systems sufficient to plant the audit and develop an effective audit approach. We have not carried out any special review of the internal control system to enable us to express an opinion as to whether the Board’s statement on internal control covers all controls and the effectiveness of such internal controls.
Further, Sub-Regulation (xiii a) of listing regulation No. 35 (previously regulation No. 37) notified by the Karachi Stock Exchange (Guarantee) Limited vide circular KSE/N-269 dated 19 January 2009 requires the Company to place before the Board of Directors for their consideration and approval related party transactions distinguishing between transactions carried out on term equivalent to those that prevail in arm’s length price recording proper justification for using such alternate pricing mechanism. Further, all such transactions are also required to be separately placed before the audit committee.
We are only required and have ensured compliance of requirement to the extent of approval of related party transactions by the Board of Directors and placement of such transactions before the audit committee. We have not carried out and procedures to determine whether the related party transactions were under taken at arm’s length price.
Based on our review, nothing has come to our attention which causes us to believe that the Statement of Compliance does not appropriately reflect the Company’s compliance in all material respects with the best practices contained in the Code of Corporate Governance.
Lahore: KPMG Taseer Hadi &Co.November 16, 2009 Chartered Accountants (Kamran Iqbal Yousafi)
Review Report to the Memberson Statement of Compliance with Best Practices of Code of Corporate Governance
20
We have audited the annexed balance sheet of Trust Investment Bank Limited (“the Company”) as at 30 June 2009 and the related profit and loss account, cash flow statement and statement of changes in equity together with the notes forming part thereof, for the year then ended and we state that we have obtained all the information and explanations which, to the best of our knowledge and belief, were necessary for the purposes of our audit.
It is the responsibility of the Company’s management to establish and maintain a system of internal control, and prepare and present the above said statements in conformity with the approved accounting standards and the requirements of the Companies Ordinance, 1984. Our responsibility is to express an opinion on these statements based on our audit.
We conducted our audit in accordance with the auditing standards as applicable in Pakistan. These standards require that we plan and perform the audit to obtain reasonable assurance about whether the above said statements are free of any material misstatement. An audit includes examining, on a test basis, evidence supporting the amounts and disclosures in the above said statements. An audit also includes assessing the accounting policies and significant estimates made by management, as well as, evaluating the overall presentation of the above said statements. We believe that our audit provides a reasonable basis for our opinion and, after due verification, we report that:
a) in our opinion there is a requirement of an additional provision to the extent of Rs. 329.522 million in respect of outstanding leases. However, the management is of the view that the underlying assets are recoverable and consequently additional provision is not required. Had this provision been made in the financial statements the loss for the year after taxation and provision for doubtful leases would have been higher by the same amount;
b) in our opinion, proper books of account have been kept by the Company as required by the Companies Ordinance, 1984;
c) in our opinion:
i) the balance sheet and profit and loss account together with the notes thereon have been drawn up in conformity with the Companies Ordinance, 1984, and are in agreement with the books of account and are further in accordance with accounting policies consistently applied;
ii) the expenditure incurred during the year was for the purpose of the Company’s business; and
iii) the business conducted, investments made and the expenditure incurred during the year were in accordance with the objects of the Company;
d) except for the effects on the financial statements of the matter referred in paragraph (a), in our opinion and to the best of our information and according to the explanations given to us, the
AUDITORS’ REPORT TO THE MEMBERS

21
balance sheet, profit and loss account, cash flow statement and statement of changes in equity together with the notes forming part thereof conform with approved accounting standards as applicable in Pakistan, and, give the information required by the Companies Ordinance, 1984, in the manner so required and respectively give a true and fair view of the state of the Company’s affairs as at 30 June 2009 and of the loss, its cash flows and changes in equity for the year then ended; and
e) in our opinion Zakat deductible at source under the Zakat and Ushr Ordinance, 1980 (XVIII of 1980), was deducted by the Company and deposited in the Central Zakat Fund established under section 7 of that Ordinance.
Without further qualifying our opinion, we draw attention of the members to note 1.1 to the financial statements which indicates that the Company incurred a net loss of Rs. 715.226 million during the year ended 30 June 2009 because of which the equity of the Company as of that date has fallen below the minimum regulatory requirement of Rs. 500 million by an amount of Rs. 109.2 million. The amount of loss and equity reported does not include the effect of matter discussed in para (a) above. Further, the Company has applied for and is awaiting the renewal of its leasing license which had expired on 14 May 2009. These factors cast doubt about the ability of the Company to continue its business as a going concern. However, the financial statements have been prepared on a going concern basis in consideration of reasons as explained in note 1.1.
Lahore: November 16, 2009 KPMG Taseer Hadi & Co. Chartered Accountants (Kamran Iqbal Yousafi)

22
2009 2008 Note Rupees RupeesNon - current assets Fixed assets Property and equipment 5 110,710,489 124,078,819 Intangible asset 5 838,083 33,204,684 111,548,572 157,283,503 Net investment in lease finance 6 1,268,188,537 2,570,723,183 Long term finances 7 208,440,998 563,347,630 Long term investments 8 162,976,000 279,992,000 Long term deposits 2,625,919 4,159,629 Long term advances 9 124,556,726 97,379,318 Deffered tax asset 10 319,786,341 55,366,202 2,086,574,521 3,570,967,962 2,198,123,093 3,728,251,465 Current assets Current maturities of non - current assets 11 2,699,549,029 2,060,767,185 Short term finances 12 329,846,962 384,634,120 Short term placements 13 102,727,368 500,425,308 Short term investments 14 399,883,028 569,891,146 Taxation - net 35,716,713 33,097,670 Markup accrued 15 72,741,297 37,070,524 Advances, prepayments and other receivables 16 477,951,701 681,939,159 Cash and bank balances 17 158,792,127 93,288,773 4,277,208,225 4,361,113,885 6,475,331,318 8,089,365,350 Equity and liabilities Share capital 18 585,528,730 585,528,729 Reserves 19 (204,798,436) 510,079,888 380,730,294 1,095,608,618 Suplus on revaluation of assets-net 10,152,041 7,243,576 390,882,335 1,102,852,194 (Deficit) on revaluation of investments 20 (230,775,972) (120,299,798) Non - current liabilities Term finance certificates 21 552,962,982 145,632,592 Long term certificates of investment 22 232,808,673 100,753,970 Long term borrowings 23 545,535,711 601,481,188 Long term deposits 24 732,830,573 1,026,219,481 Pre- IPO Subscription of Term Finance Certificates - 449,910,000 Staff service costs 25 7,183,212 6,592,003 Puchase of intangible assets 2,071,321,151 2,330,589,234 Current liabilities Current maturities of long term liabilities 26 1,223,278,408 1,648,256,153 Short term certificates of investment 27 1,027,286,339 1,042,181,991 Short term borrowings 28 1,826,483,752 1,911,402,172 Markup accrued 29 137,105,415 93,231,842 Trade and other payables 30 29,749,890 81,151,562 4,243,903,804 4,776,223,720 6,315,224,955 7,106,812,954 Contingencies and commitments 31 6,475,331,318 8,089,365,350 The annexed notes 1 to 47 form an integral part of these financial statements. The parameters used for determination of the value of equity securities held as available for sale and the information about impairment loss and its impact on profit and loss account is disclosed in note 14.3.1.
Balance Sheet As at 30 June 2009
CHIEf ExECUTIvE DIRECTOR
23
2009 2008 Note Rupees RupeesRevenue Income from lease operations 32 454,881,663 485,896,175 Income from investments 33 43,421,228 273,909,750 Income from Term Finance 34 173,007,949 44,110,976 Income from brokerage - 54,295,141 Other income 35 23,546,627 90,838,641 694,857,467 949,050,683 Expenditure Finance cost 36 875,119,007 538,472,941 Administrative and operating expenses 37 173,143,442 193,656,016 Depreciation and amortization 5.1 16,279,688 17,769,658 Other charges 38 4,218,967 1,030,487 1,068,761,104 750,929,102 Operating (loss)/profit before provisions and taxation (373,903,637) 198,121,581 Provision for potential lease and term loan losses (311,710,389) (40,125,830)Provision for appreciation/(diminution) in the value of investments (60,000,000) (527,614)Impairment on available for Investment (230,775,972) (16,622,059)(Deficit) on revaluation of held for trading investments - (74,721,716)
(602,486,361) (131,997,219)
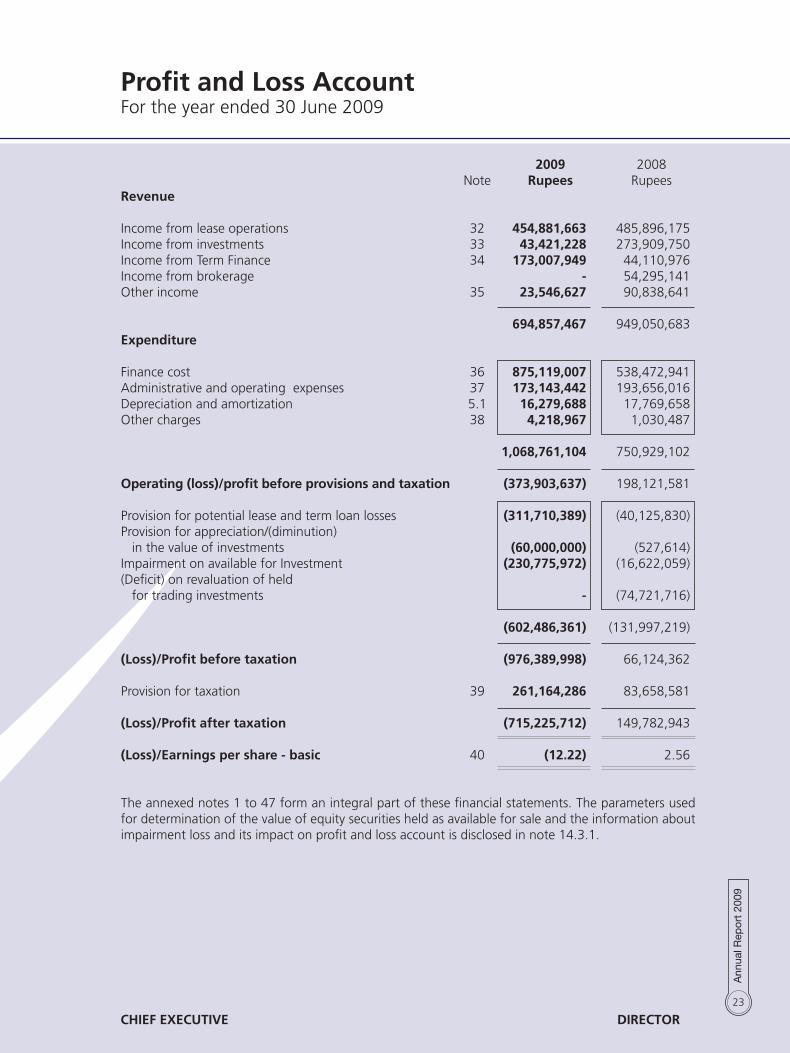
(Loss)/Profit before taxation (976,389,998) 66,124,362 Provision for taxation 39 261,164,286 83,658,581 (Loss)/Profit after taxation (715,225,712) 149,782,943 (Loss)/Earnings per share - basic 40 (12.22) 2.56 The annexed notes 1 to 47 form an integral part of these financial statements. The parameters used for determination of the value of equity securities held as available for sale and the information about impairment loss and its impact on profit and loss account is disclosed in note 14.3.1.
Profit and Loss AccountFor the year ended 30 June 2009
CHIEf ExECUTIvE DIRECTOR

24
Cash flow StatementFor the year ended 30 June 2009
2009 2008 Rupees RupeesCash flows from operating activities (Loss)/Profit before taxation (976,389,998) 66,124,361 Adjustments for non cash items: Depreciation and amortization 16,279,688 17,769,658 Amortization of transaction costs of term finance certificates 5,852,674 3,733,019 Provision for staff service costs 3,987,335 8,817,108 Provision for doubtful receivables 311,710,389 40,125,830 Lease receivables written off 4,218,967 1,020,487 Provision for diminution in the value of investments 60,000,000 527,614 Finance cost 875,119,007 538,472,941 Profit on sale of property and equipment (3,872,608) (22,448,499) Profit on sale of intangible assets (5,900,000) - Diminution on revaluation of held for trading investments - 74,721,716 Impairment on available for sale investments 230,775,972 16,622,059 Gain on sale of available for sale investments - (9,472,666)
1,498,171,424 669,889,267
Operating profit before working capital changes 521,781,426 736,013,628 Changes in operating assets and liabilities (Increase) / decrease in: Long term investments 57,016,000 (291,434,076) Short term placements and short term investments 226,453,912 133,152,428 Markup accrued (35,670,773) (19,526,255) Advances, prepayments and other receivables 160,495,556 (24,485,477) Long term and short term finances 65,737,370 (392,443,141) Net investment in lease finance 436,030,189 (668,633,512) Certificates of investment 117,159,051 573,542,054 1,027,221,305 (689,827,979) Decrease in trade and other payables (51,316,299) (149,324,726)
975,905,006 (839,152,705) Cash generated/(used) in operations 1,497,686,432 (103,139,077) Finance cost paid (831,245,434) (499,422,634) Taxes paid (2,619,044) (5,568,442) Staff service costs paid (3,396,126) (6,244,698)
(837,260,604) (511,235,774)
Net cash generated from/(used) in operating activities 660,425,828 (614,374,851)
25
CHIEf ExECUTIvE DIRECTOR
2009 2008 Note Rupees Rupees
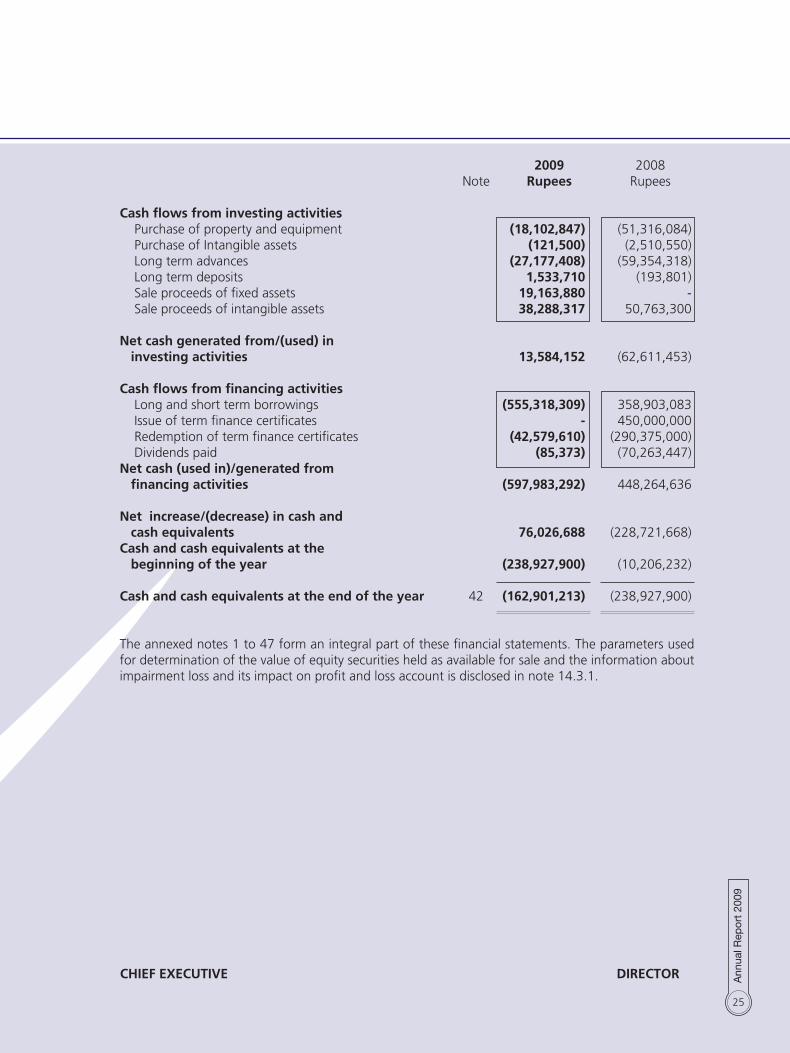
Cash flows from investing activities Purchase of property and equipment (18,102,847) (51,316,084) Purchase of Intangible assets (121,500) (2,510,550) Long term advances (27,177,408) (59,354,318) Long term deposits 1,533,710 (193,801) Sale proceeds of fixed assets 19,163,880 - Sale proceeds of intangible assets 38,288,317 50,763,300 Net cash generated from/(used) in investing activities 13,584,152 (62,611,453) Cash flows from financing activities Long and short term borrowings (555,318,309) 358,903,083 Issue of term finance certificates - 450,000,000 Redemption of term finance certificates (42,579,610) (290,375,000) Dividends paid (85,373) (70,263,447)Net cash (used in)/generated from financing activities (597,983,292) 448,264,636 Net increase/(decrease) in cash and cash equivalents 76,026,688 (228,721,668)Cash and cash equivalents at the beginning of the year (238,927,900) (10,206,232)
Cash and cash equivalents at the end of the year 42 (162,901,213) (238,927,900)
The annexed notes 1 to 47 form an integral part of these financial statements. The parameters used for determination of the value of equity securities held as available for sale and the information about impairment loss and its impact on profit and loss account is disclosed in note 14.3.1.

26
CH
IEf
ExEC
UTI
vE
D
IREC
TOR
Sh
are
Shar
e St
atu
tory
G
ener
al
Un
-ap
pro
pri
ated
To
tal
ca
pit
al
pre
miu
m
rese
rve
rese
rve
pro
fit
R
up
ees
Ru
pee
s R
up
ees
Ru
pee
s R
up
ees
Ru
pee
s
Bal
ance
as
at 0
1 Ju
ly 2
007
468
,422
,984
7
0,71
4,92
0
176
,801
,731
6
1,00
0,00
0
239
,124
,294
1,0
16,0
63,9
29
Tran
sfer
fro
m s
urpl
us o
n re
valu
atio
n of
fixe
d as
sets
to
una
ppro
pria
ted
profi
t -n
et o
f ta
x -
-
-
-
2
5,19
4
25,
194
Fina
l div
iden
d @
15%
(Rs
1.50
per
sha
re)
fo
r th
e ye
ar e
nded
30
June
200
7 -
-
-
-
(7
0,26
3,44
7)
(70,
263,
447)
Bo
nus
shar
es @
25%
issu
ed f
or t
he y
ear
ende
d 30
Jun
e 20
07
117
,105
,746
(7
0,71
4,92
0)
-
-
(46,
390,
826)
-
N
et p
rofit
for
the
yea
r -
-
-
-
1
49,7
82,9
42
149
,782
,942
Tr
ansf
er t
o st
atut
ory
rese
rve
-
-
29,
956,
588
-
(2
9,95
6,58
8)
-
Bal
ance
as
at 3
0 Ju
ne
2008
5
85,5
28,7
30
-
206
,758
,319
6
1,00
0,00
0
242
,321
,569
1,0
95,6
08,6
18
Tran
sfer
fro
m s
urpl
us o
n re
valu
atio
n of
fixe
d as
sets
to
una
ppro
pria
ted
profi
t -n
et o
f ta
x -
-
-
-
3
47,3
88
347
,388
N
et lo
ss f
or t
he y
ear
-
-
-
-
(715
,225
,712
) (7
15,2
25,7
12)
Bal
ance
as
at 3
0 Ju
ne
2009
5
85,5
28,7
30
-
206
,758
,318
6
1,00
0,00
0
(472
,556
,755
) 3
80,7
30,2
94
Stat
emen
t o
f C
han
ges
in E
qu
ity
For
the
year
end
ed 3
0 Ju
ne 2
009

27
Notes to the financial StatementsFor the year ended 30 June 2009
1 The Company’s Operations and registered office Trust Investment Bank Limited (“the Company”) was incorporated in 1992 as a public limited
Company under the Companies Ordinance, 1984 and is listed on Lahore, Karachi and Islamabad Stock Exchanges. The registered office of the Company is situated at 23-D/1-A, Gulberg III, Lahore. The Company is mainly engaged in the business of leasing and investment finance services. It is classified as a Non-Banking Finance Company (NBFC) and is regulated by the Securities and Exchange Commission of Pakistan (SECP).
Pakistan Credit Rating Agency Limited has maintained the long term credit rating of the Company
at “A-”(Single A minus), while short term credit rating has also been maintained at “A2”(A two). Rating of term finance certificate II and III has been maintained at “A”(Single A) with negative outlook.
1.1 Going concern assumption The financial statements for the year ended 30 June 2009 reflect loss after taxation of Rs.
715.226 million because of which the equity of the Company as of that date has fallen below the minimum regulatory requirement of Rs. 500 million by an amount of Rs. 109.2 million. Further, the Company has applied for and is awaiting for the renewal of its leasing license which had expired on 14 May 2009.
With regard to constraint in minimum equity requirement for doing business, the sponsor
shareholders have expressed their commitment to fulfill the minimum equity requirement through increase in capital. The sponsors have executed agreement with the management of the Bank and provided the title documents of the land having market value of Rs. 217 million in order to use the aforesaid land for the future enhancement of equity. On the other hand a foreign investment company has expressed its interest to invest in the equity of the Bank with 100% right issue amounting to Rs. 585 million and negotiations are at advanced stage.
Additionally, the management is working to market the preference shares of Rs. 700 million
inclusive of Rs. 200 million of green shoe option which has been approved in minutes of Board of Directors and by members in EOGM.
The business plan for five years which has been approved by the Board, projects profitable
operations and positive equity by June 2010. The management expects that after the restructuring, the requirement for minimum capital shall be met and the leasing license will be renewed. Accordingly, the financial statements have been prepared on a going concern basis.
2 Statement of compliance 2.1 Statement of compliance These financial statements have been prepared in accordance with approved accounting
standards as applicable in Pakistan. Approved accounting standards comprise of such International Financial Reporting Standards (IFRS) issued by the International Accounting Standards Board as are notified under the Companies Ordinance, 1984, except for the disclosure requirement of Clause 3C of Part II of the Fourth Schedule of the Companies Ordinance, 1984 in respect of which Securities and Exchange Commission of Pakistan (SECP) has given exemptions to all NBFCs’ vide its letter No. SC/NBFC/-1/R/2005, dated 29 August 2005, the Non-Banking Finance Companies (Establishment and Regulation)

28
Rules, 2003 (the NBFC Rules), the Non-Banking Finance Companies and Notified Entities Regulation, 2008 (the NBFC Regulation) and the directives issued by the Securities and Exchange Commission of Pakistan (SECP). Wherever the requirements of the Companies Ordinance 1984, the NBFC Rules, the NBFC Regulations or the directives issued by the SECP shall prevail.
The SECP has deferred the applicability of International Accounting Standard (IAS) 39, ‘Financial Instruments: Recognition and Measurement’ and International Accounting Standard (IAS) 40, ‘Investment Property’ through Circular No. 19 dated 13 August 2003 to Non-Banking Finance Companies (NBFCs) providing investment finance services, discounting services and housing finance services. Accordingly, the requirements of these standards have not been considered in the preparation of these financial statements.
2.2 Standards, Interpretations and amendments to published approved accounting
standards Relevant but not yet effective IAS 1 “Presentation of Financial Statements” effective for annual periods beginning on
or after 01 January 2009 revises the existing IAS 1 and requires, apart from changing the names of certain components of financial statements, presentation of transactions with owners in statement of changes in equity and with non-owners in comprehensive Income Statement. Adoption of the above standard will only effect the presentation of financial statements.
Not relevant and not yet effective
The following standards, amendments and interpretations to approved accounting standards, effective for accounting periods beginning on or after 1 July 2009 are either not relevant to the NBFC operations or are not expected to have significant impact on the NBFC’s financial statements other than certain increased disclosures only:
Standards or interpretation IFRS 2 (amendment) - Share based payments IFRS 3 (amendment) - Business Combinations IFRS 8 - Operating Segments IAS 27 - Consolidated and separate financial statements IAS 32 (amendment) - Financial instruments: Presentation and consequential amendment to IAS 1- Presentation of Financial Statements IFRIC 15 - Accounting for Agreements for the Construction of Real Estate IFRIC 16 - Hedges of a Net Investment in a Foreign Operation In addition to above, International Accounting Standards Board made certain amendments
to existing standards and interpretations as part of its first and second annual improvements projects. These amendments are unlikely to have impact on the Company’s financial statements.

29
3 Basis of measurement 3.1 Accounting convention The financial statements have been prepared under the historical cost convention except
for revaluation of certain financial instruments and property at fair value and recognition of certain employee retirement benefits at present value.
3.2 Significant estimates The preparation of financial statements in conformity with approved accounting standards
requires management to make judgments, estimates and assumptions that effect the application of policies and reported amounts of assets and liabilities, income and expenses. The estimates and associated assumptions and judgments are based on historical experience and various other factors that are believed to be reasonable under the circumstances, the result of which form the basis of making the judgments about carrying values of assets and liabilities that are not readily apparent from other sources. Actual results may differ from these estimates.
The estimates and underlying assumptions are reviewed on an ongoing basis. Revision
to accounting estimates are recognized in the period in which the estimate is revised if the revision effects only that period, or in the period of revision and future periods if the revision affects both current and future periods. The areas where various assumptions and estimates are significant to Company’s financial statements or where judgments were exercised in application of accounting policies are as follows:
Note
- Taxation 4.1 - Residual value and useful life of depreciable assets 4.2 - Provisions and contingencies 4.5 - Staff retirement benefits (Gratuity) 4.14 - Impairment 4.20
4 Significant accounting policies 4.1 Taxation Current The charge for current taxation is based on taxable income at current rate of taxation of the
Income Tax Ordinance, 2001 after taking into account applicable tax credits and rebates, if any.
Deferred Deferred tax is recognized using the balance sheet liability method on all temporary
differences between the amounts attributed to assets and liabilities for financial reporting purposes and amounts used for taxation purposes.

30
Deferred tax liabilities are generally recognized for all taxable temporary differences. Deferred tax asset is recognized to the extent that it is probable that future taxable profits will be available against which deductible difference, unused tax losses and tax credits can be utilized. Deferred tax assets are reduced to the extent that it is no longer probable that the related tax benefit will be realized. Deferred tax is calculated at the rates that are expected to apply to the period when differences reverse based on tax rates that have been enacted or substantively enacted by the balance sheet date.
Deferred tax is charged or credited to income statement, except in case of items credited
or charged to equity, in which case it is included in equity. 4.2 Property and equipment These are stated at historical cost less accumulated depreciation and impairment losses, if any. Depreciation is calculated using the diminishing balance method, except vehicles for which
straight line method is used, at the rates specified in the fixed assets schedule, which are considered appropriate to write off the cost of the assets over their estimated useful lives.
Depreciation is charged from the month when assets are available for use upto the month
in which the assets are disposed off. Normal repairs and maintenance are charged to revenue as and when incurred. Renewals
and replacements are capitalized when it is probable that respective future economic benefits will flow to the Company and the cost of the items can be reliably measured, and assets so replaced, if any, are retired.
Gains and losses on disposal of property and equipment are recognized in the profit and
loss account in the year of disposal. 4.3 Intangible assets These are stated at cost less impairment losses, if any. The carrying amounts are reviewed at
each balance sheet date to assess whether these are recorded in excess of their recoverable amounts, and where carrying value is in excess of recoverable amount, these are written down to their estimated recoverable amount.
Expenditure incurred to acquire computer software are capitalized as intangible assets and
stated at cost less accumulated amortization and any identified impairment loss. Intangible assets are amortized using the straight- line method over a period of 10 years.
Full year amortization is charged from the year when assets are available for use and no
amortization will be charged in the year in which the assets are disposed off. 4.4 financial instruments Financial assets Significant financial assets include short and long term finances, short and long term
investments, short term placements, net investment in leases, advances and receivables, long term deposits and cash and bank balances. Finances and receivables from clients are stated at their nominal value as reduced by provision for doubtful finances and receivable, while other financial assets are stated at cost except for investments, which are revalued as per accounting policies.
31
Financial liabilities Financial liabilities are classified according to the substance of the contractual arrangements
entered into. Significant financial liabilities include term finance certificates, short and long term borrowings, certificates of investment, deposits against lease arrangements, trade and other payables and dividends payable. Markup based financial liabilities are recorded at gross proceeds received. Other liabilities are stated at their nominal value.
Recognition and derecognition All the financial assets and financial liabilities are recognized at the time when the Company
becomes a party to the contractual provisions of the instruments. Financial assets are derecognized when the Company loses control of the contractual rights that comprise the financial assets. Financial liabilities are derecognized when these are extinguished i.e. when the obligation specified in the contract is discharged, cancelled or expired. Any gain or loss on derecognition of the financial assets and liabilities is taken to the income in the current period.
The policies in respect of these financial instruments have been disclosed in the relevant
policy notes. Offsetting of financial assets and financial liabilities A financial asset and a financial liability is offset and the net amount is reported in the
balance sheet if the Company has legal enforceable right to set off the recognized amount and intends either to settle on a net basis or to realize the assets and settle the liability simultaneously. Corresponding income on assets and charge on liability are reported at net amount.
4.5 Provisions A provision is recognized when the Company has a present legal or constructive obligation
as a result of past events and it is probable that an outflow of resources embodying economic benefits will be required to settle the obligation and a reliable estimate can be made of the amount of obligation.
4.6 Investments The Company classifies its investments as held to maturity, available for sale, held for
trading and loans and receivables. Initial measurement All investments are initially recognized at cost being the fair value of the consideration
given including acquisition cost. Subsequent measurement Simple investment Investment in subsidiary company is measured at cost as per the requirements of IAS-27
“Consolidated and Separate Financial Statements”. However, at subsequent reporting dates,
32
the Company reviews the carrying amounts of the investments and its recoverability to determine whether there is an indication that such investments have suffered an impairment loss. If any such indication exists the carrying amount of the investment is adjusted to the extent of impairment loss. Impairment losses are recognized as an expense currently.
Held to maturity The investments with fixed maturity or determinable payments where management has
both intent and ability to hold to maturity are classified as held to maturity. These are stated at amortized cost using the effective interest rate method less impairment, if any. The amortization for the period is charged to the profit and loss account.
Held for trading These include investments which are acquired principally for the purpose of generating
profit from short term fluctuations in price or dealer’s margins, are classified as investments held for trading. These are stated at fair values with any resulting surplus/(deficit) recognized in profit and loss account.
Available-for-sale Investments which can not be classified as loans and receivables, held to maturity investments
or held for trading investments are classified as available for sale investments. Investments intended to be held for an unidentified period of time, which may be sold in
response to need for liquidity or changes to interest rates, exchange rates or equity prices are classified as available for sale.
Available-for-sale investments are measured at subsequent reporting dates at fair value for
those shares which have fair values. However, all such shares for which fair value cannot be determined are valued at cost. Surplus/(deficit) on remeasurement is kept in a separate account and is shown in the balance sheet below the shareholders’ equity, until the security is disposed off or is determined to be impaired, at which time, the cumulative surplus/(deficit) is included in the profit and loss account.
However, as allowed by the BSD circular no. 10 dated 13 July 2004, the Company will be free to determine the extent of holding under the above categories taking into consideration various aspects such as trading strategies, intention of acquisition of securities, capital position, expertise available to manage investment portfolio, and the risk management capabilities. Under exceptional circumstances, shifting from one category to another category may be made subject to the following conditions:
- Shifting of investments to/from held to maturity category is allowed once a year only
with the approval of the Board of Directors within two months of the commencement of accounting year. Any further shifting to/from this category is not allowed during the remaining part of that accounting year.
- Shifting to/from available for sale category is allowed with the approval of the Assets
and Liabilities Committee (ALCO) subject to the condition that the reasons for such shifting will be recorded in writing.
33
- Shifting from held for trading category to available for sale or held to maturity categories is generally not allowed. It is permitted under exceptional circumstances like not being able to sell the securities within the prescribed period of 90 days due to tight liquidity position in market or extreme market volatility with the approval of ALCO. The justification for such exceptional shifting of securities is recorded in the minutes of ALCO meeting. Shifting of securities from one category to another is at the lower of the market value or the acquisition cost/book value, and the diminution in value, if any, on such transfer is fully provided for.
- The surplus/deficit arising as a result of revaluation of held for trading investments
is taken to profit and loss account. Furthermore, the surplus/deficit on revaluation of available for sale and held to maturity securities is taken to “Surplus/Deficit on revaluation of Investments” account. However, any permanent diminution in the value of available for sale or held to maturity securities is provided for by charging it to the profit and loss account. The measurement of surplus/deficit is done on portfolio basis for each of the above three categories separately.
4.7 Trade and settlement date accounting All “regular way” purchases and sales of listed shares are recognized on the trade date, i.e.
the date that the Company commits to purchase/ sell the asset. Regular way purchase or sale of financial assets are those, the contract for which requires delivery of assets within the time frame established generally by regulation or convention in the market place concerned.
4.8 Securities under repurchase/reverse repurchase agreements Transactions of repurchase/ reverse repurchase of investment securities are entered into at
contracted rate for specified periods of time and are accounted for as follows. Repurchase agreements Investments sold with the simultaneous commitment to repurchase at a specified future
date (Repo) continue to be recognized in the balance sheet and are measured in accordance with accounting policies for investments. The counterparty liability for amounts received under these agreements is included in short term borrowing. The difference between sale and repurchase price is treated as markup on short term borrowing and accrued over the tenure of the repo agreement.
Reverse Repurchase agreements Investments purchased with a simultaneous commitment to resell at a specified future
date (reverse repo) are not recognized in the balance sheet. Amounts paid under these agreements are recorded as ‘short term placements’. The difference between purchase and resale price is treated as return from funds placement with financial institutions or income from reverse repurchase transactions of listed shares, as the case may be, and accrued over the life of reverse repo agreement.
4.9 Term finances Term finances originated by the Company are stated at cost less any amount written off and
provision for doubtful finances, if any, in accordance with NBFCs prudential regulations.
34
4.10 Net investment in lease finance Lease where the Company transfers substantially all the risks and rewards incidental to
ownership of the asset to the lessee are classified as finance leases. Net investment in lease finances is recognized at an amount equal to the aggregate of minimum lease payments including any guaranteed residual value and excluding unearned finance income, write-offs and provision for doubtful lease finances, if any.
4.11 Repossessed assets The Company repossesses leased assets in settlement of non-performing finances provided
to customers. Gains or losses on disposal are taken to the income in the current period unless recoverable from / payable to the customer. Major losses on the disposal of repossessed leased assets are accounted for as receivable till the final settlement with lessee. Minor losses on the disposal of repossessed vehicles are charged to the income in the current period.
4.12 Revenue recognition Finance leases The “financing method” is used for recognition of finance income on finance leases. Under
this method, the unearned finance income i.e., the excess of aggregate lease rentals and the estimated residual value over the net investment is deferred and then amortized to income over the term of the lease on a systematic basis, so as to produce a constant rate of return on the Company’s net investment in the finance lease.
Capital gains and losses on sale of investments Capital gains or losses on the sale of investments are recognized in the period in which they
arise. Processing fee, front end fee and penal charges These are recognized as income when services are provided. Return on finances , placements and term finances. Return on finances provided, placements and term finances are recognized on time
proportion basis. Morabaha income Mark-up/profit earned on finance under morabaha agreement and finance under buy-back
agreement is recognized on a time proportion basis taking account of, where applicable, the relevant buy-back dates and prices, or where a specific schedule of recoveries is prescribed in the agreement, the respective dates when mark-up is required to be paid to the Company.
Income on bank deposits and reverse repo transactions Income from bank deposits, investments, loans and advances is recognized on time
proportion basis.
35
Guarantee commission Commission income from guarantee is recognized on time proportion basis. Dividend Income Dividend income is recognized when right to receive dividend is established. 4.13 Return on certificates of investment Return on certificates of investment is recognized on a time proportion basis taking into
account the relevant issue date and final maturity date. 4.14 Staff retirement benefits Defined benefit plan Gratuity fund The Company operates an approved funded gratuity scheme for all of its permanent
employees subject to a minimum qualifying period of six months of service. Provisions are made in accordance with the actuarial valuation using ‘Projected Unit Credit method’.
Actuarial gains and losses arising as a result of actuarial valuation are recognized as income
or expense to the extent that the net cumulative unrecognized actuarial gains or losses at the end of the previous reporting period exceeded 10% of the higher of present value of defined benefit obligation and the fair value of the plan assets as at that date. These gains or losses are recognized over the expected average remaining working lives of the employees participating in the plan.
Gratuity is payable to employees on the completion of prescribed qualifying period of
service under the scheme. Leave encashment The Company operates an unfunded leave encashment scheme for all of its permanent
employees. Provisions are made in accordance with the actuarial valuation using ‘Projected Unit Credit method’.
4.15 Provision for potential lease losses and loans The provision for potential lease losses and installment loan losses is maintained at a level
which is adequate to provide for potential losses on lease and installment loan portfolio in accordance with Prudential Regulations for NBFCs. Specific provision for potential lease and installment loan losses is maintained at a level which, in the judgment of the management, is adequate to provide potential losses on lease and installment loan portfolio that can be reasonably anticipated. The provision is increased by charge to income and is decreased by charge offs, net of recoveries.
The leases, loans and advances are written off when there are no realistic prospects of
recovery.
36
4.16 Cash and cash equivalents For the purpose of cash flow statement, cash and cash equivalents comprise of cash in hand,
balance with banks on current and deposit accounts and short term running finance account. 4.17 Borrowing costs The borrowing cost incurred on debts of the Company is charged to income. 4.18 Transactions with related parties and transfer pricing The Company enters into transactions with related parties on arms length basis. Prices for
transactions with related parties are determined using admissible valuation methods, except for the assets sold to employees at written down value as approved by the board of directors.
Parties are said to be related, if they are able to influence the operating and financial
decisions of the Company and vice versa. 4.19 foreign currency translation Transactions denominated in foreign currencies are translated to Pak Rupee at the foreign
exchange rate ruling at the date of transaction. Assets and liabilities in foreign currency are translated at the rates of exchange prevailing on the balance sheet date. All exchange gains/losses are taken to profit and loss account.
4.20 Impairment The carrying amounts of the assets are reviewed at each balance sheet date to identify
the circumstances indicating the occurrence of impairment loss or reversal of previous impairment losses. If any such indication exists, the recoverable amount of such asset is estimated and impairment loss is recognized in the profit and loss account. Where an impairment loss subsequently reverses, the carrying amount of such asset is increased to the revised recoverable amount. A reversal of the impairment loss is recognized in income.
4.21 Dividends Dividend is recognized as a liability in the period in which it is declared. 4.22 Bonus shares Bonus shares are recognized as an appropriation from profit in the period in which it is
declared.
2009 2008
Note Rupees Rupees5 fixed assets Property and equipment 5.1 110,710,489 124,078,819 Intangible 5.1 838,083 33,204,684 111,548,572 157,283,503

37
5.1 Property and equipment
C O S T D E P R E C I A T I O N
As at Additions/ Revalu- Deletions As at As at for Incremen- As at Book value Depre- 1 July Surplus during ation during the 30 June 1 July the tal deprici- 30 June as at 30 ciation 2008 the year Surplus year 2009 2008 year ation Deletions 2009 June 2009 rate Rupees Rupees Rupees Rupees Rupees Rupees Rupees Rupees Rupees Rupees %PARTICULARS Owned Land 22,000,000 - - - 22,000,000 - - - - - 22,000,000 Building on freehold land 26,790,450 - - - 26,790,450 1,838,024 945,055 - - 2,783,079 24,007,371 5Leasehold improvements 22,704,878 6,681,465 - (529,660) 28,856,683 6,271,637 4,289,939 - (95,881) 10,465,695 18,390,988 20Office equipment and machines 22,582,955 1,295,452 - (5,725,766) 18,152,641 8,714,951 2,113,869 - (1,534,120) 9,294,700 8,857,941 20Furniture and fixtures 17,727,474 271,015 - (1,678,110) 16,320,379 5,014,626 1,167,948 - (427,985) 5,754,589 10,565,790 10Air-conditioning equipment 6,931,232 166,240 - (746,789) 6,350,683 1,540,231 495,876 - (148,326) 1,887,781 4,462,902 10Vehicles 42,576,272 9,688,674 - (13,064,490) 39,200,456 13,854,973 7,167,217 - (4,247,231) 16,774,959 22,425,497 20
2009 161,313,261 18,102,846 - (21,744,815) 157,671,292 37,234,442 16,179,904 - (6,453,543) 46,960,803 110,710,489
C O S T D E P R E C I A T I O N
As at Additions Revalu- Deletions As at As at for Incremen- As at Book value Depre- 1 July during the ation during the 30 June 1 July the tal deprici- On 30 June as at 30 ciation 2007 year Surplus year 2008 2007 year ation deletions 2008 June 2008 rate Rupees Rupees Rupees Rupees Rupees Rupees Rupees Rupees Rupees Rupees %PARTICULARS Owned Land - (2,223,751) 24,223,751 - 22,000,000 - - - - - 22,000,000 Building on freehold land 44,941,014 9,573,929 - (27,724,493) 26,790,450 3,376,198 1,048,284 25,194 (2,586,458) 1,838,024 24,952,426 5Leasehold improvements 15,974,809 6,730,069 - - 22,704,878 2,888,518 3,383,119 - - 6,271,637 16,433,241 20Office equipment and machines 17,963,161 4,799,694 - (179,900) 22,582,955 5,774,692 2,985,860 - (45,601) 8,714,951 13,868,004 20Furniture and fixtures 16,097,327 1,773,791 - (143,644) 17,727,474 3,740,945 1,334,675 - (60,994) 5,014,626 12,712,848 10Air-conditioning equipment 4,577,164 2,425,768 - (71,700) 6,931,232 1,163,373 405,623 - (28,765) 1,540,231 5,391,001 10Vehicles 35,513,840 14,537,456 - (7,475,024) 42,576,272 10,062,467 8,350,646 - (4,558,140) 13,854,973 28,721,299 20
2008 135,067,315 37,616,956 24,223,751 (35,594,761) 161,313,261 27,006,193 17,508,207 25,194 (7,279,958) 37,234,442 124,078,819
Intangible C O S T A M O RT I Z AT I O N As at Additions Deletions As at As at for As at Book value 1 July during during 30 June 1 July the 30 June as at 30 2008 the year the year 2009 2008 year Deletions 2009 June 2009 PARTICULARS Rupees Rupees Rupees Rupees Rupees Rupees Rupees Rupees Rupees
Lahore Stock Exchange Membership 30,100,000 - 30,100,000 - - - - - - Software Licences 3,461,200 121,500 2,288,317 1,294,383 356,516 99,784 - 456,300 838,083
2009 33,561,200 121,500 32,388,317 1,294,383 356,516 99,784 - 456,300 838,083
C O S T A M O RT I Z AT I O N As at Additions Deletions As at As at for As at Book value 1 July during the during the 30 June 1 July the 30 June as at 30 2007 year year 2008 2007 year Deletions 2008 June 2008 PARTICULARS Rupees Rupees Rupees Rupees Rupees Rupees Rupees Rupees Rupees
Lahore Stock Exchange Membership 30,100,000 - - 30,100,000 - - - - 30,100,000 Software licences 950,650 2,510,550 - 3,461,200 95,065 261,451 - 356,516 3,104,684
2008 31,050,650 2,510,550 - 33,561,200 95,065 261,451 - 356,516 33,204,684
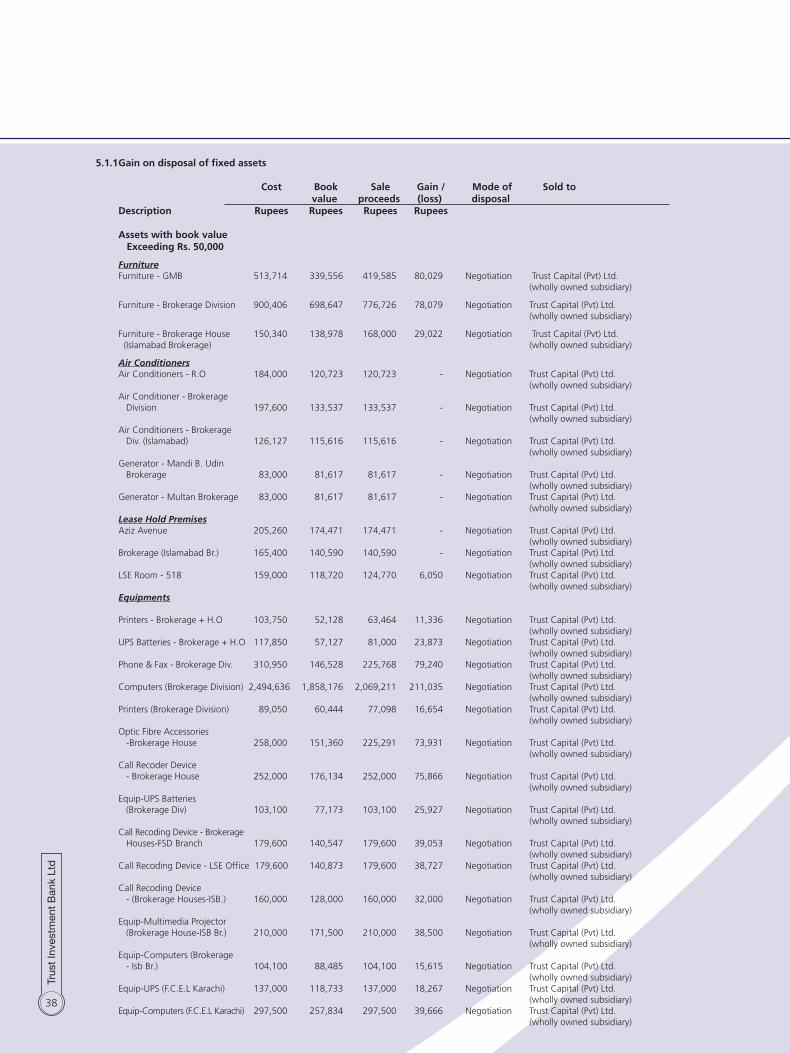
38
5.1.1 Gain on disposal of fixed assets Cost Book Sale Gain / Mode of Sold to value proceeds (loss) disposal Description Rupees Rupees Rupees Rupees Assets with book value Exceeding Rs. 50,000 Furniture Furniture - GMB 513,714 339,556 419,585 80,029 Negotiation Trust Capital (Pvt) Ltd. (wholly owned subsidiary) Furniture - Brokerage Division 900,406 698,647 776,726 78,079 Negotiation Trust Capital (Pvt) Ltd. (wholly owned subsidiary) Furniture - Brokerage House 150,340 138,978 168,000 29,022 Negotiation Trust Capital (Pvt) Ltd. (Islamabad Brokerage) (wholly owned subsidiary) Air Conditioners Air Conditioners - R.O 184,000 120,723 120,723 - Negotiation Trust Capital (Pvt) Ltd. (wholly owned subsidiary) Air Conditioner - Brokerage Division 197,600 133,537 133,537 - Negotiation Trust Capital (Pvt) Ltd. (wholly owned subsidiary) Air Conditioners - Brokerage Div. (Islamabad) 126,127 115,616 115,616 - Negotiation Trust Capital (Pvt) Ltd. (wholly owned subsidiary) Generator - Mandi B. Udin Brokerage 83,000 81,617 81,617 - Negotiation Trust Capital (Pvt) Ltd. (wholly owned subsidiary) Generator - Multan Brokerage 83,000 81,617 81,617 - Negotiation Trust Capital (Pvt) Ltd. (wholly owned subsidiary) Lease Hold Premises Aziz Avenue 205,260 174,471 174,471 - Negotiation Trust Capital (Pvt) Ltd. (wholly owned subsidiary) Brokerage (Islamabad Br.) 165,400 140,590 140,590 - Negotiation Trust Capital (Pvt) Ltd. (wholly owned subsidiary) LSE Room - 518 159,000 118,720 124,770 6,050 Negotiation Trust Capital (Pvt) Ltd. (wholly owned subsidiary) Equipments Printers - Brokerage + H.O 103,750 52,128 63,464 11,336 Negotiation Trust Capital (Pvt) Ltd. (wholly owned subsidiary) UPS Batteries - Brokerage + H.O 117,850 57,127 81,000 23,873 Negotiation Trust Capital (Pvt) Ltd. (wholly owned subsidiary) Phone & Fax - Brokerage Div. 310,950 146,528 225,768 79,240 Negotiation Trust Capital (Pvt) Ltd. (wholly owned subsidiary) Computers (Brokerage Division) 2,494,636 1,858,176 2,069,211 211,035 Negotiation Trust Capital (Pvt) Ltd. (wholly owned subsidiary) Printers (Brokerage Division) 89,050 60,444 77,098 16,654 Negotiation Trust Capital (Pvt) Ltd. (wholly owned subsidiary) Optic Fibre Accessories -Brokerage House 258,000 151,360 225,291 73,931 Negotiation Trust Capital (Pvt) Ltd. (wholly owned subsidiary) Call Recoder Device - Brokerage House 252,000 176,134 252,000 75,866 Negotiation Trust Capital (Pvt) Ltd. (wholly owned subsidiary) Equip-UPS Batteries (Brokerage Div) 103,100 77,173 103,100 25,927 Negotiation Trust Capital (Pvt) Ltd. (wholly owned subsidiary) Call Recoding Device - Brokerage Houses-FSD Branch 179,600 140,547 179,600 39,053 Negotiation Trust Capital (Pvt) Ltd. (wholly owned subsidiary) Call Recoding Device - LSE Office 179,600 140,873 179,600 38,727 Negotiation Trust Capital (Pvt) Ltd. (wholly owned subsidiary) Call Recoding Device - (Brokerage Houses-ISB.) 160,000 128,000 160,000 32,000 Negotiation Trust Capital (Pvt) Ltd. (wholly owned subsidiary) Equip-Multimedia Projector (Brokerage House-ISB Br.) 210,000 171,500 210,000 38,500 Negotiation Trust Capital (Pvt) Ltd. (wholly owned subsidiary) Equip-Computers (Brokerage - Isb Br.) 104,100 88,485 104,100 15,615 Negotiation Trust Capital (Pvt) Ltd. (wholly owned subsidiary) Equip-UPS (F.C.E.L Karachi) 137,000 118,733 137,000 18,267 Negotiation Trust Capital (Pvt) Ltd. (wholly owned subsidiary) Equip-Computers (F.C.E.L Karachi) 297,500 257,834 297,500 39,666 Negotiation Trust Capital (Pvt) Ltd. (wholly owned subsidiary)

39
Equip-Computers (LSE-Room # 518) 84,500 73,233 84,500 11,267 Negotiation Trust Capital (Pvt) Ltd. (wholly owned subsidiary) Equip-Call Recording Device (Multan Brokerage Div) 60,060 57,057 60,060 3,003 Negotiation Trust Capital (Pvt) Ltd. (wholly owned subsidiary) Equip-Call Recording Device (Rwp Brokerage Div) 60,060 57,057 60,060 3,003 Negotiation Trust Capital (Pvt) Ltd. (wholly owned subsidiary) Equip-Call Recording Device (Multan Brokerage Div) 58,600 56,028 58,600 2,572 Negotiation Trust Capital (Pvt) Ltd. (wholly owned subsidiary) Vehicles Vehicle-Honda City 855,500 513,300 795,500 282,200 Negotiation Trust Capital (Pvt) Ltd. (wholly owned subsidiary) Vehicle-Honda VTI 1800 969,000 678,300 950,000 271,700 Negotiation Trust Capital (Pvt) Ltd. (wholly owned subsidiary) Vehicle-LEC 3028 725,000 676,667 800,000 123,333 Negotiation Trust Capital (Pvt) Ltd. (wholly owned subsidiary) Vehicle-Honda CG 125 70,890 66,164 70,000 3,836 Negotiation Trust Capital (Pvt) Ltd. (wholly owned subsidiary) Vehicle-Honda City 906,000 860,700 1,030,000 169,300 Negotiation Trust Capital (Pvt) Ltd. (wholly owned subsidiary) Vehicle-Toyota Corolla XLI 133 945,725 898,439 1,030,000 131,561 Negotiation Trust Capital (Pvt) Ltd. (wholly owned subsidiary) Vehicle-Suzuki Mehran VXR 456,800 441,853 498,452 56,599 Negotiation Trust Capital (Pvt) Ltd. (wholly owned subsidiary) Vehicle-LRN 3426 496,000 - 302,000 302,000 Negotiation Mr. Sabir Malik Vehicle-LZL- 389 790,500 118,575 480,000 361,425 Negotiation Mr. Muhammad Umar Vehicle-Suzuki LEC 9170 419,050 300,334 370,000 69,666 Negotiation Mr. Farhan Baig Vehicle-LES 3005 421,000 322,767 405,000 82,233 Negotiation Mr. Muhammad Nawaz Vehicle-LEA 8381 685,000 388,166 600,000 211,834 Negotiation Mr. Nasir Gulzar Vehile-Motor Cycle LZX 4093 73,000 - 24,850 24,850 Negotiation Mr. Ashfaq Ahmad Vehicle-Suzuki Cultus 703,705 504,322 504,322 - Negotiation Trust Capital (Pvt) Ltd. (wholly owned subsidiary) Vehicle-LZT 3138 325,000 297,917 235,000 (62,917) Negotiation Mr. Malik Siraj Vehicle-LZV 251 750,000 675,000 760,000 85,000 Negotiation Mr. Aamir Iqbal Vehicle- LED 9368 840,500 532,317 865,000 332,683 Negotiation Mr. Hafeez Ahmad Vehicle- LEB 6494 663,000 375,700 610,000 234,300 Negotiation Mr. Aamir Mirza Vehicle-LEF-8276 724,000 470,600 525,000 54,400 Negotiation Mr. Hafeez Ahmad Vehicle-LEE 5320 1,046,720 628,032 700,000 71,968 Negotiation Mr. Mudassir Hussain Naqvi Assets with book value below Rs. 50,000 850,222 529,632 643,554 113,922 Negotiation Various 2009 21,744,815 15,291,274 19,163,882 3,872,608
Cost Book Sale Gain / Mode of Sold to value proceeds (loss) disposal Description Rupees Rupees Rupees Rupees Assets with book value exceeding Rs. 50,000 Buildings Plot at Kot Shabudin 15,165,000 14,977,790 22,725,000 7,747,210 Negotiation Ch.Munawar Iqbal 7-B/5 Aziz Avenue 12,559,493 10,160,245 23,000,000 12,839,755 Negotiation M/S Crescent Powertech Limited Equipments Telephone Exchange 162,000 131,175 70,000 (61,175) Negotiation Panasonic Media Solution vehicles Vehicle-LZA-9669 790,500 250,325 560,000 309,675 Company Policy Abdul Rauf Ghani Vehicle-LZC-3883 790,500 250,325 560,000 309,675 Company Policy Abdul Aziz Khan Niazi Vehicle-LWE-6740 1,282,500 726,750 875,000 148,250 Company Policy Rashid Ahmed Vehicle-LZZ-955 830,500 415,250 580,000 164,750 Company Policy Mudassir kaiser Pal Vehicle-LEC-9157 396,050 376,247 365,000 (11,247) Stolen New Jubliee Insurance Vehicle-LWO-9825 881,124 543,360 600,000 56,640 Negotiation Mirza Talat Mehmood Baig Vehicle-LRK-701 1,174,000 - 721,000 721,000 Negotiation Sumaira Amjad Vehicle-LZN-6613 1,329,850 354,627 676,000 321,373 Negotiation Arshad Ali
Assets with book value below Rs. 50,000 233,244 128,707 31,300 (97,407) Negotiation Various 2008 35,594,761 28,314,801 50,763,300 22,448,499
Cost Book Sale Gain / Mode of Sold to value proceeds (loss) disposal Description Rupees Rupees Rupees Rupees
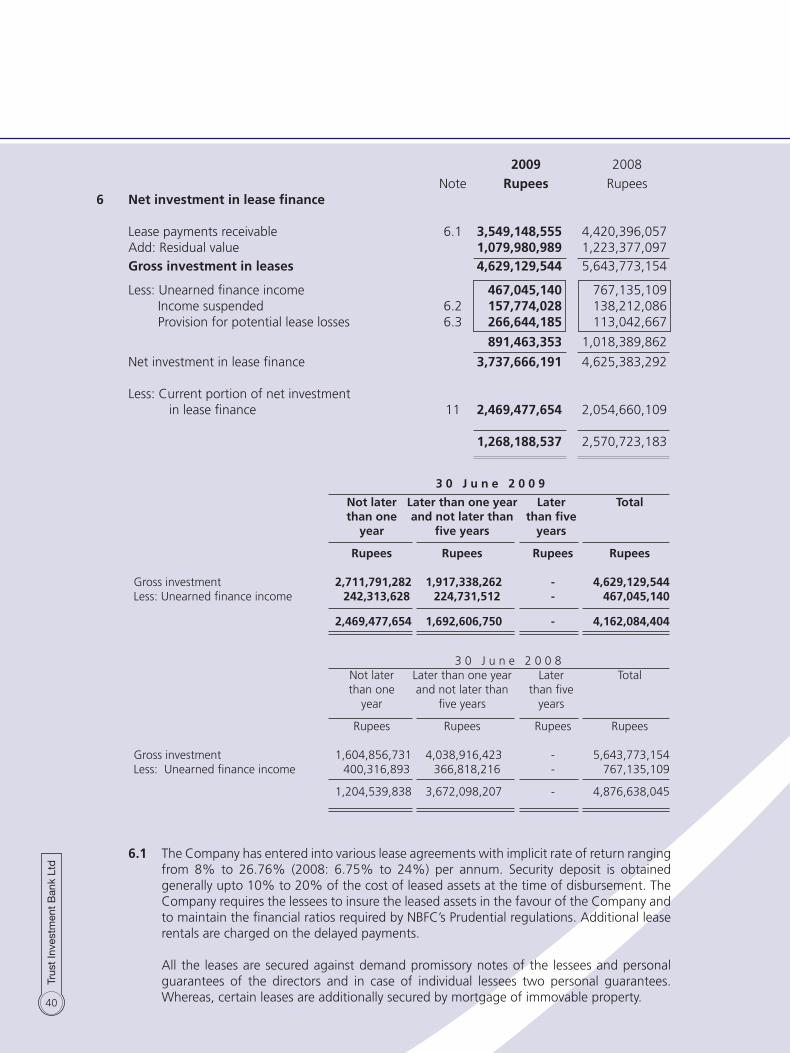
40
2009 2008
Note Rupees Rupees6 Net investment in lease finance Lease payments receivable 6.1 3,549,148,555 4,420,396,057 Add: Residual value 1,079,980,989 1,223,377,097 Gross investment in leases 4,629,129,544 5,643,773,154
Less: Unearned finance income 467,045,140 767,135,109 Income suspended 6.2 157,774,028 138,212,086 Provision for potential lease losses 6.3 266,644,185 113,042,667
891,463,353 1,018,389,862
Net investment in lease finance 3,737,666,191 4,625,383,292 Less: Current portion of net investment in lease finance 11 2,469,477,654 2,054,660,109 1,268,188,537 2,570,723,183
3 0 J u n e 2 0 0 9
Not later Later than one year Later Total than one and not later than than five year five years years Rupees Rupees Rupees Rupees Gross investment 2,711,791,282 1,917,338,262 - 4,629,129,544 Less: Unearned finance income 242,313,628 224,731,512 - 467,045,140 2,469,477,654 1,692,606,750 - 4,162,084,404
3 0 J u n e 2 0 0 8 Not later Later than one year Later Total than one and not later than than five year five years years Rupees Rupees Rupees Rupees Gross investment 1,604,856,731 4,038,916,423 - 5,643,773,154 Less: Unearned finance income 400,316,893 366,818,216 - 767,135,109 1,204,539,838 3,672,098,207 - 4,876,638,045
6.1 The Company has entered into various lease agreements with implicit rate of return ranging
from 8% to 26.76% (2008: 6.75% to 24%) per annum. Security deposit is obtained generally upto 10% to 20% of the cost of leased assets at the time of disbursement. The Company requires the lessees to insure the leased assets in the favour of the Company and to maintain the financial ratios required by NBFC’s Prudential regulations. Additional lease rentals are charged on the delayed payments.
All the leases are secured against demand promissory notes of the lessees and personal
guarantees of the directors and in case of individual lessees two personal guarantees. Whereas, certain leases are additionally secured by mortgage of immovable property.
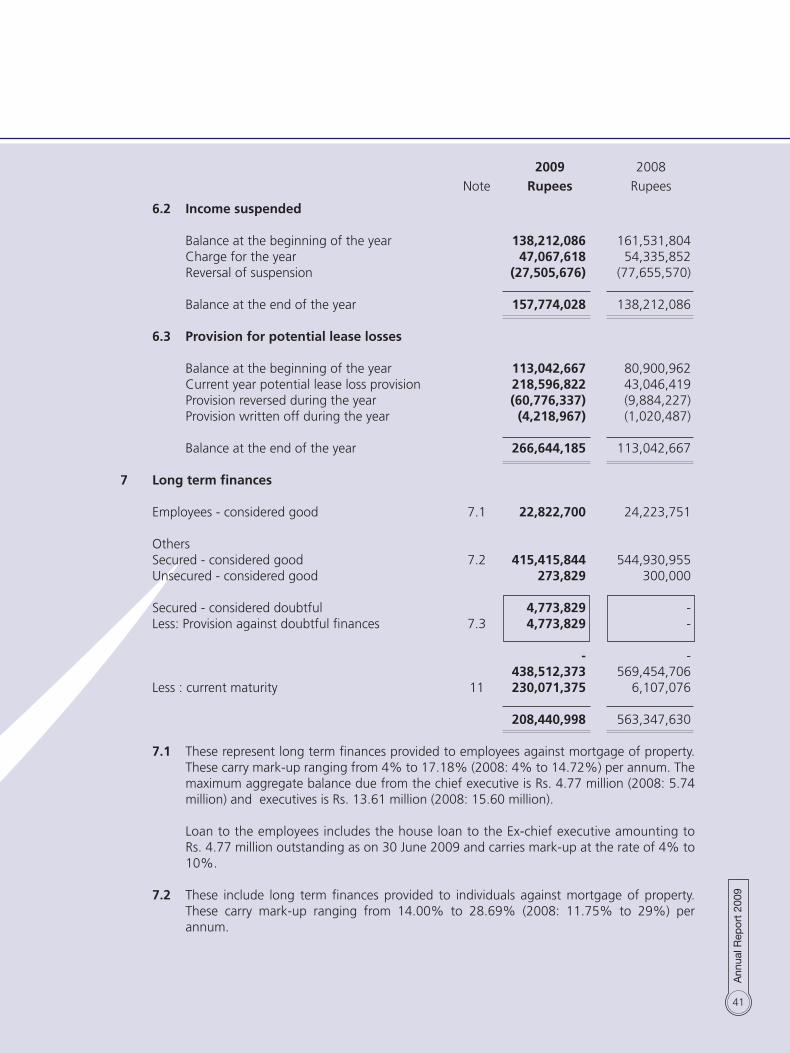
41
2009 2008
Note Rupees Rupees 6.2 Income suspended Balance at the beginning of the year 138,212,086 161,531,804 Charge for the year 47,067,618 54,335,852 Reversal of suspension (27,505,676) (77,655,570)
Balance at the end of the year 157,774,028 138,212,086 6.3 Provision for potential lease losses Balance at the beginning of the year 113,042,667 80,900,962 Current year potential lease loss provision 218,596,822 43,046,419 Provision reversed during the year (60,776,337) (9,884,227) Provision written off during the year (4,218,967) (1,020,487)
Balance at the end of the year 266,644,185 113,042,667 7 Long term finances Employees - considered good 7.1 22,822,700 24,223,751 Others Secured - considered good 7.2 415,415,844 544,930,955 Unsecured - considered good 273,829 300,000
Secured - considered doubtful 4,773,829 - Less: Provision against doubtful finances 7.3 4,773,829 - - - 438,512,373 569,454,706 Less : current maturity 11 230,071,375 6,107,076 208,440,998 563,347,630 7.1 These represent long term finances provided to employees against mortgage of property.
These carry mark-up ranging from 4% to 17.18% (2008: 4% to 14.72%) per annum. The maximum aggregate balance due from the chief executive is Rs. 4.77 million (2008: 5.74 million) and executives is Rs. 13.61 million (2008: 15.60 million).
Loan to the employees includes the house loan to the Ex-chief executive amounting to
Rs. 4.77 million outstanding as on 30 June 2009 and carries mark-up at the rate of 4% to 10%.
7.2 These include long term finances provided to individuals against mortgage of property.
These carry mark-up ranging from 14.00% to 28.69% (2008: 11.75% to 29%) per annum.
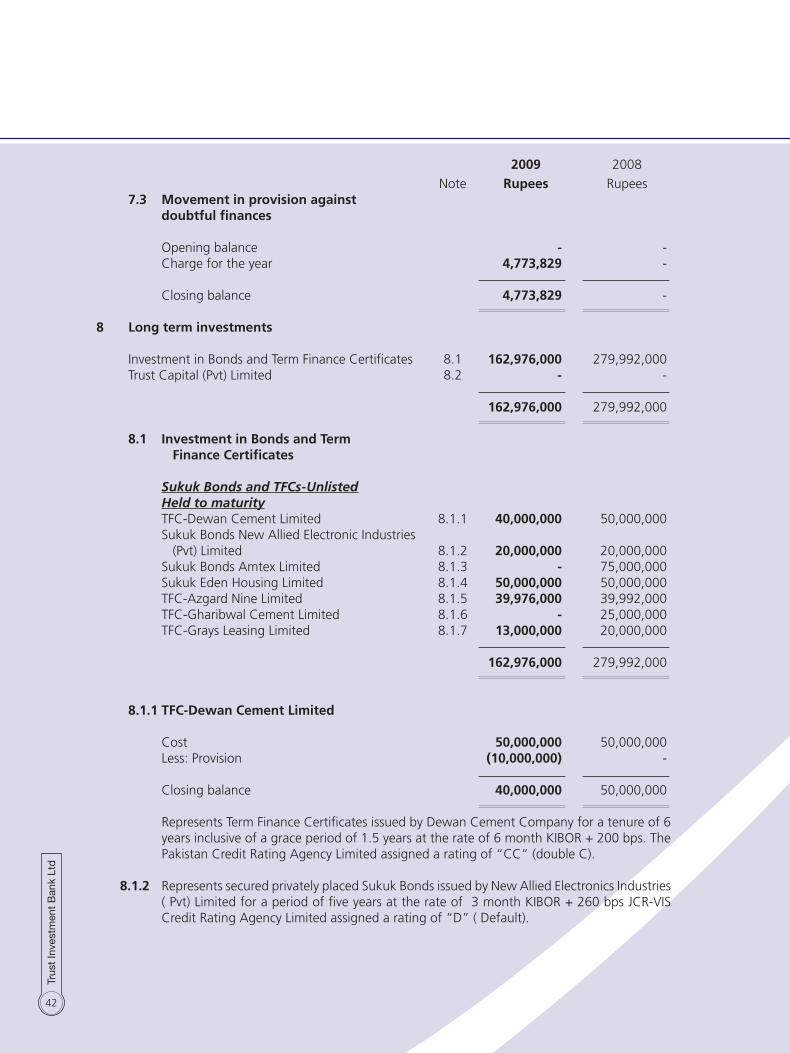
42
2009 2008
Note Rupees Rupees 7.3 Movement in provision against doubtful finances Opening balance - - Charge for the year 4,773,829 - Closing balance 4,773,829 -
8 Long term investments Investment in Bonds and Term Finance Certificates 8.1 162,976,000 279,992,000 Trust Capital (Pvt) Limited 8.2 - -
162,976,000 279,992,000 8.1 Investment in Bonds and Term finance Certificates Sukuk Bonds and TFCs-Unlisted Held to maturity TFC-Dewan Cement Limited 8.1.1 40,000,000 50,000,000 Sukuk Bonds New Allied Electronic Industries (Pvt) Limited 8.1.2 20,000,000 20,000,000 Sukuk Bonds Amtex Limited 8.1.3 - 75,000,000 Sukuk Eden Housing Limited 8.1.4 50,000,000 50,000,000 TFC-Azgard Nine Limited 8.1.5 39,976,000 39,992,000 TFC-Gharibwal Cement Limited 8.1.6 - 25,000,000 TFC-Grays Leasing Limited 8.1.7 13,000,000 20,000,000 162,976,000 279,992,000 8.1.1 TfC-Dewan Cement Limited Cost 50,000,000 50,000,000 Less: Provision (10,000,000) - Closing balance 40,000,000 50,000,000 Represents Term Finance Certificates issued by Dewan Cement Company for a tenure of 6
years inclusive of a grace period of 1.5 years at the rate of 6 month KIBOR + 200 bps. The Pakistan Credit Rating Agency Limited assigned a rating of “CC” (double C).
8.1.2 Represents secured privately placed Sukuk Bonds issued by New Allied Electronics Industries ( Pvt) Limited for a period of five years at the rate of 3 month KIBOR + 260 bps JCR-VIS Credit Rating Agency Limited assigned a rating of “D” ( Default).
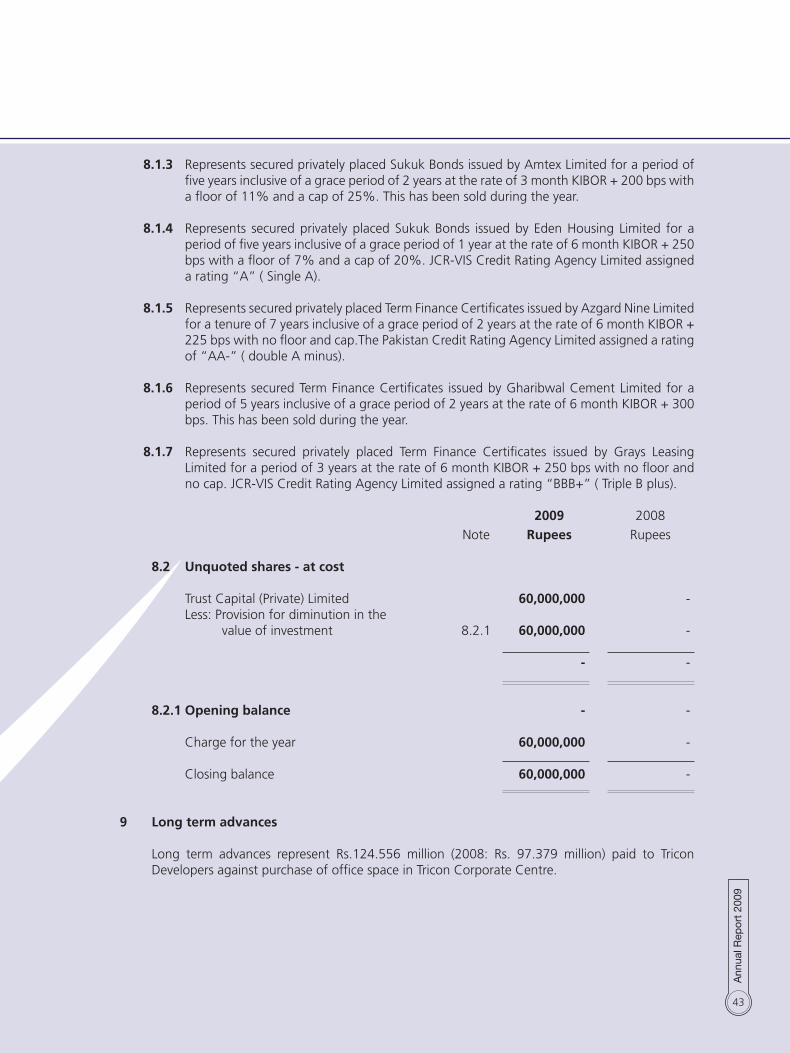
43
8.1.3 Represents secured privately placed Sukuk Bonds issued by Amtex Limited for a period of five years inclusive of a grace period of 2 years at the rate of 3 month KIBOR + 200 bps with a floor of 11% and a cap of 25%. This has been sold during the year.
8.1.4 Represents secured privately placed Sukuk Bonds issued by Eden Housing Limited for a
period of five years inclusive of a grace period of 1 year at the rate of 6 month KIBOR + 250 bps with a floor of 7% and a cap of 20%. JCR-VIS Credit Rating Agency Limited assigned a rating “A” ( Single A).
8.1.5 Represents secured privately placed Term Finance Certificates issued by Azgard Nine Limited
for a tenure of 7 years inclusive of a grace period of 2 years at the rate of 6 month KIBOR + 225 bps with no floor and cap.The Pakistan Credit Rating Agency Limited assigned a rating of “AA-” ( double A minus).
8.1.6 Represents secured Term Finance Certificates issued by Gharibwal Cement Limited for a
period of 5 years inclusive of a grace period of 2 years at the rate of 6 month KIBOR + 300 bps. This has been sold during the year.
8.1.7 Represents secured privately placed Term Finance Certificates issued by Grays Leasing
Limited for a period of 3 years at the rate of 6 month KIBOR + 250 bps with no floor and no cap. JCR-VIS Credit Rating Agency Limited assigned a rating “BBB+” ( Triple B plus).
2009 2008
Note Rupees Rupees
8.2 Unquoted shares - at cost Trust Capital (Private) Limited 60,000,000 - Less: Provision for diminution in the value of investment 8.2.1 60,000,000 - - -
8.2.1 Opening balance - - Charge for the year 60,000,000 - Closing balance 60,000,000 -
9 Long term advances Long term advances represent Rs.124.556 million (2008: Rs. 97.379 million) paid to Tricon
Developers against purchase of office space in Tricon Corporate Centre.
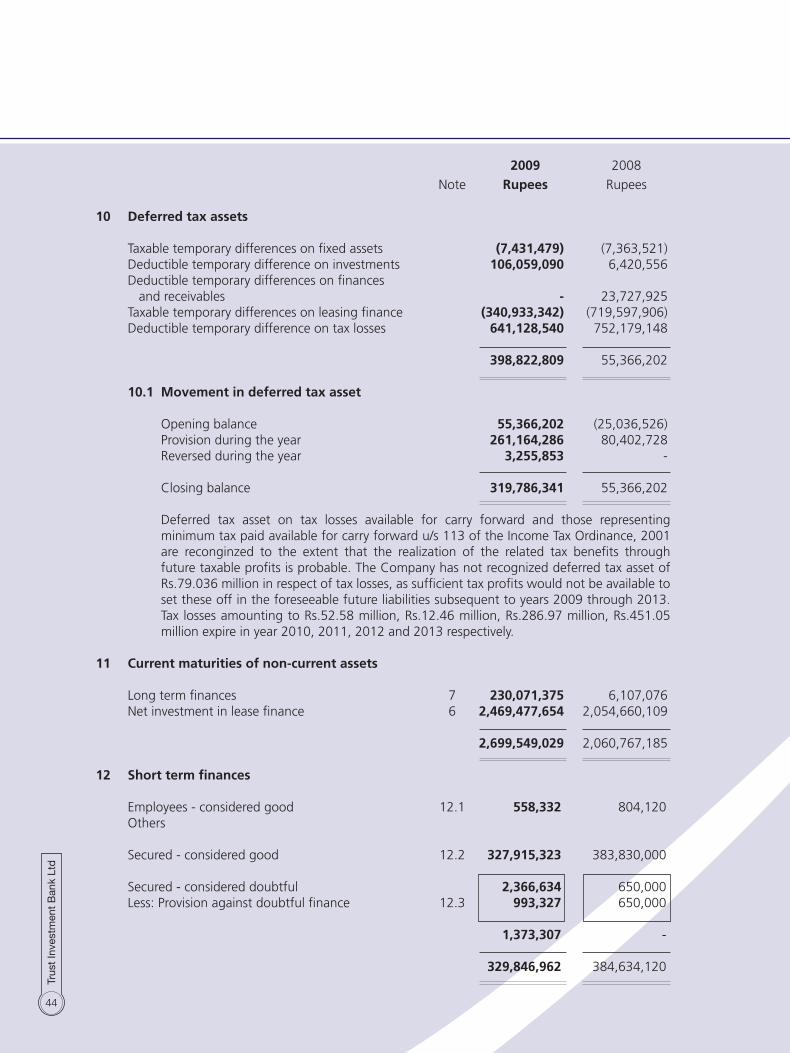
44
2009 2008
Note Rupees Rupees 10 Deferred tax assets Taxable temporary differences on fixed assets (7,431,479) (7,363,521) Deductible temporary difference on investments 106,059,090 6,420,556 Deductible temporary differences on finances and receivables - 23,727,925 Taxable temporary differences on leasing finance (340,933,342) (719,597,906) Deductible temporary difference on tax losses 641,128,540 752,179,148
398,822,809 55,366,202 10.1 Movement in deferred tax asset Opening balance 55,366,202 (25,036,526) Provision during the year 261,164,286 80,402,728 Reversed during the year 3,255,853 - Closing balance 319,786,341 55,366,202 Deferred tax asset on tax losses available for carry forward and those representing
minimum tax paid available for carry forward u/s 113 of the Income Tax Ordinance, 2001 are reconginzed to the extent that the realization of the related tax benefits through future taxable profits is probable. The Company has not recognized deferred tax asset of Rs.79.036 million in respect of tax losses, as sufficient tax profits would not be available to set these off in the foreseeable future liabilities subsequent to years 2009 through 2013. Tax losses amounting to Rs.52.58 million, Rs.12.46 million, Rs.286.97 million, Rs.451.05 million expire in year 2010, 2011, 2012 and 2013 respectively.
11 Current maturities of non-current assets Long term finances 7 230,071,375 6,107,076 Net investment in lease finance 6 2,469,477,654 2,054,660,109 2,699,549,029 2,060,767,185 12 Short term finances Employees - considered good 12.1 558,332 804,120 Others Secured - considered good 12.2 327,915,323 383,830,000
Secured - considered doubtful 2,366,634 650,000 Less: Provision against doubtful finance 12.3 993,327 650,000 1,373,307 - 329,846,962 384,634,120
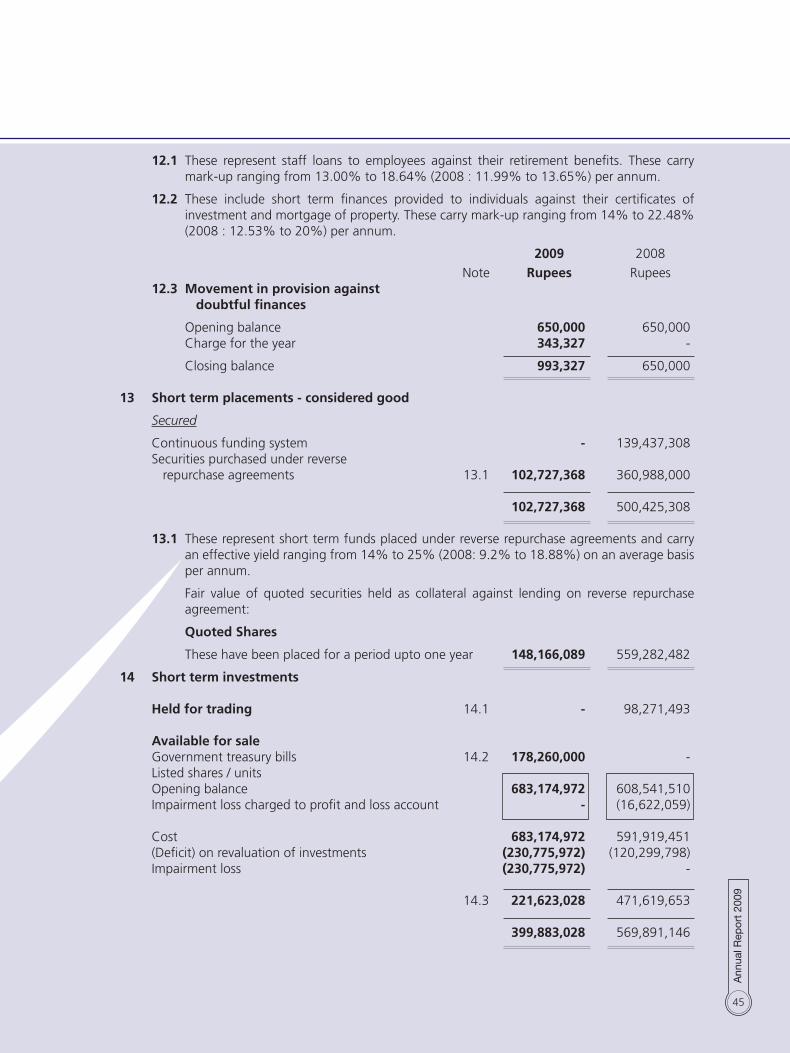
45
12.1 These represent staff loans to employees against their retirement benefits. These carry mark-up ranging from 13.00% to 18.64% (2008 : 11.99% to 13.65%) per annum.
12.2 These include short term finances provided to individuals against their certificates of investment and mortgage of property. These carry mark-up ranging from 14% to 22.48% (2008 : 12.53% to 20%) per annum.
2009 2008
Note Rupees Rupees 12.3 Movement in provision against doubtful finances
Opening balance 650,000 650,000 Charge for the year 343,327 -
Closing balance 993,327 650,000 13 Short term placements - considered good
Secured
Continuous funding system - 139,437,308 Securities purchased under reverse repurchase agreements 13.1 102,727,368 360,988,000 102,727,368 500,425,308
13.1 These represent short term funds placed under reverse repurchase agreements and carry an effective yield ranging from 14% to 25% (2008: 9.2% to 18.88%) on an average basis per annum.
Fair value of quoted securities held as collateral against lending on reverse repurchase agreement:
Quoted Shares
These have been placed for a period upto one year 148,166,089 559,282,482
14 Short term investments Held for trading 14.1 - 98,271,493 Available for sale Government treasury bills 14.2 178,260,000 - Listed shares / units Opening balance 683,174,972 608,541,510 Impairment loss charged to profit and loss account - (16,622,059)
Cost 683,174,972 591,919,451 (Deficit) on revaluation of investments (230,775,972) (120,299,798) Impairment loss (230,775,972) -
14.3 221,623,028 471,619,653 399,883,028 569,891,146
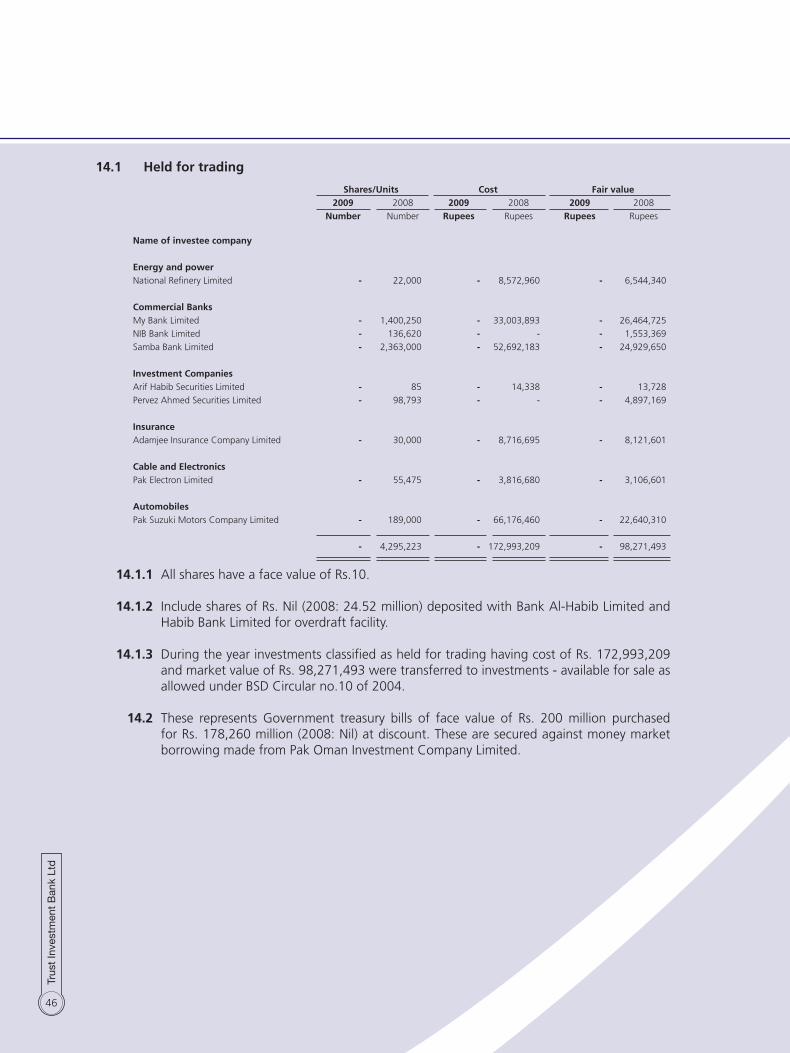
46
14.1 Held for trading
Shares/Units Cost fair value 2009 2008 2009 2008 2009 2008
Number Number Rupees Rupees Rupees Rupees
Name of investee company
Energy and power
National Refinery Limited - 22,000 - 8,572,960 - 6,544,340
Commercial Banks
My Bank Limited - 1,400,250 - 33,003,893 - 26,464,725
NIB Bank Limited - 136,620 - - - 1,553,369
Samba Bank Limited - 2,363,000 - 52,692,183 - 24,929,650
Investment Companies
Arif Habib Securities Limited - 85 - 14,338 - 13,728
Pervez Ahmed Securities Limited - 98,793 - - - 4,897,169
Insurance
Adamjee Insurance Company Limited - 30,000 - 8,716,695 - 8,121,601
Cable and Electronics
Pak Electron Limited - 55,475 - 3,816,680 - 3,106,601
Automobiles
Pak Suzuki Motors Company Limited - 189,000 - 66,176,460 - 22,640,310
- 4,295,223 - 172,993,209 - 98,271,493
14.1.1 All shares have a face value of Rs.10. 14.1.2 Include shares of Rs. Nil (2008: 24.52 million) deposited with Bank Al-Habib Limited and
Habib Bank Limited for overdraft facility. 14.1.3 During the year investments classified as held for trading having cost of Rs. 172,993,209
and market value of Rs. 98,271,493 were transferred to investments - available for sale as allowed under BSD Circular no.10 of 2004.
14.2 These represents Government treasury bills of face value of Rs. 200 million purchased for Rs. 178,260 million (2008: Nil) at discount. These are secured against money market borrowing made from Pak Oman Investment Company Limited.

47
14.3 Available for sale
Shares/Units Cost fair value 2009 2008 2009 2008 2009 2008
Number Number Rupees Rupees Rupees Rupees
Name of investee company
fertilizer
Engro Chemicals Pakistan Limited 348,740 249,100 86,665,143 84,613,604 44,788,678 69,949,771
Fauji Fertilizer Company Limited 2 - - - 174 -
Energy and power
Pakistan State Oil Limited 86,300 82,000 42,907,645 42,087,397 18,437,995 34,213,680
Attock Refinery Limited 158,400 147,000 39,583,538 44,081,667 19,766,736 36,732,360
Pakistan Refinery Limited 45,012 45,000 6,813,094 6,812,100 4,042,078 6,812,100
National Refinery Limited 22,000 - 6,544,386 - 4,840,440 -
Commercial Banks
MCB Bank Limited 220,097 200,000 85,813,733 85,803,207 34,121,638 65,276,000
Bank Islami Pakistan Limited 998,000 998,000 19,094,198 19,094,198 6,357,260 14,780,380
My Bank Limited 1,400,250 - 26,458,253 - 5,124,915 -
NIB Bank Limited 68,620 - 780,209 - 325,945 -
Samba Bank Limited 2,363,000 - 24,929,650 - 7,041,740 -
Investment Companies
Arif Habib Securities Limited 462,606 410,000 64,832,558 71,824,983 12,786,430 66,206,800
Pervez Ahmed Securities Limited 949,043 850,250 63,591,030 58,693,860 5,020,437 42,146,892
Jahangir Siddiqui Company Limited 402,532 110,000 83,083,964 81,825,798 9,334,717 58,316,500
Arif Habib Limited 110,000 88,000 26,666,912 26,666,912 7,357,900 21,735,120
PICIC Growth Fund 12 - - - 101 -
Insurance
Adamjee Insurance Company Limited 64,900 29,000 17,469,566 9,341,761 5,450,951 7,850,900
Cement
D. G. Khan Cement Limited 336,000 280,000 19,919,200 18,799,200 9,962,400 18,799,200
Textile
Nishat Mills Limited 335,000 335,000 42,274,764 42,274,764 12,669,700 28,799,950
Cable and Electronics
Pak Electron Limited 55,475 - 3,106,600 - 1,359,692 -
Automobiles
Pak Suzuki Motors Company Limited 189,000 - 22,640,529 - 12,833,100 -
8,614,989 3,823,350 683,174,972 591,919,451 221,623,028 471,619,653
14.3.1 The Karachi Stock Exchange (Guarantee) Limited (“KSE”) placed a “Floor Mechanism” on the market value of securities based on the closing prices of securities prevailing as on 27 August 2008. Under the “Floor Mechanism“, the individual security price of equity securities could vary within normal circuit breaker limit, but not below the floor price level. The mechanism was effective from 28 August 2008 and remained in place until 15 December 2008. Consequent to the introduction of “Floor Mechanism” by KSE, the market volume declined significantly during the period from 27 August 2008 to 15 December 2008. There were lower floors on a number of securities at 31 December 2008.

48
The Securities and Exchange Commission of Pakistan (“SECP”) vide notification SRO 150 (1)/2009 dated 13 February 2009 allowed that the impairment loss, if any, recognized as on 31 December 2008 due to valuation of listed equity investments held as “Available for Sale” to quoted market prices may be shown under the equity. The amount shown under the equity including any adjustment/effect for price movements is to be taken to Profit and Loss Account on quarterly basis during the year ending 31 December 2009. The amount shown under equity at 31 December 2008 was to be treated as a charge to Profit and Loss Account for the purposes of distribution as dividend.
The impairment loss based on market values as at 31 December 2008 was determined at Rs. (476.786) million and was shown under equity. Of the impairment loss existing on December 2008 an amount of Rs. (230.775) million has been charged to the profit and loss account during the year ended 30 June 2009. The amount of Rs. (230.775) million being balance impairment loss as at 30 June 2009 has been retained in deficit on revaluation of investments. In view of the “Floor Mechanism” as explained above and current economic conditions in the country, the management believes that these are “rare circumstances’’ and the plunge in equity markets cannot be considered to be a fair reflection of equity values. Therefore recognition of impairment for “Available for Sale” equity securities through Profit and Loss account will not reflect the correct financial performance of the Company.
The recognition of impairment loss based on market values as at 30 June 2009 would have had the following effect on these financial statements:
2009 Rupees Effect of Impairment Loss in Profit and Loss Account (230,775,972) Effect on Tax charge for the year Nil Decrease in profit for the year (230,775,972) Increase in deficit on revaluation of Available for Sale securities (230,775,972) Decrease in Un-appropriated profit (230,775,972) Decrease in earning per share (3.94) 14.3.2 All shares have a face value of Rs.10. 14.3.3 Include shares of Rs. 152.60 million (2008: Rs. 309.27 million) deposited with Bank Al-
Habib Limited and Habib Bank Limited for overdraft facility. 14.3.4 The fair values are determined with reference to quoted stock exchange prices as at 30
June 2009.
2009 2008
Note Rupees Rupees15 Markup accrued Mark-up accrued on sukuk bonds and term finance certificates 15.1 2,484,511 9,102,971 Mark-up accrued on short term and long term finances 15.2 63,140,610 21,985,378 Mark-up accrued on advance against leases 7,116,176 5,982,175
72,741,297 37,070,524
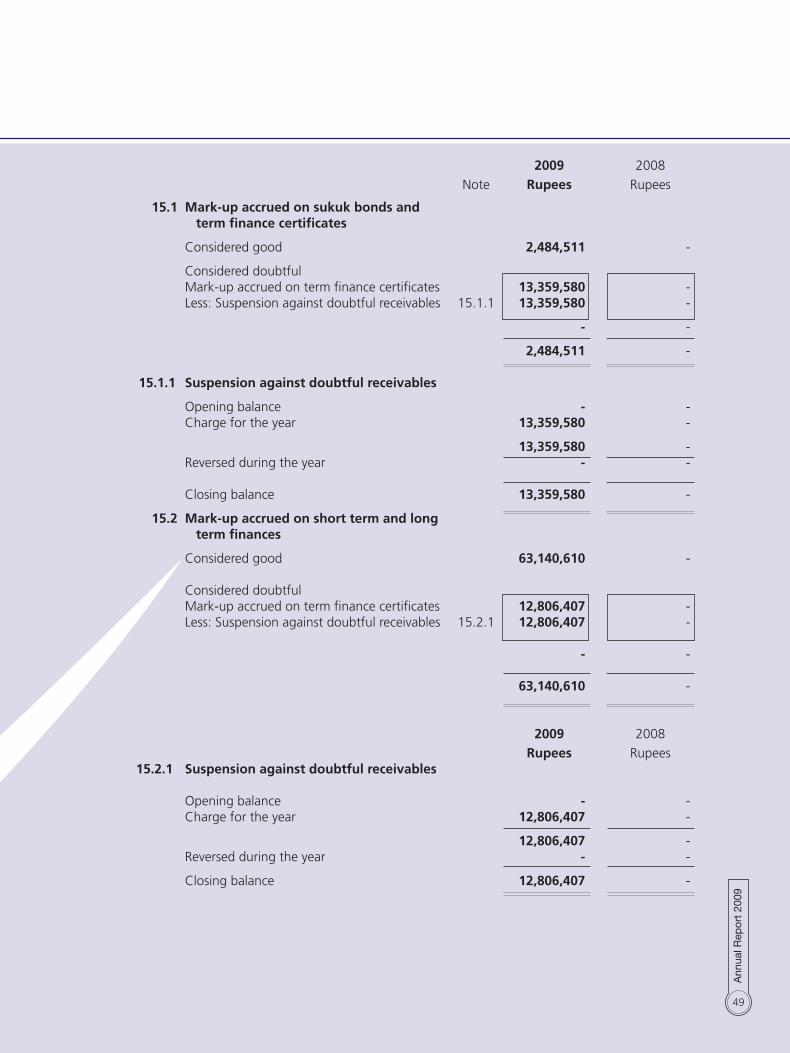
49
2009 2008
Note Rupees Rupees
15.1 Mark-up accrued on sukuk bonds and term finance certificates Considered good 2,484,511 - Considered doubtful Mark-up accrued on term finance certificates 13,359,580 - Less: Suspension against doubtful receivables 15.1.1 13,359,580 - - - 2,484,511 - 15.1.1 Suspension against doubtful receivables Opening balance - - Charge for the year 13,359,580 - 13,359,580 - Reversed during the year - -
Closing balance 13,359,580 - 15.2 Mark-up accrued on short term and long term finances Considered good 63,140,610 - Considered doubtful Mark-up accrued on term finance certificates 12,806,407 - Less: Suspension against doubtful receivables 15.2.1 12,806,407 -
- -
63,140,610 -
2009 2008
Rupees Rupees 15.2.1 Suspension against doubtful receivables Opening balance - - Charge for the year 12,806,407 - 12,806,407 - Reversed during the year - - Closing balance 12,806,407 -

50
2009 2008 Note Rupees Rupees
16 Advances, prepayments and other receivables Advance to employees-considered good - 16,167 Advance against leases 16.1 47,690,836 98,118,169 Advance against purchase of fixed assets 800,000 5,023,459 Other advances - considered good 525,032 381,801 Initial transaction cost of term finance certificates - 5,549,389 Receivable from Trust Capital (Private) Limited 16.2 284,038,297 410,780,744 Receivable from broker 17,595,083 - Prepayments 9,308,590 9,843,933 Miscellaneous receivables from lessees 16.3 110,985,985 148,625,216 Other receivables - considered good 7,007,878 3,600,281 477,951,701 681,939,159
16.1 These represent advance given to suppliers on behalf of lessees in respect of assets to be leased and are eventually transferred to net investment in lease finance when the assets are brought into use. Lessees are being charged with mark-up at 15.29% to 21.70% (2008: 14% to 20%) per annum against advances.
2009 2008 Note Rupees Rupees 16.2 Receivable from Trust Capital (Private) Limited
Considered good 284,038,297 - Considered doubtful 104,874,965 - Less: Provision against doubtful receivables 16.2.1 104,874,965 -
284,038,297 - 284,038,297 - 16.2.1 Provision against doubtful receivables from Trust Capital (Private) Limited Opening balance - - Charge for the year 104,874,965 - 104,874,965 - Reversed during the year - - Closing balance 104,874,965 - 16.3 Miscellaneous receivables from lessees
Considered good 110,985,985 148,625,216 Considered doubtful 105,260,821 67,144,071 Less: Provision against doubtful receivables 16.3.1 105,260,821 67,144,071 - - 110,985,985 148,625,216

51
2009 2008
Note Rupees Rupees
16.3.1 Provision against doubtful receivables Opening balance 67,144,071 59,159,946 Charge for the year 63,059,967 14,768,275 130,204,038 73,928,221 Reversed during the year (24,943,217) (6,784,150)
Closing balance 105,260,821 67,144,071
17 Cash and bank balances
Cash in hand 1,151,288 1,175,599 With banks in: Deposit accounts 17.1 125,693,024 232,202 Current accounts 31,947,815 91,880,971 157,640,839 92,113,173 158,792,127 93,288,772 17.1 Deposit accounts carry markup rate ranging from 4% to 12% per annum (2008: 4% to
7%).
2009 2008 2009 2008 Note No. of No. of Rupees Rupees shares shares18 SHARE CAPITAL
Authorized Ordinary shares of Rs. 10 each 80,000,000 80,000,000 800,000,000 800,000,000 Preference shares of Rs. 10 each 30,000,000 30,000,000 300,000,000 300,000,000 110,000,000 110,000,000 1,100,000,000 1,100,000,000 Issued, subscribed and paid up Ordinary shares of Rs. 10 each fully paid-up in cash 20,142,984 20,142,984 201,429,840 201,429,840 Ordinary shares of Rs. 10 each issued as bonus shares 38,409,889 38,409,889 384,098,890 384,098,890 18.1 58,552,873 58,552,873 585,528,730 585,528,730
2009 2008 No. of shares No. of shares 18.1 Reconciliation of ordinary shares Opening balance of ordinary shares of Rs. 10 each 58,552,873 46,842,297 Bonus shares issued during the year (2008: Rs. NIL) - 11,710,576 Closing balance of ordinary shares of Rs. 10 each 58,552,873 58,552,873

52
2009 2008 Note Rupees Rupees19 Reserves Capital reserves Statutory reserve 19.1 206,758,318 206,758,318 206,758,318 206,758,318 Revenue reserves General reserve 61,000,000 61,000,000 Unappropriated profit (472,556,755) 242,321,570 (411,556,755) 303,321,570 (204,798,436) 510,079,888 19.1 Statutory reserve Opening balance 206,758,318 176,801,730 Transfer from profit and loss account - 29,956,588 206,758,318 206,758,318 This represents special reserve created at the rate of 20% of profit for the year after taxation
under rule 2 of part III of SECP’s NBFC’s Prudential Regulations. However, due to loss during the period, this rule is not applicable.
2009 2008
Note Rupees Rupees20 (Deficit) on revaluation of investments Opening balance (120,299,798) 6,594,532 Impairment during the year (341,252,146) (120,299,798) Transfer to profit and loss account on sale of available for sale securities - (6,594,532) Impairment charged to profit and loss account 230,775,972 - Closing balance (230,775,972) (120,299,798) 21 Term finance Certificates (TfC) - secured TFC II-1st Tranche 21.1 37,500,000 112,500,000 TFC II-2nd Tranche 21.2 112,500,000 187,500,000 TFC III 21.3 599,880,000 - 749,880,000 300,000,000 Less: Unamortized portion of the initial transaction cost 9,327,018 4,367,408 740,552,982 295,632,592 Less: Current maturity 26 187,590,000 150,000,000 552,962,982 145,632,592
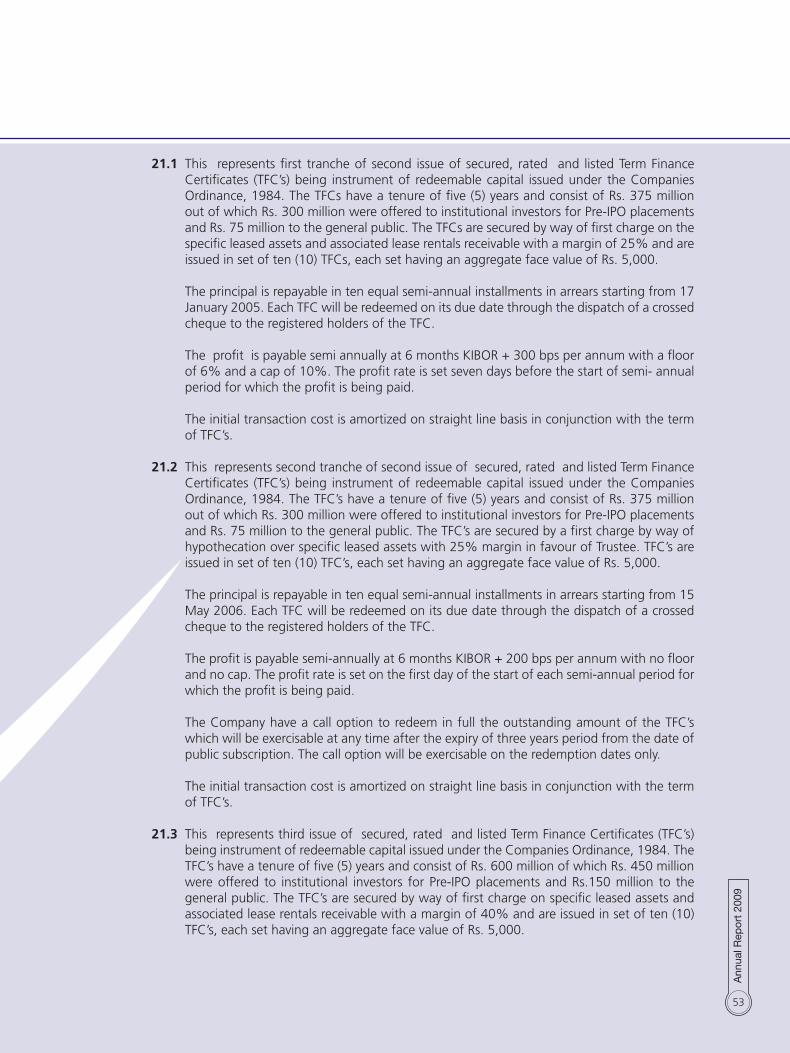
53
21.1 This represents first tranche of second issue of secured, rated and listed Term Finance Certificates (TFC’s) being instrument of redeemable capital issued under the Companies Ordinance, 1984. The TFCs have a tenure of five (5) years and consist of Rs. 375 million out of which Rs. 300 million were offered to institutional investors for Pre-IPO placements and Rs. 75 million to the general public. The TFCs are secured by way of first charge on the specific leased assets and associated lease rentals receivable with a margin of 25% and are issued in set of ten (10) TFCs, each set having an aggregate face value of Rs. 5,000.
The principal is repayable in ten equal semi-annual installments in arrears starting from 17 January 2005. Each TFC will be redeemed on its due date through the dispatch of a crossed cheque to the registered holders of the TFC.
The profit is payable semi annually at 6 months KIBOR + 300 bps per annum with a floor
of 6% and a cap of 10%. The profit rate is set seven days before the start of semi- annual period for which the profit is being paid.
The initial transaction cost is amortized on straight line basis in conjunction with the term
of TFC’s. 21.2 This represents second tranche of second issue of secured, rated and listed Term Finance
Certificates (TFC’s) being instrument of redeemable capital issued under the Companies Ordinance, 1984. The TFC’s have a tenure of five (5) years and consist of Rs. 375 million out of which Rs. 300 million were offered to institutional investors for Pre-IPO placements and Rs. 75 million to the general public. The TFC’s are secured by a first charge by way of hypothecation over specific leased assets with 25% margin in favour of Trustee. TFC’s are issued in set of ten (10) TFC’s, each set having an aggregate face value of Rs. 5,000.
The principal is repayable in ten equal semi-annual installments in arrears starting from 15 May 2006. Each TFC will be redeemed on its due date through the dispatch of a crossed cheque to the registered holders of the TFC.
The profit is payable semi-annually at 6 months KIBOR + 200 bps per annum with no floor
and no cap. The profit rate is set on the first day of the start of each semi-annual period for which the profit is being paid.
The Company have a call option to redeem in full the outstanding amount of the TFC’s
which will be exercisable at any time after the expiry of three years period from the date of public subscription. The call option will be exercisable on the redemption dates only. The initial transaction cost is amortized on straight line basis in conjunction with the term of TFC’s.
21.3 This represents third issue of secured, rated and listed Term Finance Certificates (TFC’s)
being instrument of redeemable capital issued under the Companies Ordinance, 1984. The TFC’s have a tenure of five (5) years and consist of Rs. 600 million of which Rs. 450 million were offered to institutional investors for Pre-IPO placements and Rs.150 million to the general public. The TFC’s are secured by way of first charge on specific leased assets and associated lease rentals receivable with a margin of 40% and are issued in set of ten (10) TFC’s, each set having an aggregate face value of Rs. 5,000.

54
The instrument is structured to redeem 0.02% of the principal in two semi-annual installments and the remaining principal in eight semi-annual installments of 12.495% each of the issue amount respectively starting from the 18th month. Each TFC will be redeemed on its due date through the dispatch of a crossed cheque to the registered holders of the TFC.
The profit is payable semi annually at 6 months KIBOR + 185 bps per annum with no floor
and no cap. The profit rate is set one day before the start of semi- annual period for which the profit is being paid.
The Company have a call option to redeem in full the outstanding amount of the TFC’s
which will be exercisable at any time after the expiry of two years period from the issue date. The call option will be exercisable on the redemption dates only.
The initial transaction cost is amortized on straight line basis in conjunction with the term
of TFC’s. 2009 2008
Note Rupees Rupees
22 Long term certificates of investment - unsecured Local currency - Financial institutions 308,333,333 858,333,333 - Corporates 14,000,340 13,642,940 - Individuals 12,275,000 124,180,955 22.1 334,608,673 996,157,228 Less: Current maturity 26 101,800,000 895,403,258
232,808,673 100,753,970 22.1 These represent deposits received by the Company as per permission granted by the
Securities and Exchange Commission of Pakistan. These certificates are issued for term ranging from over 1 year to 6 years at rates of profit ranging from 11% to 22.22% (2008: 10% to 14%) per annum.
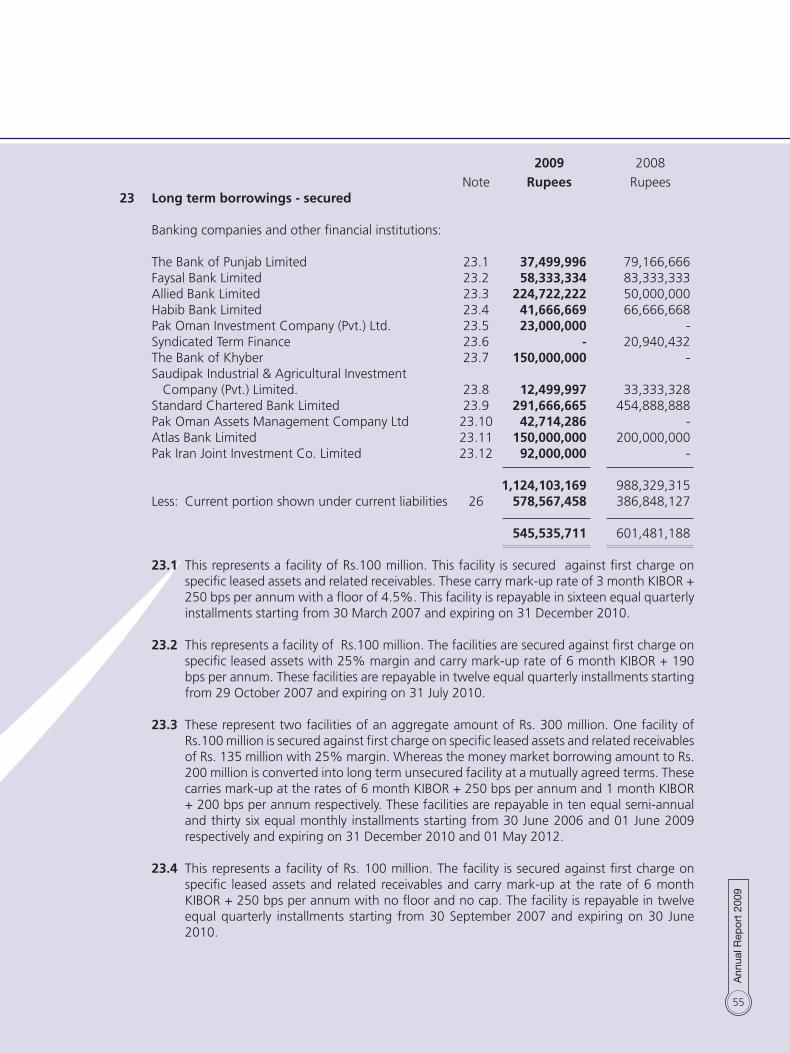
55
2009 2008
Note Rupees Rupees23 Long term borrowings - secured Banking companies and other financial institutions: The Bank of Punjab Limited 23.1 37,499,996 79,166,666 Faysal Bank Limited 23.2 58,333,334 83,333,333 Allied Bank Limited 23.3 224,722,222 50,000,000 Habib Bank Limited 23.4 41,666,669 66,666,668 Pak Oman Investment Company (Pvt.) Ltd. 23.5 23,000,000 - Syndicated Term Finance 23.6 - 20,940,432 The Bank of Khyber 23.7 150,000,000 - Saudipak Industrial & Agricultural Investment Company (Pvt.) Limited. 23.8 12,499,997 33,333,328 Standard Chartered Bank Limited 23.9 291,666,665 454,888,888 Pak Oman Assets Management Company Ltd 23.10 42,714,286 - Atlas Bank Limited 23.11 150,000,000 200,000,000 Pak Iran Joint Investment Co. Limited 23.12 92,000,000 - 1,124,103,169 988,329,315 Less: Current portion shown under current liabilities 26 578,567,458 386,848,127
545,535,711 601,481,188 23.1 This represents a facility of Rs.100 million. This facility is secured against first charge on
specific leased assets and related receivables. These carry mark-up rate of 3 month KIBOR + 250 bps per annum with a floor of 4.5%. This facility is repayable in sixteen equal quarterly installments starting from 30 March 2007 and expiring on 31 December 2010.
23.2 This represents a facility of Rs.100 million. The facilities are secured against first charge on specific leased assets with 25% margin and carry mark-up rate of 6 month KIBOR + 190 bps per annum. These facilities are repayable in twelve equal quarterly installments starting from 29 October 2007 and expiring on 31 July 2010.
23.3 These represent two facilities of an aggregate amount of Rs. 300 million. One facility of
Rs.100 million is secured against first charge on specific leased assets and related receivables of Rs. 135 million with 25% margin. Whereas the money market borrowing amount to Rs. 200 million is converted into long term unsecured facility at a mutually agreed terms. These carries mark-up at the rates of 6 month KIBOR + 250 bps per annum and 1 month KIBOR + 200 bps per annum respectively. These facilities are repayable in ten equal semi-annual and thirty six equal monthly installments starting from 30 June 2006 and 01 June 2009 respectively and expiring on 31 December 2010 and 01 May 2012.
23.4 This represents a facility of Rs. 100 million. The facility is secured against first charge on
specific leased assets and related receivables and carry mark-up at the rate of 6 month KIBOR + 250 bps per annum with no floor and no cap. The facility is repayable in twelve equal quarterly installments starting from 30 September 2007 and expiring on 30 June 2010.

56
23.5 This represents a facility of Rs. 23 million. The facility is secured against first charge on specific loan receivables with a margin of 25%. It carries mark-up at the rate of 3 month KIBOR + 250 bps per annum. The facility is repayable in twelve equal monthly installments starting from 23 August 2009 and expiring on 23 July 2010.
23.6 This has been repaid during the year. 23.7 This represents facility of Rs.150 million. The facility is secured against first charge on
specific leased assets and related receivables. It carries mark-up at the rate of 3 month KIBOR + 300 bps per annum. The facility is repayable in twelve equal quarterly instalments starting from 30 September 2009 and expiring on 30 June 2012.
23.8 This represents a facility of Rs. 50 million. The facility is secured against first charge on
specific leased assets and related receivables to the extent of Rs. 70 million. It carries mark-up at the rate of 3 month KIBOR + 275 bps per annum. The facility is repayable in twelve equal quarterly installments starting from 13 April 2007 and expiring on 13 January 2010.
23.9 This represents a facility of Rs. 500 million for the purpose of expansion of lease portfolio.
The facility is secured against lease receivables. It carries mark-up at the rate of 3 month KIBOR + 160 bps. The facility is repayable in twelve equal quarterly installments starting from 31 May 2008 and expiring on 28 February 2011.
23.10 This represents a facility of Rs. 46 million. The facility is secured against lease receivables. It
carries mark-up at the rate of 3 month KIBOR + 250 bps. The facility is repayable in twelve equal monthly installments starting from 15 June 2009 and expiring on 15 July 2010.
23.11 This represents a term finance facility of Rs. 200 million. The facility is secured against first charge on specific/exclusive leased assets and related receivables. It carries mark-up at the rate of 3 month KIBOR + 185 bps per annum. The facility is repayable in sixteen equal quarterly installments starting from 28 June 2008 and expiring on 28 May 2012.
23.12 This represents a facility of Rs. 96 million. The facility is secured against first charge on specific/exclusive leased assets worth Rs. 150 million and related receivables with 25% margin. It carries mark-up at the rate of 1 month KIBOR + 325 bps per annum. The facility is repayable in twenty four equal monthly installments starting from 04 May 2009 and expiring on 04 April 2011.
2009 2008 Note Rupees Rupees24 Long term deposits Margin against letters of guarantee 13,418,460 23,362,860 Deposits against lease arrangements 24.1 1,074,733,063 1,218,771,389 Less: Current maturity 26 355,320,950 215,914,768 719,412,113 1,002,856,621 732,830,573 1,026,219,481 24.1 These represent the interest free security deposits (lease key money) received on lease
contracts and are adjustable at the expiry of their respective lease periods.

57
2009 2008
Note Rupees Rupees25 Staff service cost Gratuity 25.1 3,463,190 2,343,011 Leave encashment 25.2 3,720,022 4,248,992 7,183,212 6,592,003
Gratuity Leave encashment
2009 2008 2009 2008
Note Rupees Rupees Rupees Rupees
25.1 Amount recognised in the balance sheet Present value of defined benefit obligations 25.1.1 7,865,683 10,194,637 3,720,022 4,248,992 Less: Fair value of plan assets 25.1.2 (2,264,209) (5,647,850) - - Less: Actuarial gains/(losses) to be recognized in later periods (3,299,284) (3,614,409) - - Add: Benefits due but not paid 1,161,000 80,583 - - Less: Unrecognized transitional liability to be recognized in later periods - - - -
3,463,190 1,012,961 3,720,022 4,248,992 25.1.1 Movement in the defined benefit obligation: Present value of defined benefit obligation at beginning of the year 10,194,637 7,907,331 4,843,062 3,215,010 Current service cost for the year 3,203,116 5,974,242 425,813 1,777,690 Interest cost for the year 1,223,356 790,733 581,167 321,501 Transfer to Trust Capital (Pvt.) Ltd. (1,116,674) - (882,685) - Benefits paid / discharged during the year (1,075,098) (4,669,952) (926,133) (1,605,586) Benefits due, but not paid during the year (1,161,000) (80,583) - - Actuarial (gains) due to curtailments (4,279,308) - - - Actuarial (gain) / loss on PVDBO 876,654 272,866 (321,202) 1,134,447 7,865,683 10,194,637 3,720,022 4,843,062 25.1.2 Movement in the fair value of plan assets: Fair value of plan assets as at 30 June 2008 5,647,850 2,239,798 - - Adjustment for last year (short term liability) (3,322,772) 1,992,724 - - Total contributions made in the year 1,155,681 6,000,000 - - Expected return on plan assets for the year 677,742 223,980 - - Benefits paid / discharged during the year (1,155,681) (4,669,952) - - Actuarial gain / (loss) on assets (738,611) (138,700) - -
2,264,209 5,647,850 - - 25.2 Movement of liability: Balance sheet liability as at 30 June 2008 2,343,011 1,992,723 4,248,992 2,026,869 Adjustment for last year (short term liability) 3,322,772 - - - Transfer to Trust Capital (Pvt.) Ltd. (1,116,674) - (882,685) - Amount recognised during the year under IAS-19 25.3 2,707,487 5,020,239 1,279,848 3,827,709 Contribution made by the bank during the year (3,793,406) (4,669,952) (926,133) (1,605,586)
3,463,190 2,343,010 3,720,022 4,248,992
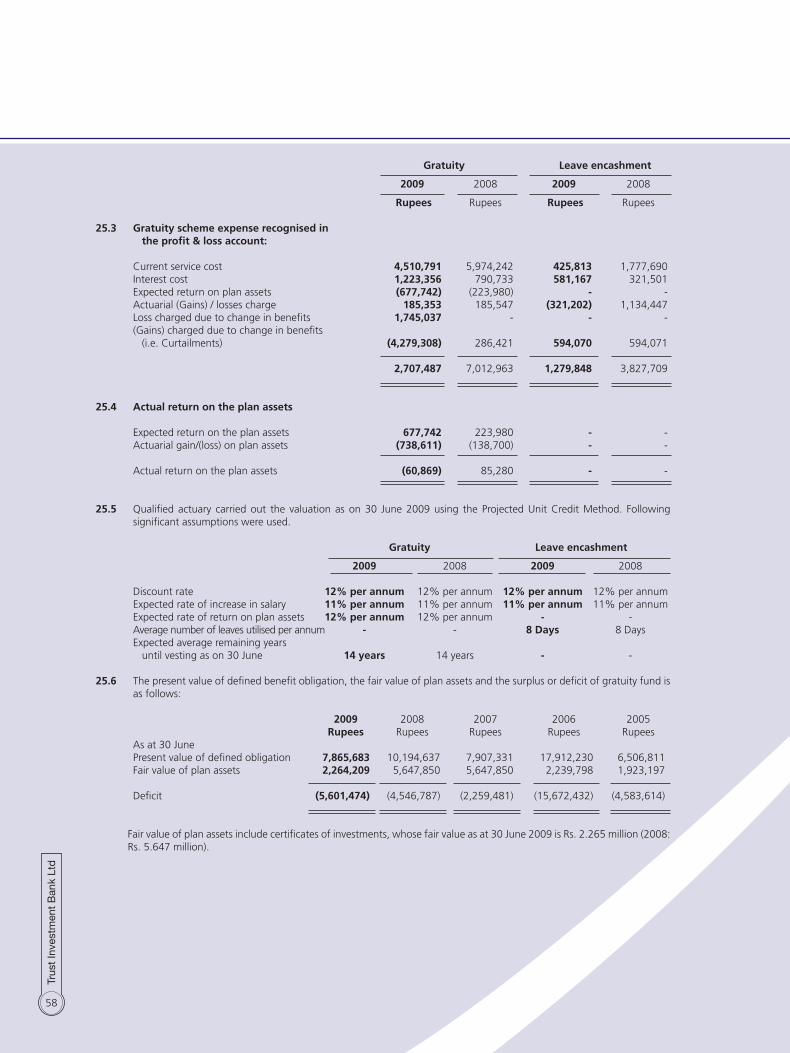
58
Gratuity Leave encashment
2009 2008 2009 2008
Rupees Rupees Rupees Rupees
25.3 Gratuity scheme expense recognised in the profit & loss account: Current service cost 4,510,791 5,974,242 425,813 1,777,690 Interest cost 1,223,356 790,733 581,167 321,501 Expected return on plan assets (677,742) (223,980) - - Actuarial (Gains) / losses charge 185,353 185,547 (321,202) 1,134,447 Loss charged due to change in benefits 1,745,037 - - - (Gains) charged due to change in benefits (i.e. Curtailments) (4,279,308) 286,421 594,070 594,071 2,707,487 7,012,963 1,279,848 3,827,709 25.4 Actual return on the plan assets Expected return on the plan assets 677,742 223,980 - - Actuarial gain/(loss) on plan assets (738,611) (138,700) - - Actual return on the plan assets (60,869) 85,280 - -
25.5 Qualified actuary carried out the valuation as on 30 June 2009 using the Projected Unit Credit Method. Following significant assumptions were used.
Gratuity Leave encashment
2009 2008 2009 2008
Discount rate 12% per annum 12% per annum 12% per annum 12% per annum Expected rate of increase in salary 11% per annum 11% per annum 11% per annum 11% per annum Expected rate of return on plan assets 12% per annum 12% per annum - - Average number of leaves utilised per annum - - 8 Days 8 Days Expected average remaining years until vesting as on 30 June 14 years 14 years - -
25.6 The present value of defined benefit obligation, the fair value of plan assets and the surplus or deficit of gratuity fund is as follows:
2009 2008 2007 2006 2005 Rupees Rupees Rupees Rupees Rupees As at 30 June Present value of defined obligation 7,865,683 10,194,637 7,907,331 17,912,230 6,506,811 Fair value of plan assets 2,264,209 5,647,850 5,647,850 2,239,798 1,923,197 Deficit (5,601,474) (4,546,787) (2,259,481) (15,672,432) (4,583,614)
Fair value of plan assets include certificates of investments, whose fair value as at 30 June 2009 is Rs. 2.265 million (2008:
Rs. 5.647 million).

59
2009 2008 Note Rupees Rupees26 Current maturities of long term liabilities Term finance certificates - secured 21 187,590,000 150,000,000 Certificates of investment - unsecured 22 101,800,000 895,403,258 Long term borrowings - secured 23 578,567,458 386,848,127 Long term deposits 24 355,320,950 215,914,768 Pre - IPO Subscription of Term Finance Certificates - 90,000 1,223,278,408 1,648,256,153 27 Short term certificates of investment - unsecured Local currency - Financial institutions 11,300,000 750,000,000 - Corporate 608,326,538 240,962,953 - Individuals 407,659,801 51,219,038 1,027,286,339 1,042,181,991 27.1 These represent unsecured short term certificates of investment for a period of three
months to one year. These carry mark-up rate ranging from 11% to 18.50% (2008: 8.25% to 18%) per annum.
2009 2008 Note Rupees Rupees28 Short term borrowings Banking companies and other financial institutions: Running finances - secured 28.1 321,693,339 332,216,672 Placements from financial institutions - unsecured 28.2 1,504,790,413 1,579,185,500 1,826,483,752 1,911,402,172
28.1 These represent running finances utilized from commercial banks. The total limits against running finances amount to Rs. 425.00 million (2008: Rs. 455 million). These carry mark-up rate ranging from 3 month KIBOR + 100 bps to 3 month KIBOR + 300 bps with a floor ranging from 4.5% to 10% (2008: 3 months KIBOR + 100 bps to 3 month KIBOR + 250 bps) per annum payable on quarterly basis respectively.
The above facilities have been obtained for a period of one year and are secured against promissory
notes, first charge on specific leased assets, related receivables, and pledge of shares.
2009 2008 Rupees Rupees Carrying amount of quoted shares given as collateral against borrowings 152,603,119 333,800,683 28.2 These represent unsecured short term placements of one day to four months obtained from
financial institutions carrying mark-up rate ranging from 7% to 45% (2008: 6.25% to 26%).

60
2009 2008 Note Rupees Rupees29 Mark-up accrued Secured - Short and long term borrowings 48,893,504 49,020,712 - Term finance certificates 55,149,729 15,475,668 104,043,233 64,496,380 Unsecured - Certificates of investment 33,062,182 28,735,462 137,105,415 93,231,842 30 Trade and other payables Payable to National Clearing Company of Pakistan Limited - 377,328 Customer’s credit balances - 47,689,653 Advance receipt against leases 30.1 9,101,194 20,206,853 Unclaimed dividend 3,136,308 3,221,681 Accrued liabilities 1,714,816 2,485,230 Other liabilities 15,797,572 7,170,817 29,749,890 81,151,562 30.1 These represent initial security deposit received from lessees before the structuring of
leases. 31 Contingencies and commitments 31.1 Contingencies 31.1.1 The Company has issued guarantees to various parties on behalf of clients amounting to
Rs. 208.291 Million. (2008: Rs. 182.342 million) 31.2 Commitments 31.2.1 Lease commitments approved but not disbursed as on balance sheet date amount to Nil
(2008 : Rs. 123.142 million). 31.2.2 Commitment for the purchase of office space amounting to Rs. 2.45 million (2008: Rs.
29.63 million).

61
2009 2008 Note Rupees Rupees
32 Income from lease operations Finance lease income 420,105,542 439,342,722 Front end fee 345,244 842,123 Commitment and other fees 970,840 8,275,411 Miscellaneous 32.1 33,460,037 37,435,919
454,881,663 485,896,175 32.1 Miscellaneous lease income Mark-up on lease advance 10,090,726 10,805,362 Additional lease rentals 23,369,311 26,630,557 33,460,037 37,435,919 33 Income from investments (Loss)/Profit on disposal of investment held for trading (30,364,891) 135,248,716 Profit on investment in continuous funding system 1,791,769 27,833,456 Profit on disposal of shares under reverse repurchase agreements 33,295,491 46,468,204 (Loss)/Profit on disposal of shares purchased under future contract (121,344) 1,094,383 Profit on short term placements and long term investments 27,372,200 41,927,450 Dividend income 9,963,365 10,251,250 Underwriting and trusteeship fee 288,000 1,613,625 Income from Investment Banking 1,196,638 - Gain on disposal of investments available for sale - 9,472,666 43,421,228 273,909,750 34 Income from term finances 34.1 Mark- up earned on long term finances Employees 97,252 1,053,271 Customers 93,753,473 16,569,055 93,850,725 17,622,326 34.2 Mark- up earned on short term finances Employees 2,465,484 95,980 Customers 76,691,740 26,392,670 79,157,224 26,488,650 173,007,949 44,110,976

62
2009 2008 Note Rupees Rupees35 Other income Gain on disposal of operating fixed assets 5.1.1 3,872,608 22,448,499 Gain on disposal of intangible assets 5,900,000 - Commission income 2,486,063 2,462,351 Profits on bank deposits 4,488,779 141 Miscellaneous 6,799,177 65,927,650 23,546,627 90,838,641 36 finance cost Mark-up on long term borrowings 132,340,475 87,925,764 Mark-up on term finance certificates 135,692,917 104,343,216 Mark-up on short term borrowings 341,604,718 118,927,462 Mark-up on certificates of investment 202,959,142 210,140,148 Mark-up on running finance 53,933,392 8,556,271 Commitment and other processing fee 2,270,103 2,686,995 Bank charges and commission 6,318,260 5,893,085
875,119,007 538,472,941 37 Administrative and operating expenses Salaries and other benefits 37.1 101,299,063 103,312,972 Printing and stationery 2,308,232 3,890,737 Vehicle running and maintenance 8,519,832 8,674,886 Postage, telephone and telex 5,126,149 7,349,169 Traveling and conveyance 3,524,346 3,448,512 Boarding and lodging 427,949 686,729 Entertainment 1,747,460 2,102,391 Advertisement 782,802 697,081 Electricity, gas and water 3,637,598 3,734,036 Newspapers and periodicals 128,849 159,795 Auditors’ remuneration 37.2 800,000 558,850 Fee and subscription 807,154 1,436,301 Corporate expenses 1,165,290 1,355,296 Staff service costs 3,987,335 8,817,108 Software - 117,410 Rent, rates and taxes 22,544,145 24,734,932 Insurance 4,325,296 3,785,547 Donation 37.3 272,220 - Office maintenance 3,391,804 3,239,529 Legal and professional charges 2,780,316 4,307,851 Security charges 2,271,758 2,244,770 Staff training 90,600 136,827 Business promotion 8,000 - Commission on recovery-outsource 1,205,206 3,410,988 CDC and clearing charges 27,500 3,278,866 Miscellaneous 1,964,538 2,175,433 173,143,442 193,656,016
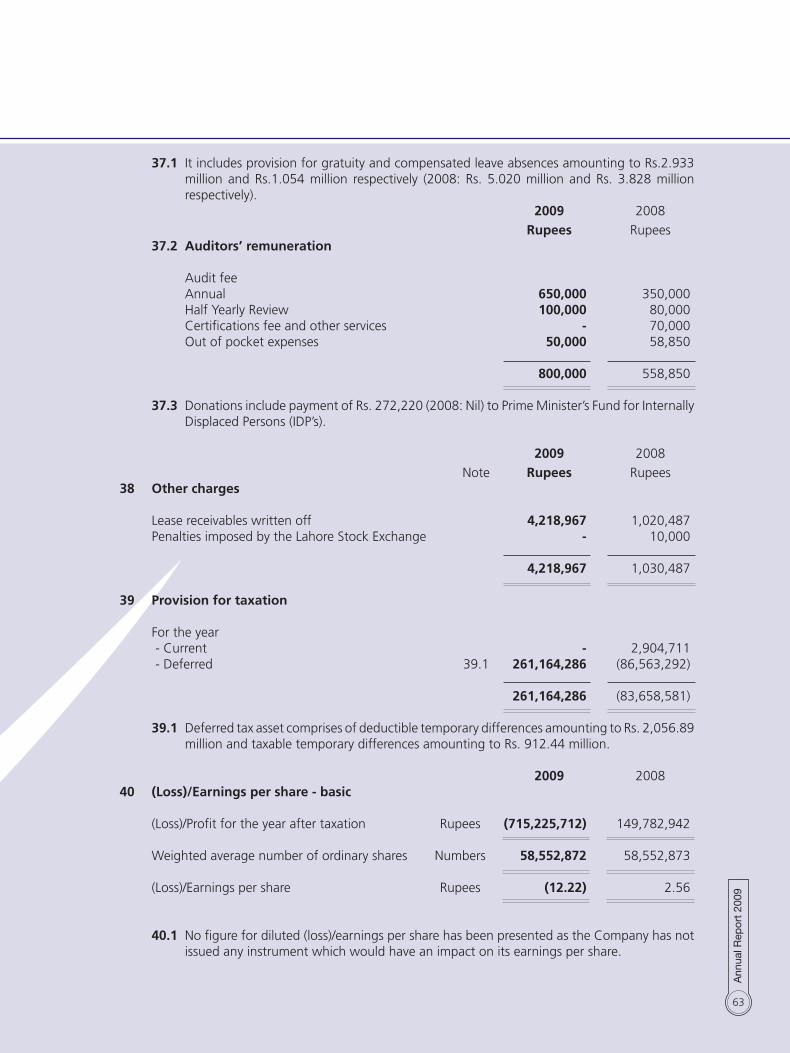
63
37.1 It includes provision for gratuity and compensated leave absences amounting to Rs.2.933 million and Rs.1.054 million respectively (2008: Rs. 5.020 million and Rs. 3.828 million respectively).
2009 2008
Rupees Rupees 37.2 Auditors’ remuneration Audit fee Annual 650,000 350,000 Half Yearly Review 100,000 80,000 Certifications fee and other services - 70,000 Out of pocket expenses 50,000 58,850 800,000 558,850 37.3 Donations include payment of Rs. 272,220 (2008: Nil) to Prime Minister’s Fund for Internally
Displaced Persons (IDP’s).
2009 2008
Note Rupees Rupees38 Other charges Lease receivables written off 4,218,967 1,020,487 Penalties imposed by the Lahore Stock Exchange - 10,000 4,218,967 1,030,487 39 Provision for taxation For the year - Current - 2,904,711 - Deferred 39.1 261,164,286 (86,563,292)
261,164,286 (83,658,581) 39.1 Deferred tax asset comprises of deductible temporary differences amounting to Rs. 2,056.89
million and taxable temporary differences amounting to Rs. 912.44 million.
2009 200840 (Loss)/Earnings per share - basic (Loss)/Profit for the year after taxation Rupees (715,225,712) 149,782,942 Weighted average number of ordinary shares Numbers 58,552,872 58,552,873 (Loss)/Earnings per share Rupees (12.22) 2.56
40.1 No figure for diluted (loss)/earnings per share has been presented as the Company has not issued any instrument which would have an impact on its earnings per share.

64
41 Remuneration of chief executive, executives and directors
Chief Executive Directors Executives
2009 2008 2009 2008 2009 2008
Rupees Rupees Rupees Rupees Rupees Rupees Managerial remuneration 5,181,500 3,483,000 - - 23,620,707 16,338,112 Housing and utilities 2,851,833 1,917,000 - - 13,000,544 8,992,294 Bonus 290,250 290,323 - - 1,321,904 1,498,842 Medical 104,977 98,948 - - 1,089,969 722,146 Others - 937,951 - - 7,309,760 5,542,856 Gratuity - 571,753 - - 464,400 2,751,122 Directorship Fee 20,000 105,000 1,520,000 405,000 - - 8,448,560 7,403,975 1,520,000 405,000 46,807,284 35,845,372
Number of persons 2 1 6 3 33 19
41.1 In addition to the above remuneration chief executive and some executives were also
provided with free use of Company maintained vehicles.
41.2 Fee was paid to CEO and directors for attending the board meetings amounting to Rs. 1,540,000 (2008: Rs. 510,000).

65
2
0
0
9
E
x P
O S
E D
T
O
I N
T E
R E
S T
/
M A
R K
-
U P
R
I S
K
E
x P
O S
E D
T
O
f A
I R
v
A L
U E
I
N T
E R
E S
T
R A
T E
R
I S
K
E x
P O
S E
D
T O
C
A S
H
f L
O W
I
N T
E R
E S
T
R A
T E
R
I S
K
O
ver
thre
e O
ver
on
e O
ver
thre
e
O
ver
thre
e O
ver
on
e O
ver
thre
e
to
inte
rest
/
Inte
rest
U
pto
th
ree
mo
nth
s to
ye
ar t
o
year
s to
O
ver
five
Up
to t
hre
e m
on
ths
year
to
ye
ars
to
Ove
r fi
ve
mar
k-u
p
2009
ra
tes
mo
nth
s o
ne
year
th
ree
year
s fi
ve y
ears
ye
ars
Tota
l m
on
ths
on
e ye
ar
th
ree
year
s fi
ve y
ears
ye
ars
Tota
l
risk
To
tal
%
ag
e R
up
ees
Ru
pee
s R
up
ees
Ru
pee
s R
up
ees
Ru
pee
s R
up
ees
Ru
pee
s R
up
ees
Ru
pee
s R
up
ees
Ru
pee
s R
up
ees
Ru
pee
s R
up
ees
On
bal
ance
sh
eet
fin
anci
al
asse
ts a
nd
liab
iliti
es
fi
nan
cial
ass
ets
N
et in
vest
men
t in
le
ase
finan
ce
8% -
26.
76 %
2
85,5
48,1
08
2,1
83,9
29,5
46
776
,659
,370
5
52,3
41,4
85
-
3,7
98,4
78,5
09
-
-
-
-
-
-
3,7
98,4
78,5
09
-
3,7
98,4
78,5
09
Long
ter
m fi
nanc
es
4% -
17.7
3 %
-
-
-
-
-
-
230
,071
,375
3
48,4
40,9
98
-
-
578
,512
,373
5
78,5
12,3
73
-
578
,512
,373
Lo
ng t
erm
inve
stm
ents
14
%-2
5%
-
-
-
-
-
-
-
-
-
232
,976
,000
-
2
32,9
76,0
00
232
,976
,000
232
,976
,000
Sh
ort
term
fina
nces
13
% -
18.
64 %
-
-
-
-
-
-
-
3
29,8
46,9
62
-
-
-
329
,846
,962
3
29,8
46,9
62
-
329
,846
,962
Sh
ort
term
pla
cem
ents
14
%-2
5%
280
,987
,368
-
-
-
-
2
80,9
87,3
68
-
-
-
-
-
-
280
,987
,368
-
2
80,9
87,3
68
Shor
t te
rm in
vest
men
ts
-
-
-
-
-
-
-
-
-
-
-
-
-
2
21,6
23,0
27
221
,623
,027
M
ark-
up a
ccru
ed
-
-
-
-
-
-
-
-
-
-
-
-
-
8
5,01
9,43
4
85,
019,
434
Adv
ance
s, p
repa
ymen
ts
and
othe
r re
ceiv
able
s 15
.29
% -
21.
70 %
-
4
7,69
0,83
6
-
-
-
47,
690,
836
-
-
-
-
-
-
4
7,69
0,83
6
456
,427
,739
5
04,1
18,5
75
Cas
h an
d ba
nk b
alan
ces
4% -
12%
1
25,6
93,0
24
-
-
-
-
125
,693
,024
-
-
-
-
-
-
1
25,6
93,0
24
33,
099,
102
1
58,7
92,1
26
6
92,2
28,5
00
2,2
31,6
20,3
82
776
,659
,370
5
52,3
41,4
85
-
4,2
52,8
49,7
37
-
559
,918
,337
3
48,4
40,9
98
232
,976
,000
-
1
,141
,335
,335
5
,394
,185
,072
7
96,1
69,3
02
6,1
90,3
54,3
74
fin
anci
al li
abili
ties
Term
fina
nce
cert
ifica
tes
10.0
0% -
17.6
9%
-
-
-
-
-
-
37,
620,
000
1
49,9
70,0
00
487
,320
,000
6
5,64
2,98
2
-
740
,552
,982
7
40,5
52,9
82
-
740
,552
,982
Lo
ng t
erm
cer
tifica
tes
of
in
vest
men
ts
13.7
5% -
22.2
2%
600
,000
1
,200
,000
3
28,0
33,6
73
4,7
75,0
00
-
334
,608
,673
-
-
-
-
-
-
3
34,6
08,6
73
-
334
,608
,673
Lo
ng t
erm
bor
row
ings
12
.03.
% -
18.2
7%
-
-
-
-
-
-
148
,539
,657
3
91,4
04,7
61
584
,158
,751
-
1,1
24,1
03,1
69
1,1
24,1
03,1
69
-
1,1
24,1
03,1
69
Shor
t te
rm c
ertifi
cate
s
of in
vest
men
ts
9% -
18.3
4%
679
,584
,910
3
47,7
01,4
29
-
-
-
1,0
27,2
86,3
39
-
-
-
-
-
-
1,0
27,2
86,3
39
-
1,0
27,2
86,3
39
Shor
t te
rm b
orro
win
gs
11%
-45
.00%
1
,826
,483
,752
-
-
-
1,8
26,4
83,7
52
-
332
,216
,672
-
-
-
3
32,2
16,6
72
2,1
58,7
00,4
24
-
2,1
58,7
00,4
24
Mar
k-up
acc
rued
-
-
-
-
-
-
-
-
-
-
-
-
-
137
,105
,415
1
37,1
05,4
15
Trad
e an
d ot
her
paya
bles
-
-
-
-
-
-
-
-
-
-
-
-
-
29,
589,
890
2
9,58
9,89
0
2,5
06,6
68,6
62
348
,901
,429
3
28,0
33,6
73
4,7
75,0
00
-
3,1
88,3
78,7
64
186
,159
,657
8
73,5
91,4
33
1,07
1,47
8,75
1
65,
642,
982
-
2
,196
,872
,823
5
,385
,251
,587
1
66,6
95,3
05
5,5
51,9
46,8
92
On
bal
ance
sh
eet
gap
(1,8
14,4
40,1
62)
1,8
82,7
18,9
53
448
,625
,697
5
47,5
66,4
85
-
1,0
64,4
70,9
73 (
186,
159,
657)
(3
13,6
73,0
96)
(723
,037
,753
) 1
67,3
33,0
18
-
(1,0
55,5
37,4
88)
8,9
33,4
85
629
,473
,997
6
38,4
07,4
82
Off
bal
ance
sh
eet
fin
anci
al
asse
ts a
nd
liab
iliti
es
Le
ase
com
mit
men
ts
-
-
-
-
-
-
-
-
-
-
-
-
-
-
Off
bal
ance
sh
eet
gap
-
-
-
-
-
-
-
-
-
-
-
-
-
-
-
Tota
l in
tere
st r
ate
sen
siti
vity
gap
(1,8
14,4
40,1
62)
1,8
82,7
18,9
53
448
,625
,697
5
47,5
66,4
85
-
(18
6,15
9,65
7)
(313
,673
,096
) (7
23,0
37,7
53)
167
,333
,018
-
-
-
-
-
Cu
mu
lati
ve in
tere
st r
ate
sen
siti
vity
gap
68,
278,
791
5
16,9
04,4
88
1,0
64,4
70,9
73 1
,064
,470
,973
-
-
(4
99,8
32,7
53) (
1,22
2,87
0,50
6) (1
,055
,537
,488
) (1,
055,
537,
488)
8,9
33,4
85
-
-
The
carr
ying
val
ues
of fi
nanc
ial a
sset
s an
d fin
anci
al li
abili
ties
are
appr
oxim
ate
to t
heir
fair
valu
e as
refl
ecte
d in
the
fina
ncia
l sta
tem
ents
.
42
fin
anci
al in
stru
men
ts a
nd
rel
ated
dis
clo
sure
s
The
Com
pany
’s in
tere
st /
mar
k-up
sen
sitiv
ity p
ositi
on f
or in
tere
st/m
ark-
up b
earin
g fin
anci
al a
sset
s an
d lia
bilit
ies
and
the
perio
ds in
whi
ch
they
will
mat
ure
is a
s fo
llow
s:
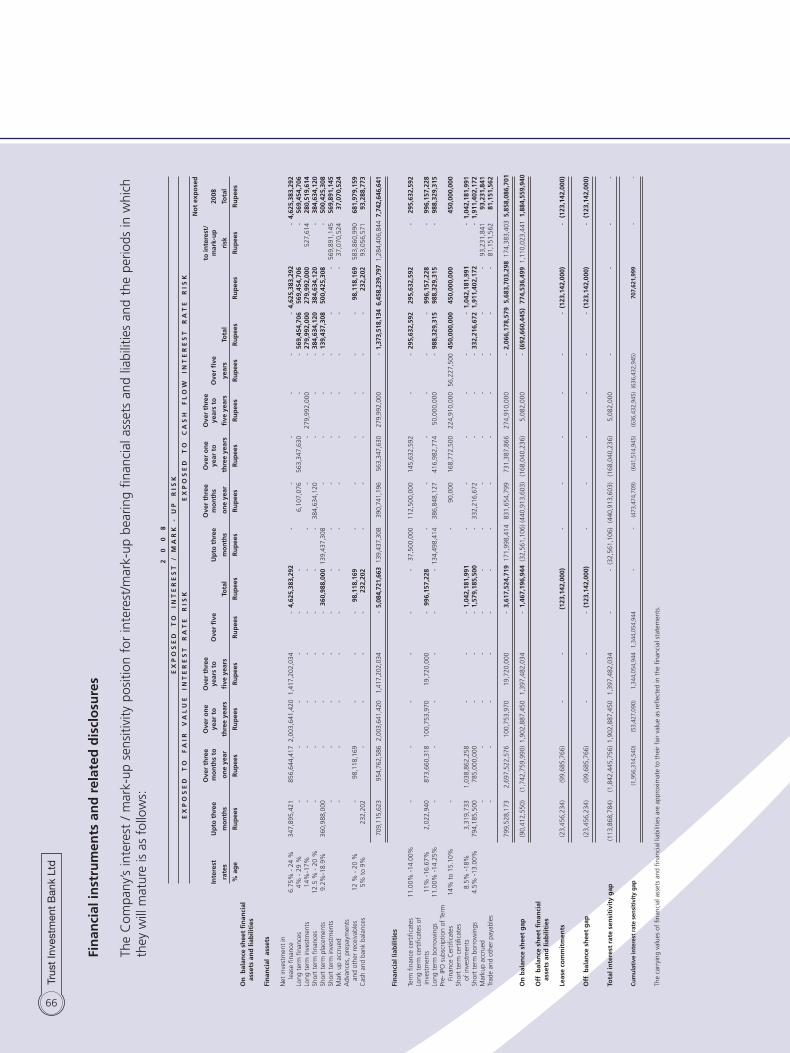
66
2
0
0
8
E
x P
O S
E D
T
O
I N
T E
R E
S T
/
M A
R K
-
U P
R
I S
K
E x
P O
S E
D
T O
f
A I
R
v A
L U
E
I N
T E
R E
S T
R
A T
E
R I
S K
E x
P O
S E
D
T O
C
A S
H
f L
O W
I
N T
E R
E S
T
R A
T E
R
I S
K
No
t ex
po
sed
O
ver
thre
e O
ver
on
e O
ver
thre
e
O
ver
thre
e O
ver
on
e O
ver
thre
e
to
inte
rest
/
Inte
rest
U
pto
th
ree
mo
nth
s to
ye
ar t
o
year
s to
O
ver
five
Up
to t
hre
e m
on
ths
year
to
ye
ars
to
Ove
r fi
ve
mar
k-u
p
2008
ra
tes
mo
nth
s o
ne
year
th
ree
year
s fi
ve y
ears
Tota
l m
on
ths
on
e ye
ar
th
ree
year
s fi
ve y
ears
ye
ars
Tota
l
risk
To
tal
%
ag
e R
up
ees
Ru
pee
s R
up
ees
Ru
pee
s R
up
ees
Ru
pee
s R
up
ees
Ru
pee
s R
up
ees
Ru
pee
s R
up
ees
Ru
pee
s R
up
ees
Ru
pee
s R
up
ees
On
bal
ance
sh
eet
fin
anci
al
asse
ts a
nd
liab
iliti
es
fi
nan
cial
ass
ets
N
et in
vest
men
t in
le
ase
finan
ce
6.75
% -
24
%
34
7,89
5,42
1
856
,644
,417
2,0
03,6
41,4
20
1,41
7,20
2,03
4
- 4
,625
,383
,292
-
-
-
-
-
-
4,6
25,3
83,2
92
-
4,62
5,38
3,29
2 Lo
ng t
erm
fina
nces
4%
- 2
9 %
-
-
-
-
-
-
6,1
07,0
76
563
,347
,630
-
-
56
9,45
4,70
6
569
,454
,706
-
5
69,4
54,7
06
Long
ter
m in
vest
men
ts
14%
-17%
-
-
-
-
-
-
-
-
-
2
79,9
92,0
00
-
279,
992,
000
2
79,9
92,0
00
527
,614
2
80,5
19,6
14
Shor
t te
rm fi
nanc
es
12.5
% -
20
%
-
-
-
-
-
-
-
384
,634
,120
-
-
-
38
4,63
4,12
0
384
,634
,120
-
3
84,6
34,1
20
Shor
t te
rm p
lace
men
ts
9.2%
-18.
9%
360
,988
,000
-
-
-
-
36
0,98
8,00
0 1
39,4
37,3
08
-
-
-
-
139,
437,
308
5
00,4
25,3
08
-
500
,425
,308
Sh
ort
term
inve
stm
ents
-
-
-
-
-
-
-
-
-
-
-
-
-
569
,891
,145
5
69,8
91,1
45
Mar
k up
acc
rued
-
-
-
-
-
-
-
-
-
-
-
-
-
37,
070,
524
3
7,07
0,52
4 A
dvan
ces,
pre
paym
ents
an
d ot
her
rece
ivab
les
12 %
- 2
0 %
-
9
8,11
8,16
9
-
-
-
98,
118,
169
-
-
-
-
-
-
9
8,11
8,16
9
583,
860,
990
6
81,9
79,1
59
Cas
h an
d ba
nk b
alan
ces
5% t
o 9%
232,
202
-
-
-
-
2
32,2
02
-
-
-
-
-
-
232
,202
9
3,05
6,57
1
93,
288,
773
709
,115
,623
9
54,7
62,5
86
2,00
3,64
1,42
0
1,41
7,20
2,03
4
- 5
,084
,721
,663
13
9,43
7,30
8
390
,741
,196
5
63,3
47,6
30
279
,992
,000
-
1,3
73,5
18,1
34 6
,458
,239
,797
1,2
84,4
06,8
44 7
,742
,646
,641
fi
nan
cial
liab
iliti
es
Te
rm fi
nanc
e ce
rtifi
cate
s 11
.00%
-14
.00%
-
-
-
-
-
-
3
7,50
0,00
0
112
,500
,000
1
45,6
32,5
92
-
-
295,
632,
592
2
95,6
32,5
92
-
295
,632
,592
Lo
ng t
erm
cer
tifica
tes
of
in
vest
men
ts
11%
-16
.67%
2,0
22,9
40
873
,660
,318
1
00,7
53,9
70
19,
720,
000
-
99
6,15
7,22
8
-
-
-
-
-
-
996
,157
,228
-
9
96,1
57,2
28
Long
ter
m b
orro
win
gs
11.0
0% -
14.2
5%
-
-
-
-
-
-
134,
498,
414
3
86,8
48,1
27
416
,982
,774
5
0,00
0,00
0
-
988,
329,
315
9
88,3
29,3
15
-
988
,329
,315
Pr
e- IP
O s
ubsc
riptio
n of
Ter
m
Fi
nanc
e C
ertifi
cate
s 14
% t
o 15
.10%
-
-
90,
000
1
68,7
72,5
00
224
,910
,000
56
,227
,500
45
0,00
0,00
0
450
,000
,000
450
,000
,000
Sh
ort
term
cer
tifica
tes
of
inve
stm
ents
8.
5% -
18%
3,3
19,7
33
1,0
38,8
62,2
58
-
-
- 1
,042
,181
,991
-
-
-
-
-
-
1,0
42,1
81,9
91
-
1,04
2,18
1,99
1 Sh
ort
term
bor
row
ings
4.
5% -
13.0
0%
794
,185
,500
7
85,0
00,0
00
-
-
- 1
,579
,185
,500
-
3
32,2
16,6
72
-
-
-
332,
216,
672
1,9
11,4
02,1
72
-
1,91
1,40
2,17
2 M
arku
p ac
crue
d
-
-
-
-
-
-
-
-
-
-
-
-
-
93,
231,
841
9
3,23
1,84
1 Tr
ade
and
othe
r pa
yabl
es
-
-
-
-
-
-
-
-
-
-
-
-
-
8
1,15
1,56
2
81,
151,
562
799
,528
,173
2
,697
,522
,576
1
00,7
53,9
70
19,
720,
000
-
3,6
17,5
24,7
19 1
71,9
98,4
14
831,
654,
799
7
31,3
87,8
66
274
,910
,000
-
2,0
66,1
78,5
79 5
,683
,703
,298
174
,383
,403
5,8
58,0
86,7
01
On
bal
ance
sh
eet
gap
(90,
412,
550)
(1
,742
,759
,990
) 1,
902,
887,
450
1,3
97,4
82,0
34
- 1
,467
,196
,944
(32
,561
,106
) (44
0,91
3,60
3)
(168
,040
,236
) 5
,082
,000
-
(69
2,66
0,44
5)
774,
536,
499
1,1
10,0
23,4
41 1
,884
,559
,940
O
ff b
alan
ce s
hee
t fi
nan
cial
as
sets
an
d li
abili
ties
Leas
e co
mm
itm
ents
(23,
456,
234)
(9
9,68
5,76
6)
-
-
(12
3,14
2,00
0)
-
-
-
-
-
-
(123
,142
,000
) -
(1
23,1
42,0
00)
Off
bal
ance
sh
eet
gap
(23,
456,
234)
(9
9,68
5,76
6)
-
-
- (
123,
142,
000)
-
-
-
-
-
-
(12
3,14
2,00
0)
-
(123
,142
,000
)
Tota
l in
tere
st r
ate
sen
siti
vity
gap
(113
,868
,784
) (1
,842
,445
,756
) 1,
902,
887,
450
1,3
97,4
82,0
34
-
-
(32,
561,
106)
(4
40,9
13,6
03)
(168
,040
,236
) 5
,082
,000
-
-
-
-
Cu
mu
lati
ve in
tere
st r
ate
sen
siti
vity
gap
(1
,956
,314
,540
) (5
3,42
7,09
0)
1,3
44,0
54,9
44
1,34
4,05
4,94
4
-
-
(473
,474
,709
) (6
41,5
14,9
45)
(636
,432
,945
) (6
36,4
32,9
45)
7
07,6
21,9
99
-
-
The
carr
ying
val
ues
of fi
nanc
ial a
sset
s an
d fin
anci
al li
abili
ties
are
appr
oxim
ate
to t
heir
fair
valu
e as
refl
ecte
d in
the
fina
ncia
l sta
tem
ents
.
fi
nan
cial
inst
rum
ents
an
d r
elat
ed d
iscl
osu
res
Th
e C
ompa
ny’s
inte
rest
/ m
ark-
up s
ensi
tivity
pos
ition
for
inte
rest
/mar
k-up
bea
ring
finan
cial
ass
ets
and
liabi
litie
s an
d th
e pe
riods
in w
hich
th
ey w
ill m
atur
e is
as
follo
ws:

67
42.1 Credit risk Credit risk arises from the possibility of asset impairment occurring because counter parties
cannot meet their obligations in transactions involving financial instruments. The Company has established procedures to manage credit exposure including credit approvals, credit limits, collateral and guarantee requirements. These procedures incorporate both internal guidelines and requirements of the Prudential Regulations for NBFC’s. The Company also manages risk through an independent credit department which evaluates customers credit worthiness and growth potential.
Concentration of credit risk arises when a number of counter parties are engaged in similar
business activities or activities in the same geographic region or have similar economic features which would cause their ability to meet contractual obligations to be similarly affected by changes in economic, political or other conditions. Concentration of credit risk indicates the relative sensitivity of the Company’s performance to developments affecting a particular industry or geographic location.
The Company manages concentration of credit risk exposure through diversification of
activities to avoid undue concentration of risks with individuals, groups or specific industry segments. For such purpose, the Company has established exposure limits for single leases and industrial sectors. The Company has an effective rental monitoring system, which allows it to evaluate customers credit worthiness and identify classified portfolio. An allowance for potential lease, installment and other loan losses is maintained at a level which, in the judgment of management, is adequate to provide for potential losses on lease, installment and other loan portfolio that can be reasonably anticipated.
An analysis by class of business of the Company’s net investment in finance leases is given below: The Company has no significant concentration of credit risk, with exposure spread over a
large number of lessees. June June 2009 2008 Rupees % Rupees % Industrial sectors Chemical & fertilizer 35,780,637 0.77% 59,916,859 1.06% Construction 320,920,330 6.93% 516,341,304 9.15% Financial institutions 694,634 0.02% 5,402,191 0.10% Health care 133,667,759 2.89% 116,664,152 2.07% Hotels 10,114,601 0.22% 97,319,007 1.72% Individuals / auto lease 1,729,389,301 37.37% 2,021,835,544 35.82% Insurance companies 4,787,663 0.10% 7,852,438 0.14% Miscellaneous manufacturing 294,091,701 6.35% 289,601,061 5.13% Miscellaneous services 150,052,897 3.24% 267,162,545 4.73% Natural gas & LPG 489,044,195 10.57% 152,724,690 2.71% Paper & board 14,391,125 0.31% 20,178,260 0.36% Steel & engineering 12,895,411 0.28% 135,813,506 2.41% Sugar & allied 28,136,156 0.61% 63,045,144 1.12% Textile composite 115,948,964 2.51% 186,359,148 3.30% Textile knitwear / apparel 127,788,208 2.76% 187,454,316 3.32% Textile spinning 131,135,495 2.83% 150,870,856 2.67% Transport & communication 1,028,888,193 22.23% 1,365,232,133 24.19% 4,627,727,270 100% 5,643,773,154 100%

68
42.2 Liquidity Risks Liquidity risk is the risk that the Company will encounter difficulties in raising funds to
meet commitments associated with financial instruments. The Company has diversified its funding sources and assets are managed with liquidity in mind, maintaining.
The table below summarizes the maturity profile of the assets and liabilities.
More than Over Within one year and five one year up to five years years Total
Rupees Rupees Rupees Rupees Maturities of assets and liabilities Assets Property and equipment - - 110,710,489 110,710,489 Intangible assets - - 838,083 838,083 Net investment in lease finance 2,469,477,654 1,329,000,855 - 3,798,478,509 Long term finances 230,071,375 348,440,998 - 578,512,373 Long term investments - 232,976,000 - 232,976,000 Long term advances - 124,556,726 - 124,556,726 Long term deposits - - 2,625,919 2,625,919 Deferred tax asset - 58,622,055 - 58,622,055 Short term finances 329,846,962 - - 329,846,962 Short term placements 280,987,368 - - 280,987,368 Short term investments - 221,623,027 - 221,623,027 Taxation -net 35,716,713 - - 35,716,713 Mark-up accrued 85,019,434 - - 85,019,434 Advances, prepayments and other receivables 392,561,079 111,557,496 - 504,118,575 Cash and bank balances 158,792,126 - - 158,792,126 3,982,472,711 2,426,777,157 114,174,491 6,523,424,359 Liabilities Term finance certificates 187,590,000 552,962,982 - 740,552,982 Long term certificates of investment 101,800,000 232,808,673 - 334,608,673 Long term borrowings 536,567,458 587,535,711 - 1,124,103,169 Long term deposits 355,320,950 732,830,573 - 1,088,151,523 Staff service costs - 7,183,212 - 7,183,212 Short term certificates of investment 1,027,286,339 - - 1,027,286,339 Short term borrowings 1,826,483,752 - - 1,826,483,752 Mark-up accrued 137,105,415 - - 137,105,415 Trade and other payables 29,589,890 - - 29,589,890 4,201,743,804 2,113,321,151 - 6,315,064,955 Net assets (219,271,093) 313,456,006 114,174,491 208,359,404 Equity Share capital 585,528,730 Reserves (156,545,395)
428,983,335 (Deficit) on revaluation of investments (230,775,972) Suplus on revaluation of assets-net 10,152,041
208,359,404

69
42.3 fair value of financial instruments Fair value is an amount for which an asset could be exchanged, or a liability settled, between
knowledgeable willing parties in an arm’s length transaction. Consequently, differences may arise between the carrying amount and the fair value estimates.
The carrying value of financial assets and financial liabilities approximate their fair value as
reflected in the financial statements. 42.4 Interest rate risk exposure Changes in interest/mark-up rates or in the relationships between short and long term
interest/mark-up rates can affect the rates charged on interest/mark-up earning assets differently than the rates paid on interest bearing liabilities. This can result in an increase/mark-up expense relative to finance income or vice versa. The Company manages borrowings through floating rates.
42.5 Capital Risk Management The Board’s policy is to maintain a strong capital base so as to maintain investors, creditors
and market confidence and to sustain future development of the business. The Board of Directors monitors the return on capital, which the Company defines as net operation income dividend by total capital employed. The board of directors also monitors the level of dividends to individuals ordinary shareholders.
The Company is exposed to externally imposed capital requirements. Vide its notification dated 21 November 2008, the Securities and Exchange Commission
of Pakistan has announced certain revisions in the Non-Banking Finance Companies Rules, 2003 and has promulgated the Non-Banking Finance Companies and Notified Entities Regulations, 2008. The existing NBFCs have been allowed different time limits for aligning themselves with different capital requirements.
The Company sets the amount of capital in proportion to risk. The Company manages
the capital structure and makes adjustments to it in the light of changes in economic conditions and the risk characteristics of the underlying assets. In order to maintain or adjust the capital structure, the Company may, for example, adjust the amount of dividend paid to shareholders, issue new shares or sell assets to reduce debt.
In the presence of equity shortfall the management has taken the following step to bring its equity to the minimum equity required level as required by NBFC,s & Notified Entities Regulations, 2008. Subsequent to year ended 30 June 2009, the management is working to market the preference shares of Rs. 700 million inclusive of Rs. 200 million of green shoe option. Further, a foreign investment company has shown interest to inject foreign equity to an amount of Rs. 585 million.
2009 2008 Rupees Rupees43 Cash and cash equivalents Cash and bank balances 158,792,127 93,288,772 Short term running finance (321,693,339) (332,216,672)
(162,901,212) (238,927,900)
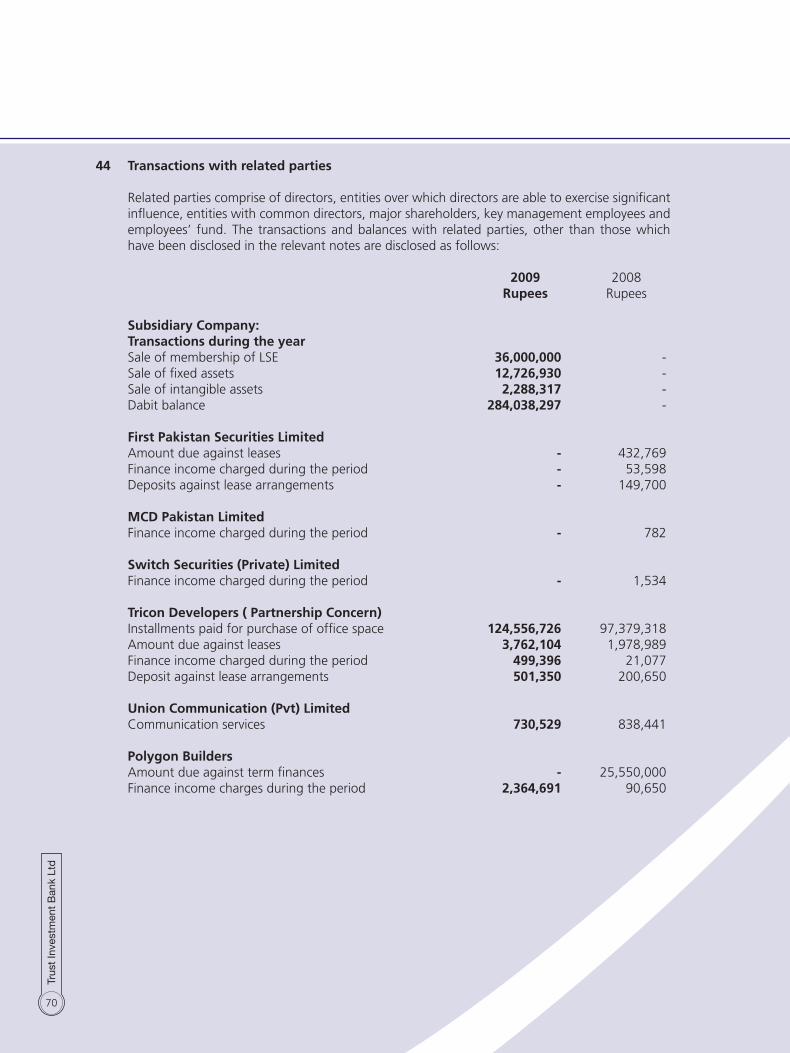
70
44 Transactions with related parties Related parties comprise of directors, entities over which directors are able to exercise significant
influence, entities with common directors, major shareholders, key management employees and employees’ fund. The transactions and balances with related parties, other than those which have been disclosed in the relevant notes are disclosed as follows:
2009 2008 Rupees Rupees
Subsidiary Company: Transactions during the year Sale of membership of LSE 36,000,000 - Sale of fixed assets 12,726,930 - Sale of intangible assets 2,288,317 - Dabit balance 284,038,297 - first Pakistan Securities Limited Amount due against leases - 432,769 Finance income charged during the period - 53,598 Deposits against lease arrangements - 149,700 MCD Pakistan Limited Finance income charged during the period - 782 Switch Securities (Private) Limited Finance income charged during the period - 1,534 Tricon Developers ( Partnership Concern) Installments paid for purchase of office space 124,556,726 97,379,318 Amount due against leases 3,762,104 1,978,989 Finance income charged during the period 499,396 21,077 Deposit against lease arrangements 501,350 200,650 Union Communication (Pvt) Limited Communication services 730,529 838,441 Polygon Builders Amount due against term finances - 25,550,000 Finance income charges during the period 2,364,691 90,650

71
2009 2008 Rupees Rupees
Polygon Developers Amount due against term finances 195,000,000 - Finance income charged during the period 27,593,035 - Ahmed Khalil Amount due against term finances 5,000,000 15,000,000 Finance income charges during the period 1,565,814 1,010,411 Allied Developers Amount due against term finances - 29,500,000 Finance income charged during the period 5,359,665 1,353,205 Employees’ retirement fund Payment made 2,001,231 6,275,538 45 Subsequent event There were no significant adjustable events subsequent to 30 June 2009, which may require an
adjustment to financial statements or additional disclosure and have not already been disclosed in these financial statements.
46 Authorization These financial statements were authorized for issue on November 16, 2009 by the Board of
Directors. 47 General 47.1 Figures have been rounded off to the nearest of rupee. 47.2 Corresponding figures have been re-arranged and re-classified, wherever necessary, for
the purposes of comparison. The current maturities of non-current assets amounting to Rs. 850,120,271 in the year 2008 were being wrongly classified as net investment in lease finance in the financial statements.
CHIEf ExECUTIvE DIRECTOR

72

Consolidated Financial Statement
Trust Investment Bank Limited(for the year ended 30 June 2009)

74
We have audited the annexed consolidated financial statements comprising consolidated balance sheet
of Trust Investment Bank Limited (“the Company”) and its subsidiary company (hereinafter referred
as “the Group”) as at 30 June 2009 and the related consolidated profit and loss account, consolidated
cash flow statement and consolidated statement of changes in equity together with the notes forming
part thereof, for the year then ended. We have also expressed a separate opinion on the financial
statements of the Trust Investment Bank Limited. The financial statements of the subsidiary company,
Trust Capital (Private) Limited, however, was audited by another firm of chartered accountants, whose
modified report has been furnished to us and our opinion in so far as it relates to the amounts included
for such company, is based solely on the report of such auditors.
These financial statements are the responsibility of the Company’s management. Our responsibility is
to express an opinion on these statements based on our audit.
We conducted our audit in accordance with the auditing standards as applicable in Pakistan. These
standards require that we plan and perform the audit to obtain reasonable assurance about whether
the above said statements are free of any material misstatement. An audit includes examining, on a
test basis, evidence supporting the amounts and disclosures in the above said statements. An audit
also includes assessing the accounting policies and significant estimates made by management, as well
as, evaluating the overall presentation of the consolidated financial statements. We believe that our
audit provides a reasonable basis for our opinion and, after due verification, we report that:
a) there is a requirement of an additional provision to the extent of Rs. 329.522 million in respect
of outstanding leases of the Company. However, the management is of the view that the
underlying assets are recoverable and consequently additional provision is not required. Had this
provision been made in the financial statements the loss for the year after taxation and provision
for doubtful leases would have been higher by the same amount;
b) in our opinion, except for the effects on the financial statements of the matter referred in
paragraph (a), the consolidated financial statements present fairly the financial position of the
Group as at 30 June 2009 and the results of its operations, its cash flows and of changes
in equity for the year then ended in accordance with the approved accounting standards as
applicable in Pakistan.
Without further qualifying our opinion, we draw attention of the members to the following notes of
the financial statements;
a) note 1.1 to the financial statements which indicates that the Company incurred a net loss of
Rs. 715.226 million during the year ended 30 June 2009 because of which the equity of the
Company as of that date has fallen below the minimum regulatory requirement of Rs. 500
million by an amount of Rs. 109.2 million. The amount of loss and equity reported does not
AUDITORS’ REPORT TO THE MEMBERS
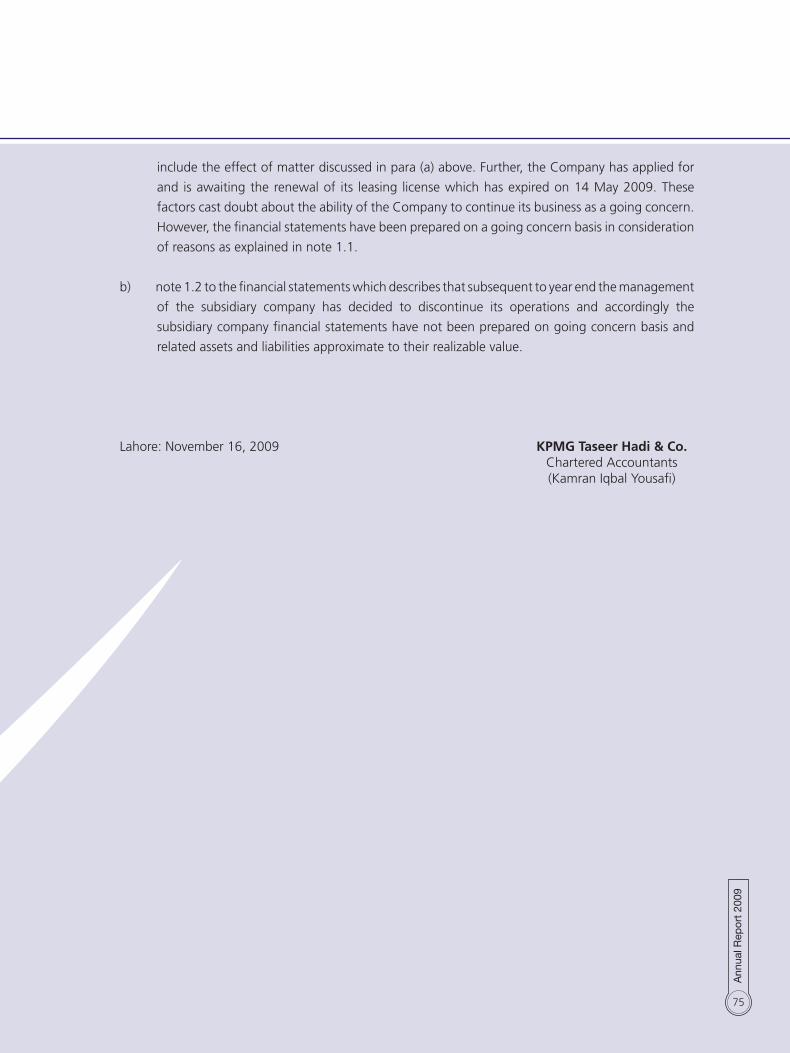
75
include the effect of matter discussed in para (a) above. Further, the Company has applied for
and is awaiting the renewal of its leasing license which has expired on 14 May 2009. These
factors cast doubt about the ability of the Company to continue its business as a going concern.
However, the financial statements have been prepared on a going concern basis in consideration
of reasons as explained in note 1.1.
b) note 1.2 to the financial statements which describes that subsequent to year end the management
of the subsidiary company has decided to discontinue its operations and accordingly the
subsidiary company financial statements have not been prepared on going concern basis and
related assets and liabilities approximate to their realizable value.
Lahore: November 16, 2009 KPMG Taseer Hadi & Co. Chartered Accountants (Kamran Iqbal Yousafi)
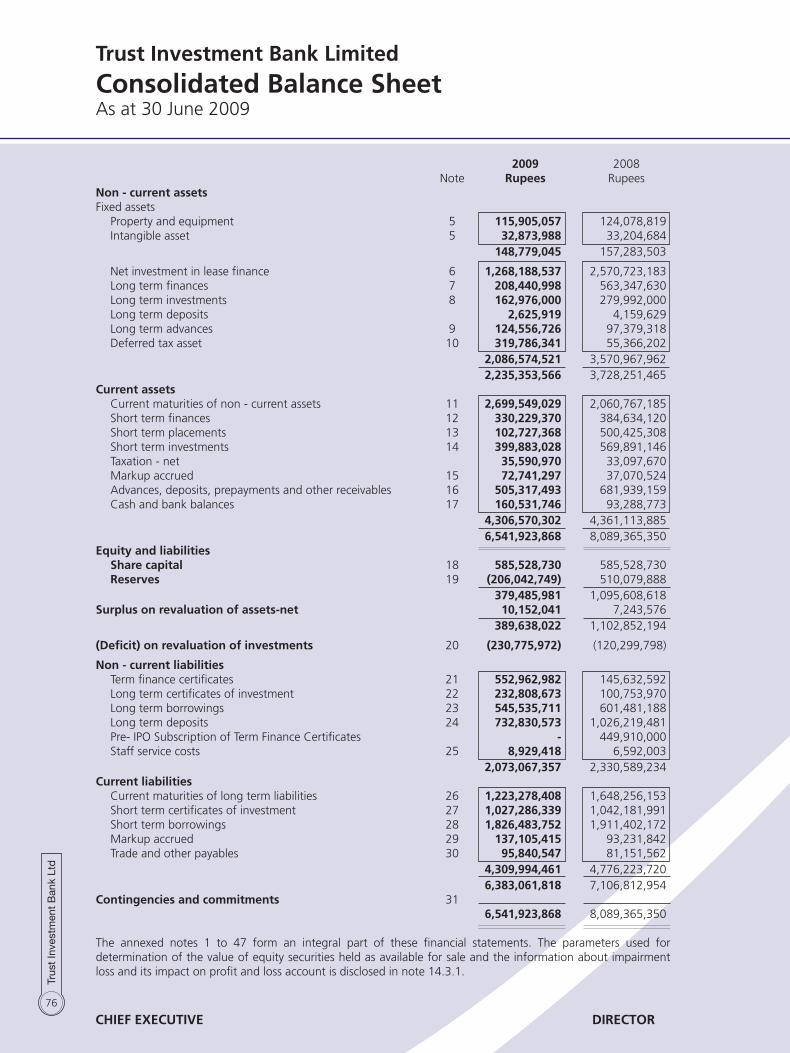
76
2009 2008 Note Rupees RupeesNon - current assets Fixed assets Property and equipment 5 115,905,057 124,078,819 Intangible asset 5 32,873,988 33,204,684 148,779,045 157,283,503 Net investment in lease finance 6 1,268,188,537 2,570,723,183 Long term finances 7 208,440,998 563,347,630 Long term investments 8 162,976,000 279,992,000 Long term deposits 2,625,919 4,159,629 Long term advances 9 124,556,726 97,379,318 Deferred tax asset 10 319,786,341 55,366,202 2,086,574,521 3,570,967,962 2,235,353,566 3,728,251,465 Current assets Current maturities of non - current assets 11 2,699,549,029 2,060,767,185 Short term finances 12 330,229,370 384,634,120 Short term placements 13 102,727,368 500,425,308 Short term investments 14 399,883,028 569,891,146 Taxation - net 35,590,970 33,097,670 Markup accrued 15 72,741,297 37,070,524 Advances, deposits, prepayments and other receivables 16 505,317,493 681,939,159 Cash and bank balances 17 160,531,746 93,288,773 4,306,570,302 4,361,113,885 6,541,923,868 8,089,365,350 Equity and liabilities Share capital 18 585,528,730 585,528,730 Reserves 19 (206,042,749) 510,079,888 379,485,981 1,095,608,618 Surplus on revaluation of assets-net 10,152,041 7,243,576 389,638,022 1,102,852,194 (Deficit) on revaluation of investments 20 (230,775,972) (120,299,798) Non - current liabilities Term finance certificates 21 552,962,982 145,632,592 Long term certificates of investment 22 232,808,673 100,753,970 Long term borrowings 23 545,535,711 601,481,188 Long term deposits 24 732,830,573 1,026,219,481 Pre- IPO Subscription of Term Finance Certificates - 449,910,000 Staff service costs 25 8,929,418 6,592,003 2,073,067,357 2,330,589,234 Current liabilities Current maturities of long term liabilities 26 1,223,278,408 1,648,256,153 Short term certificates of investment 27 1,027,286,339 1,042,181,991 Short term borrowings 28 1,826,483,752 1,911,402,172 Markup accrued 29 137,105,415 93,231,842 Trade and other payables 30 95,840,547 81,151,562 4,309,994,461 4,776,223,720 6,383,061,818 7,106,812,954 Contingencies and commitments 31 6,541,923,868 8,089,365,350 The annexed notes 1 to 47 form an integral part of these financial statements. The parameters used for determination of the value of equity securities held as available for sale and the information about impairment loss and its impact on profit and loss account is disclosed in note 14.3.1.
Trust Investment Bank Limited
Consolidated Balance Sheet As at 30 June 2009
CHIEF ExECUTIvE DIRECTOR
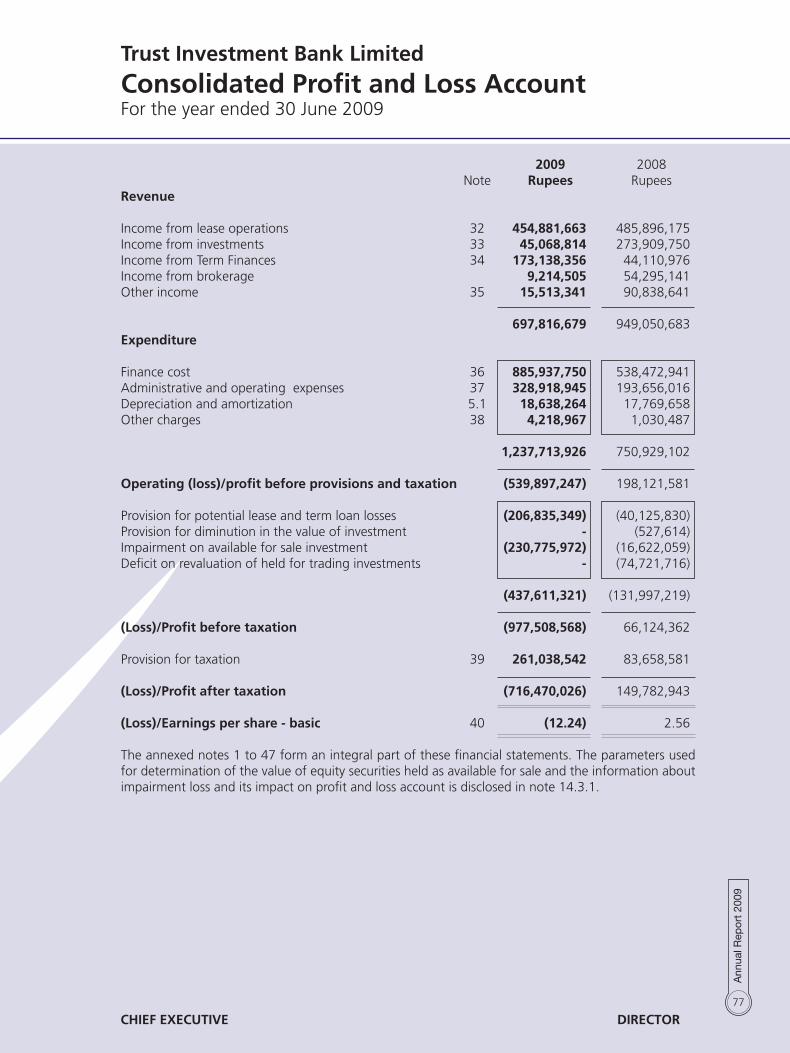
77
2009 2008 Note Rupees RupeesRevenue Income from lease operations 32 454,881,663 485,896,175 Income from investments 33 45,068,814 273,909,750 Income from Term Finances 34 173,138,356 44,110,976 Income from brokerage 9,214,505 54,295,141 Other income 35 15,513,341 90,838,641 697,816,679 949,050,683 Expenditure Finance cost 36 885,937,750 538,472,941 Administrative and operating expenses 37 328,918,945 193,656,016 Depreciation and amortization 5.1 18,638,264 17,769,658 Other charges 38 4,218,967 1,030,487 1,237,713,926 750,929,102 Operating (loss)/profit before provisions and taxation (539,897,247) 198,121,581 Provision for potential lease and term loan losses (206,835,349) (40,125,830)Provision for diminution in the value of investment - (527,614)Impairment on available for sale investment (230,775,972) (16,622,059)Deficit on revaluation of held for trading investments - (74,721,716)
(437,611,321) (131,997,219)
(Loss)/Profit before taxation (977,508,568) 66,124,362 Provision for taxation 39 261,038,542 83,658,581 (Loss)/Profit after taxation (716,470,026) 149,782,943 (Loss)/Earnings per share - basic 40 (12.24) 2.56 The annexed notes 1 to 47 form an integral part of these financial statements. The parameters used for determination of the value of equity securities held as available for sale and the information about impairment loss and its impact on profit and loss account is disclosed in note 14.3.1.
Trust Investment Bank Limited
Consolidated Profit and Loss AccountFor the year ended 30 June 2009
CHIEF ExECUTIvE DIRECTOR

78
Trust Investment Bank Limited
Consolidated Cash Flow StatementFor the year ended 30 June 2009
2009 2008 Rupees RupeesCash flows from operating activities (Loss)/Profit before taxation (977,508,568) 66,124,361 Adjustments for non cash items: Depreciation and amortization 18,638,264 17,769,658 Amortization of transaction costs of term finance certificates 5,852,674 3,733,019 Provision for staff service costs 3,987,335 8,817,108 Provision for doubtful receivables 206,835,349 40,125,830 Lease receivables written off 4,218,967 1,020,487 Finance cost 885,937,750 538,472,941 Profit on sale of property and equipment (1,642,627) (22,448,499) Diminution on revaluation of held for trading investments - 74,721,716 Impairment on available for sale investments 230,775,972 16,622,059 Provision in the value of investments - 527,614 Gain on sale of available for sale investments - (9,472,666)
1,354,603,684 669,889,267 Operating profit before working capital changes 377,095,116 736,013,628 Changes in operating assets and liabilities (Increase) / decrease in: Long term investments 117,016,000 (291,434,076) Short term placements and short term investments 226,453,912 133,152,428 Markup accrued (35,670,773) (19,526,255) Advances, prepayments and other receivables 133,129,764 (24,485,477) Long term and short term finances 170,230,002 (392,443,141) Net investment in lease finance 436,030,189 (668,633,512) Certificates of investment 117,159,051 573,542,054 1,164,348,145 (689,827,979) Decrease in trade and other payables 14,774,358 (149,324,726)
1,179,122,503 (839,152,705) Cash generated/(used) in operations 1,556,217,619 (103,139,077) Finance cost paid (842,064,177) (499,422,634) Taxes paid (2,619,046) (5,568,442) Staff service costs paid (1,649,920) (6,244,698)
(846,333,143) (511,235,774)
Net cash generated from/(used) in operating activities 709,884,476 (614,374,851)

79
CHIEF ExECUTIvE DIRECTOR
2009 2008 Note Rupees Rupees
Cash flows from investing activities Purchase of property and equipment (16,968,684) (51,316,084) Purchase of intangible assets 78,500 (2,510,550) Long term advances (27,177,408) (59,354,318) Long term deposits 1,533,710 (193,801) Sale proceeds of fixed assets 8,499,004 - Sale proceeds of intangible assets (100,000) 50,763,300 Net cash generated from/(used) in investing activities (34,134,878) (62,611,453) Cash flows from financing activities Long and short term borrowings (555,318,309) 358,903,083 Issue of term finance certificates - 450,000,000 Redemption of term finance certificates (42,579,610) (290,375,000) Dividend paid (85,373) (70,263,447) Net cash (used in)/generated from financing activities (597,983,292) 448,264,636 Net increase/(decrease) in cash and cash equivalents 77,766,306 (228,721,668)Cash and cash equivalents at the beginning of the year (238,927,900) (10,206,232)
Cash and cash equivalents at the end of the year 43 (161,161,594) (238,927,900)
The annexed notes 1 to 47 form an integral part of these financial statements. The parameters used for determination of the value of equity securities held as available for sale and the information about impairment loss and its impact on profit and loss account is disclosed in note 14.3.1.
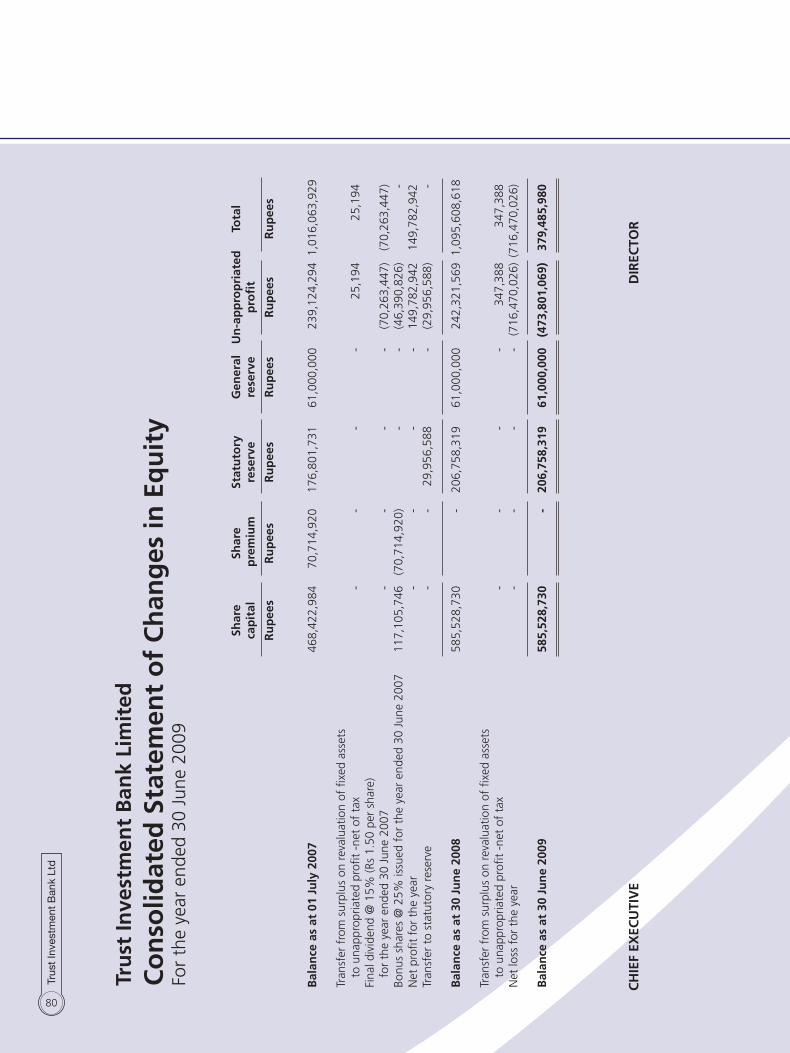
80
CH
IEF
ExEC
UTI
vE
D
IREC
TOR
Sh
are
Shar
e St
atu
tory
G
ener
al
Un
-ap
pro
pri
ated
To
tal
ca
pit
al
pre
miu
m
rese
rve
rese
rve
pro
fit
R
up
ees
Ru
pee
s R
up
ees
Ru
pee
s R
up
ees
Ru
pee
s
Bal
ance
as
at 0
1 Ju
ly 2
007
468
,422
,984
7
0,71
4,92
0
176
,801
,731
6
1,00
0,00
0
239
,124
,294
1,0
16,0
63,9
29
Tran
sfer
fro
m s
urpl
us o
n re
valu
atio
n of
fixe
d as
sets
to
una
ppro
pria
ted
profi
t -n
et o
f ta
x -
-
-
-
2
5,19
4
25,
194
Fina
l div
iden
d @
15%
(Rs
1.50
per
sha
re)
fo
r th
e ye
ar e
nded
30
June
200
7 -
-
-
-
(7
0,26
3,44
7)
(70,
263,
447)
Bo
nus
shar
es @
25%
issu
ed f
or t
he y
ear
ende
d 30
Jun
e 20
07
117
,105
,746
(7
0,71
4,92
0)
-
-
(46,
390,
826)
-
N
et p
rofit
for
the
yea
r -
-
-
-
1
49,7
82,9
42
149
,782
,942
Tr
ansf
er t
o st
atut
ory
rese
rve
-
-
29,
956,
588
-
(2
9,95
6,58
8)
-
Bal
ance
as
at 3
0 Ju
ne
2008
5
85,5
28,7
30
-
206
,758
,319
6
1,00
0,00
0
242
,321
,569
1,0
95,6
08,6
18
Tran
sfer
fro
m s
urpl
us o
n re
valu
atio
n of
fixe
d as
sets
to
una
ppro
pria
ted
profi
t -n
et o
f ta
x -
-
-
-
3
47,3
88
347
,388
N
et lo
ss f
or t
he y
ear
-
-
-
-
(716
,470
,026
) (7
16,4
70,0
26)
Bal
ance
as
at 3
0 Ju
ne
2009
5
85,5
28,7
30
-
206
,758
,319
6
1,00
0,00
0
(473
,801
,069
) 3
79,4
85,9
80
Tru
st In
vest
men
t B
ank
Lim
ited
Co
nso
lidat
ed S
tate
men
t o
f C
han
ges
in E
qu
ity
For
the
year
end
ed 3
0 Ju
ne 2
009
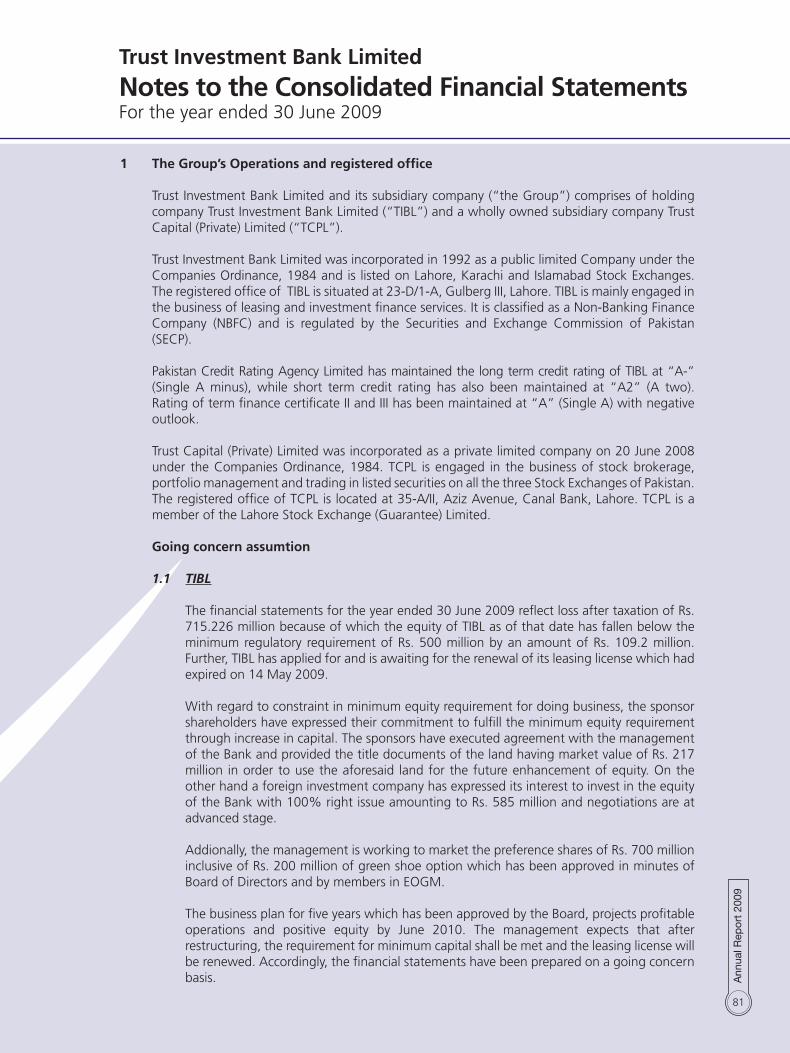
81
Trust Investment Bank Limited
Notes to the Consolidated Financial StatementsFor the year ended 30 June 2009
1 The Group’s Operations and registered office Trust Investment Bank Limited and its subsidiary company (“the Group”) comprises of holding
company Trust Investment Bank Limited (“TIBL”) and a wholly owned subsidiary company Trust Capital (Private) Limited (“TCPL”).
Trust Investment Bank Limited was incorporated in 1992 as a public limited Company under the
Companies Ordinance, 1984 and is listed on Lahore, Karachi and Islamabad Stock Exchanges. The registered office of TIBL is situated at 23-D/1-A, Gulberg III, Lahore. TIBL is mainly engaged in the business of leasing and investment finance services. It is classified as a Non-Banking Finance Company (NBFC) and is regulated by the Securities and Exchange Commission of Pakistan (SECP).
Pakistan Credit Rating Agency Limited has maintained the long term credit rating of TIBL at “A-”
(Single A minus), while short term credit rating has also been maintained at “A2” (A two). Rating of term finance certificate II and III has been maintained at “A” (Single A) with negative outlook.
Trust Capital (Private) Limited was incorporated as a private limited company on 20 June 2008
under the Companies Ordinance, 1984. TCPL is engaged in the business of stock brokerage, portfolio management and trading in listed securities on all the three Stock Exchanges of Pakistan. The registered office of TCPL is located at 35-A/II, Aziz Avenue, Canal Bank, Lahore. TCPL is a member of the Lahore Stock Exchange (Guarantee) Limited.
Going concern assumtion
1.1 TIBL The financial statements for the year ended 30 June 2009 reflect loss after taxation of Rs.
715.226 million because of which the equity of TIBL as of that date has fallen below the minimum regulatory requirement of Rs. 500 million by an amount of Rs. 109.2 million. Further, TIBL has applied for and is awaiting for the renewal of its leasing license which had expired on 14 May 2009.
With regard to constraint in minimum equity requirement for doing business, the sponsor
shareholders have expressed their commitment to fulfill the minimum equity requirement through increase in capital. The sponsors have executed agreement with the management of the Bank and provided the title documents of the land having market value of Rs. 217 million in order to use the aforesaid land for the future enhancement of equity. On the other hand a foreign investment company has expressed its interest to invest in the equity of the Bank with 100% right issue amounting to Rs. 585 million and negotiations are at advanced stage.
Addionally, the management is working to market the preference shares of Rs. 700 million
inclusive of Rs. 200 million of green shoe option which has been approved in minutes of Board of Directors and by members in EOGM.
The business plan for five years which has been approved by the Board, projects profitable
operations and positive equity by June 2010. The management expects that after restructuring, the requirement for minimum capital shall be met and the leasing license will be renewed. Accordingly, the financial statements have been prepared on a going concern basis.

82
1.2 TCPL The management of the subsidiary company, in view of adverse performance all the three
stock exchanges, economic and social environment of the country and the business of TCPL in particular, has decided to discontinue the operations of TCPL and accordingly the financial statements of the subsidiary company have not been prepared on going concern basis and the related assets and liabilities approximate to their realizable values.
2 Statement of compliance 2.1 Statement of compliance These financial statements have been prepared in accordance with approved accounting
standards as applicable in Pakistan. Approved accounting standards comprise of such International Financial Reporting Standards (IFRS) issued by the International Accounting Standards Board as are notified under the Companies Ordinance, 1984, except for the disclosure requirement of Clause 3C of Part II of the Fourth Schedule of the Companies Ordinance, 1984 in respect of which Securities and Exchange Commission of Pakistan (SECP) has given exemptions to all NBFCs’ vide its letter No. SC/NBFC/-1/R/2005, dated 29 August 2005, the Non-Banking Finance Companies (Establishment and Regulation) Rules, 2003 (the NBFC Rules), the Non-Banking Finance Companies and Notified Entities Regulation, 2008 (the NBFC Regulation) and the directives issued by the Securities and Exchange Commission of Pakistan (SECP). Wherever the requirements of the Companies Ordinance 1984, the NBFC Rules, the NBFC Regulations or the directives issued by the SECP differ with the requirements of IFRS, the requirements of the Companies Ordinance 1984, the NBFC Rules, the NBFC Regulation or the directives issued by the SECP shall prevail.
The SECP has deferred the applicability of International Accounting Standard (IAS) 39, ‘Financial Instruments: Recognition and Measurement’ and International Accounting Standard (IAS) 40, ‘Investment Property’ through Circular No. 19 dated 13 August 2003 to Non-Banking Finance Companies (NBFCs) providing investment finance services, discounting services and housing finance services. Accordingly, the requirements of these standards have not been considered in the preparation of these financial statements.
2.2 Standards, Interpretations and amendments to published approved accounting
standards Relevantbutnotyeteffective IAS 1 “Presentation of Financial Statements” effective for annual periods beginning on
or after 01 January 2009 revises the existing IAS 1 and requires, apart from changing the names of certain components of financial statements, presentation of transactions with owners in statement of changes in equity and with non-owners in comprehensive Income Statement. Adoption of the above standard will only effect the presentation of financial statements.
Notrelevantandnotyeteffective
The following standards, amendments and interpretations to approved accounting standards, effective for accounting periods beginning on or after 1 July 2009 are either not relevant to the NBFC operations or are not expected to have significant impact on the NBFC’s financial statements other than certain increased disclosures only:

83
Standards or interpretation IFRS 2 (amendment) - Share based payments IFRS 3 (amendment) - Business Combinations IFRS 8 - Operating Segments IAS 27 - Consolidated and separate financial statements IAS 32 (amendment) - Financial instruments: Presentation and consequential amendment to IAS 1- Presentation of Financial Statements IFRIC 15 - Accounting for Agreements for the Construction of Real Estate IFRIC 16 - Hedges of a Net Investment in a Foreign Operation In addition to above, International Accounting Standards Board made certain amendments
to existing standards and interpretations as part of its first and second annual improvements projects. These amendments are unlikely to have impact on the Group’s financial statements.
3 Basis of measurement 3.1 Accounting convention The financial statements have been prepared under the historical cost convention except
for revaluation of certain financial instruments and property at fair value and recognition of certain employee retirement benefits at present value.
3.2 Significant estimates The preparation of financial statements in conformity with approved accounting standards
requires management to make judgments, estimates and assumptions that effect the application of policies and reported amounts of assets and liabilities, income and expenses. The estimates and associated assumptions and judgments are based on historical experience and various other factors that are believed to be reasonable under the circumstances, the result of which form the basis of making the judgments about carrying values of assets and liabilities that are not readily apparent from other sources. Actual results may differ from these estimates.
The estimates and underlying assumptions are reviewed on an ongoing basis. Revision
to accounting estimates are recognized in the period in which the estimate is revised if the revision effects only that period, or in the period of revision and future periods if the revision affects both current and future periods. The areas where various assumptions and estimates are significant to Group’s financial statements or where judgments were exercised in application of accounting policies are as follows:
Note
- Taxation 4.1 - Residual value and useful life of depreciable assets 4.2 - Provisions and contingencies 4.5 - Staff retirement benefits (Gratuity) 4.14 - Impairment 4.20
84
3.3 Basis of consolidation The consolidated financial statements include the financial statements of TIBL and its wholly
owned subsidiary TCPL. The financial statements of subsidiary company have been consolidated on line by line
basis and carrying value of investment held by parent company is eliminated against the subsidiary’s shareholder’s equity in the consolidated financial statements. Intra-Group balances, transactions, income and expenses have also been eliminated. Unrealized gains arising on intra-Group transactions recognized in assets are eliminated. Unrealized losses are eliminated in the same way as unrealized gains, but only to the extent that there is no evidence of impairment.
4 Significant accounting policies 4.1 Taxation Current The charge for current taxation is based on taxable income at current rate of taxation of the
Income Tax Ordinance, 2001 after taking into account applicable tax credits and rebates, if any.
Deferred Deferred tax is recognized using the balance sheet liability method on all temporary
differences between the amounts attributed to assets and liabilities for financial reporting purposes and amounts used for taxation purposes.
Deferred tax liabilities are generally recognized for all taxable temporary differences.
Deferred tax asset is recognized to the extent that it is probable that future taxable profits will be available against which deductible difference, unused tax losses and tax credits can be utilized. Deferred tax assets are reduced to the extent that it is no longer probable that the related tax benefit will be realized. Deferred tax is calculated at the rates that are expected to apply to the period when differences reverse based on tax rates that have been enacted or substantively enacted by the balance sheet date.
Deferred tax is charged or credited to income statement, except in case of items credited
or charged to equity, in which case it is included in equity. 4.2 Property and equipment These are stated at historical cost/revalued amount less accumulated depreciation and
impairment losses. Depreciation is calculated using the diminishing balance method, except vehicles for which
straight line method is used, at the rates specified in the fixed assets schedule, which are considered appropriate to write off the cost of the assets over their estimated useful lives.
Depreciation is charged from the month when assets are available for use upto the month
in which the assets are disposed off.
85
Normal repairs and maintenance are charged to revenue as and when incurred. Renewals and replacements are capitalized when it is probable that respective future economic benefits will flow to the Group and the cost of the items can be reliably measured, and assets so replaced, if any, are retired.
Gains and losses on disposal of property and equipment are recognized in the profit and
loss account in the year of disposal. 4.3 Intangible assets These are stated at cost less impairment losses, if any. The carrying amounts are reviewed at
each balance sheet date to assess whether these are recorded in excess of their recoverable amounts, and where carrying value is in excess of recoverable amount, these are written down to their estimated recoverable amount.
Expenditure incurred to acquire computer software are capitalized as intangible assets and
stated at cost less accumulated amortization and any identified impairment loss. Intangible assets are amortized using the straight- line method over a period of 10 years.
Full year amortization is charged from the year when assets are available for use and no
amortization will be charged in the year in which the assets are disposed off. 4.4 Financial instruments Financialassets Significant financial assets include short and long term finances, short and long term
investments, short term placements, net investment in leases, advances and receivables, long term deposits and cash and bank balances. Finances and receivables from clients are stated at their nominal value as reduced by provision for doubtful finances and receivable, while other financial assets are stated at cost except for investments, which are revalued as per accounting policies.
Financialliabilities Financial liabilities are classified according to the substance of the contractual arrangements
entered into. Significant financial liabilities include term finance certificates, short and long term borrowings, certificates of investment, deposits against lease arrangements, trade and other payables and dividends payable. Markup based financial liabilities are recorded at gross proceeds received. Other liabilities are stated at their nominal value.
Recognitionandderecognition All the financial assets and financial liabilities are recognized at the time when the Group becomes
a party to the contractual provisions of the instruments. Financial assets are derecognized when the Group loses control of the contractual rights that comprise the financial assets. Financial liabilities are derecognized when these are extinguished i.e. when the obligation specified in the contract is discharged, cancelled or expired. Any gain or loss on derecognition of the financial assets and liabilities is taken to the income in the current period.
The policies in respect of these financial instruments have been disclosed in the relevant policy notes.
86
Offsettingoffinancialassetsandfinancialliabilities A financial asset and a financial liability is offset and the net amount is reported in the
balance sheet if the Group has legal enforceable right to set off the recognized amount and intends either to settle on a net basis or to realize the assets and settle the liability simultaneously. Corresponding income on assets and charge on liability are reported at net amount.
4.5 Provisions A provision is recognized when the Group has a present legal or constructive obligation as
a result of past events and it is probable that an outflow of resources embodying economic benefits will be required to settle the obligation and a reliable estimate can be made of the amount of obligation.
4.6 Investments The Group classifies its investments as held to maturity, available for sale, held for trading
and loans and receivables. Initialmeasurement All investments are initially recognized at cost being the fair value of the consideration
given including acquisition cost. Subsequentmeasurement Simpleinvestment Investment in subsidiary Group is measured at cost as per the requirements of IAS-27
“Consolidated and Separate Financial Statements”. However, at subsequent reporting dates, the Group reviews the carrying amounts of the investments and its recoverability to determine whether there is an indication that such investments have suffered an impairment loss. If any such indication exists the carrying amount of the investment is adjusted to the extent of impairment loss. Impairment losses are recognized as an expense currently.
Heldtomaturity The investments with fixed maturity or determinable payments where management has
both intent and ability to hold to maturity are classified as held to maturity. These are stated at amortized cost using the effective interest rate method less impairment, if any. The amortization for the period is charged to the profit and loss account.
Heldfortrading These include investments which are acquired principally for the purpose of generating
profit from short term fluctuations in price or dealer’s margins, are classified as investments held for trading. These are stated at fair values with any resulting surplus/(deficit) recognized in profit and loss account.
87
Available-for-sale Investments which can not be classified as loans and receivables, held to maturity investments
or held for trading investments are classified as available for sale investments. Investments intended to be held for an unidentified period of time, which may be sold in
response to need for liquidity or changes to interest rates, exchange rates or equity prices are classified as available for sale.
Available-for-sale investments are measured at subsequent reporting dates at fair value for
those shares which have fair values. However all such shares for which fair value cannot be determined are valued at cost. Surplus/(deficit) on remeasurement is kept in a separate account and is shown in the balance sheet below the shareholders’ equity, until the security is disposed off or is determined to be impaired, at which time, the cumulative surplus/(deficit) is included in the profit and loss account.
However, as allowed by the BSD circular no. 10 dated 13 July 2004, TIBL will be free to determine the extent of holding under the above categories taking into consideration various aspects such as trading strategies, intention of acquisition of securities, capital position, expertise available to manage investment portfolio, and the risk management capabilities. Under exceptional circumstances, shifting from one category to another category may be made subject to the following conditions:
- Shifting of investments to/from held to maturity category is allowed once a year only
with the approval of the Board of Directors within two months of the commencement of accounting year. Any further shifting to/from this category is not allowed during the remaining part of that accounting year.
- Shifting to/from available for sale category is allowed with the approval of the Assets
and Liabilities Committee (ALCO) subject to the condition that the reasons for such shifting will be recorded in writing.
- Shifting from held for trading category to available for sale or held to maturity
categories is generally not allowed. It is permitted under exceptional circumstances like not being able to sell the securities within the prescribed period of 90 days due to tight liquidity position in market or extreme market volatility with the approval of ALCO. The justification for such exceptional shifting of securities is recorded in the minutes of ALCO meeting. Shifting of securities from one category to another is at the lower of the market value or the acquisition cost/book value, and the diminution in value, if any, on such transfer is fully provided for.
- The surplus/deficit arising as a result of revaluation of held for trading investments
is taken to profit and loss account. Furthermore, the surplus/deficit on revaluation of available for sale and held to maturity securities is taken to “Surplus/Deficit on revaluation of Investments” account. However, any permanent diminution in the value of available for sale or held to maturity securities is provided for by charging it to the profit and loss account. The measurement of surplus/deficit is done on portfolio basis for each of the above three categories separately.
88
4.7 Trade and settlement date accounting All “regular way” purchases and sales of listed shares are recognized on the trade date, i.e.
the date that the Group commits to purchase/ sell the asset. Regular way purchase or sale of financial assets are those, the contract for which requires delivery of assets within the time frame established generally by regulation or convention in the market place concerned.
4.8 Securities under repurchase/reverse repurchase agreements Transactions of repurchase/ reverse repurchase of investment securities are entered into at
contracted rate for specified periods of time and are accounted for as follows. Repurchaseagreements Investments sold with the simultaneous commitment to repurchase at a specified future
date (Repo) continue to be recognized in the balance sheet and are measured in accordance with accounting policies for investments. The counterparty liability for amounts received under these agreements is included in short term borrowing. The difference between sale and repurchase price is treated as markup on short term borrowing and accrued over the tenure of the repo agreement.
ReverseRepurchaseagreements Investments purchased with a simultaneous commitment to resell at a specified future
date (reverse repo) are not recognized in the balance sheet. Amounts paid under these agreements are recorded as ‘short term placements’. The difference between purchase and resale price is treated as return from funds placement with financial institutions or income from reverse repurchase transactions of listed shares, as the case may be, and accrued over the life of reverse repo agreement.
4.9 Term finances Term finances originated by the Group are stated at cost less any amount written off and
provision for doubtful finances, if any, in accordance with NBFCs prudential regulations. 4.10 Net investment in lease finance Lease where the TIBL transfers substantially all the risks and rewards incidental to ownership
of the asset to the lessee are classified as finance leases. Net investment in lease finances is recognized at an amount equal to the aggregate of minimum lease payments including any guaranteed residual value and excluding unearned finance income, write-offs and provision for doubtful lease finances, if any.
4.11 Repossessed assets TIBL repossesses leased assets in settlement of non-performing finances provided to customers.
Gains or losses on disposal are taken to the income in the current period unless recoverable from / payable to the customer. Major losses on the disposal of repossessed leased assets are accounted for as receivable till the final settlement with lessee. Minor losses on the disposal of repossessed vehicles are charged to the income in the current period.
89
4.12 Revenue recognition Financeleases The “financing method” is used for recognition of finance income on finance leases. Under
this method, the unearned finance income i.e., the excess of aggregate lease rentals and the estimated residual value over the net investment is deferred and then amortized to income over the term of the lease on a systematic basis, so as to produce a constant rate of return on the TIBL’s net investment in the finance lease.
Capitalgainsandlossesonsaleofinvestments Capital gains or losses on the sale of investments are recognized in the period in which they
arise. Commissionincome Brokerage commission and other advisory fees are recognized when such services are
provided.
Processingfee,frontendfeeandpenalcharges These are recognized as income when services are provided. Returnonfinances,placementsandtermfinances. Return on finances provided, placements and term finances are recognized on time
proportion basis. Morabahaincome Mark-up/profit earned on finance under morabaha agreement and finance under buy-back
agreement is recognized on a time proportion basis taking account of, where applicable, the relevant buy-back dates and prices, or where a specific schedule of recoveries is prescribed in the agreement, the respective dates when mark-up is required to be paid.
Incomeonbankdepositsandreverserepotransactions Income from bank deposits, investments, loans and advances is recognized on time
proportion basis. Guaranteecommission Commission income from guarantee is recognized on time proportion basis. DividendIncome Dividend income is recognized when right to receive dividend is established.
90
4.13 Return on certificates of investment Return on certificates of investment is recognized on a time proportionate basis taking into
account the relevant issue date and final maturity date. 4.14 Staff retirement benefits Definedbenefitplan Gratuityfund The Group operates an approved funded gratuity scheme for all of its permanent employees
subject to a minimum qualifying period of six months of service. Provisions are made in accordance with the actuarial valuation using ‘Projected Unit Credit method’.
Actuarial gains and losses arising as a result of actuarial valuation are recognized as income
or expense to the extent that the net cumulative unrecognized actuarial gains or losses at the end of the previous reporting period exceeded 10% of the higher of present value of defined benefit obligation and the fair value of the plan assets as at that date. These gains or losses are recognized over the expected average remaining working lives of the employees participating in the plan.
Gratuity is payable to employees on the completion of prescribed qualifying period of
service under the scheme. Leaveencashment The Group operates an unfunded leave encashment scheme for all of its permanent
employees. Provisions are made in accordance with the actuarial valuation using ‘Projected Unit Credit method’.
4.15 Provision for potential lease losses and loans The provision for potential lease losses and installment loan losses is maintained at a level
which is adequate to provide for potential losses on lease and installment loan portfolio in accordance with Prudential Regulations for NBFCs. Specific provision for potential lease and installment loan losses is maintained at a level which, in the judgment of the management, is adequate to provide potential losses on lease and installment loan portfolio that can be reasonably anticipated. The provision is increased by charge to income and is decreased by charge offs, net of recoveries.
The leases, loans and advances are written off when there are no realistic prospects of
recovery. 4.16 Cash and cash equivalents For the purpose of cash flow statement, cash and cash equivalents comprise of cash in
hand, balance with banks on current and deposit accounts and short term running finance account.
91
4.17 Borrowing costs The borrowing cost incurred on debts of the Group is charged to income. 4.18 Transactions with related parties and transfer pricing The Group enters into transactions with related parties on arms length basis. Prices for
transactions with related parties are determined using admissible valuation methods, except for the assets sold to employees at written down value as approved by the board of directors.
Parties are said to be related, if they are able to influence the operating and financial
decisions of the Group and vice versa. 4.19 Foreign currency translation Transactions denominated in foreign currencies are translated to Pak Rupee at the foreign
exchange rate ruling at the date of transaction. Assets and liabilities in foreign currency are translated at the rates of exchange prevailing on the balance sheet date. All exchange gains/losses are taken to profit and loss account.
4.20 Impairment The carrying amounts of the assets are reviewed at each balance sheet date to identify
the circumstances indicating the occurrence of impairment loss or reversal of previous impairment losses. If any such indication exists, the recoverable amount of such asset is estimated and impairment loss is recognized in the profit and loss account. Where an impairment loss subsequently reverses, the carrying amount of such asset is increased to the revised recoverable amount. A reversal of the impairment loss is recognized in income.
4.21 Dividends Dividend is recognized as a liability in the period in which it is declared. 4.22 Bonus shares Bonus shares are recognized as an appropriation from profit in the period in which it is
declared.
2009 2008
Note Rupees Rupees5 Fixed assets Property and equipment 5.1 115,905,057 124,078,819 Intangible 5.1 32,873,988 33,204,684 148,779,045 157,283,503
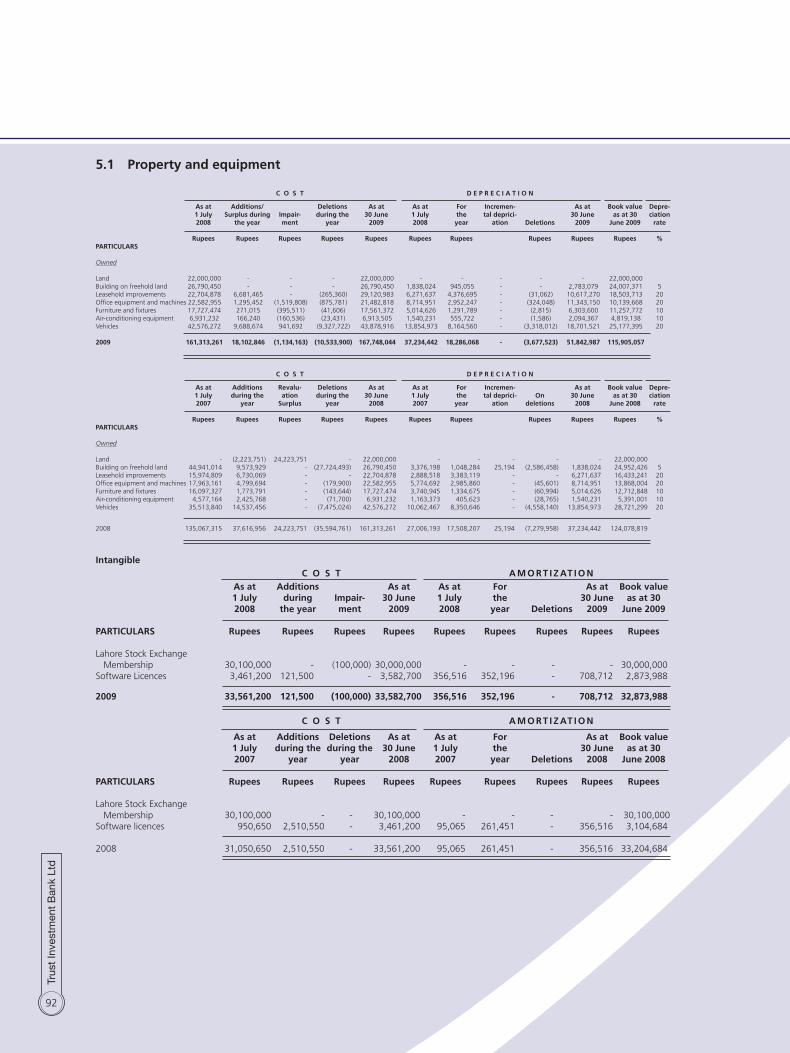
92
5.1 Property and equipment
C O S T D E P R E C I A T I O N
As at Additions/ Deletions As at As at For Incremen- As at Book value Depre- 1 July Surplus during Impair- during the 30 June 1 July the tal deprici- 30 June as at 30 ciation 2008 the year ment year 2009 2008 year ation Deletions 2009 June 2009 rate Rupees Rupees Rupees Rupees Rupees Rupees Rupees Rupees Rupees Rupees %PARTICULARS Owned Land 22,000,000 - - - 22,000,000 - - - - - 22,000,000 Building on freehold land 26,790,450 - - - 26,790,450 1,838,024 945,055 - - 2,783,079 24,007,371 5Leasehold improvements 22,704,878 6,681,465 - (265,360) 29,120,983 6,271,637 4,376,695 - (31,062) 10,617,270 18,503,713 20Office equipment and machines 22,582,955 1,295,452 (1,519,808) (875,781) 21,482,818 8,714,951 2,952,247 - (324,048) 11,343,150 10,139,668 20Furniture and fixtures 17,727,474 271,015 (395,511) (41,606) 17,561,372 5,014,626 1,291,789 - (2,815) 6,303,600 11,257,772 10Air-conditioning equipment 6,931,232 166,240 (160,536) (23,431) 6,913,505 1,540,231 555,722 - (1,586) 2,094,367 4,819,138 10Vehicles 42,576,272 9,688,674 941,692 (9,327,722) 43,878,916 13,854,973 8,164,560 - (3,318,012) 18,701,521 25,177,395 20
2009 161,313,261 18,102,846 (1,134,163) (10,533,900) 167,748,044 37,234,442 18,286,068 - (3,677,523) 51,842,987 115,905,057
C O S T D E P R E C I A T I O N
As at Additions Revalu- Deletions As at As at For Incremen- As at Book value Depre- 1 July during the ation during the 30 June 1 July the tal deprici- On 30 June as at 30 ciation 2007 year Surplus year 2008 2007 year ation deletions 2008 June 2008 rate Rupees Rupees Rupees Rupees Rupees Rupees Rupees Rupees Rupees Rupees %PARTICULARS Owned Land - (2,223,751) 24,223,751 - 22,000,000 - - - - - 22,000,000 Building on freehold land 44,941,014 9,573,929 - (27,724,493) 26,790,450 3,376,198 1,048,284 25,194 (2,586,458) 1,838,024 24,952,426 5Leasehold improvements 15,974,809 6,730,069 - - 22,704,878 2,888,518 3,383,119 - - 6,271,637 16,433,241 20Office equipment and machines 17,963,161 4,799,694 - (179,900) 22,582,955 5,774,692 2,985,860 - (45,601) 8,714,951 13,868,004 20Furniture and fixtures 16,097,327 1,773,791 - (143,644) 17,727,474 3,740,945 1,334,675 - (60,994) 5,014,626 12,712,848 10Air-conditioning equipment 4,577,164 2,425,768 - (71,700) 6,931,232 1,163,373 405,623 - (28,765) 1,540,231 5,391,001 10Vehicles 35,513,840 14,537,456 - (7,475,024) 42,576,272 10,062,467 8,350,646 - (4,558,140) 13,854,973 28,721,299 20
2008 135,067,315 37,616,956 24,223,751 (35,594,761) 161,313,261 27,006,193 17,508,207 25,194 (7,279,958) 37,234,442 124,078,819
Intangible C O S T A M O RT I Z AT I O N As at Additions As at As at For As at Book value 1 July during Impair- 30 June 1 July the 30 June as at 30 2008 the year ment 2009 2008 year Deletions 2009 June 2009 PARTICULARS Rupees Rupees Rupees Rupees Rupees Rupees Rupees Rupees Rupees
Lahore Stock Exchange Membership 30,100,000 - (100,000) 30,000,000 - - - - 30,000,000 Software Licences 3,461,200 121,500 - 3,582,700 356,516 352,196 - 708,712 2,873,988
2009 33,561,200 121,500 (100,000) 33,582,700 356,516 352,196 - 708,712 32,873,988
C O S T A M O RT I Z AT I O N
As at Additions Deletions As at As at For As at Book value 1 July during the during the 30 June 1 July the 30 June as at 30 2007 year year 2008 2007 year Deletions 2008 June 2008 PARTICULARS Rupees Rupees Rupees Rupees Rupees Rupees Rupees Rupees Rupees
Lahore Stock Exchange Membership 30,100,000 - - 30,100,000 - - - - 30,100,000 Software licences 950,650 2,510,550 - 3,461,200 95,065 261,451 - 356,516 3,104,684
2008 31,050,650 2,510,550 - 33,561,200 95,065 261,451 - 356,516 33,204,684

93
5.1.1 Following assets were disposed off during the year Cost Book Sale Gain / Mode of Sold to value proceeds (loss) disposal Description Rupees Rupees Rupees Rupees Assets with book value exceeding Rs. 50,000 Furniture Tables 20,500 19,113 5,000 (14,113) Negotiation Progressive Securities (Private) Limited Sofa 13,506 12,592 6,000 (6,592) Negotiation Progressive Securities (Private) Limited Chairs 7,600 7,086 8,000 914 Negotiation Progressive Securities (Private) Limited Air Conditioners LG Split 1.5 tons 23,431 21,845 16,000 (5,845) Negotiation Progressive Securities (Private) Limited Lease Hold Premises Renovations at LSE 124,770 107,883 3,300 (104,583) Negotiation Progressive Securities (Private) Limited Renovations at ISE 140,590 126,415 - (126,415) Write off Equipments Television 13,000 11,241 8,000 (3,241) Negotiation Progressive Securities (Private) Limited UPS 8,167 7,062 10,000 2,938 Negotiation Progressive Securities (Private) Limited GFC Fans 984 851 600 (251) Negotiation Progressive Securities (Private) Limited Telephone sets 3,408 2,947 2,700 (247) Negotiation Progressive Securities (Private) Limited
Cost Book Sale Gain / Mode of Sold to value proceeds (loss) disposal Description Rupees Rupees Rupees Rupees Vehicles Vehicle-LRN 3426 496,000 - 302,000 302,000 Negotiation Mr. Sabir Malik Vehicle-LZL- 389 790,500 118,575 480,000 361,425 Negotiation Mr. Muhammad Umar Vehicle-Suzuki LEC 9170 419,050 300,334 370,000 69,666 Negotiation Mr. Farhan Baig Vehicle-LES 3005 421,000 322,767 405,000 82,233 Negotiation Mr. Muhammad Nawaz Vehicle-LEA 8381 685,000 388,166 600,000 211,834 Negotiation Mr. Nasir Gulzar Vehile-Motor Cycle LZX 4093 73,000 - 24,850 24,850 Negotiation Mr. Ashfaq Ahmad Vehicle-Honda City 795,000 742,467 737,000 (5,467) Negotiation Mr. Kashif Butt Vehicle-LEC 3028 800,000 725,479 742,000 16,521 Negotiation Mr. Siraj Din Vehicle-Suzuki Mehran VXR 498,452 432,356 440,000 7,644 Negotiation Mr. Mian Razzaq Vehicle-LZT 3138 325,000 297,917 235,000 (62,917) Negotiation Mr. Malik Siraj Vehicle-LZV 251 750,000 675,000 760,000 85,000 Negotiation Mr. Aamir Iqbal Vehicle- LED 9368 840,500 532,317 865,000 332,683 Negotiation Mr. Hafeez Ahmad Vehicle- LEB 6494 663,000 375,700 610,000 234,300 Negotiation Mr. Aamir Mirza Vehicle-LEF-8276 724,000 470,600 525,000 54,400 Negotiation Mr. Hafeez Ahmad Vehicle-LEE 5320 1,046,720 628,032 700,000 71,968 Negotiation Mr. Mudassir Hussain Naqvi Assets with book value below Rs. 50,000 850,222 529,632 643,554 113,922 Negotiation Various 2009 10,533,400 6,856,377 8,499,004 1,642,627
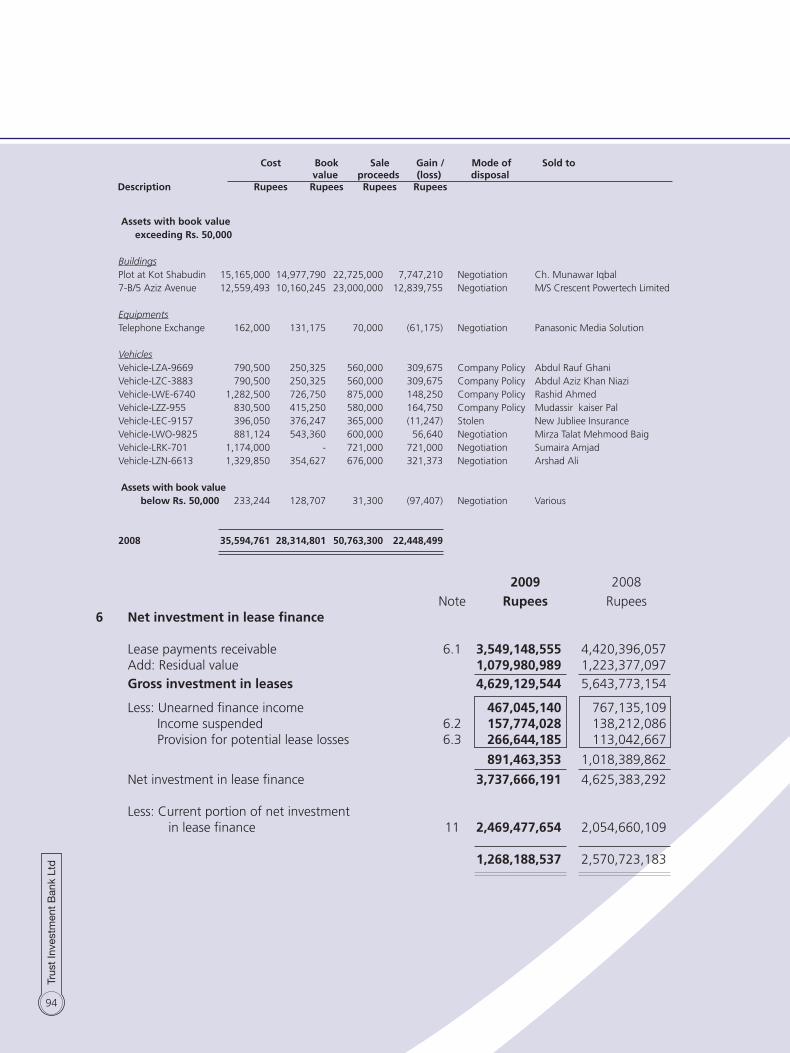
94
Assets with book value exceeding Rs. 50,000 Buildings Plot at Kot Shabudin 15,165,000 14,977,790 22,725,000 7,747,210 Negotiation Ch. Munawar Iqbal 7-B/5 Aziz Avenue 12,559,493 10,160,245 23,000,000 12,839,755 Negotiation M/S Crescent Powertech Limited
Equipments Telephone Exchange 162,000 131,175 70,000 (61,175) Negotiation Panasonic Media Solution
Vehicles Vehicle-LZA-9669 790,500 250,325 560,000 309,675 Company Policy Abdul Rauf Ghani Vehicle-LZC-3883 790,500 250,325 560,000 309,675 Company Policy Abdul Aziz Khan Niazi Vehicle-LWE-6740 1,282,500 726,750 875,000 148,250 Company Policy Rashid Ahmed Vehicle-LZZ-955 830,500 415,250 580,000 164,750 Company Policy Mudassir kaiser Pal Vehicle-LEC-9157 396,050 376,247 365,000 (11,247) Stolen New Jubliee Insurance Vehicle-LWO-9825 881,124 543,360 600,000 56,640 Negotiation Mirza Talat Mehmood Baig Vehicle-LRK-701 1,174,000 - 721,000 721,000 Negotiation Sumaira Amjad Vehicle-LZN-6613 1,329,850 354,627 676,000 321,373 Negotiation Arshad Ali Assets with book value below Rs. 50,000 233,244 128,707 31,300 (97,407) Negotiation Various 2008 35,594,761 28,314,801 50,763,300 22,448,499
2009 2008
Note Rupees Rupees6 Net investment in lease finance Lease payments receivable 6.1 3,549,148,555 4,420,396,057 Add: Residual value 1,079,980,989 1,223,377,097 Gross investment in leases 4,629,129,544 5,643,773,154
Less: Unearned finance income 467,045,140 767,135,109 Income suspended 6.2 157,774,028 138,212,086 Provision for potential lease losses 6.3 266,644,185 113,042,667
891,463,353 1,018,389,862
Net investment in lease finance 3,737,666,191 4,625,383,292 Less: Current portion of net investment in lease finance 11 2,469,477,654 2,054,660,109 1,268,188,537 2,570,723,183
Cost Book Sale Gain / Mode of Sold to value proceeds (loss) disposal Description Rupees Rupees Rupees Rupees

95
3 0 J u n e 2 0 0 9
Not later Later than one year Later Total than one and not later than than five year five years years Rupees Rupees Rupees Rupees Gross investment 2,711,791,282 1,917,338,262 - 4,629,129,544 Less: Unearned finance income 242,313,628 224,731,512 - 467,045,140 2,469,477,654 1,692,606,750 - 4,162,084,404
3 0 J u n e 2 0 0 8 Not later Later than one year Later Total than one and not later than than five year five years years Rupees Rupees Rupees Rupees Gross investment 1,604,856,731 4,038,916,423 - 5,643,773,154 Less: Unearned finance income 400,316,893 366,818,216 - 767,135,109 1,204,539,838 3,672,098,207 - 4,876,638,045
6.1 TIBL has entered into various lease agreements with implicit rate of return ranging from 8% to 26.76% (2008: 6.75% to 24%) per annum. Security deposit is obtained generally upto 10% to 20% of the cost of leased assets at the time of disbursement. TIBL requires the lessees to insure the leased assets in the favour of the TIBL and to maintain the financial ratios required by NBFC’s Prudential regulations. Additional lease rentals are charged on the delayed payments.
All the leases are secured against demand promissory notes of the lessees and personal
guarantees of the directors and in case of individual lessees two personal guarantees. Whereas, certain leases are additionally secured by mortgage of immovable property.
2009 2008
Rupees Rupees 6.2 Income suspended Balance at the beginning of the year 138,212,086 161,531,804 Charge for the year 47,067,618 54,335,852 Reversal of suspension (27,505,676) (77,655,570)
Balance at the end of the year 157,774,028 138,212,086 6.3 Provision for potential lease losses Balance at the beginning of the year 113,042,667 80,900,962 Current year potential lease loss provision 218,596,822 43,046,419 Provision reversed during the year (60,776,337) (9,884,227) Provision written off during the year (4,218,967) (1,020,487)
Balance at the end of the year 266,644,185 113,042,667

96
2009 2008
Note Rupees Rupees7 Long term finances Employees - considered good 7.1 22,822,700 24,223,751 Others Secured - considered good 7.2 415,415,844 544,930,955 Unsecured - considered good 273,829 300,000
Secured - considered doubtful 4,773,829 - Less: Provision against doubtful finances 7.3 4,773,829 - - - 438,512,373 569,454,706 Less : current maturity 11 230,071,375 6,107,076 208,440,998 563,347,630 7.1 These represent long term finances provided to employees against mortgage of property.
These carry mark-up ranging from 4% to 17.18% (2008: 4% to 14.72%) per annum. The maximum aggregate balance due from the chief executive is Rs. 4.77 million (2008: 5.74 million) and executives is Rs. 13.61 million (2008: 15.60 million).
Loan to the employees includes the house loan to the Ex-chief executive amounting to
Rs. 4.77 million outstanding as on 30 June 2009 and carries mark-up at the rate of 4% to 10%.
7.2 These include long term finances provided to individuals against mortgage of property.
These carry mark-up ranging from 14.00% to 28.69% (2008: 11.75% to 29%) per annum.
2009 2008
Note Rupees Rupees 7.3 Movement in provision against doubtful finances Opening balance - - Charge for the year 4,773,829 - Closing balance 4,773,829 -
8 Long term investments Investment in Bonds and Term Finance Certificates 8.1 162,976,000 279,992,000
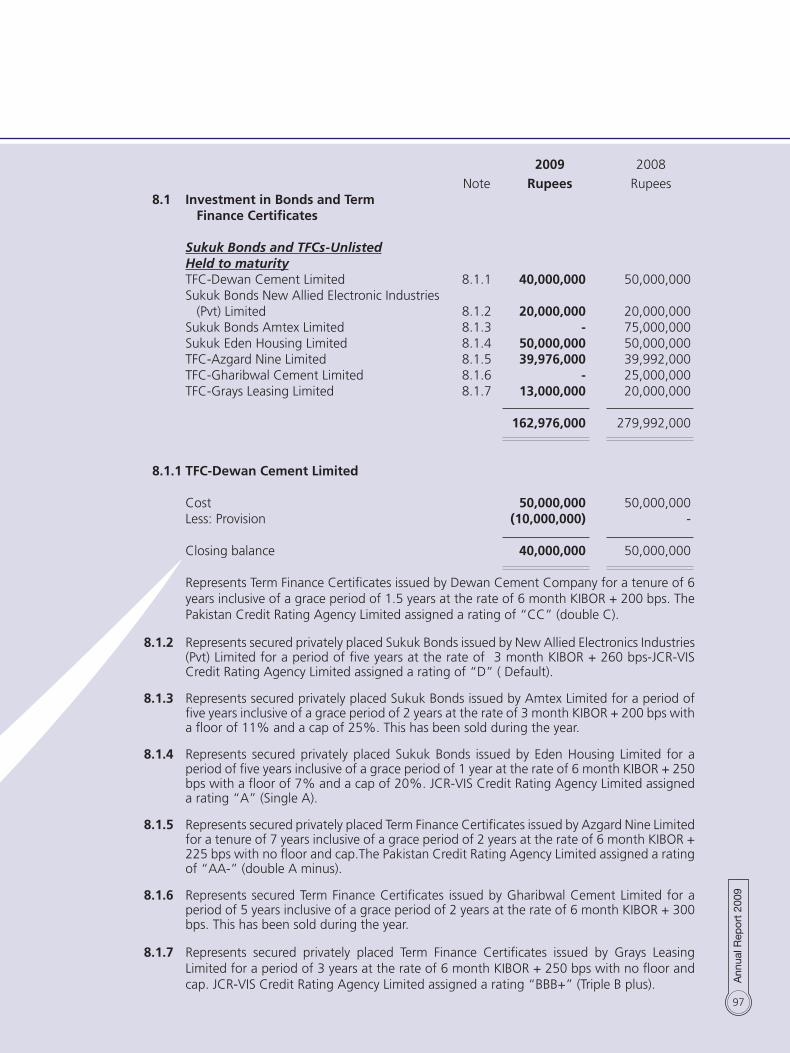
97
2009 2008
Note Rupees Rupees 8.1 Investment in Bonds and Term Finance Certificates SukukBondsandTFCs-Unlisted Heldtomaturity TFC-Dewan Cement Limited 8.1.1 40,000,000 50,000,000 Sukuk Bonds New Allied Electronic Industries (Pvt) Limited 8.1.2 20,000,000 20,000,000 Sukuk Bonds Amtex Limited 8.1.3 - 75,000,000 Sukuk Eden Housing Limited 8.1.4 50,000,000 50,000,000 TFC-Azgard Nine Limited 8.1.5 39,976,000 39,992,000 TFC-Gharibwal Cement Limited 8.1.6 - 25,000,000 TFC-Grays Leasing Limited 8.1.7 13,000,000 20,000,000 162,976,000 279,992,000 8.1.1 TFC-Dewan Cement Limited Cost 50,000,000 50,000,000 Less: Provision (10,000,000) - Closing balance 40,000,000 50,000,000 Represents Term Finance Certificates issued by Dewan Cement Company for a tenure of 6
years inclusive of a grace period of 1.5 years at the rate of 6 month KIBOR + 200 bps. The Pakistan Credit Rating Agency Limited assigned a rating of “CC” (double C).
8.1.2 Represents secured privately placed Sukuk Bonds issued by New Allied Electronics Industries (Pvt) Limited for a period of five years at the rate of 3 month KIBOR + 260 bps-JCR-VIS Credit Rating Agency Limited assigned a rating of “D” ( Default).
8.1.3 Represents secured privately placed Sukuk Bonds issued by Amtex Limited for a period of five years inclusive of a grace period of 2 years at the rate of 3 month KIBOR + 200 bps with a floor of 11% and a cap of 25%. This has been sold during the year.
8.1.4 Represents secured privately placed Sukuk Bonds issued by Eden Housing Limited for a period of five years inclusive of a grace period of 1 year at the rate of 6 month KIBOR + 250 bps with a floor of 7% and a cap of 20%. JCR-VIS Credit Rating Agency Limited assigned a rating “A” (Single A).
8.1.5 Represents secured privately placed Term Finance Certificates issued by Azgard Nine Limited for a tenure of 7 years inclusive of a grace period of 2 years at the rate of 6 month KIBOR + 225 bps with no floor and cap.The Pakistan Credit Rating Agency Limited assigned a rating of “AA-” (double A minus).
8.1.6 Represents secured Term Finance Certificates issued by Gharibwal Cement Limited for a period of 5 years inclusive of a grace period of 2 years at the rate of 6 month KIBOR + 300 bps. This has been sold during the year.
8.1.7 Represents secured privately placed Term Finance Certificates issued by Grays Leasing Limited for a period of 3 years at the rate of 6 month KIBOR + 250 bps with no floor and cap. JCR-VIS Credit Rating Agency Limited assigned a rating “BBB+” (Triple B plus).
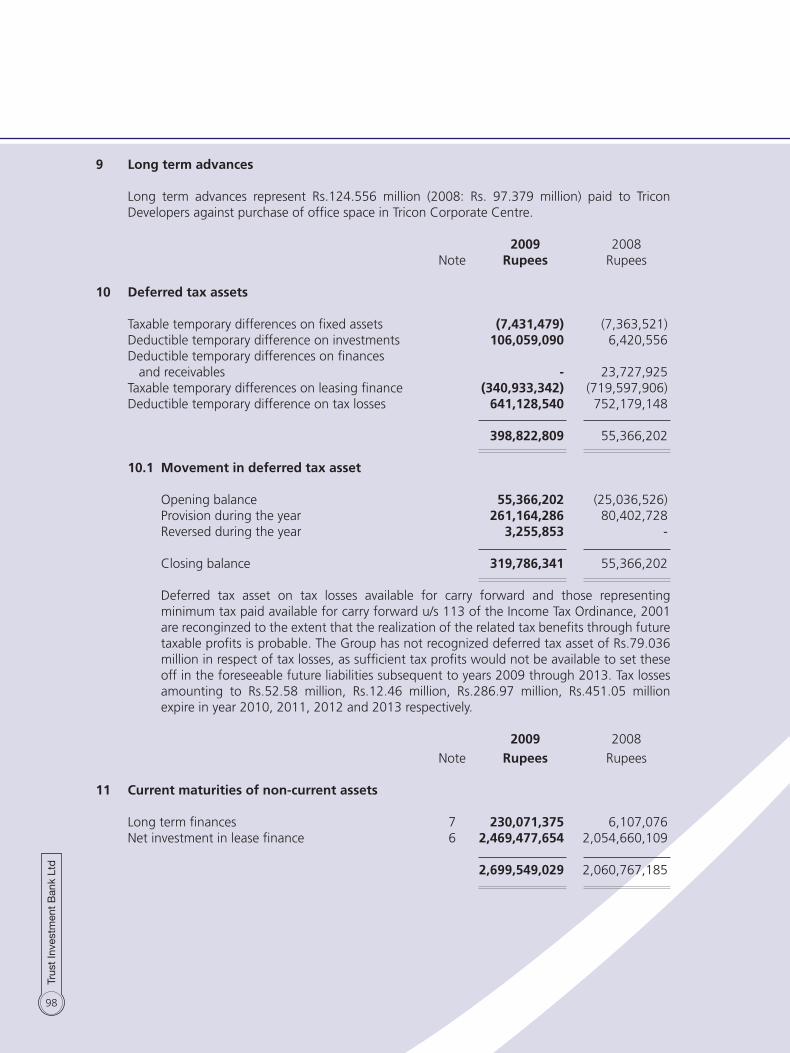
98
9 Long term advances Long term advances represent Rs.124.556 million (2008: Rs. 97.379 million) paid to Tricon
Developers against purchase of office space in Tricon Corporate Centre.
2009 2008 Note Rupees Rupees 10 Deferred tax assets Taxable temporary differences on fixed assets (7,431,479) (7,363,521) Deductible temporary difference on investments 106,059,090 6,420,556 Deductible temporary differences on finances and receivables - 23,727,925 Taxable temporary differences on leasing finance (340,933,342) (719,597,906) Deductible temporary difference on tax losses 641,128,540 752,179,148
398,822,809 55,366,202 10.1 Movement in deferred tax asset Opening balance 55,366,202 (25,036,526) Provision during the year 261,164,286 80,402,728 Reversed during the year 3,255,853 - Closing balance 319,786,341 55,366,202
Deferred tax asset on tax losses available for carry forward and those representing minimum tax paid available for carry forward u/s 113 of the Income Tax Ordinance, 2001 are reconginzed to the extent that the realization of the related tax benefits through future taxable profits is probable. The Group has not recognized deferred tax asset of Rs.79.036 million in respect of tax losses, as sufficient tax profits would not be available to set these off in the foreseeable future liabilities subsequent to years 2009 through 2013. Tax losses amounting to Rs.52.58 million, Rs.12.46 million, Rs.286.97 million, Rs.451.05 million expire in year 2010, 2011, 2012 and 2013 respectively.
2009 2008
Note Rupees Rupees 11 Current maturities of non-current assets Long term finances 7 230,071,375 6,107,076 Net investment in lease finance 6 2,469,477,654 2,054,660,109 2,699,549,029 2,060,767,185

99
2009 2008 Note Rupees Rupees12 Short term finances Employees - considered good 12.1 940,740 804,120 Others Secured - considered good 12.2 327,915,323 383,830,000
Secured - considered doubtful 2,366,634 650,000 Less: Provision against doubtful finance 12.3 993,327 650,000 1,373,307 - 330,229,370 384,634,120 12.1 These represent staff loans to employees against their retirement benefits. These carry
mark-up ranging from 13.00% to 18.64% (2008 : 11.99% to 13.65%) per annum.
12.2 These include short term finances provided to individuals against their certificates of investment and mortgage of property. These carry mark-up ranging from 14% to 22.48% (2008 : 12.53% to 20%) per annum.
2009 2008
Note Rupees Rupees 12.3 Movement in provision against doubtful finances Opening balance 650,000 650,000 Charge for the year 343,327 - Closing balance 993,327 650,000 13 Short term placements - considered good Secured Continuous funding system - 139,437,308 Securities purchased under reverse repurchase agreements 13.1 102,727,368 360,988,000 102,727,368 500,425,308
13.1 These represent short term funds placed under reverse repurchase agreements and carry an effective yield ranging from 14% to 25% (2008: 9.2% to 18.88%) on an average basis per annum.
Fair value of quoted securities held as collateral against lending on reverse repurchase
agreement: 2009 2008
Note Rupees Rupees Quoted Shares These have been placed for a period upto one year 148,166,089 559,282,482
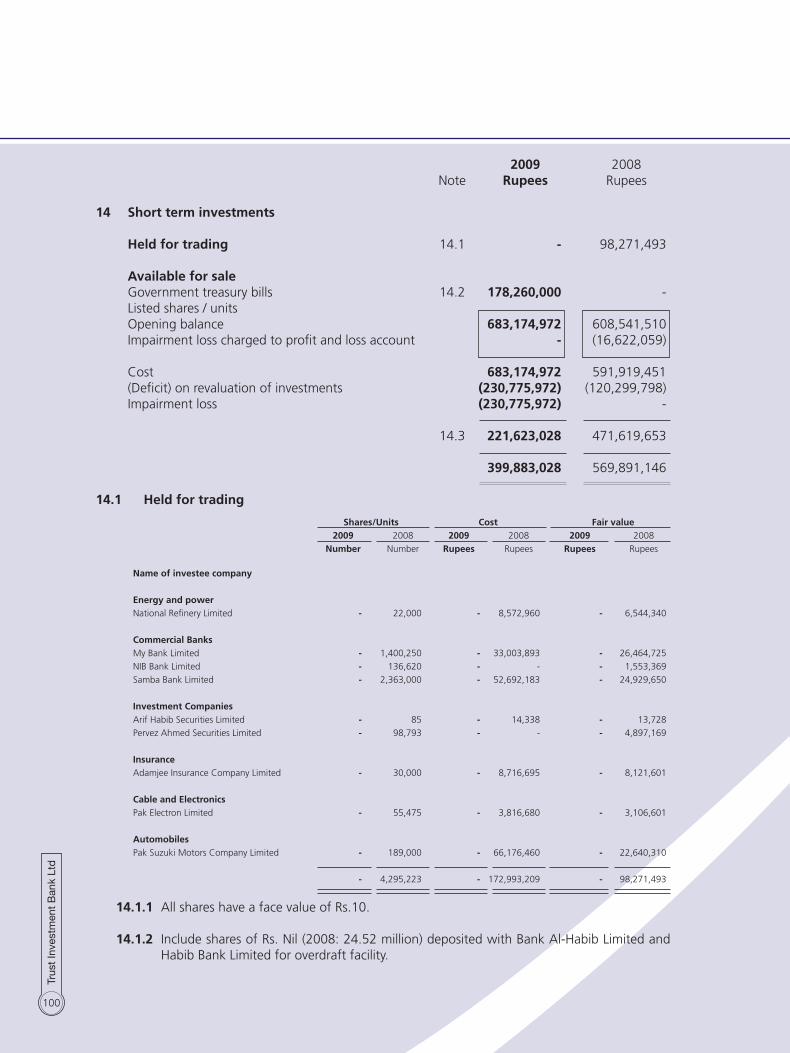
100
2009 2008 Note Rupees Rupees
14 Short term investments Held for trading 14.1 - 98,271,493 Available for sale Government treasury bills 14.2 178,260,000 - Listed shares / units Opening balance 683,174,972 608,541,510 Impairment loss charged to profit and loss account - (16,622,059)
Cost 683,174,972 591,919,451 (Deficit) on revaluation of investments (230,775,972) (120,299,798) Impairment loss (230,775,972) -
14.3 221,623,028 471,619,653 399,883,028 569,891,146
14.1 Held for trading
Shares/Units Cost Fair value 2009 2008 2009 2008 2009 2008
Number Number Rupees Rupees Rupees Rupees
Name of investee company
Energy and power
National Refinery Limited - 22,000 - 8,572,960 - 6,544,340
Commercial Banks
My Bank Limited - 1,400,250 - 33,003,893 - 26,464,725
NIB Bank Limited - 136,620 - - - 1,553,369
Samba Bank Limited - 2,363,000 - 52,692,183 - 24,929,650
Investment Companies
Arif Habib Securities Limited - 85 - 14,338 - 13,728
Pervez Ahmed Securities Limited - 98,793 - - - 4,897,169
Insurance
Adamjee Insurance Company Limited - 30,000 - 8,716,695 - 8,121,601
Cable and Electronics
Pak Electron Limited - 55,475 - 3,816,680 - 3,106,601
Automobiles
Pak Suzuki Motors Company Limited - 189,000 - 66,176,460 - 22,640,310
- 4,295,223 - 172,993,209 - 98,271,493
14.1.1 All shares have a face value of Rs.10. 14.1.2 Include shares of Rs. Nil (2008: 24.52 million) deposited with Bank Al-Habib Limited and
Habib Bank Limited for overdraft facility.

101
14.1.3 During the year investments classified as held for trading having cost of Rs. 172,993,209 and market value of Rs. 98,271,493 were transferred to investments - available for sale as allowed under BSD Circular no.10 of 2004.
14.2 These represents Government treasury bills of face value of Rs. 200 million purchased for Rs. 178,260 million (2008: Nil) at discount. These are secured against money market borrowing made from Pak Oman Investment Company Limited.
14.3 Available for sale
Shares/Units Cost Fair value 2009 2008 2009 2008 2009 2008
Number Number Rupees Rupees Rupees Rupees
Name of investee company
Fertilizer Engro Chemicals Pakistan Limited 348,740 249,100 86,665,143 84,613,604 44,788,678 69,949,771 Fauji Fertilizer Company Limited 2 - - - 174 - Energy and power Pakistan State Oil Limited 86,300 82,000 42,907,645 42,087,397 18,437,995 34,213,680 Attock Refinery Limited 158,400 147,000 39,583,538 44,081,667 19,766,736 36,732,360 Pakistan Refinery Limited 45,012 45,000 6,813,094 6,812,100 4,042,078 6,812,100 National Refinery Limited 22,000 - 6,544,386 - 4,840,440 - Commercial Banks MCB Bank Limited 220,097 200,000 85,813,733 85,803,207 34,121,638 65,276,000 Bank Islami Pakistan Limited 998,000 998,000 19,094,198 19,094,198 6,357,260 14,780,380 My Bank Limited 1,400,250 - 26,458,253 - 5,124,915 - NIB Bank Limited 68,620 - 780,209 - 325,945 - Samba Bank Limited 2,363,000 - 24,929,650 - 7,041,740 - Investment Companies Arif Habib Securities Limited 462,606 410,000 64,832,558 71,824,983 12,786,430 66,206,800 Pervez Ahmed Securities Limited 949,043 850,250 63,591,030 58,693,860 5,020,437 42,146,892 Jahangir Siddiqui Company Limited 402,532 110,000 83,083,964 81,825,798 9,334,717 58,316,500 Arif Habib Limited 110,000 88,000 26,666,912 26,666,912 7,357,900 21,735,120 PICIC Growth Fund 12 - - - 101 - Insurance Adamjee Insurance Company Limited 64,900 29,000 17,469,566 9,341,761 5,450,951 7,850,900 Cement D. G. Khan Cement Limited 336,000 280,000 19,919,200 18,799,200 9,962,400 18,799,200 Textile Nishat Mills Limited 335,000 335,000 42,274,764 42,274,764 12,669,700 28,799,950 Cable and Electronics Pak Electron Limited 55,475 - 3,106,600 - 1,359,692 - Automobiles Pak Suzuki Motors Company Limited 189,000 - 22,640,529 - 12,833,100 -
8,614,989 3,823,350 683,174,972 591,919,451 221,623,028 471,619,653
14.3.1 The Karachi Stock Exchange (Guarantee) Limited (“KSE”) placed a “Floor Mechanism” on the market value of securities based on the closing prices of securities prevailing as on 27 August 2008. Under the “Floor Mechanism“, the individual security price of equity securities could vary within normal circuit breaker limit, but not below the floor price level. The mechanism was effective from 28 August 2008 and remained in place until 15 December 2008. Consequent to the introduction of “Floor Mechanism” by KSE, the market volume declined significantly during the period from 27 August 2008 to 15 December 2008. There were lower floors on a number of securities at 31 December 2008.
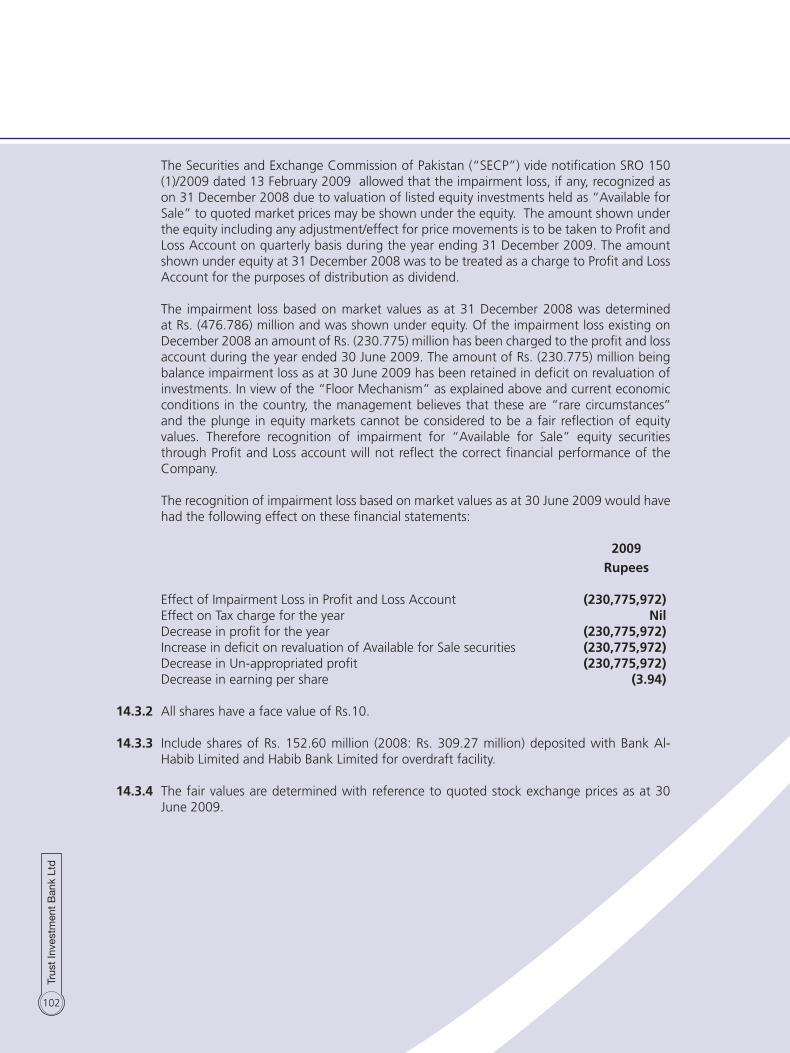
102
The Securities and Exchange Commission of Pakistan (“SECP”) vide notification SRO 150 (1)/2009 dated 13 February 2009 allowed that the impairment loss, if any, recognized as on 31 December 2008 due to valuation of listed equity investments held as “Available for Sale” to quoted market prices may be shown under the equity. The amount shown under the equity including any adjustment/effect for price movements is to be taken to Profit and Loss Account on quarterly basis during the year ending 31 December 2009. The amount shown under equity at 31 December 2008 was to be treated as a charge to Profit and Loss Account for the purposes of distribution as dividend.
The impairment loss based on market values as at 31 December 2008 was determined
at Rs. (476.786) million and was shown under equity. Of the impairment loss existing on December 2008 an amount of Rs. (230.775) million has been charged to the profit and loss account during the year ended 30 June 2009. The amount of Rs. (230.775) million being balance impairment loss as at 30 June 2009 has been retained in deficit on revaluation of investments. In view of the “Floor Mechanism” as explained above and current economic conditions in the country, the management believes that these are “rare circumstances’’ and the plunge in equity markets cannot be considered to be a fair reflection of equity values. Therefore recognition of impairment for “Available for Sale” equity securities through Profit and Loss account will not reflect the correct financial performance of the Company.
The recognition of impairment loss based on market values as at 30 June 2009 would have
had the following effect on these financial statements:
2009 Rupees Effect of Impairment Loss in Profit and Loss Account (230,775,972) Effect on Tax charge for the year Nil Decrease in profit for the year (230,775,972) Increase in deficit on revaluation of Available for Sale securities (230,775,972) Decrease in Un-appropriated profit (230,775,972) Decrease in earning per share (3.94) 14.3.2 All shares have a face value of Rs.10. 14.3.3 Include shares of Rs. 152.60 million (2008: Rs. 309.27 million) deposited with Bank Al-
Habib Limited and Habib Bank Limited for overdraft facility. 14.3.4 The fair values are determined with reference to quoted stock exchange prices as at 30
June 2009.
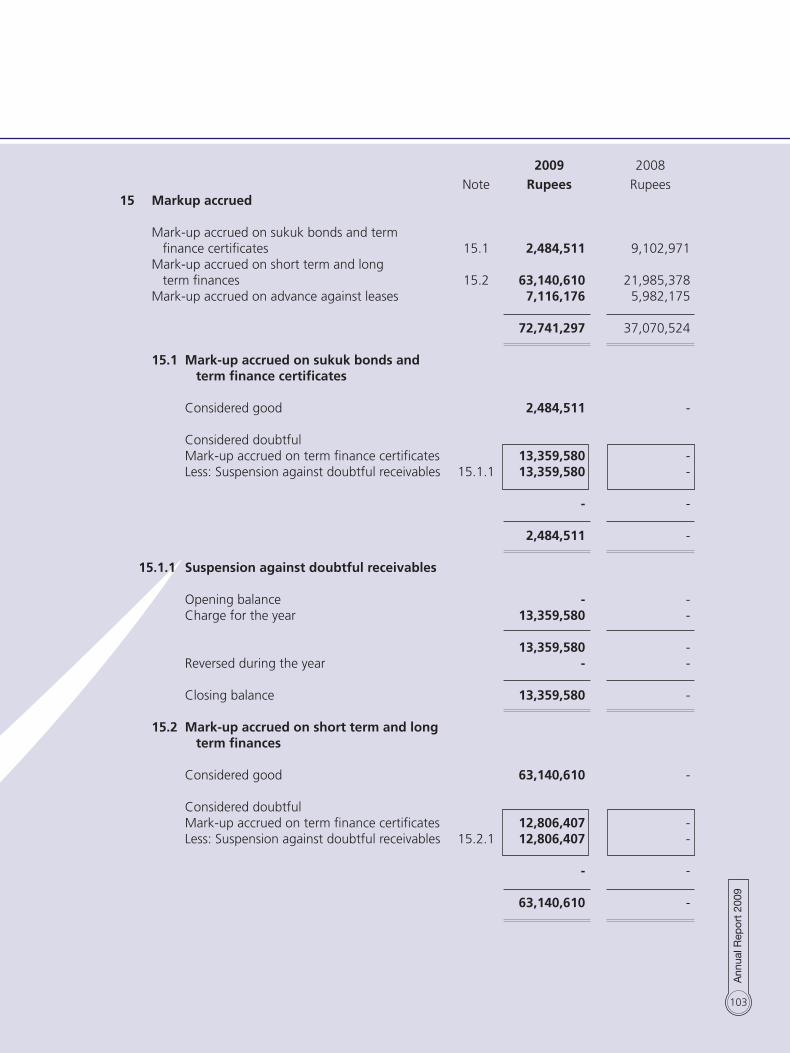
103
2009 2008
Note Rupees Rupees15 Markup accrued Mark-up accrued on sukuk bonds and term finance certificates 15.1 2,484,511 9,102,971 Mark-up accrued on short term and long term finances 15.2 63,140,610 21,985,378 Mark-up accrued on advance against leases 7,116,176 5,982,175
72,741,297 37,070,524 15.1 Mark-up accrued on sukuk bonds and term finance certificates Considered good 2,484,511 - Considered doubtful Mark-up accrued on term finance certificates 13,359,580 - Less: Suspension against doubtful receivables 15.1.1 13,359,580 - - -
2,484,511 - 15.1.1 Suspension against doubtful receivables Opening balance - - Charge for the year 13,359,580 - 13,359,580 - Reversed during the year - -
Closing balance 13,359,580 - 15.2 Mark-up accrued on short term and long term finances Considered good 63,140,610 - Considered doubtful Mark-up accrued on term finance certificates 12,806,407 - Less: Suspension against doubtful receivables 15.2.1 12,806,407 -
- -
63,140,610 -
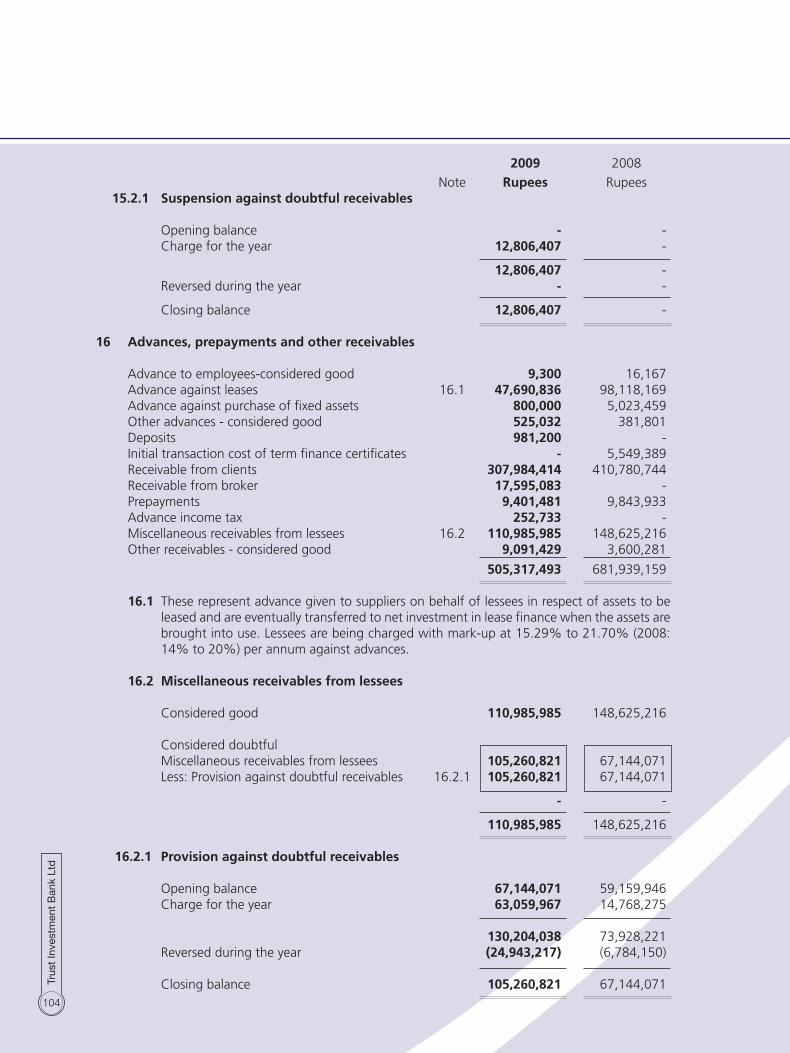
104
2009 2008
Note Rupees Rupees 15.2.1 Suspension against doubtful receivables Opening balance - - Charge for the year 12,806,407 - 12,806,407 - Reversed during the year - - Closing balance 12,806,407 - 16 Advances, prepayments and other receivables Advance to employees-considered good 9,300 16,167 Advance against leases 16.1 47,690,836 98,118,169 Advance against purchase of fixed assets 800,000 5,023,459 Other advances - considered good 525,032 381,801 Deposits 981,200 - Initial transaction cost of term finance certificates - 5,549,389 Receivable from clients 307,984,414 410,780,744 Receivable from broker 17,595,083 - Prepayments 9,401,481 9,843,933 Advance income tax 252,733 - Miscellaneous receivables from lessees 16.2 110,985,985 148,625,216 Other receivables - considered good 9,091,429 3,600,281
505,317,493 681,939,159 16.1 These represent advance given to suppliers on behalf of lessees in respect of assets to be
leased and are eventually transferred to net investment in lease finance when the assets are brought into use. Lessees are being charged with mark-up at 15.29% to 21.70% (2008: 14% to 20%) per annum against advances.
16.2 Miscellaneous receivables from lessees Considered good 110,985,985 148,625,216 Considered doubtful Miscellaneous receivables from lessees 105,260,821 67,144,071 Less: Provision against doubtful receivables 16.2.1 105,260,821 67,144,071 - - 110,985,985 148,625,216 16.2.1 Provision against doubtful receivables Opening balance 67,144,071 59,159,946 Charge for the year 63,059,967 14,768,275 130,204,038 73,928,221 Reversed during the year (24,943,217) (6,784,150)
Closing balance 105,260,821 67,144,071

105
2009 2008
Note Rupees Rupees17 Cash and bank balances Cash in hand 1,161,455 1,175,599 With banks in: Deposit accounts 17.1 125,693,024 232,202 Current accounts 33,677,267 91,880,971
159,370,291 92,113,173
160,531,746 93,288,772 17.1 Deposit accounts carry markup rate ranging from 4% to 12% per annum (2008: 4% to
7%).
2009 2008 2009 2008 Note No. of No. of Rupees Rupees shares shares18 SHARE CAPITAL
Authorized Ordinary shares of Rs. 10 each 80,000,000 80,000,000 800,000,000 800,000,000 Preference shares of Rs. 10 each 30,000,000 30,000,000 300,000,000 300,000,000 110,000,000 110,000,000 1,100,000,000 1,100,000,000 Issued, subscribed and paid up
Ordinary shares of Rs. 10 each fully paid-up in cash 20,142,984 20,142,984 201,429,840 201,429,840 Ordinary shares of Rs. 10 each issued as bonus shares 38,409,889 38,409,889 384,098,890 384,098,890 18.1 58,552,873 58,552,873 585,528,730 585,528,730
2009 2008 No. of Shares No. of Shares
18.1 Reconciliation of ordinary shares Opening balance of ordinary shares of Rs. 10 each 58,552,873 46,842,297 Bonus shares issued during the year (2008: Rs. NIL) - 11,710,576 Closing balance of ordinary shares of Rs. 10 each 58,552,873 58,552,873

106
2009 2008 Note Rupees Rupees19 Reserves Capital reserves Statutory reserve 19.1 206,758,319 206,758,318 Revenue reserves General reserve 61,000,000 61,000,000 Unappropriated profit (473,801,069) 242,321,570 (412,801,069) 303,321,570 (206,042,749) 510,079,888 19.1 Statutory reserve Opening balance 206,758,318 176,801,730 Transfer from profit and loss account - 29,956,588 206,758,318 206,758,318 This represents special reserve created at the rate of 20% of profit for the year after taxation
under rule 2 of part III of SECP’s NBFC’s Prudential Regulations. However, due to loss during the period, this rule is not applicable.
2009 2008
Note Rupees Rupees20 (Deficit) on revaluation of investments Opening balance (120,299,798) 6,594,532 impairment during the year (341,252,146) (120,299,798) Transfer to profit and loss account on sale of available for sale securities - (6,594,532) Impairment charged to profit and loss account 230,775,972 - Closing balance (230,775,972) (120,299,798) 21 Term Finance Certificates (TFC) - secured TFC II-1st Tranche 21.1 37,500,000 112,500,000 TFC II-2nd Tranche 21.2 112,500,000 187,500,000 TFC III 21.3 599,880,000 - 749,880,000 300,000,000 Less: Unamortized portion of the initial transaction cost 9,327,018 4,367,408 740,552,982 295,632,592 Less: Current maturity 26 187,590,000 150,000,000 552,962,982 145,632,592
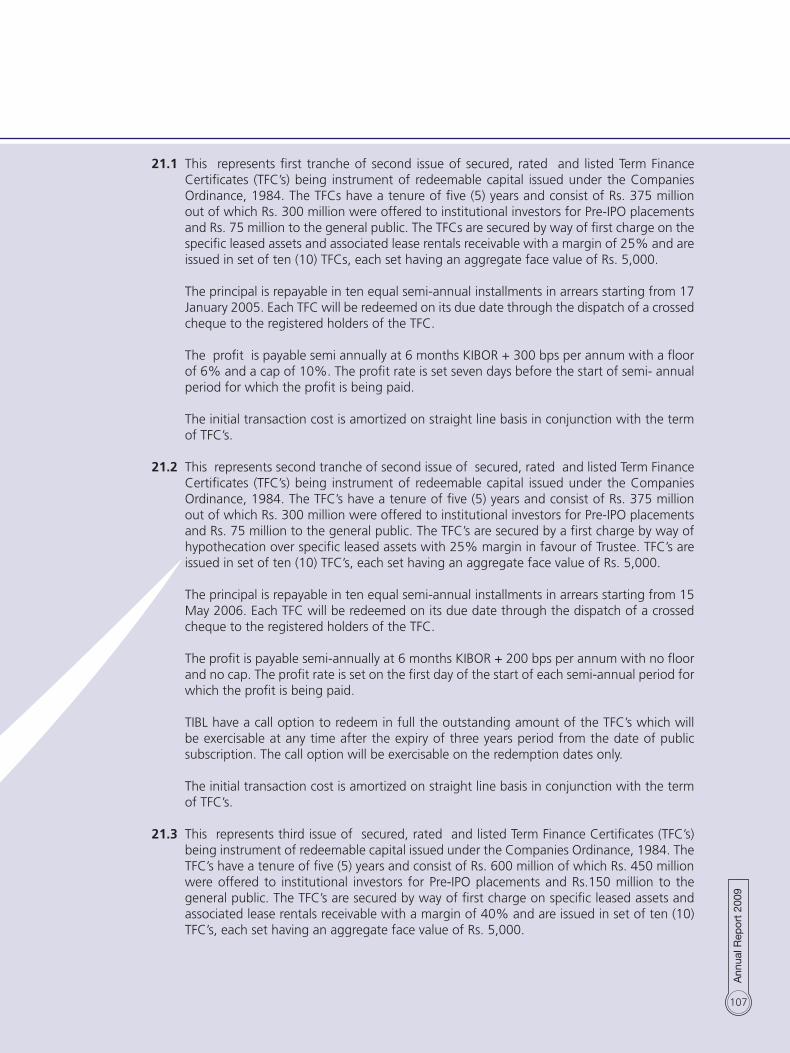
107
21.1 This represents first tranche of second issue of secured, rated and listed Term Finance Certificates (TFC’s) being instrument of redeemable capital issued under the Companies Ordinance, 1984. The TFCs have a tenure of five (5) years and consist of Rs. 375 million out of which Rs. 300 million were offered to institutional investors for Pre-IPO placements and Rs. 75 million to the general public. The TFCs are secured by way of first charge on the specific leased assets and associated lease rentals receivable with a margin of 25% and are issued in set of ten (10) TFCs, each set having an aggregate face value of Rs. 5,000.
The principal is repayable in ten equal semi-annual installments in arrears starting from 17 January 2005. Each TFC will be redeemed on its due date through the dispatch of a crossed cheque to the registered holders of the TFC.
The profit is payable semi annually at 6 months KIBOR + 300 bps per annum with a floor
of 6% and a cap of 10%. The profit rate is set seven days before the start of semi- annual period for which the profit is being paid.
The initial transaction cost is amortized on straight line basis in conjunction with the term
of TFC’s. 21.2 This represents second tranche of second issue of secured, rated and listed Term Finance
Certificates (TFC’s) being instrument of redeemable capital issued under the Companies Ordinance, 1984. The TFC’s have a tenure of five (5) years and consist of Rs. 375 million out of which Rs. 300 million were offered to institutional investors for Pre-IPO placements and Rs. 75 million to the general public. The TFC’s are secured by a first charge by way of hypothecation over specific leased assets with 25% margin in favour of Trustee. TFC’s are issued in set of ten (10) TFC’s, each set having an aggregate face value of Rs. 5,000.
The principal is repayable in ten equal semi-annual installments in arrears starting from 15 May 2006. Each TFC will be redeemed on its due date through the dispatch of a crossed cheque to the registered holders of the TFC.
The profit is payable semi-annually at 6 months KIBOR + 200 bps per annum with no floor
and no cap. The profit rate is set on the first day of the start of each semi-annual period for which the profit is being paid.
TIBL have a call option to redeem in full the outstanding amount of the TFC’s which will
be exercisable at any time after the expiry of three years period from the date of public subscription. The call option will be exercisable on the redemption dates only. The initial transaction cost is amortized on straight line basis in conjunction with the term of TFC’s.
21.3 This represents third issue of secured, rated and listed Term Finance Certificates (TFC’s)
being instrument of redeemable capital issued under the Companies Ordinance, 1984. The TFC’s have a tenure of five (5) years and consist of Rs. 600 million of which Rs. 450 million were offered to institutional investors for Pre-IPO placements and Rs.150 million to the general public. The TFC’s are secured by way of first charge on specific leased assets and associated lease rentals receivable with a margin of 40% and are issued in set of ten (10) TFC’s, each set having an aggregate face value of Rs. 5,000.

108
The instrument is structured to redeem 0.02% of the principal in two semi-annual installments and the remaining principal in eight semi-annual installments of 12.495% each of the issue amount respectively starting from the 18th month. Each TFC will be redeemed on its due date through the dispatch of a crossed cheque to the registered holders of the TFC.
The profit is payable semi annually at 6 months KIBOR + 185 bps per annum with no floor
and no cap. The profit rate is set one day before the start of semi- annual period for which the profit is being paid.
TIBL have a call option to redeem in full the outstanding amount of the TFC’s which will
be exercisable at any time after the expiry of two years period from the issue date. The call option will be exercisable on the redemption dates only.
The initial transaction cost is amortized on straight line basis in conjunction with the term
of TFC’s. 2009 2008
Note Rupees Rupees
22 Long term certificates of investment - unsecured Local currency - Financial institutions 308,333,333 858,333,333 - Corporates 14,000,340 13,642,940 - Individuals 12,275,000 124,180,955 22.1 334,608,673 996,157,228 Less: Current maturity 26 101,800,000 895,403,258
232,808,673 100,753,970 22.1 These represent deposits received by the TIBL as per permission granted by the Securities
and Exchange Commission of Pakistan. These certificates are issued for term ranging from over 1 year to 6 years at rates of profit ranging from 11% to 22.22% (2008: 10% to 14%) per annum.

109
2009 2008
Note Rupees Rupees23 Long term borrowings - secured Banking companies and other financial institutions: The Bank of Punjab Limited 23.1 37,499,996 79,166,666 Faysal Bank Limited 23.2 58,333,334 83,333,333 Allied Bank Limited 23.3 224,722,222 50,000,000 Habib Bank Limited 23.4 41,666,669 66,666,668 Pak Oman Investment Company (Pvt.) Ltd. 23.5 23,000,000 - Syndicated Term Finance 23.6 - 20,940,432 The Bank of Khyber 23.7 150,000,000 - Saudipak Industrial & Agricultural Investment Company (Pvt.) Limited. 23.8 12,499,997 33,333,328 Standard Chartered Bank Limited 23.9 291,666,665 454,888,888 Pak Oman Assets Management Company Ltd 23.10 42,714,286 - Atlas Bank Limited 23.11 150,000,000 200,000,000 Pak Iran Joint Investment Co. Limited 23.12 92,000,000 - 1,124,103,169 988,329,315 Less: Current portion shown under current liabilities 26 578,567,458 386,848,127
545,535,711 601,481,188 23.1 This represents a facility of Rs.100 million. This facility is secured against first charge on
specific leased assets and related receivables. These carry mark-up rate of 3 month KIBOR + 250 bps per annum with a floor of 4.5%. This facility is repayable in sixteen equal quarterly installments starting from 30 March 2007 and expiring on 31 December 2010.
23.2 This represents a facility of Rs.100 million. The facilities are secured against first charge on specific leased assets with 25% margin and carry mark-up rate of 6 month KIBOR + 190 bps per annum. These facilities are repayable in twelve equal quarterly installments starting from 29 October 2007 and expiring on 31 July 2010.
23.3 These represent two facilities of an aggregate amount of Rs. 300 million. One facility of
Rs.100 million is secured against first charge on specific leased assets and related receivables of Rs. 135 million with 25% margin. Whereas the money market borrowing amount to Rs. 200 million is converted into long term unsecured facility at a mutually agreed terms. These carries mark-up at the rates of 6 month KIBOR + 250 bps per annum and 1 month KIBOR + 200 bps per annum respectively. These facilities are repayable in ten equal semi-annual and thirty six equal monthly installments starting from 30 June 2006 and 01 June 2009 respectively and expiring on 31 December 2010 and 01 May 2012.
23.4 This represents a facility of Rs. 100 million. The facility is secured against first charge on
specific leased assets and related receivables and carry mark-up at the rate of 6 month KIBOR + 250 bps per annum with no floor and no cap. The facility is repayable in twelve equal quarterly installments starting from 30 September 2007 and expiring on 30 June 2010.
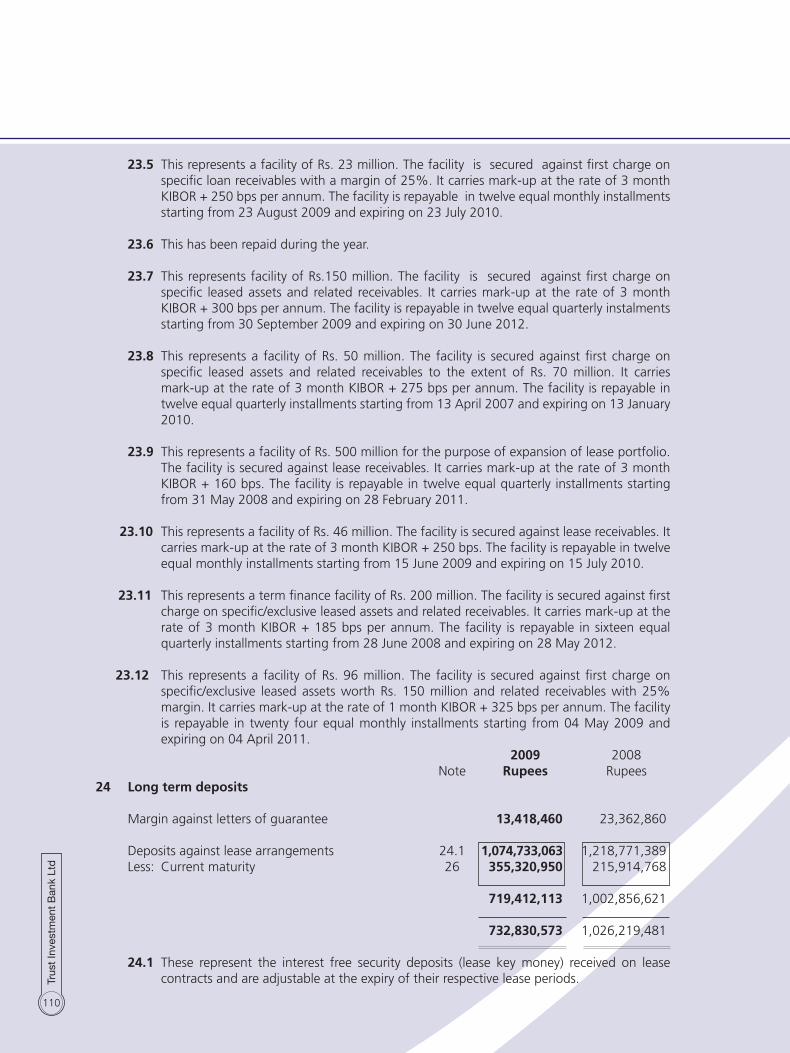
110
23.5 This represents a facility of Rs. 23 million. The facility is secured against first charge on specific loan receivables with a margin of 25%. It carries mark-up at the rate of 3 month KIBOR + 250 bps per annum. The facility is repayable in twelve equal monthly installments starting from 23 August 2009 and expiring on 23 July 2010.
23.6 This has been repaid during the year. 23.7 This represents facility of Rs.150 million. The facility is secured against first charge on
specific leased assets and related receivables. It carries mark-up at the rate of 3 month KIBOR + 300 bps per annum. The facility is repayable in twelve equal quarterly instalments starting from 30 September 2009 and expiring on 30 June 2012.
23.8 This represents a facility of Rs. 50 million. The facility is secured against first charge on
specific leased assets and related receivables to the extent of Rs. 70 million. It carries mark-up at the rate of 3 month KIBOR + 275 bps per annum. The facility is repayable in twelve equal quarterly installments starting from 13 April 2007 and expiring on 13 January 2010.
23.9 This represents a facility of Rs. 500 million for the purpose of expansion of lease portfolio.
The facility is secured against lease receivables. It carries mark-up at the rate of 3 month KIBOR + 160 bps. The facility is repayable in twelve equal quarterly installments starting from 31 May 2008 and expiring on 28 February 2011.
23.10 This represents a facility of Rs. 46 million. The facility is secured against lease receivables. It
carries mark-up at the rate of 3 month KIBOR + 250 bps. The facility is repayable in twelve equal monthly installments starting from 15 June 2009 and expiring on 15 July 2010.
23.11 This represents a term finance facility of Rs. 200 million. The facility is secured against first charge on specific/exclusive leased assets and related receivables. It carries mark-up at the rate of 3 month KIBOR + 185 bps per annum. The facility is repayable in sixteen equal quarterly installments starting from 28 June 2008 and expiring on 28 May 2012.
23.12 This represents a facility of Rs. 96 million. The facility is secured against first charge on specific/exclusive leased assets worth Rs. 150 million and related receivables with 25% margin. It carries mark-up at the rate of 1 month KIBOR + 325 bps per annum. The facility is repayable in twenty four equal monthly installments starting from 04 May 2009 and expiring on 04 April 2011.
2009 2008 Note Rupees Rupees24 Long term deposits Margin against letters of guarantee 13,418,460 23,362,860 Deposits against lease arrangements 24.1 1,074,733,063 1,218,771,389 Less: Current maturity 26 355,320,950 215,914,768 719,412,113 1,002,856,621 732,830,573 1,026,219,481 24.1 These represent the interest free security deposits (lease key money) received on lease
contracts and are adjustable at the expiry of their respective lease periods.
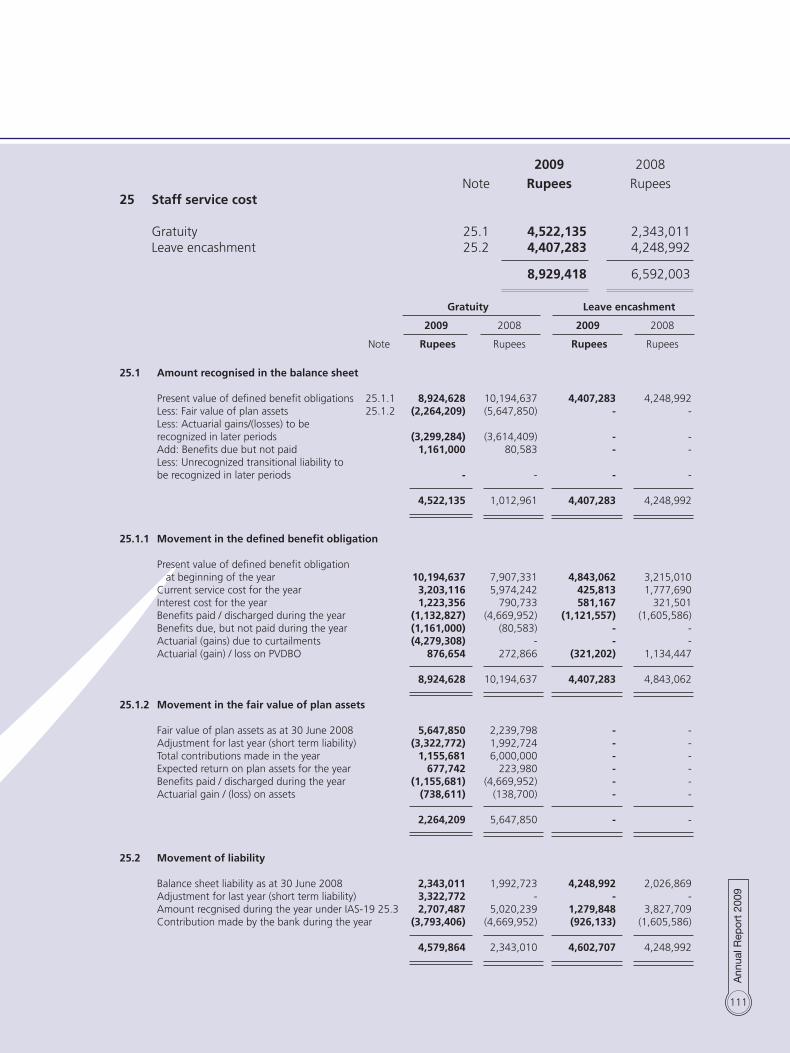
111
2009 2008
Note Rupees Rupees25 Staff service cost Gratuity 25.1 4,522,135 2,343,011 Leave encashment 25.2 4,407,283 4,248,992 8,929,418 6,592,003
Gratuity Leave encashment
2009 2008 2009 2008
Note Rupees Rupees Rupees Rupees
25.1 Amount recognised in the balance sheet Present value of defined benefit obligations 25.1.1 8,924,628 10,194,637 4,407,283 4,248,992 Less: Fair value of plan assets 25.1.2 (2,264,209) (5,647,850) - - Less: Actuarial gains/(losses) to be recognized in later periods (3,299,284) (3,614,409) - - Add: Benefits due but not paid 1,161,000 80,583 - - Less: Unrecognized transitional liability to be recognized in later periods - - - - 4,522,135 1,012,961 4,407,283 4,248,992 25.1.1 Movement in the defined benefit obligation Present value of defined benefit obligation at beginning of the year 10,194,637 7,907,331 4,843,062 3,215,010 Current service cost for the year 3,203,116 5,974,242 425,813 1,777,690 Interest cost for the year 1,223,356 790,733 581,167 321,501 Benefits paid / discharged during the year (1,132,827) (4,669,952) (1,121,557) (1,605,586) Benefits due, but not paid during the year (1,161,000) (80,583) - - Actuarial (gains) due to curtailments (4,279,308) - - - Actuarial (gain) / loss on PVDBO 876,654 272,866 (321,202) 1,134,447 8,924,628 10,194,637 4,407,283 4,843,062 25.1.2 Movement in the fair value of plan assets Fair value of plan assets as at 30 June 2008 5,647,850 2,239,798 - - Adjustment for last year (short term liability) (3,322,772) 1,992,724 - - Total contributions made in the year 1,155,681 6,000,000 - - Expected return on plan assets for the year 677,742 223,980 - - Benefits paid / discharged during the year (1,155,681) (4,669,952) - - Actuarial gain / (loss) on assets (738,611) (138,700) - - 2,264,209 5,647,850 - - 25.2 Movement of liability Balance sheet liability as at 30 June 2008 2,343,011 1,992,723 4,248,992 2,026,869 Adjustment for last year (short term liability) 3,322,772 - - - Amount recgnised during the year under IAS-19 25.3 2,707,487 5,020,239 1,279,848 3,827,709 Contribution made by the bank during the year (3,793,406) (4,669,952) (926,133) (1,605,586)
4,579,864 2,343,010 4,602,707 4,248,992

112
Gratuity Leave encashment
2009 2008 2009 2008
Note Rupees Rupees Rupees Rupees
25.3 Gratuity scheme expense recognised in the profit & loss account: Current service cost 4,510,791 5,974,242 425,813 1,777,690 Interest cost 1,223,356 790,733 581,167 321,501 Expected return on plan assets (677,742) (223,980) - - Actuarial (Gains) / losses charge 185,353 185,547 (321,202) 1,134,447 Loss charged due to change in benefits 1,745,037 - - - (Gains) charged due to change in benefits (i.e. Curtailments) (4,279,308) 286,421 594,070 594,071 2,707,487 7,012,963 1,279,848 3,827,709 25.4 Actual return on the plan assets Expected return on the plan assets 677,742 223,980 - - Actuarial gain/(loss) on plan assets (738,611) (138,700) - -
Actual return on the plan assets (60,869) 85,280 - -
25.5 Qualified actuary carried out the valuation as on 30 June 2009 using the Projected Unit Credit Method. Following significant assumptions were used.
Gratuity Leave encashment
2009 2008 2009 2008
Discount rate 12% per annum 12% per annum 12% per annum 12% per annum Expected rate of increase in salary 11% per annum 11% per annum 11% per annum 11% per annum Expected rate of return on plan assets 12% per annum 12% per annum - - Average number of leaves utilised per annum - - 8 Days 8 Days Expected average remaining years until vesting as on 30 June 14 years 14 years - -
25.6 The present value of defined benefit obligation, the fair value of plan assets and the surplus or deficit of gratuity fund is as follows:
2009 2008 2007 2006 2005 Rupees Rupees Rupees Rupees Rupees As at 30 June Present value of defined obligation 8,924,628 10,194,637 7,907,331 17,912,230 6,506,811 Fair value of plan assets 2,264,209 5,647,850 5,647,850 2,239,798 1,923,197 Deficit (6,660,419) (4,546,787) (2,259,481) (15,672,432) (4,583,614)
Fair value of plan assets include certificates of investments, whose fair value as at 30 June 2009 is Rs. 2.265 million (2008:
Rs. 5.647 million).

113
2009 2008 Note Rupees Rupees26 Current maturities of long term liabilities Term finance certificates - secured 21 187,590,000 150,000,000 Certificates of investment - unsecured 22 101,800,000 895,403,258 Long term borrowings - secured 23 578,567,458 386,848,127 Long term deposits 24 355,320,950 215,914,768 Pre - IPO Subscription of Term Finance Certificates - 90,000 1,223,278,408 1,648,256,153 27 Short term certificates of investment - unsecured Local currency - Financial institutions 11,300,000 750,000,000 - Corporate 608,326,538 240,962,953 - Individuals 407,659,801 51,219,038 1,027,286,339 1,042,181,991 27.1 These represent unsecured short term certificates of investment for a period of three
months to one year. These carry mark-up rate ranging from 11% to 18.50% (2008: 8.25% to 18%) per annum.
2009 2008 Note Rupees Rupees28 Short term borrowings Banking companies and other financial institutions: Running finances - secured 28.1 321,693,339 332,216,672 Placements from financial institutions - unsecured 28.2 1,504,790,413 1,579,185,500 1,826,483,752 1,911,402,172
28.1 These represent running finances utilized from commercial banks. The total limits against running finances amount to Rs. 425.00 million (2008: Rs. 455 million). These carry mark-up rate ranging from 3 month KIBOR + 100 bps to 3 month KIBOR + 300 bps with a floor ranging from 4.5% to 10% (2008: 3 months KIBOR + 100 bps to 3 month KIBOR + 250 bps) per annum payable on quarterly basis respectively.
The above facilities have been obtained for a period of one year and are secured against promissory
notes, first charge on specific leased assets, related receivables, and pledge of shares.
2009 2008 Rupees Rupees Carrying amount of quoted shares given as collateral against borrowings 152,603,119 333,800,683 28.2 These represent unsecured short term placements of one day to four months obtained from
financial institutions carrying mark-up rate ranging from 7% to 45% (2008: 6.25% to 26%).

114
2009 2008 Note Rupees Rupees29 Mark-up accrued Secured - Short and long term borrowings 48,893,504 49,020,712 - Term finance certificates 55,149,729 15,475,668 104,043,233 64,496,380 Unsecured - Certificates of investment 33,062,182 28,735,462 137,105,415 93,231,842 30 Trade and other payables Payable to National Clearing Company of Pakistan Limited - 377,328 Customer’s credit balances 6,014,829 47,689,653 Payable to broker 57,674,599 - Advance receipt against leases 30.1 9,101,194 20,206,853 Unclaimed dividend 3,136,308 3,221,681 Accrued liabilities 3,637,058 2,485,230 Withholding tax payable 478,987 - Other liabilities 15,797,572 7,170,817 95,840,547 81,151,562 30.1 These represent initial security deposit received from lessees before the structuring of
leases. 31 Contingencies and commitments 31.1 Contingencies 31.1.1 TIBL has issued guarantees to various parties on behalf of clients amounting to Rs. 208.291
Million. (2008: Rs. 182.342 million) 31.2 Commitments 31.2.1 Lease commitments approved but not disbursed as on balance sheet date amount to Nil
(2008 : Rs. 123.142 million). 31.2.2 Commitment for the purchase of office space amounting to Rs. 2.45 million (2008: Rs.
29.63 million).
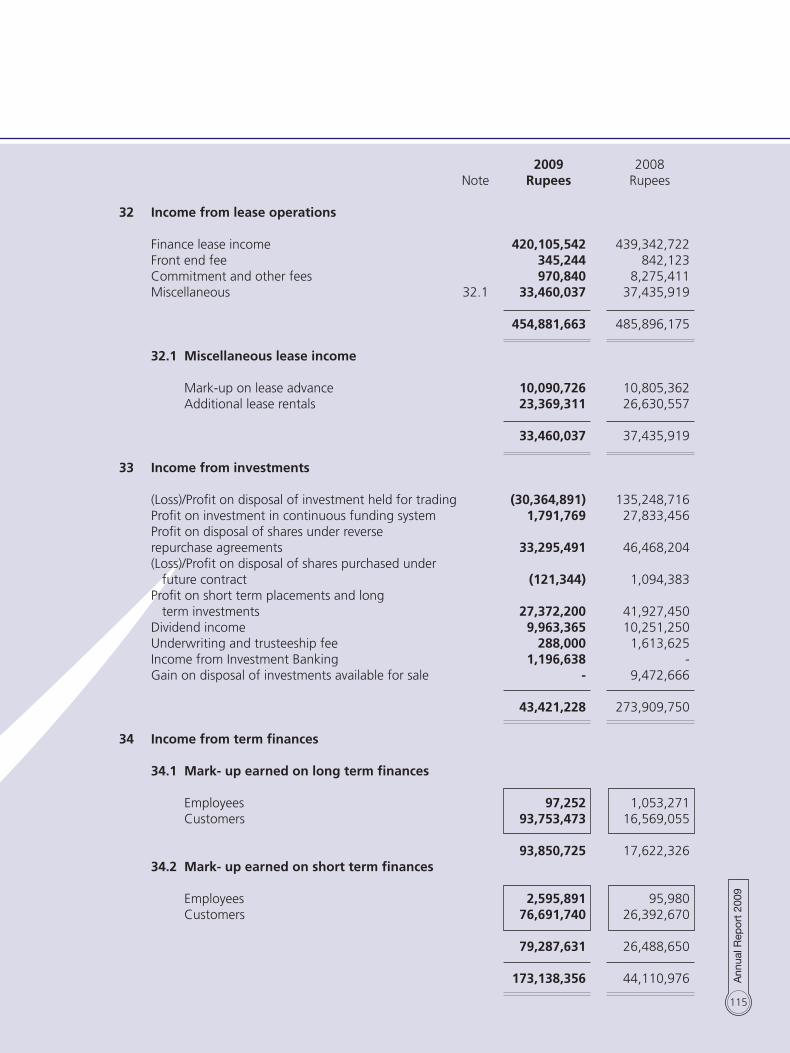
115
2009 2008 Note Rupees Rupees
32 Income from lease operations Finance lease income 420,105,542 439,342,722 Front end fee 345,244 842,123 Commitment and other fees 970,840 8,275,411 Miscellaneous 32.1 33,460,037 37,435,919
454,881,663 485,896,175 32.1 Miscellaneous lease income Mark-up on lease advance 10,090,726 10,805,362 Additional lease rentals 23,369,311 26,630,557 33,460,037 37,435,919 33 Income from investments (Loss)/Profit on disposal of investment held for trading (30,364,891) 135,248,716 Profit on investment in continuous funding system 1,791,769 27,833,456 Profit on disposal of shares under reverse repurchase agreements 33,295,491 46,468,204 (Loss)/Profit on disposal of shares purchased under future contract (121,344) 1,094,383 Profit on short term placements and long term investments 27,372,200 41,927,450 Dividend income 9,963,365 10,251,250 Underwriting and trusteeship fee 288,000 1,613,625 Income from Investment Banking 1,196,638 - Gain on disposal of investments available for sale - 9,472,666 43,421,228 273,909,750 34 Income from term finances 34.1 Mark- up earned on long term finances Employees 97,252 1,053,271 Customers 93,753,473 16,569,055 93,850,725 17,622,326 34.2 Mark- up earned on short term finances Employees 2,595,891 95,980 Customers 76,691,740 26,392,670 79,287,631 26,488,650 173,138,356 44,110,976

116
2009 2008 Note Rupees Rupees35 Other income Gain on disposal of operating fixed assets 5.1.1 1,642,627 22,448,499 Commission income 2,486,063 2,462,351 Profits on bank deposits 4,488,779 141 Miscellaneous 6,895,872 65,927,650
15,513,341 90,838,641 36 Finance cost Mark-up on long term borrowings 131,188,307 87,925,764 Mark-up on term finance certificates 135,692,917 104,343,216 Mark-up on short term borrowings 342,756,886 118,927,462 Mark-up on certificates of investment 202,959,142 210,140,148 Mark-up on running finance 64,734,441 8,556,271 Commitment and other processing fee 2,270,103 2,686,995 Bank charges and commission 6,335,954 5,893,085 885,937,750 538,472,941 37 Administrative and operating expenses Salaries and other benefits 37.1 115,716,347 103,312,972 Printing and stationery 2,554,324 3,890,737 Vehicle running and maintenance 8,519,832 8,674,886 Postage, telephone and telex 7,046,966 7,349,169 Traveling and conveyance 3,578,514 3,448,512 Boarding and lodging 427,949 686,729 Entertainment 1,889,391 2,102,391 Advertisement 782,802 697,081 Electricity, gas and water 4,493,412 3,734,036 Newspapers and periodicals 160,665 159,795 Auditors’ remuneration 37.2 970,000 558,850 Fee and subscription 1,508,030 1,436,301 Corporate expenses 1,165,290 1,355,296 Staff service costs 3,987,335 8,817,108 Software - 117,410 Rent, rates and taxes 25,415,760 24,734,932 Insurance 4,565,502 3,785,547 Donation 37.3 272,220 - Office maintenance 5,294,523 3,239,529 Legal and professional charges 2,780,316 4,307,851 Impairment of tangible and intangible assets 1,234,163 - Receivable from customer written off 128,046,759 - Security charges 2,271,758 2,244,770 Staff training 90,600 136,827 Business promotion 8,000 - Commission on recovery-outsource 1,605,206 3,410,988 CDC and clearing charges 1,752,428 3,278,866 Miscellaneous 2,780,853 2,175,433
328,918,945 193,656,016

117
37.1 It includes provision for gratuity and compensated leave absences amounting to Rs.2.933 million and Rs.1.054 million respectively (2008: Rs. 5.020 million and Rs. 3.828 million respectively).
2009 2008
Note Rupees Rupees 37.2 Auditors’ remuneration Audit fee Annual 750,000 350,000 Half Yearly Review 100,000 80,000 Certifications fee and other services - 70,000 Out of pocket expenses 60,000 58,850 970,000 558,850 37.3 Donations include payment of Rs. 272,220 (2008: Nil) to Prime Minister’s Fund for Internally
Displaced Persons (IDP’s).
38 Other charges Lease receivables written off 4,218,967 1,020,487 Penalties imposed by the Lahore Stock Exchange - 10,000 4,218,967 1,030,487 39 Provision for taxation For the year - Current (125,744) 2,904,711 - Deferred 39.1 261,164,286 (86,563,292)
261,038,542 (83,658,581) 39.1 Deferred tax asset comprises of deductible temporary differences amounting to Rs. 2,056.89
million and taxable temporary differences amounting to Rs. 912.44 million.
2009 200840 (Loss)/Earnings per share - basic (Loss)/Profit for the year after taxation Rupees (716,470,026) 149,782,942 Weighted average number of ordinary shares Numbers 58,552,872 58,552,873 (Loss)/Earnings per share Rupees (12.24) 2.56
40.1 No figure for diluted (loss)/earnings per share has been presented as the Group has not issued any instrument which would have an impact on its earnings per share.
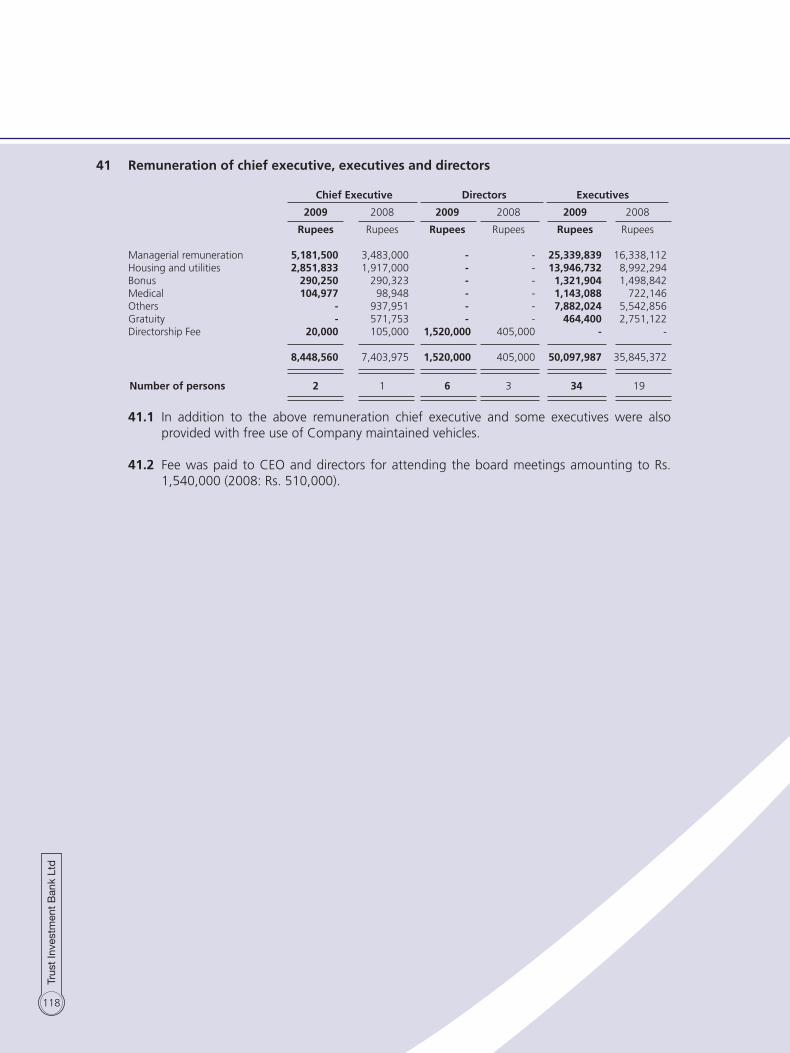
118
41 Remuneration of chief executive, executives and directors
Chief Executive Directors Executives
2009 2008 2009 2008 2009 2008
Rupees Rupees Rupees Rupees Rupees Rupees Managerial remuneration 5,181,500 3,483,000 - - 25,339,839 16,338,112 Housing and utilities 2,851,833 1,917,000 - - 13,946,732 8,992,294 Bonus 290,250 290,323 - - 1,321,904 1,498,842 Medical 104,977 98,948 - - 1,143,088 722,146 Others - 937,951 - - 7,882,024 5,542,856 Gratuity - 571,753 - - 464,400 2,751,122 Directorship Fee 20,000 105,000 1,520,000 405,000 - - 8,448,560 7,403,975 1,520,000 405,000 50,097,987 35,845,372
Number of persons 2 1 6 3 34 19
41.1 In addition to the above remuneration chief executive and some executives were also
provided with free use of Company maintained vehicles.
41.2 Fee was paid to CEO and directors for attending the board meetings amounting to Rs. 1,540,000 (2008: Rs. 510,000).
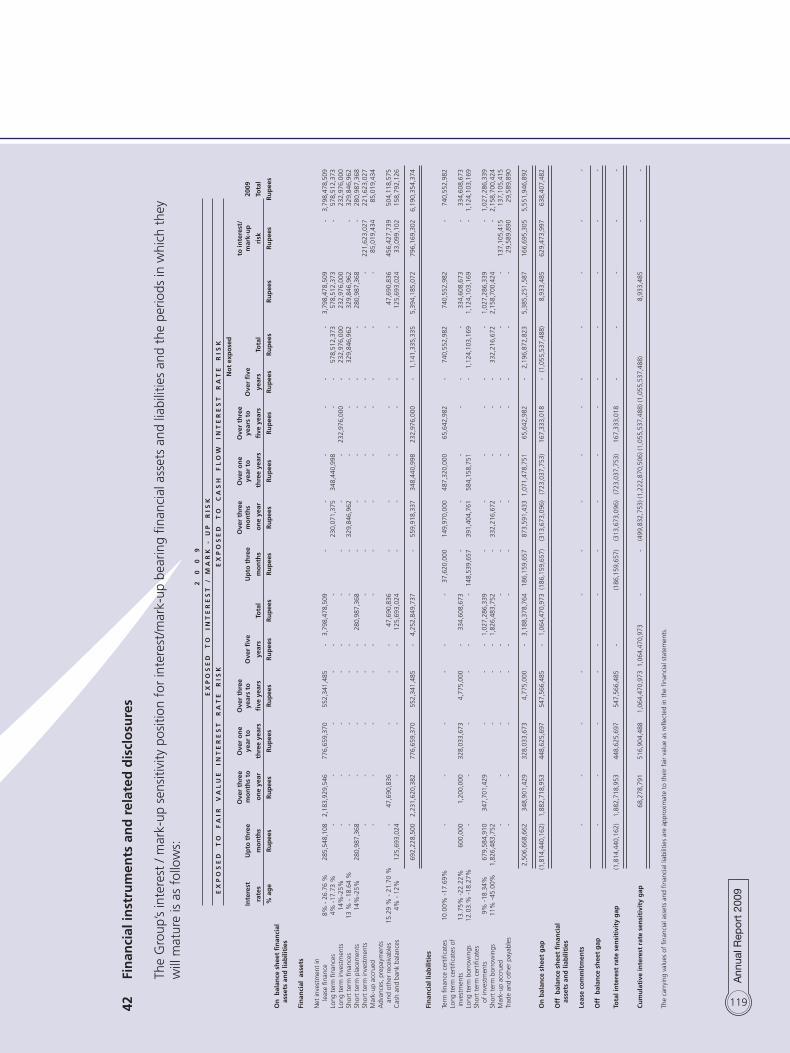
119
2
0
0
9
E
x P
O S
E D
T
O
I N
T E
R E
S T
/
M A
R K
-
U P
R
I S
K
E
x P
O S
E D
T
O
F A
I R
v
A L
U E
I
N T
E R
E S
T
R A
T E
R
I S
K
E x
P O
S E
D
T O
C
A S
H
F L
O W
I
N T
E R
E S
T
R A
T E
R
I S
K
N
ot
exp
ose
d
O
ver
thre
e O
ver
on
e O
ver
thre
e
O
ver
thre
e O
ver
on
e O
ver
thre
e
to
inte
rest
/
Inte
rest
U
pto
th
ree
mo
nth
s to
ye
ar t
o
year
s to
O
ver
five
Up
to t
hre
e m
on
ths
year
to
ye
ars
to
Ove
r fi
ve
mar
k-u
p
2009
ra
tes
mo
nth
s o
ne
year
th
ree
year
s fi
ve y
ears
ye
ars
Tota
l m
on
ths
on
e ye
ar
th
ree
year
s fi
ve y
ears
ye
ars
Tota
l
risk
To
tal
%
ag
e R
up
ees
Ru
pee
s R
up
ees
Ru
pee
s R
up
ees
Ru
pee
s R
up
ees
Ru
pee
s R
up
ees
Ru
pee
s R
up
ees
Ru
pee
s R
up
ees
Ru
pee
s R
up
ees
On
bal
ance
sh
eet
fin
anci
al
asse
ts a
nd
liab
iliti
es
Fi
nan
cial
ass
ets
N
et in
vest
men
t in
le
ase
finan
ce
8% -
26.
76 %
2
85,5
48,1
08
2,1
83,9
29,5
46
776
,659
,370
5
52,3
41,4
85
-
3,7
98,4
78,5
09
-
-
-
-
-
-
3,7
98,4
78,5
09
-
3,7
98,4
78,5
09
Long
ter
m fi
nanc
es
4% -
17.7
3 %
-
-
-
-
-
-
230
,071
,375
3
48,4
40,9
98
-
-
578
,512
,373
5
78,5
12,3
73
-
578
,512
,373
Lo
ng t
erm
inve
stm
ents
14
%-2
5%
-
-
-
-
-
-
-
-
-
232
,976
,000
-
2
32,9
76,0
00
232
,976
,000
232
,976
,000
Sh
ort
term
fina
nces
13
% -
18.
64 %
-
-
-
-
-
-
-
3
29,8
46,9
62
-
-
-
329
,846
,962
3
29,8
46,9
62
-
329
,846
,962
Sh
ort
term
pla
cem
ents
14
%-2
5%
280
,987
,368
-
-
-
-
2
80,9
87,3
68
-
-
-
-
-
-
280
,987
,368
-
2
80,9
87,3
68
Shor
t te
rm in
vest
men
ts
-
-
-
-
-
-
-
-
-
-
-
-
-
2
21,6
23,0
27
221
,623
,027
M
ark-
up a
ccru
ed
-
-
-
-
-
-
-
-
-
-
-
-
-
8
5,01
9,43
4
85,
019,
434
Adv
ance
s, p
repa
ymen
ts
and
othe
r re
ceiv
able
s 15
.29
% -
21.
70 %
-
4
7,69
0,83
6
-
-
-
47,
690,
836
-
-
-
-
-
-
4
7,69
0,83
6
456
,427
,739
5
04,1
18,5
75
Cas
h an
d ba
nk b
alan
ces
4% -
12%
1
25,6
93,0
24
-
-
-
-
125
,693
,024
-
-
-
-
-
-
1
25,6
93,0
24
33,
099,
102
1
58,7
92,1
26
6
92,2
28,5
00
2,2
31,6
20,3
82
776
,659
,370
5
52,3
41,4
85
-
4,2
52,8
49,7
37
-
559
,918
,337
3
48,4
40,9
98
232
,976
,000
-
1
,141
,335
,335
5
,394
,185
,072
7
96,1
69,3
02
6,1
90,3
54,3
74
Fin
anci
al li
abili
ties
Term
fina
nce
cert
ifica
tes
10.0
0% -
17.6
9%
-
-
-
-
-
-
37,
620,
000
1
49,9
70,0
00
487
,320
,000
6
5,64
2,98
2
-
740
,552
,982
7
40,5
52,9
82
-
740
,552
,982
Lo
ng t
erm
cer
tifica
tes
of
in
vest
men
ts
13.7
5% -
22.2
2%
600
,000
1
,200
,000
3
28,0
33,6
73
4,7
75,0
00
-
334
,608
,673
-
-
-
-
-
-
3
34,6
08,6
73
-
334
,608
,673
Lo
ng t
erm
bor
row
ings
12
.03.
% -
18.2
7%
-
-
-
-
-
-
148
,539
,657
3
91,4
04,7
61
584
,158
,751
-
1,1
24,1
03,1
69
1,1
24,1
03,1
69
-
1,1
24,1
03,1
69
Shor
t te
rm c
ertifi
cate
s
of in
vest
men
ts
9% -
18.3
4%
679
,584
,910
3
47,7
01,4
29
-
-
-
1,0
27,2
86,3
39
-
-
-
-
-
-
1,0
27,2
86,3
39
-
1,0
27,2
86,3
39
Shor
t te
rm b
orro
win
gs
11%
-45
.00%
1
,826
,483
,752
-
-
-
1,8
26,4
83,7
52
-
332
,216
,672
-
-
-
3
32,2
16,6
72
2,1
58,7
00,4
24
-
2,1
58,7
00,4
24
Mar
k-up
acc
rued
-
-
-
-
-
-
-
-
-
-
-
-
-
137
,105
,415
1
37,1
05,4
15
Trad
e an
d ot
her
paya
bles
-
-
-
-
-
-
-
-
-
-
-
-
-
29,
589,
890
2
9,58
9,89
0
2,5
06,6
68,6
62
348
,901
,429
3
28,0
33,6
73
4,7
75,0
00
-
3,1
88,3
78,7
64
186
,159
,657
8
73,5
91,4
33
1,07
1,47
8,75
1
65,
642,
982
-
2
,196
,872
,823
5
,385
,251
,587
1
66,6
95,3
05
5,5
51,9
46,8
92
On
bal
ance
sh
eet
gap
(1,8
14,4
40,1
62)
1,8
82,7
18,9
53
448
,625
,697
5
47,5
66,4
85
-
1,0
64,4
70,9
73 (
186,
159,
657)
(3
13,6
73,0
96)
(723
,037
,753
) 1
67,3
33,0
18
-
(1,0
55,5
37,4
88)
8,9
33,4
85
629
,473
,997
6
38,4
07,4
82
Off
bal
ance
sh
eet
fin
anci
al
asse
ts a
nd
liab
iliti
es
Le
ase
com
mit
men
ts
-
-
-
-
-
-
-
-
-
-
-
-
-
-
Off
bal
ance
sh
eet
gap
-
-
-
-
-
-
-
-
-
-
-
-
-
-
-
Tota
l in
tere
st r
ate
sen
siti
vity
gap
(1,8
14,4
40,1
62)
1,8
82,7
18,9
53
448
,625
,697
5
47,5
66,4
85
-
(18
6,15
9,65
7)
(313
,673
,096
) (7
23,0
37,7
53)
167
,333
,018
-
-
-
-
-
Cu
mu
lati
ve in
tere
st r
ate
sen
siti
vity
gap
68,
278,
791
5
16,9
04,4
88
1,0
64,4
70,9
73 1
,064
,470
,973
-
-
(4
99,8
32,7
53) (
1,22
2,87
0,50
6) (1
,055
,537
,488
) (1,
055,
537,
488)
8,9
33,4
85
-
-
The
carr
ying
val
ues
of fi
nanc
ial a
sset
s an
d fin
anci
al li
abili
ties
are
appr
oxim
ate
to t
heir
fair
valu
e as
refl
ecte
d in
the
fina
ncia
l sta
tem
ents
.
42
Fin
anci
al in
stru
men
ts a
nd
rel
ated
dis
clo
sure
s
The
Gro
up’s
inte
rest
/ m
ark-
up s
ensi
tivity
pos
ition
for
inte
rest
/mar
k-up
bea
ring
finan
cial
ass
ets
and
liabi
litie
s an
d th
e pe
riods
in w
hich
the
y w
ill m
atur
e is
as
follo
ws:

120
2
0
0
8
E
x P
O S
E D
T
O
I N
T E
R E
S T
/
M A
R K
-
U P
R
I S
K
E x
P O
S E
D
T O
F
A I
R
v A
L U
E
I N
T E
R E
S T
R
A T
E
R I
S K
E x
P O
S E
D
T O
C
A S
H
F L
O W
I
N T
E R
E S
T
R A
T E
R
I S
K
No
t ex
po
sed
O
ver
thre
e O
ver
on
e O
ver
thre
e
O
ver
thre
e O
ver
on
e O
ver
thre
e
to
inte
rest
/
Inte
rest
U
pto
th
ree
mo
nth
s to
ye
ar t
o
year
s to
O
ver
five
Up
to t
hre
e m
on
ths
year
to
ye
ars
to
Ove
r fi
ve
mar
k-u
p
2008
ra
tes
mo
nth
s o
ne
year
th
ree
year
s fi
ve y
ears
Tota
l m
on
ths
on
e ye
ar
th
ree
year
s fi
ve y
ears
ye
ars
Tota
l
risk
To
tal
%
ag
e R
up
ees
Ru
pee
s R
up
ees
Ru
pee
s R
up
ees
Ru
pee
s R
up
ees
Ru
pee
s R
up
ees
Ru
pee
s R
up
ees
Ru
pee
s R
up
ees
Ru
pee
s R
up
ees
On
bal
ance
sh
eet
fin
anci
al
asse
ts a
nd
liab
iliti
es
Fi
nan
cial
ass
ets
N
et in
vest
men
t in
le
ase
finan
ce
6.75
% -
24
%
34
7,89
5,42
1
856
,644
,417
2,0
03,6
41,4
20
1,41
7,20
2,03
4
- 4
,625
,383
,292
-
-
-
-
-
-
4,6
25,3
83,2
92
-
4,62
5,38
3,29
2 Lo
ng t
erm
fina
nces
4%
- 2
9 %
-
-
-
-
-
-
6,1
07,0
76
563
,347
,630
-
-
56
9,45
4,70
6
569
,454
,706
-
5
69,4
54,7
06
Long
ter
m in
vest
men
ts
14%
-17%
-
-
-
-
-
-
-
-
-
2
79,9
92,0
00
-
279,
992,
000
2
79,9
92,0
00
527
,614
2
80,5
19,6
14
Shor
t te
rm fi
nanc
es
12.5
% -
20
%
-
-
-
-
-
-
-
384
,634
,120
-
-
-
38
4,63
4,12
0
384
,634
,120
-
3
84,6
34,1
20
Shor
t te
rm p
lace
men
ts
9.2%
-18.
9%
360
,988
,000
-
-
-
-
36
0,98
8,00
0 1
39,4
37,3
08
-
-
-
-
139,
437,
308
5
00,4
25,3
08
-
500
,425
,308
Sh
ort
term
inve
stm
ents
-
-
-
-
-
-
-
-
-
-
-
-
-
569
,891
,145
5
69,8
91,1
45
Mar
k up
acc
rued
-
-
-
-
-
-
-
-
-
-
-
-
-
37,
070,
524
3
7,07
0,52
4 A
dvan
ces,
pre
paym
ents
an
d ot
her
rece
ivab
les
12 %
- 2
0 %
-
9
8,11
8,16
9
-
-
-
98,
118,
169
-
-
-
-
-
-
9
8,11
8,16
9
583,
860,
990
6
81,9
79,1
59
Cas
h an
d ba
nk b
alan
ces
5% t
o 9%
232,
202
-
-
-
-
2
32,2
02
-
-
-
-
-
-
232
,202
9
3,05
6,57
1
93,
288,
773
709
,115
,623
9
54,7
62,5
86
2,00
3,64
1,42
0
1,41
7,20
2,03
4
- 5
,084
,721
,663
13
9,43
7,30
8
390
,741
,196
5
63,3
47,6
30
279
,992
,000
-
1,3
73,5
18,1
34 6
,458
,239
,797
1,2
84,4
06,8
44 7
,742
,646
,641
Fi
nan
cial
liab
iliti
es
Te
rm fi
nanc
e ce
rtifi
cate
s 11
.00%
-14
.00%
-
-
-
-
-
-
3
7,50
0,00
0
112
,500
,000
1
45,6
32,5
92
-
-
295,
632,
592
2
95,6
32,5
92
-
295
,632
,592
Lo
ng t
erm
cer
tifica
tes
of
in
vest
men
ts
11%
-16
.67%
2,0
22,9
40
873
,660
,318
1
00,7
53,9
70
19,
720,
000
-
99
6,15
7,22
8
-
-
-
-
-
-
996
,157
,228
-
9
96,1
57,2
28
Long
ter
m b
orro
win
gs
11.0
0% -
14.2
5%
-
-
-
-
-
-
134,
498,
414
3
86,8
48,1
27
416
,982
,774
5
0,00
0,00
0
-
988,
329,
315
9
88,3
29,3
15
-
988
,329
,315
Pr
e- IP
O s
ubsc
riptio
n of
Ter
m
Fi
nanc
e C
ertifi
cate
s 14
% t
o 15
.10%
-
-
90,
000
1
68,7
72,5
00
224
,910
,000
56
,227
,500
45
0,00
0,00
0
450
,000
,000
450
,000
,000
Sh
ort
term
cer
tifica
tes
of
inve
stm
ents
8.
5% -
18%
3,3
19,7
33
1,0
38,8
62,2
58
-
-
- 1
,042
,181
,991
-
-
-
-
-
-
1,0
42,1
81,9
91
-
1,04
2,18
1,99
1 Sh
ort
term
bor
row
ings
4.
5% -
13.0
0%
794
,185
,500
7
85,0
00,0
00
-
-
- 1
,579
,185
,500
-
3
32,2
16,6
72
-
-
-
332,
216,
672
1,9
11,4
02,1
72
-
1,91
1,40
2,17
2 M
arku
p ac
crue
d
-
-
-
-
-
-
-
-
-
-
-
-
-
93,
231,
841
9
3,23
1,84
1 Tr
ade
and
othe
r pa
yabl
es
-
-
-
-
-
-
-
-
-
-
-
-
-
8
1,15
1,56
2
81,
151,
562
799
,528
,173
2
,697
,522
,576
1
00,7
53,9
70
19,
720,
000
-
3,6
17,5
24,7
19 1
71,9
98,4
14
831,
654,
799
7
31,3
87,8
66
274
,910
,000
-
2,0
66,1
78,5
79 5
,683
,703
,298
174
,383
,403
5,8
58,0
86,7
01
On
bal
ance
sh
eet
gap
(90,
412,
550)
(1
,742
,759
,990
) 1,
902,
887,
450
1,3
97,4
82,0
34
- 1
,467
,196
,944
(32
,561
,106
) (44
0,91
3,60
3)
(168
,040
,236
) 5
,082
,000
-
(69
2,66
0,44
5)
774,
536,
499
1,1
10,0
23,4
41 1
,884
,559
,940
O
ff b
alan
ce s
hee
t fi
nan
cial
as
sets
an
d li
abili
ties
Leas
e co
mm
itm
ents
(23,
456,
234)
(9
9,68
5,76
6)
-
-
(12
3,14
2,00
0)
-
-
-
-
-
-
(123
,142
,000
) -
(1
23,1
42,0
00)
Off
bal
ance
sh
eet
gap
(23,
456,
234)
(9
9,68
5,76
6)
-
-
- (
123,
142,
000)
-
-
-
-
-
-
(12
3,14
2,00
0)
-
(123
,142
,000
)
Tota
l in
tere
st r
ate
sen
siti
vity
gap
(113
,868
,784
) (1
,842
,445
,756
) 1,
902,
887,
450
1,3
97,4
82,0
34
-
-
(32,
561,
106)
(4
40,9
13,6
03)
(168
,040
,236
) 5
,082
,000
-
-
-
-
Cu
mu
lati
ve in
tere
st r
ate
sen
siti
vity
gap
(1
,956
,314
,540
) (5
3,42
7,09
0)
1,3
44,0
54,9
44
1,34
4,05
4,94
4
-
-
(473
,474
,709
) (6
41,5
14,9
45)
(636
,432
,945
) (6
36,4
32,9
45)
7
07,6
21,9
99
-
-
The
carr
ying
val
ues
of fi
nanc
ial a
sset
s an
d fin
anci
al li
abili
ties
are
appr
oxim
ate
to t
heir
fair
valu
e as
refl
ecte
d in
the
fina
ncia
l sta
tem
ents
.
Fi
nan
cial
inst
rum
ents
an
d r
elat
ed d
iscl
osu
res
Th
e G
roup
’s in
tere
st /
mar
k-up
sen
sitiv
ity p
ositi
on f
or in
tere
st/m
ark-
up b
earin
g fin
anci
al a
sset
s an
d lia
bilit
ies
and
the
perio
ds in
whi
ch t
hey
will
mat
ure
is a
s fo
llow
s:

121
42.1 Credit risk Credit risk arises from the possibility of asset impairment occurring because counter parties
cannot meet their obligations in transactions involving financial instruments. The Group has established procedures to manage credit exposure including credit approvals, credit limits, collateral and guarantee requirements. These procedures incorporate both internal guidelines and requirements of the Prudential Regulations for NBFC’s. The Group also manages risk through an independent credit department which evaluates customers credit worthiness and growth potential.
Concentration of credit risk arises when a number of counter parties are engaged in similar
business activities or activities in the same geographic region or have similar economic features which would cause their ability to meet contractual obligations to be similarly affected by changes in economic, political or other conditions. Concentration of credit risk indicates the relative sensitivity of the Group’s performance to developments affecting a particular industry or geographic location.
The Group manages concentration of credit risk exposure through diversification of
activities to avoid undue concentration of risks with individuals, groups or specific industry segments. For such purpose, the Group has established exposure limits for single leases and industrial sectors. TIBL has an effective rental monitoring system, which allows it to evaluate customers credit worthiness and identify classified portfolio. An allowance for potential lease, installment and other loan losses is maintained at a level which, in the judgment of management, is adequate to provide for potential losses on lease, installment and other loan portfolio that can be reasonably anticipated.
An analysis by class of business of the TIBL’s net investment in finance leases is given below: TIBL has no significant concentration of credit risk, with exposure spread over a large
number of lessees. June June 2009 2008 Rupees % Rupees % Industrial sectors Chemical & fertilizer 35,780,637 0.77% 59,916,859 1.06% Construction 320,920,330 6.93% 516,341,304 9.15% Financial institutions 694,634 0.02% 5,402,191 0.10% Health care 133,667,759 2.89% 116,664,152 2.07% Hotels 10,114,601 0.22% 97,319,007 1.72% Individuals / auto lease 1,729,389,301 37.37% 2,021,835,544 35.82% Insurance companies 4,787,663 0.10% 7,852,438 0.14% Miscellaneous manufacturing 294,091,701 6.35% 289,601,061 5.13% Miscellaneous services 150,052,897 3.24% 267,162,545 4.73% Natural gas & LPG 489,044,195 10.57% 152,724,690 2.71% Paper & board 14,391,125 0.31% 20,178,260 0.36% Steel & engineering 12,895,411 0.28% 135,813,506 2.41% Sugar & allied 28,136,156 0.61% 63,045,144 1.12% Textile composite 115,948,964 2.51% 186,359,148 3.30% Textile knitwear / apparel 127,788,208 2.76% 187,454,316 3.32% Textile spinning 131,135,495 2.83% 150,870,856 2.67% Transport & communication 1,028,888,193 22.23% 1,365,232,133 24.19% 4,627,727,270 100% 5,643,773,154 100%
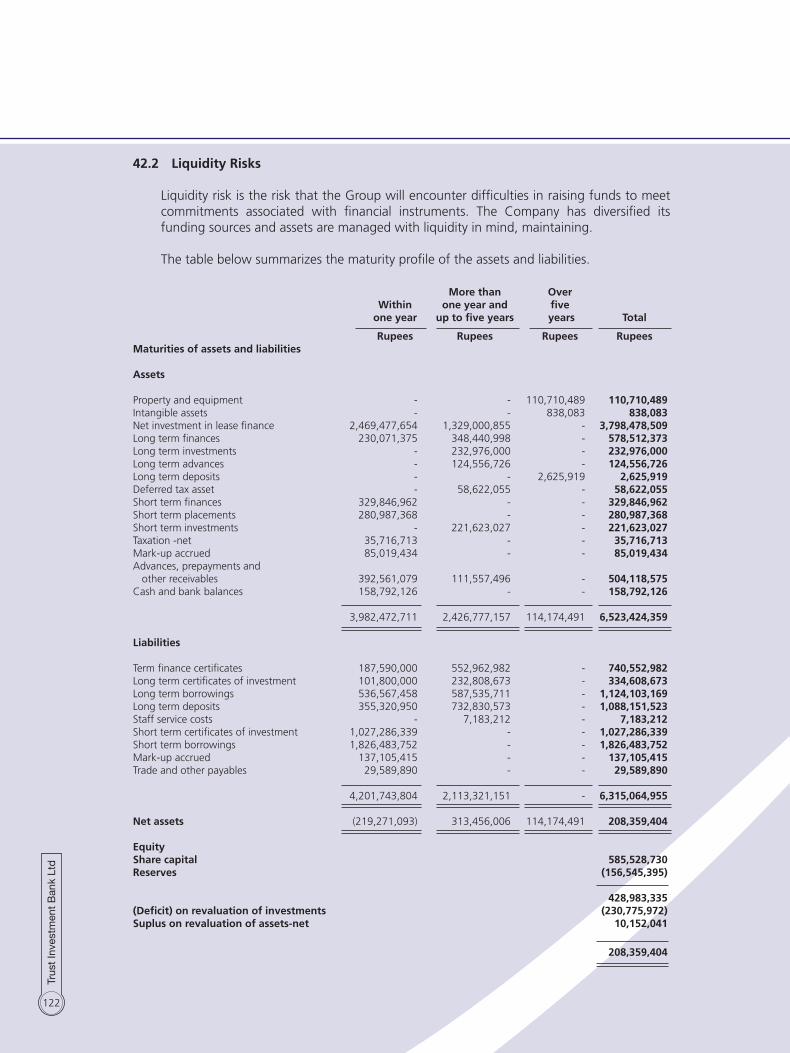
122
42.2 Liquidity Risks Liquidity risk is the risk that the Group will encounter difficulties in raising funds to meet
commitments associated with financial instruments. The Company has diversified its funding sources and assets are managed with liquidity in mind, maintaining.
The table below summarizes the maturity profile of the assets and liabilities.
More than Over Within one year and five one year up to five years years Total
Rupees Rupees Rupees Rupees Maturities of assets and liabilities Assets Property and equipment - - 110,710,489 110,710,489 Intangible assets - - 838,083 838,083 Net investment in lease finance 2,469,477,654 1,329,000,855 - 3,798,478,509 Long term finances 230,071,375 348,440,998 - 578,512,373 Long term investments - 232,976,000 - 232,976,000 Long term advances - 124,556,726 - 124,556,726 Long term deposits - - 2,625,919 2,625,919 Deferred tax asset - 58,622,055 - 58,622,055 Short term finances 329,846,962 - - 329,846,962 Short term placements 280,987,368 - - 280,987,368 Short term investments - 221,623,027 - 221,623,027 Taxation -net 35,716,713 - - 35,716,713 Mark-up accrued 85,019,434 - - 85,019,434 Advances, prepayments and other receivables 392,561,079 111,557,496 - 504,118,575 Cash and bank balances 158,792,126 - - 158,792,126 3,982,472,711 2,426,777,157 114,174,491 6,523,424,359 Liabilities Term finance certificates 187,590,000 552,962,982 - 740,552,982 Long term certificates of investment 101,800,000 232,808,673 - 334,608,673 Long term borrowings 536,567,458 587,535,711 - 1,124,103,169 Long term deposits 355,320,950 732,830,573 - 1,088,151,523 Staff service costs - 7,183,212 - 7,183,212 Short term certificates of investment 1,027,286,339 - - 1,027,286,339 Short term borrowings 1,826,483,752 - - 1,826,483,752 Mark-up accrued 137,105,415 - - 137,105,415 Trade and other payables 29,589,890 - - 29,589,890 4,201,743,804 2,113,321,151 - 6,315,064,955 Net assets (219,271,093) 313,456,006 114,174,491 208,359,404 Equity Share capital 585,528,730 Reserves (156,545,395)
428,983,335 (Deficit) on revaluation of investments (230,775,972) Suplus on revaluation of assets-net 10,152,041
208,359,404

123
42.3 Fair value of financial instruments Fair value is an amount for which an asset could be exchanged, or a liability settled, between
knowledgeable willing parties in an arm’s length transaction. Consequently, differences may arise between the carrying amount and the fair value estimates.
The carrying value of financial assets and financial liabilities approximate their fair value as
reflected in the financial statements. 42.4 Interest rate risk exposure Changes in interest/mark-up rates or in the relationships between short and long term
interest/mark-up rates can affect the rates charged on interest/mark-up earning assets differently than the rates paid on interest bearing liabilities. This can result in an increase/mark-up expense relative to finance income or vice versa. The Company manages borrowings through floating rates.
42.5 Capital Risk Management The Board’s policy is to maintain a strong capital base so as to maintain investors, creditors
and market confidence and to sustain future development of the business. The Board of Directors monitors the return on capital, which the Company defines as net operation income dividend by total capital employed. The board of directors also monitors the level of dividends to individuals ordinary shareholders.
TIBL TIBL is exposed to externally imposed capital requirements. Vide its notification dated 21 November 2008, the Securities and Exchange Commission
of Pakistan has announced certain revisions in the Non-Banking Finance Companies Rules, 2003 and has promulgated the Non-Banking Finance Companies and Notified Entities Regulations, 2008. The existing NBFCs have been allowed different time limits for aligning themselves with different capital requirements.
The Group sets the amount of capital in proportion to risk. The Group manages the capital
structure and makes adjustments to it in the light of changes in economic conditions and the risk characteristics of the underlying assets. In order to maintain or adjust the capital structure, the Group may, for example, adjust the amount of dividend paid to shareholders, issue new shares or sell assets to reduce debt.
In the presence of equity shortfall, the management has taken the following step to bring its equity to the minimum equity required level as required by NBFC’s & Notified Entities Regulations, 2008. Subsequent to year ended 30 June 2009, the managemet is working to market the preference shares of Rs. 700 million inclusive of Rs. 200 million of green shoe option. Further, a foreign investment Group has shown interest to inject foreign equity to an amount of Rs. 585 million.

124
2009 2008 Rupees Rupees 43 Cash and cash equivalents Cash and bank balances 160,531,746 93,288,772 Short term running finance (321,693,339) (332,216,672)
(161,161,593) (238,927,900)
44 Transactions with related parties Related parties comprise of directors, entities over which directors are able to exercise significant
influence, entities with common directors, major shareholders, key management employees and employees’ fund. The transactions and balances with related parties, other than those which have been disclosed in the relevant notes are disclosed as follows:
2009 2008 Rupees Rupees First Pakistan Securities Limited Amount due against leases - 432,769 Finance income charged during the period - 53,598 Deposits against lease arrangements - 149,700 MCD Pakistan Limited Finance income charged during the period - 782 Switch Securities (Private) Limited Finance income charged during the period - 1,534 Tricon Developers ( Partnership Concern) Installments paid for purchase of office space 124,556,726 97,379,318 Amount due against leases 3,762,104 1,978,989 Finance income charged during the period 499,396 21,077 Deposit against lease arrangements 501,350 200,650 Union Communication (Pvt) Limited Communication services 730,529 838,441 Polygon Builders Amount due against term finances - 25,550,000 Finance income charges during the period 2,364,691 90,650

125
2009 2008 Rupees Rupees Polygon Developers Amount due against term finances 195,000,000 - Finance income charged during the period 27,593,035 - Ahmed Khalil Amount due against term finances 5,000,000 15,000,000 Finance income charges during the period 1,565,814 1,010,411 Allied Developers Amount due against term finances - 29,500,000 Finance income charged during the period 5,359,665 1,353,205 Employees’ retirement fund Payment made 2,001,231 6,275,538 45 Subsequent event There were no significant adjustable events subsequent to 30 June 2009, which may require an
adjustment to financial statements or additional disclosure and have not already been disclosed in these financial statements.
46 Authorization These financial statements were authorized for issue on November 16, 2009 by the Board of
Directors. 47 General 47.1 Figures have been rounded off to the nearest of rupee. 47.2 Corresponding figures have been re-arranged and re-classified, wherever necessary, for
the purposes of comparison. The current maturities of non-current assets amounting to Rs. 850,120,271 in the year 2008 were being wrongly classified as net investment in lease finance in the financial statements.
47.3 The financial statements of TCPL have been prepared for the period of 12 months and 10 days. Since TCPL was incorporated on 20 June 2008 no material transaction was made during the 10 days of pervious period. Accordingly, the transactions from 20 June 2008 to 30 June 2009 have been accounted for in current periods financial statements.
CHIEF ExECUTIvE DIRECTOR

126

127
Form of Proxy
TRUST INvESTMENT BANK LIMITED
I/We___________________________________________________________________ of________________
___________________________________________________________________being member(s) of Trust
Investment Bank Limited, holding ______________________ ordinary Shares as per Share Register Folio No./
CDC Participant I.D. No. __________________________hereby appoint Mr./Mrs./Miss___________________
____________________of____________________________________________ who is also a member of the
Bank, Folio No. / CDC Participant I.D. No. ________________________or failing him / her________________
____________of_________________________________________ Folio No./CDC Participant I.D. No. _______
________another member of the Bank as my / our Proxy in my / our absence to attend and vote for me / us
and on my / our behalf at the Annual General Meeting of the Bank to be held on the 10th day of December,
2009 at 11:00 a.m. at Head Office: 23-D / 1-A, Gulberg III, Lahore.
Signed this ______________ day of _________________ 2009.
Signature of Member (The Signature should agree with the specimen registered with the Bank)Witness: Witness:
Signature: _______________________________ Signature: ______________________________
Name: __________________________________ Name : ________________________________
Address: ________________________________ Address: _______________________________
CNIC No.: _______________________________ CNIC No.: ______________________________
Notes:1. This proxy form, duly completed and signed, must be received at the Registered Office of the Bank,
23-D/1-A, Gulberg III, Lahore not less than 48 hours before the time of holding the meeting.2. If a member appoints more than one proxy and more than one instruments of proxies are deposited by
a member with the Bank, all such instruments of proxy shall be rendered invalid.3. No person can act as proxy unless he / she is member of the Bank, except that a corporation may
appoint a person who is not a member.
For CDC Account Holders / Corporate Entities.In addition to the above, the following requirements have to be met.
i. The proxy form shall be witnessed by two persons whose name, address and Computerized National Identity Card (CNIC) number shall be mentioned on the form.
ii. Attested copies of CNIC or Passport of the beneficial owners and the proxy shall be provided with the proxy form.
iii. The proxy shall produce his original CNIC or Passport at the time of attending the meeting.iv. In case of corporate entity, the Board of Directors’ Resolution / Power of Attorney with specimen
signature shall be submitted (unless it has been provided earlier) alongwith proxy form to the Bank.
Please affix Five Rupees Revenue
Stamp

128
AFFIXCORRECTPOSTAGE
The Company SecretaryTrust Investment Bank Limited.23-D/1-A, GULBERG - III, Lahore.Tel: (042) 32404714-19Fax: (042) 32404720E. mail: [email protected]: www.trustbank.com.pk

Trust Investment Bank LimitedHead Office: 23-D/1-A, Gulberg III, Lahore (Pakistan).UAN: 111-665-462 Telephones: +92-42-3240 4714-19 Fax: +92-42-3240 4720 Email: [email protected]
www.trustbank.com.pk
Top Related