


Languages
Pages
Legal


Dakota County, Minnesota
2017 Wetland Health Evaluation Program

2017 Wetland Health Evaluation Program Report
Dakota County, MN
Coordinated By:
Dakota County
14955 Galaxie Avenue
Apple Valley, MN 55124-8579
January 2018
Report
Prepared by:

Dakota Co. WHEP January 2018
2017 Report Fortin Consulting, Inc. P a g e | i
Acknowledgements
The following organizations participated in and provided funding for
the 2017 Wetland Health Evaluation Program
Local Government:
Dakota County Environmental Resources Department
Dakota County Parks Department
City of Apple Valley
City of Burnsville
City of Eagan
City of Farmington
City of Hastings
City of Lakeville
City of Mendota Heights
City of Rosemount
City of South St. Paul
City of West St. Paul
North Cannon River Watershed Management Organization
Vermillion River Watershed Joint Powers Organization
Special Recognition:
Mark Gernes, Joel Chirhart, Michael Bourdaghs, John Genet; MPCA Technical Experts Paula Liepold, Dakota County WHEP Coordinator
Mary Karius, Hennepin County WHEP Coordinator
Jeff Korpik, Co-Citizen Monitoring Coordinator
Katie Farber, Carolyn Dindorf; Fortin Consulting
Cover design by:
Paula Liepold
Photos by:
Maggie Karschnia, Jeff Korpik, Sondra Larson, Dianne Rowse,
Rick Schuldt, Cindy Taintor, and Fortin Consulting, Inc.
Special thanks to all of the WHEP volunteers who donated their time and were out
in the wetlands or behind the microscopes.
For more information on the Dakota County Wetland Health Evaluation Program or for a copy
of this report, please contact the Dakota County Environmental Resources Department or visit
www.mnwhep.org.
Dakota Co. WHEP January 2018
2017 Report Fortin Consulting, Inc. P a g e | i i
Table of Contents
1.0 Background ........................................................................................................... 1 1.1 The Wetland Health Evaluation Program (WHEP) ............................................. 1 1.2 Why Monitor Wetlands? ..................................................................................... 2 1.3 Wetland Types ................................................................................................... 2 1.4 Dakota County Wetland Monitoring .................................................................... 4
2.0 Methods ................................................................................................................. 5 2.1 Training .............................................................................................................. 5 2.2 Data Collection ................................................................................................... 5 2.3 Cross-Checks and Quality Control ..................................................................... 6 2.4 Wetland Scores and Quality Ratings .................................................................. 7
2.5 Using the Data ................................................................................................... 8 3.0 General Results and Recommendations ............................................................... 9
3.1 2017 Sampling Season Results ......................................................................... 9
3.1.1 Aquatic Invasive Species and Wetland Health .......................................... 12 3.1.2 Natural versus Altered Wetlands ............................................................... 13 3.1.3 Impervious Area in the Watershed ............................................................ 13
3.1.4 Effect of Wetland Water Levels on Wetland Health ................................... 13 3.2 Is Volunteer Data Usable? ............................................................................... 14
3.2.1 2017 Cross-checks .................................................................................... 14 3.2.2 2017 Quality Control Checks ..................................................................... 15
3.3 WHEP Historical Data ......................................................................................... 17
4.0 Wetland Evaluations ............................................................................................ 20 4.1 Apple Valley Wetlands ..................................................................................... 20
4.1.1 Alimagnet Park (AV-10) ............................................................................. 22 4.1.2 Everest Pond (AV-12) ................................................................................... 24 4.1.3 Valleywood Golf Course (AV-20) .................................................................. 25
4.2 Burnsville Wetlands ............................................................................................. 27
4.2.1 Crystal Lake West (B-1) ............................................................................... 28 4.2.2 Kraemer Preserve (B-3) ............................................................................... 30 4.2.3 Red Oak (B-8) .............................................................................................. 31
4.2.4 Sunset Pond (B-13) ...................................................................................... 33 4.3 Dakota County Parks Wetlands ........................................................................... 34
4.3.1 Empire Lake (DC-1) ..................................................................................... 36 4.3.2 Buck Pond (DC-2) ........................................................................................ 37
4.3.3 Tamarack Swamp (DC-3)............................................................................. 39 4.3.4 Jensen Lake (DC-4) ..................................................................................... 40
4.4 Eagan Wetlands ................................................................................................. 42 4.4.1 Moonshine Park Pond (E-18) ....................................................................... 44
4.4.2 O’Leary Lake (E-41) ..................................................................................... 45 4.4.3 Pond LP-44 (E-42) ....................................................................................... 46
4.5 Farmington Wetlands ........................................................................................... 47
4.5.1 Kral Pond (F-3) ............................................................................................. 49 4.5.2 Autumn Glen (F-7) ....................................................................................... 50 4.5.3 Mystic Meadows (F-8) .................................................................................. 52
4.6 Hastings Wetlands ............................................................................................... 53 4.6.1 Stonegate Treated Wetland (H-4) ................................................................ 55 4.6.2 Lake Rebecca Wetland (H-6) ....................................................................... 57 4.6.3 180th Street Marsh (H-56)............................................................................. 58

Dakota Co. WHEP January 2018
2017 Report Fortin Consulting, Inc. P a g e | i i i
4.6.4 Cari Park Pond (H-57) .................................................................................. 60 4.7 Lakeville Wetlands ............................................................................................... 61
4.7.1 DNR Wetland #387 (L-7) .............................................................................. 63 4.7.2 DNR #393 (L-8) ............................................................................................. 64
4.8 Mendota Heights Wetlands .................................................................................. 66 4.8.1 Copperfield (MH-2) ........................................................................................ 67 4.8.2 Industrial Park (MH-4) ................................................................................... 69
4.9 North Cannon River Watershed Management Organization ................................ 70 4.9.1 Wasner (NCR-1) .......................................................................................... 72
4.9.2 Peterson (NCR-2) ........................................................................................ 73 4.10 Rosemount Wetlands ....................................................................................... 74
4.10.1 Schwarz Pond (R-4) ................................................................................... 76 4.10.2 Mare Pond North (R-14) ............................................................................. 77 4.10.3 CR-38 Mitigation Site 1 (R-21) ................................................................... 78
4.10.4 CR-38 Mitigation Site 2 (R-23) ................................................................... 80
4.11 South St. Paul Wetlands .................................................................................... 81
4.11.1 Anderson Pond (SSP-1) .............................................................................. 83 4.11.2 LeVander Pond (SSP-3).............................................................................. 85
4.12 West St. Paul Wetlands ..................................................................................... 86 4.12.1 Duck Pond (WSP-3) .................................................................................... 88
4.12.2 Weschcke Pond (WSP-4)............................................................................ 89 4.12.3 Marthaler Park (WSP-6) .............................................................................. 90 4.12.4 Dodge Nature Center Prairie Pond (WSP-8) ............................................... 92
Appendix A-1. Invertebrate Metric Scores ..................................................................... 94 Appendix A-2. Vegetation Metric Scores ...................................................................... 95
Appendix B. Invasive Species Presence 2012-2017 ..................................................... 96 Appendix C. Site Score Averages of Created, Stormwater, and Natural Wetland ......... 99
Appendix D. Wetland and Watershed Data for 2008-2017 .......................................... 102
Dakota Co. WHEP January 2018
2017 Report Fortin Consulting, Inc. P a g e | i v
Executive Summary
Dakota County Wetland Health Evaluation Program 2017
Dakota County began sponsoring the Wetland Health Evaluation Program (WHEP) in 1997. Since then,
184 wetlands have been monitored by many volunteers across the County. In 2017, ten cities, one
watershed management organization, and Dakota County Parks sponsored WHEP teams, monitoring 37
different wetlands. Four of these wetlands were monitored for the first time in 2017, including sites from
Eagan and North Cannon River Watershed Management Organization. Trained volunteers collected data
on the macroinvertebrates (insects and other small animals without backbones) that live in the wetlands as
well as the vegetation (plants) in the wetlands. The invertebrates and vegetation identified by the volunteers
were then used to calculate an Index of Biotic Integrity (IBI). This IBI can be used to estimate the health
of each wetland.
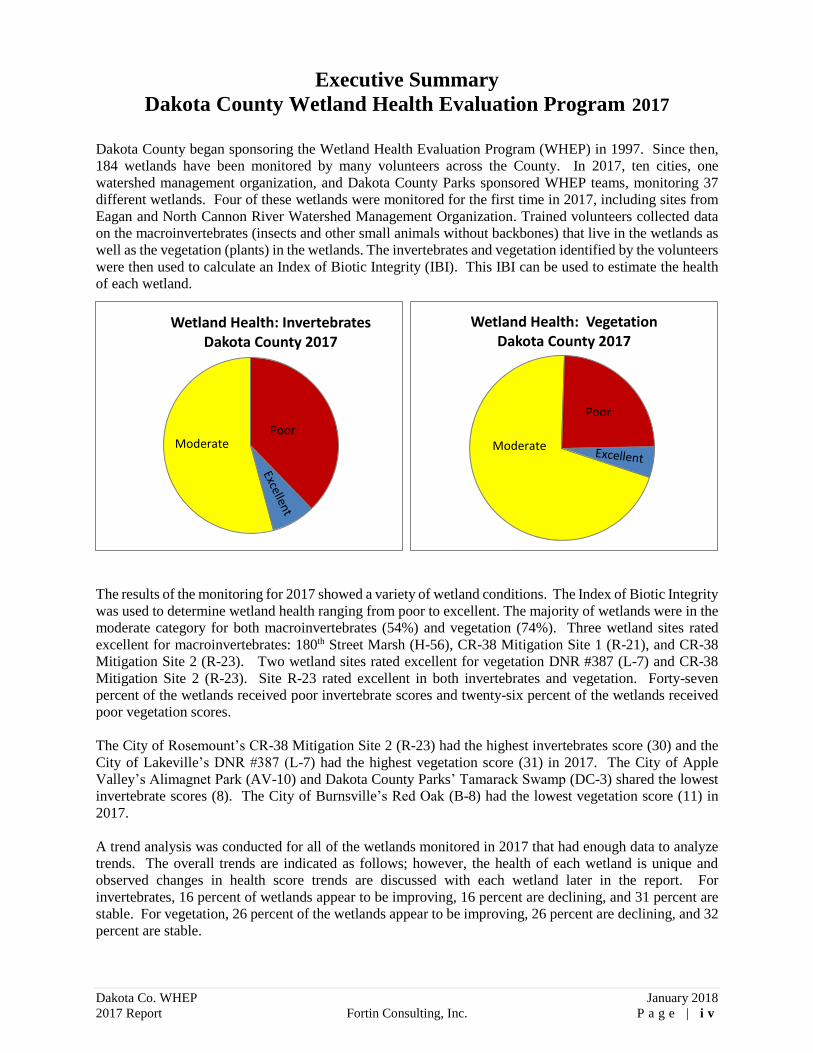
The results of the monitoring for 2017 showed a variety of wetland conditions. The Index of Biotic Integrity
was used to determine wetland health ranging from poor to excellent. The majority of wetlands were in the
moderate category for both macroinvertebrates (54%) and vegetation (74%). Three wetland sites rated
excellent for macroinvertebrates: 180th Street Marsh (H-56), CR-38 Mitigation Site 1 (R-21), and CR-38
Mitigation Site 2 (R-23). Two wetland sites rated excellent for vegetation DNR #387 (L-7) and CR-38
Mitigation Site 2 (R-23). Site R-23 rated excellent in both invertebrates and vegetation. Forty-seven
percent of the wetlands received poor invertebrate scores and twenty-six percent of the wetlands received
poor vegetation scores.
The City of Rosemount’s CR-38 Mitigation Site 2 (R-23) had the highest invertebrates score (30) and the
City of Lakeville’s DNR #387 (L-7) had the highest vegetation score (31) in 2017. The City of Apple
Valley’s Alimagnet Park (AV-10) and Dakota County Parks’ Tamarack Swamp (DC-3) shared the lowest
invertebrate scores (8). The City of Burnsville’s Red Oak (B-8) had the lowest vegetation score (11) in
2017.
A trend analysis was conducted for all of the wetlands monitored in 2017 that had enough data to analyze
trends. The overall trends are indicated as follows; however, the health of each wetland is unique and
observed changes in health score trends are discussed with each wetland later in the report. For
invertebrates, 16 percent of wetlands appear to be improving, 16 percent are declining, and 31 percent are
stable. For vegetation, 26 percent of the wetlands appear to be improving, 26 percent are declining, and 32
percent are stable.
Moderate
Poor
Wetland Health: VegetationDakota County 2017
ModeratePoor
Wetland Health: InvertebratesDakota County 2017

Dakota Co. WHEP January 2018
2017 Report Fortin Consulting, Inc. P a g e | v
Several analyses were done to try to identify some of the causes of wetland health conditions found. No
significant relationships were found between IBI scores and wetland alterations.
2017 Dakota County Wetland Health Trends*
*excludes wetlands that did not have adequate
data for trend analysis
In 2017, 123 Dakota County WHEP volunteers donated more than 2,171 hours in training, sample
collection and sample identification in completion of this valuable monitoring. It gives citizens an
opportunity to study the wetlands in their communities and see the impacts of human disturbance on our
wetlands, and it provides valuable data to the cities and County. The data collected by the WHEP volunteers
can be used for many purposes such as, to help track changes in wetlands over time and relate to changes
in the watershed, help identify high quality wetlands that may need protection, track changes in wetland
health with restoration projects, evaluate the success of wetland creation or impacts of new stormwater
input, and to help find invasive species that threaten the wetlands. WHEP is a great example of a successful
cooperative program between citizens, cities, counties and state government.
Declining 26%
Improving26%
Stable32%
Variable26%
Vegetation Wetland Health Trends2017
Declining 16%
Improving16%
Stable31%
Variable37%
Invertebrate Wetland Health Trends2017
Dakota Co. WHEP January 2018
2017 Report Fortin Consulting, Inc. P a g e | 1
1.0 Background
1.1 The Wetland Health Evaluation Program (WHEP)
The Wetland Health Evaluation Program (WHEP) is a volunteer monitoring program for wetlands. WHEP
uses sampling methods and evaluation metrics developed by the Minnesota Pollution Control Agency
(MPCA) to evaluate wetland health. The metrics are based on species diversity and richness for both
vegetation and macroinvertebrates. Citizen teams, led by a trained team leader with education and/or work
experience in natural resources, conduct the sampling.
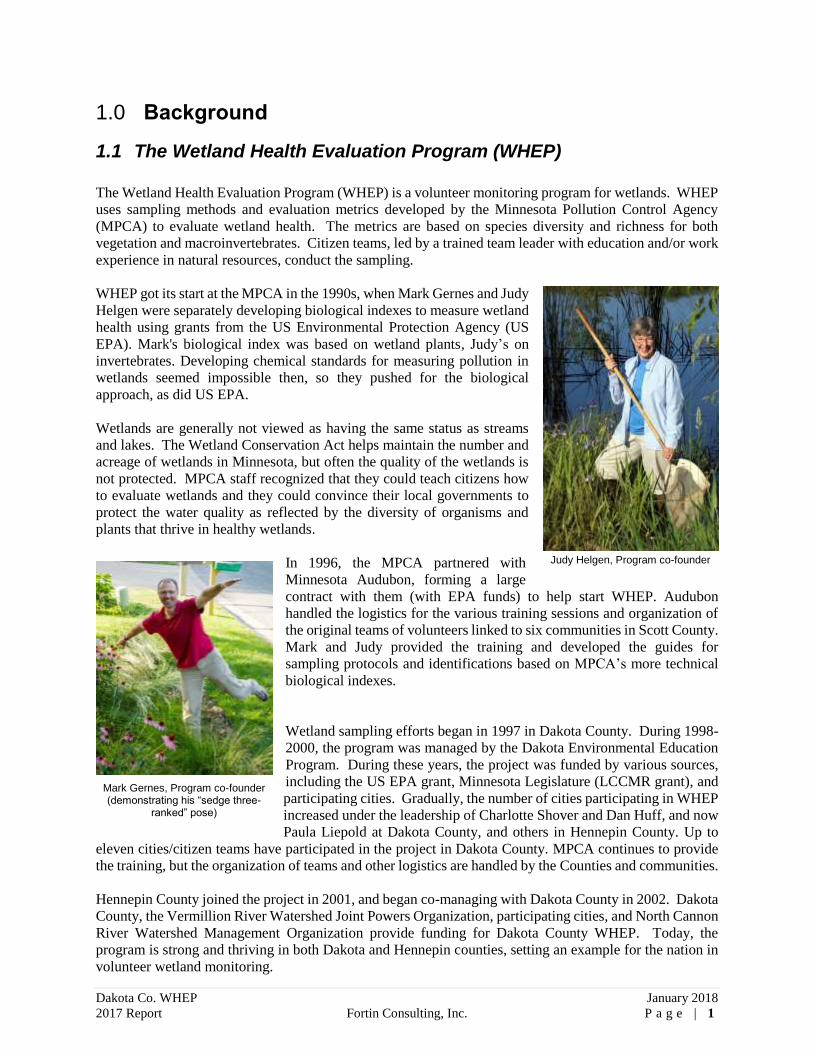
WHEP got its start at the MPCA in the 1990s, when Mark Gernes and Judy
Helgen were separately developing biological indexes to measure wetland
health using grants from the US Environmental Protection Agency (US
EPA). Mark's biological index was based on wetland plants, Judy’s on
invertebrates. Developing chemical standards for measuring pollution in
wetlands seemed impossible then, so they pushed for the biological
approach, as did US EPA.
Wetlands are generally not viewed as having the same status as streams
and lakes. The Wetland Conservation Act helps maintain the number and
acreage of wetlands in Minnesota, but often the quality of the wetlands is
not protected. MPCA staff recognized that they could teach citizens how
to evaluate wetlands and they could convince their local governments to
protect the water quality as reflected by the diversity of organisms and
plants that thrive in healthy wetlands.
In 1996, the MPCA partnered with
Minnesota Audubon, forming a large
contract with them (with EPA funds) to help start WHEP. Audubon
handled the logistics for the various training sessions and organization of
the original teams of volunteers linked to six communities in Scott County.
Mark and Judy provided the training and developed the guides for
sampling protocols and identifications based on MPCA’s more technical
biological indexes.
Wetland sampling efforts began in 1997 in Dakota County. During 1998-
2000, the program was managed by the Dakota Environmental Education
Program. During these years, the project was funded by various sources,
including the US EPA grant, Minnesota Legislature (LCCMR grant), and
participating cities. Gradually, the number of cities participating in WHEP
increased under the leadership of Charlotte Shover and Dan Huff, and now
Paula Liepold at Dakota County, and others in Hennepin County. Up to
eleven cities/citizen teams have participated in the project in Dakota County. MPCA continues to provide
the training, but the organization of teams and other logistics are handled by the Counties and communities.
Hennepin County joined the project in 2001, and began co-managing with Dakota County in 2002. Dakota
County, the Vermillion River Watershed Joint Powers Organization, participating cities, and North Cannon
River Watershed Management Organization provide funding for Dakota County WHEP. Today, the
program is strong and thriving in both Dakota and Hennepin counties, setting an example for the nation in
volunteer wetland monitoring.
Mark Gernes, Program co-founder (demonstrating his “sedge three-
ranked” pose)
Judy Helgen, Program co-founder

Dakota Co. WHEP January 2018
2017 Report Fortin Consulting, Inc. P a g e | 2
1.2 Why Monitor Wetlands? Why are we sampling the plants and critters that live in wetlands? Many aquatic invertebrates (animals
without a backbone that live in water) spend much or most of their life living in wetlands. Because these
animals are exposed to the conditions within the wetland for a period of time, they serve as indicators of
the health of the wetland. Some are more sensitive to pollution and habitat conditions than are others.
Aquatic plants also respond to wetland conditions. Different plants are found in different water quality and
bottom conditions. If we evaluate what is living in a wetland, we can assess its general condition. When
the same wetlands are monitored over time, the data can also be used to track changes in wetland health.
The information collected by the WHEP volunteers can be used by decision makers to help identify the
highest quality wetland resources and identify those that have been negatively impacted. More information
is available to help with decisions regarding development, transportation corridors, and other areas that may
affect our water resources. For example, wetlands ranked as excellent may receive more protection. Cities
can use this information to evaluate the overall success of creation or restoration projects or to evaluate the
impact of new stormwater inputs.
Citizen volunteers are an essential component to WHEP's success. Each season, volunteers are relied upon
to provide important data on the health of wetlands in their communities. The data collected is used by the
cities, counties, and the State of Minnesota to better plan and protect these environments.
Although ten million acres of wetlands remain, Minnesota has lost approximately 50 percent of its wetlands
since it became a state. Throughout the country, wetlands are being lost due to agriculture, development,
and road expansion. Wetlands play a vital role in ecosystems by filtering runoff for ground water, absorbing
rain and snowmelt before flooding, providing habitat for mammals, birds, amphibians, reptiles, and many
other organisms, and creating beautiful views for our own recreation. Since the adoption of the Minnesota
Wetland Conservation Act, Minnesota has worked to maintain no-net-loss of wetlands.
Everyone involved in Minnesota WHEP past, present, and future can be pleased with their contribution,
and rewarded with increasingly healthier wetland ecosystems to enjoy for years to come.
1.3 Wetland Types Wetlands make up about 6.5 percent (24,501 acres) of the total area in Dakota County. Using the Circular
39 classification system, eight different wetland types are recognized in Minnesota. A description of each
type and estimates of acreage are listed below. Two additional wetland categories are included in the total,
riverine (between banks) and industrial/municipal (dike-related impoundments). WHEP focuses on the
open water wetlands, types 3, 4 and 5.
Type 1 – Seasonally Flooded Basin or Flat: 5,995 acres
Seasonally Flooded Basins or Flats are fully saturated or periodically covered with water, usually with well-
drained soils during much of the growing season. The vegetation varies from bottomland hardwoods to
herbaceous plants depending on the season and length of flooding.
Type 2 – Wet Meadow: 551 acres
Wet Meadow wetlands usually do not have standing water, but have saturated soils within a few inches of
the surface during the growing season. Grasses, sedges, rushes, and various broad-leaved plants dominate
Wet Meadows. Common sites include low prairies, sedge meadows, and calcareous fens.
Type 3 – Shallow Marsh: 12,491 acres
Shallow Marsh wetlands often have saturated soils and six inches or more standing water during the
growing season. Grasses, bulrush, spike rush, cattail, arrowhead, pickerelweed, and smartweed often grow
in these wetlands.
Dakota Co. WHEP January 2018
2017 Report Fortin Consulting, Inc. P a g e | 3
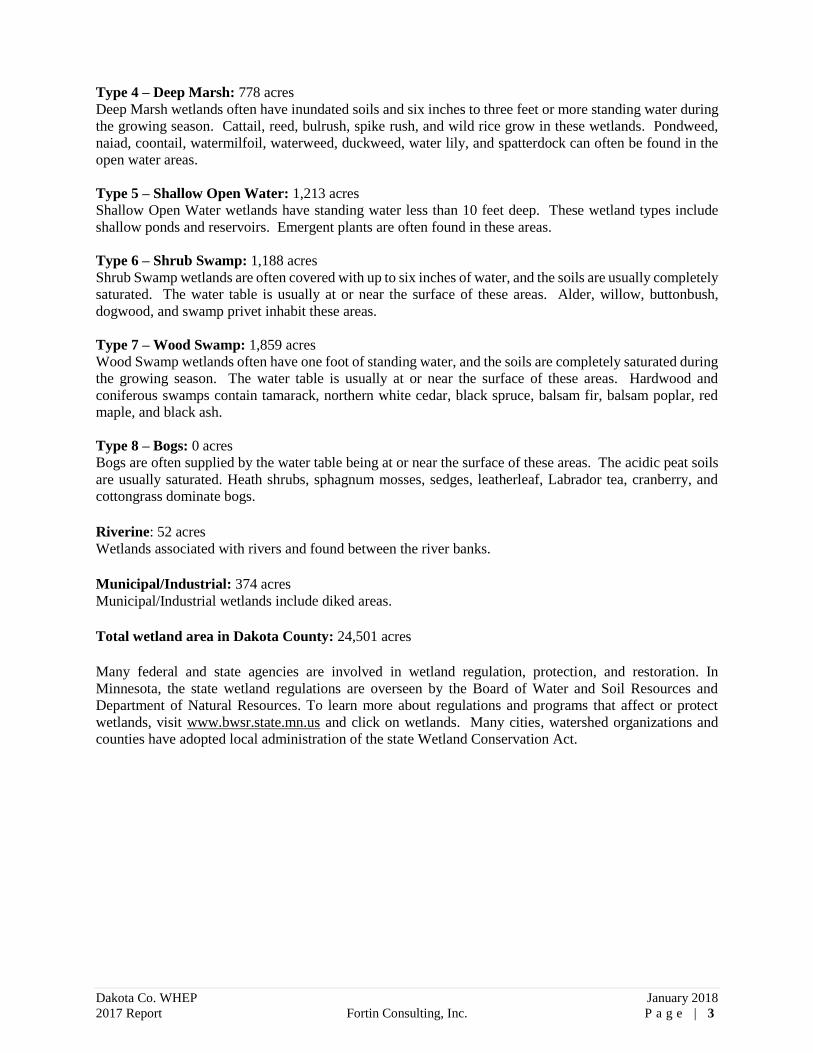
Type 4 – Deep Marsh: 778 acres
Deep Marsh wetlands often have inundated soils and six inches to three feet or more standing water during
the growing season. Cattail, reed, bulrush, spike rush, and wild rice grow in these wetlands. Pondweed,
naiad, coontail, watermilfoil, waterweed, duckweed, water lily, and spatterdock can often be found in the
open water areas.
Type 5 – Shallow Open Water: 1,213 acres
Shallow Open Water wetlands have standing water less than 10 feet deep. These wetland types include
shallow ponds and reservoirs. Emergent plants are often found in these areas.
Type 6 – Shrub Swamp: 1,188 acres
Shrub Swamp wetlands are often covered with up to six inches of water, and the soils are usually completely
saturated. The water table is usually at or near the surface of these areas. Alder, willow, buttonbush,
dogwood, and swamp privet inhabit these areas.
Type 7 – Wood Swamp: 1,859 acres
Wood Swamp wetlands often have one foot of standing water, and the soils are completely saturated during
the growing season. The water table is usually at or near the surface of these areas. Hardwood and
coniferous swamps contain tamarack, northern white cedar, black spruce, balsam fir, balsam poplar, red
maple, and black ash.
Type 8 – Bogs: 0 acres
Bogs are often supplied by the water table being at or near the surface of these areas. The acidic peat soils
are usually saturated. Heath shrubs, sphagnum mosses, sedges, leatherleaf, Labrador tea, cranberry, and
cottongrass dominate bogs.
Riverine: 52 acres
Wetlands associated with rivers and found between the river banks.
Municipal/Industrial: 374 acres
Municipal/Industrial wetlands include diked areas.
Total wetland area in Dakota County: 24,501 acres
Many federal and state agencies are involved in wetland regulation, protection, and restoration. In
Minnesota, the state wetland regulations are overseen by the Board of Water and Soil Resources and
Department of Natural Resources. To learn more about regulations and programs that affect or protect
wetlands, visit www.bwsr.state.mn.us and click on wetlands. Many cities, watershed organizations and
counties have adopted local administration of the state Wetland Conservation Act.
Dakota Co. WHEP January 2018
2017 Report Fortin Consulting, Inc. P a g e | 4
1.4 Dakota County Wetland Monitoring
There are many hands involved in the success of the Dakota County Wetland Health Evaluation Program
(WHEP). It is invaluable to have a dedicated and enthusiastic group of people working together to continue
the success and growth of the program each year.
Paula Liepold has coordinated Dakota County’s WHEP
since 2006. Paula states, “WHEP provides volunteers a
rewarding science-based experience and delivers useable
scientific data to water resource professionals to inform
surface water management. Data and results can be used to
plan restoration approaches, complement other monitoring
programs, compare development impacts on water
resources, or track the condition of wetlands over time.
WHEP is a collaborative endeavor where volunteers learn
from each other, team leaders, and professionals at county
and state levels. Thank you to all WHEP volunteers and
supporters.”
Jeff Korpik is the new Field Coordinating Monitor for
Dakota County WHEP. He I have been involved in WHEP
since 2007 as a volunteer, team leader, and this year as the
Field Coordinator. Jeff expressed “I have enjoyed all
aspects of the program. It was interesting this year not
being on a team. I got to see them all in action and explore
parts of the County that I haven’t been to. I did miss being
on a team, but when a few teams were short-handed, I
chipped in. I look forward to my 2nd year in this
position. Every team seems to be doing a great job and we
have some great team leaders.”

Dakota Co. WHEP January 2018
2017 Report Fortin Consulting, Inc. P a g e | 5
2.0 Methods
2.1 Training Training for citizen monitors is arranged by Dakota and
Hennepin counties and taught by technical experts from the
MPCA and Fortin Consulting. Both classroom and field
sessions are held. Training is provided on vegetation plot
selection/sampling and invertebrate sampling (dip netting and
setting/retrieving bottle traps). Volunteers learn to identify the
vegetation and macroinvertebrates during laboratory
identification sessions which cover sampling protocol, key
characteristics for invertebrate and plant identification, as well
as hands-on identification of live and preserved specimens.
For a more detailed explanation of the methods used in WHEP,
visit www.mnwhep.org.
Minnesota Pollution Control Agency Experts
Part of the success of WHEP is due to the great
assistance provided by the knowledgeable
team of experts from the MPCA. Mark Gernes
and Michael Bourdaghs provide WHEP
vegetation training and technical assistance.
Joel Chirhart and John Genet provide WHEP
macroinvertebrate training and technical
assistance.
Mark Gernes commented, "WHEP is an
opportunity for citizens to learn about wetland
plants and bugs, build lasting friendships all
while helping our local communities protect
and manage water resources. As a watershed
professional I value the contribution citizen
scientists are able to make. Each year I look
forward to recounts of citizen experiences in
their local wetlands."
The MPCA staff support WHEP and have been
very helpful in making WHEP a success.
2.2 Data Collection In order to use the data to interpret the health or condition of the wetlands, a scoring process called the
Index of Biological Integrity (IBI) is used. Separate IBIs are calculated for plants and macroinvertebrates.
Several measures, referred to as metrics, are used to calculate an IBI. The IBI scores are categorized into
poor, moderate or excellent. Biological integrity is commonly defined as "the ability to support and
maintain a balanced, integrated, and adaptive community of organisms having a species composition,
diversity and functional organization comparable to those of natural habitats within a region" (Karr, J. R.
and D. R. Dudley. 1981. Ecological perspectives on water quality goals. Environmental Management 5:
55-68). Biological integrity is equated with pristine conditions, or those conditions with no or minimal
disturbance (U.S.EPA www.epa.gov/bioindicators/html/about.html). Each city participating in WHEP has
Michael Bourdaghs
Joel Chirhart
Mark Gernes
John Genet
Dakota Co. WHEP January 2018
2017 Report Fortin Consulting, Inc. P a g e | 6
identified “reference” wetlands, those that are believed to be minimally disturbed and represent the most
pristine conditions within the city.
Vegetation Index of Biological Integrity (IBI)
Vegetation is analyzed using a 100 square meter releve plot. All
species within the sampling plot are identified to the genus level, and
documented on the field data sheet. Vegetation is divided into
categories based on their ecological function or relationship. The
categories include nonvascular, woody, grass-like and forbs. The forbs
are further subdivided into various submergent and emergent
categories. The number and coverage of genera identified are then
evaluated using the metrics developed by MPCA.
The methodology and evaluation for the vegetation IBI has remained relatively consistent throughout the
project. However, the persistent litter metric calculation was revised in 2004 to reflect average cover values
as compared to maximum cover values. In 2005 and again in 2015, minor changes to the data sheets were
implemented to reduce the number of transcription errors. The scoring criteria were adjusted slightly to
better represent vegetation diversity. Previous changes in methodology have been documented in earlier
summary reports.
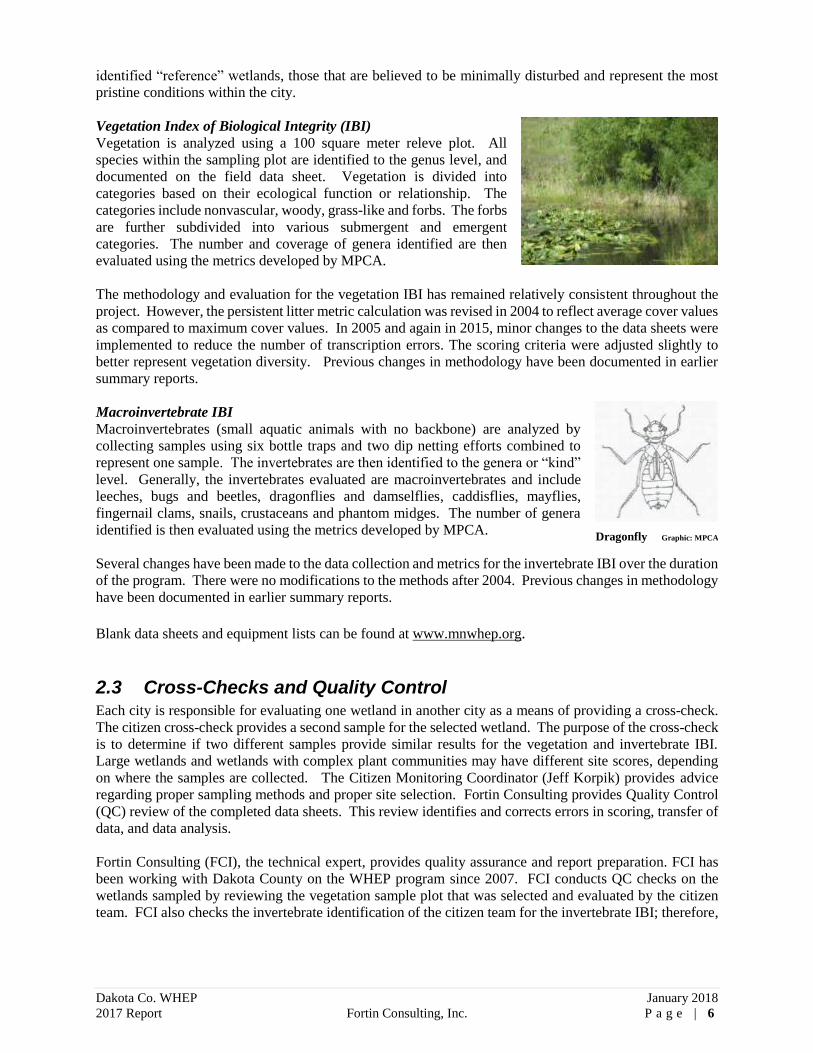
Macroinvertebrate IBI
Macroinvertebrates (small aquatic animals with no backbone) are analyzed by
collecting samples using six bottle traps and two dip netting efforts combined to
represent one sample. The invertebrates are then identified to the genera or “kind”
level. Generally, the invertebrates evaluated are macroinvertebrates and include
leeches, bugs and beetles, dragonflies and damselflies, caddisflies, mayflies,
fingernail clams, snails, crustaceans and phantom midges. The number of genera
identified is then evaluated using the metrics developed by MPCA.
Several changes have been made to the data collection and metrics for the invertebrate IBI over the duration
of the program. There were no modifications to the methods after 2004. Previous changes in methodology
have been documented in earlier summary reports.
Blank data sheets and equipment lists can be found at www.mnwhep.org.
2.3 Cross-Checks and Quality Control Each city is responsible for evaluating one wetland in another city as a means of providing a cross-check.
The citizen cross-check provides a second sample for the selected wetland. The purpose of the cross-check
is to determine if two different samples provide similar results for the vegetation and invertebrate IBI.
Large wetlands and wetlands with complex plant communities may have different site scores, depending
on where the samples are collected. The Citizen Monitoring Coordinator (Jeff Korpik) provides advice
regarding proper sampling methods and proper site selection. Fortin Consulting provides Quality Control
(QC) review of the completed data sheets. This review identifies and corrects errors in scoring, transfer of
data, and data analysis.
Fortin Consulting (FCI), the technical expert, provides quality assurance and report preparation. FCI has
been working with Dakota County on the WHEP program since 2007. FCI conducts QC checks on the
wetlands sampled by reviewing the vegetation sample plot that was selected and evaluated by the citizen
team. FCI also checks the invertebrate identification of the citizen team for the invertebrate IBI; therefore,
Dragonfly Graphic: MPCA

Dakota Co. WHEP January 2018
2017 Report Fortin Consulting, Inc. P a g e | 7
the invertebrate QC is not a second invertebrate sample of
the same wetland site, but a review of the sample collected
and evaluated by the citizen team.
Over the duration of the project, the work of each citizen
team has been reviewed on a rotational basis. The technical
expert reviews 10 percent of the vegetation plots and one
invertebrate collection from each team. In 2017, Fortin
Consulting cross-checked the vegetation plots of four
wetlands, one in Farmington (F-7), Mendota Heights (MH-
2), North Cannon River Watershed (NCR-2), and West St.
Paul (WSP-6). Fortin Consulting also reviewed the
invertebrate samples from sites AV-20, B-1, DC-1, E-41,
F-7, H-6, L-8, MH-2, NCR-2, R-21, SSP-3, and WSP x-check site (H-6). The purpose of the checks is to
determine if the data being collected by the citizen team is accurate and complete, to verify and correct the
samples, and to help the teams better interpret their data and strengthen their vegetation and invertebrate
identification. The tables and graphs in Section 4.0 include the corrected data from both the scoring checks
and the technical quality control checks. The official data scores are derived from the City team’s data
incorporating any corrections made during the technical quality control checks (invertebrate identification
review, vegetation cross-check, and datasheet review) conducted by FCI. Data for the cross-check’s
conducted by another City team is presented in Section 3.2.
2.4 Wetland Scores and Quality Ratings
Each metric, or measure, is evaluated based on the specimens identified and given a score of one, three or
five points. The scores for each metric are then combined to get a total score for the IBI. Table 2-1
illustrates the scoring range for each IBI, the corresponding quality rating, and the scores in percent form.
Table 2.1 Interpretation of site IBI scores.
INVERTEBRATE IBI
SCORE INTERPRETATION
VEGETATION IBI
SCORE INTERPRETATION
Point Scores Quality
Rating
Percent Score Point Scores Quality Rating Percent Score
6 – 14 Poor <50% 7 – 15 Poor <46%
15 – 22 Moderate 50 – 76 % 16 – 25 Moderate 46 – 74%
23 – 30 Excellent >76% 26 – 35 Excellent >74%
The ratings (poor, moderate, and excellent) are useful to give the wetland a qualitative description, which
can make it easier to describe the overall quality of the wetland. A wetland described as having poor quality
would have low species richness (number of species) and diversity and a large number of the species would
likely be pollution tolerant. A wetland of excellent quality would have high diversity and species richness
and would include species that are sensitive to pollution or human disturbance. It should be noted that the
invertebrate and vegetation IBIs have slightly different ratings based on the scoring range. This is due, in
part, to the number of metrics evaluated in each IBI: six for the invertebrate IBI and seven for the vegetation
IBI.
Converting IBI scores to percentages allows for the ability to compare the site scores over several years.
Thus, the trend in the vegetation or invertebrate IBI can be evaluated. Additionally, the percent scores
allow comparison of the IBI results for a given year. This may be helpful to determine if the scores are
consistent, and to determine if additional data collection or more intensive evaluation is necessary to
characterize the wetland.
Connie Fortin, Carolyn Dindorf, Lauren Schultzetenberg, Jessica Jacobson, Madeline Carlson,
Katie Farber, and Roman Rowan,
Dakota Co. WHEP January 2018
2017 Report Fortin Consulting, Inc. P a g e | 8
IBI point scores can be used to directly compare sites for a given year; however, they cannot be used to
compare sites from year to year because:
• The 1998 invertebrate IBI was scored using seven metrics as compared to the six that have been used
in 1999 until present.
• The ranges used to determine the quality rating have been modified since 1998 and numerous scoring
sheet and metric modifications have been occurring as well.
• The total possible score is not the same for the two IBIs (vegetation IBI has seven metrics with a
possible 35 point score while the invertebrate IBI has six metrics with a possible 30 point score).
2.5 Using the Data Biological data can be difficult to interpret and use. Converting the data collected to metrics and indexes
is helpful in interpreting and presenting the data. The methods used in WHEP allow one to identify wetland
health conditions. However, they do not determine the cause of poor wetland health. Once a condition of
poor wetland health is identified and confirmed, additional testing and analysis of the wetland may be
necessary to further define the problem. For example, monitoring of nutrient and/or chloride may be
appropriate. To identify the cause of poor wetland health, analysis of surrounding land use, stormwater
inputs and other potential stressors is the next step.
For those wetlands identified as having excellent wetland health, local governmental organizations may
choose to adopt requirements to provide protection to these wetlands in order to maintain wetland health.
Where poor wetland health or declining trends are indicated, steps may need to be taken to help reverse the
trend. Best management practices (BMPs), actions taken to reduce pollutant loading or stressors to the
wetland, may need to be implemented within the wetland or in the surrounding watershed.
When BMPs are implemented, biological monitoring can be used to help track the impacts of the BMPs on
the wetland. Continued monitoring can identify a change in trend or improvement in a wetland.
Dakota Co. WHEP January 2018
2017 Report Fortin Consulting, Inc. P a g e | 9
3.0 General Results and Recommendations
3.1 2017 Sampling Season Results During the 2017 sampling season, twelve citizen teams (Apple Valley, Burnsville, Dakota County Parks,
Eagan, Farmington, Hastings, Lakeville, Mendota Heights, North Cannon River Watershed Management
Organization, Rosemount, South St. Paul, and West St. Paul) monitored 37 wetlands in ten cities in Dakota
County. Twelve of these wetlands were sampled twice through citizen cross-checks. Four wetland
vegetation samples and twelve invertebrate samples were checked for accuracy through the quality control
check performed by Fortin Consulting.
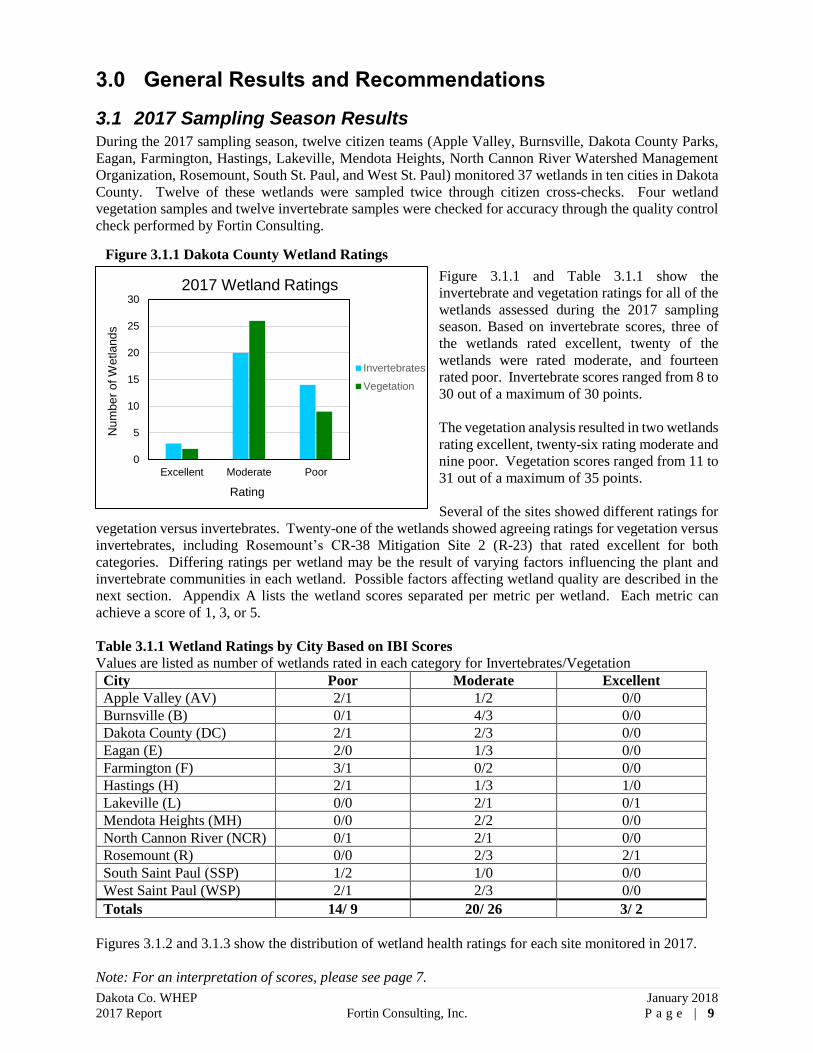
Figure 3.1.1 and Table 3.1.1 show the
invertebrate and vegetation ratings for all of the
wetlands assessed during the 2017 sampling
season. Based on invertebrate scores, three of
the wetlands rated excellent, twenty of the
wetlands were rated moderate, and fourteen
rated poor. Invertebrate scores ranged from 8 to
30 out of a maximum of 30 points.
The vegetation analysis resulted in two wetlands
rating excellent, twenty-six rating moderate and
nine poor. Vegetation scores ranged from 11 to
31 out of a maximum of 35 points.
Several of the sites showed different ratings for
vegetation versus invertebrates. Twenty-one of the wetlands showed agreeing ratings for vegetation versus
invertebrates, including Rosemount’s CR-38 Mitigation Site 2 (R-23) that rated excellent for both
categories. Differing ratings per wetland may be the result of varying factors influencing the plant and
invertebrate communities in each wetland. Possible factors affecting wetland quality are described in the
next section. Appendix A lists the wetland scores separated per metric per wetland. Each metric can
achieve a score of 1, 3, or 5.
Table 3.1.1 Wetland Ratings by City Based on IBI Scores
Values are listed as number of wetlands rated in each category for Invertebrates/Vegetation
City Poor Moderate Excellent
Apple Valley (AV) 2/1 1/2 0/0
Burnsville (B) 0/1 4/3 0/0
Dakota County (DC) 2/1 2/3 0/0
Eagan (E) 2/0 1/3 0/0
Farmington (F) 3/1 0/2 0/0
Hastings (H) 2/1 1/3 1/0
Lakeville (L) 0/0 2/1 0/1
Mendota Heights (MH) 0/0 2/2 0/0
North Cannon River (NCR) 0/1 2/1 0/0
Rosemount (R) 0/0 2/3 2/1
South Saint Paul (SSP) 1/2 1/0 0/0
West Saint Paul (WSP) 2/1 2/3 0/0
Totals 14/ 9 20/ 26 3/ 2
Figures 3.1.2 and 3.1.3 show the distribution of wetland health ratings for each site monitored in 2017.
Note: For an interpretation of scores, please see page 7.
Figure 3.1.1 Dakota County Wetland Ratings
0
5
10
15
20
25
30
Excellent Moderate Poor
2017 Wetland Ratings
Invertebrates
Vegetation
Nu
mb
er
of W
etla
nd
s
Rating

Dakota Co. WHEP January 2018
2017 Report Fortin Consulting, Inc. P a g e | 1 0
Figure 3.1.2 2017 Invertebrate Scores
Figure 3.1.2

Dakota Co. WHEP January 2018
2017 Report Fortin Consulting, Inc. P a g e | 1 1
Figure 3.1.3 2017 Vegetation Scores

Dakota Co. WHEP January 2018
2017 Report Fortin Consulting, Inc. P a g e | 1 2
In an attempt to help identify why there are differences in wetland quality, different factors that impact
the wetlands were evaluated.
3.1.1 Aquatic Invasive Species and Wetland Health
Invasive species are non-native organisms that spread to ecosystems beyond their natural historic range,
causing harm to economic, environmental, or human health. Aquatic invasive species (AIS) are invasive
species more generally found in or near water. Invasive species are often aggressive, spread quickly, and
take over areas. They impact native habitat and species diversity. They may be introduced to new areas
by wind, water, animals, humans, and other means of transport.
Early detection of invasive species can greatly reduce their success and spread. New infestations or smaller
populations of invasive species require less resources to control, and chances of eradication are improved.
Once established, invasive species are very difficult and expensive to control, and eradication is unlikely.
Detecting and reporting the presence of invasive species early in their introduction to a new area is key.
WHEP provides an opportunity for aquatic invasive species to be detected and reported early so that control
can be implemented before they take over a wetland.
Aquatic invasive species education and early detection tools have been incorporated into WHEP, preparing
WHEP volunteers as early detectors. WHEP volunteers receive AIS training including a presentation
highlighting AIS to watch for, identification tips and techniques, and how to record and report AIS to
authorities. Hands-on identification practice of native and non-native species is also offered at the
invertebrate and vegetation trainings to heighten species recognition, demonstrate comparisons of species,
and improve identification skills. WHEP volunteers also receive AIS identification materials, including
the AIS Identification Guide by the University of Minnesota CFANS, and the Aquatic Invasive Species
Early Detectors: A How to Guide by Minnehaha Creek Watershed District. Each team receives AIS early
detection field data sheets to record findings during each wetland visit.
Invasive species that have not yet been introduced to Minnesota or exist in limited distribution, but are
known to thrive in neighboring states with similar climates and ecosystems are being targeted for early
detection. Highlighted species in WHEP training include starry stonewort (Nitellopsis obtuse), Hydrilla
(Hydrilla verticillata), Brazilian elodea (Egeria densa), brittle naiad (Najas minor), Carolina fanwort
(Cabomba caroliniana), water chestnut (Trapa natans), flowering rush (Butomus umbellatus), yellow iris
(Iris pseudacorus), non-native phragmites (Phragmites australis), water hyacinth (Eichhornia crassipes),
water lettuce (Pistia stratiotes), and other invasive species already found in the wetlands.
WHEP teams are expected to report the presence of invasive species in the wetlands that they monitor.
Findings in 2017 were as expected. Many of the WHEP wetlands have been found to contain invasive
species, but no early detection species were observed in 2017. Reed canary grass (Phalaris arundinacea)
and purple loosestrife (Lythrum salicaria) are two common wetland invaders. Eurasian watermilfoil
(Myriophyllum spicatum), curly-leaf pondweed (Potamogeton crispus), Chinese mystery snails
(Cipangopaludina chinensis), and banded mystery snails (Viviparus georgianus) were also observed in
wetlands monitored in 2017. Reed canary grass was found in 86 percent of the wetlands, purple loosestrife
was found in 19 percent of the wetlands, Eurasian watermilfoil and curly-leaf pondweed were each found
in 5 percent of the wetlands, Chinese mystery snails were found in 16 percent of the wetlands, and banded
mystery snails were found in 5 percent of the wetlands. In addition, buckthorn was reported in eight of the
wetlands, and invasive honeysuckle was found in one of the wetlands. It is possible that other invasive
species exist in wetlands, but were not observed near monitoring sites at each wetland. Appendix B shows
the history of invasive species presence in WHEP monitored wetlands.
An analysis of variance (ANOVA) was completed to determine if the differences in wetland health scores
were affected by the presence of invasive species, and statistically significant. Differences in IBI scores
for wetlands with invasive species present vs. not present were not statistically significant.
Dakota Co. WHEP January 2018
2017 Report Fortin Consulting, Inc. P a g e | 1 3
3.1.2 Natural versus Altered Wetlands
Wetlands were classified as natural, altered by stormwater input, or created based on information provided
in the site identification form or from city staff. The average score of each site was used. In the past, WHEP
team leaders have commented that the created wetlands seem to exhibit poorer insect diversity. The site
averages indicate that created, stormwater, and natural wetlands are scoring similarly (Appendix B). An
analysis of variance (ANOVA) was completed to determine if the differences were statistically significant.
Differences in IBI scores comparing natural, created, and stormwater wetlands were not statistically
significant. In addition, an ANOVA comparing IBI scores for natural, created and stormwater, showed no
statistically significant difference between the three scores.
The score range between the created, stormwater, and natural wetlands is similar. The most recent
invertebrate scores for each wetland show the lowest invertebrate scores for created, stormwater, and
natural wetland, respectively, are 6, 8, 8. The highest invertebrate scores, respectively, are 30, 28, 28. The
lowest vegetation scores for created, stormwater, and natural wetlands, respectively, are 11, 9, 11. The
highest vegetation scores, respectively, are 27, 31, 27.
Wetland health scores vary from year to year. In 2017, the wetland health was not affected by the type of
wetland (created, stormwater, or natural). One would expect that natural wetlands would support the richest
and most diverse invertebrate and plant communities. Stormwater altered wetlands tend to have a greater
short-term bounce (increase or decrease in water level) and more frequent fluctuations than natural
wetlands. They are also inundated with pollutants found in stormwater. Created wetlands likely receive
stormwater and thus would have some of the same impacts as stormwater wetlands and would take time to
colonize. These factors are also likely to affect the type and diversity of plants found in the wetlands.
At this time, there is no statistical data indicating a decreased invertebrate community in natural versus
disturbed or created wetlands. These results infer that the created wetlands are functioning similarly to the
natural wetlands as far as the biological community. See Appendix C for detailed data.
3.1.3 Impervious Area in the Watershed
Data on percent impervious area (hard cover such as streets, parking lots and rooftops) in the watershed
was compiled for each wetland based on the site identification forms submitted by each team sponsor.
Wetlands with higher impervious areas in the watershed, likely receive more runoff and pollutants.
Impervious areas ranged from 0 to 80% (Table 3.1.3). Studies have shown that stream degradation occurs
at low levels of imperviousness (about 10%)1. A similar relationship may exist for wetlands too. Linear
regressions completed in previous reports have not shown any relationship between imperviousness and
IBI scores. Watershed impervious area is likely a factor affecting wetland vegetation and invertebrate life,
but there are other factors that are impacting these communities. Appendix D contains wetland and
watershed data.
1Schueler, T. 2000. The Importance of Imperviousness, Article 1 in The Practice of Watershed Protection. Center for
Watershed Protection. Ellicott City, MD.
3.1.4 Effect of Wetland Water Levels on Wetland Health
Wetland water levels fluctuate from year to year. They may fluctuate daily in response to rainfall and
drought, as well. Water levels may affect site sampling placement. High water levels may push plots
farther upland than normally placed. Water levels may also affect the species dominance and diversity.
Wetter conditions may encourage more submergent and emergent species of vegetation. Drought, of
course, may reduce the population of invertebrates. Water levels were measured by volunteer WHEP teams
in 2017 within the vegetation plot sites. The lowest water level measured within the plots in 2017 was zero
feet, the highest water level was 4.9 feet (1.5 m), and the average water level was 1.9 feet. A linear
regression was completed to compare IBI scores to average plot depth. No significant relationship between
IBI score and average plot depth was found for either invertebrates or vegetation. Results assume that
vegetation and invertebrates sampling occurred in the same general vicinity of the wetland.

Dakota Co. WHEP January 2018
2017 Report Fortin Consulting, Inc. P a g e | 1 4
3.2 Is Volunteer Data Usable? WHEP was designed with several layers of quality assurance and quality control to be able to identify and
correct potential errors. This was put into place to make sure the data collected is scientifically justifiable
and will be used. The WHEP protocol includes standard annual trainings; citizen monitoring leaders and
team leaders that check on the team’s collection methods, data entry, and metric calculations; cross-checks
by other teams; and quality control checks by a professional consultant. With all of these checks in place,
data users can be assured that the data and information presented is acceptable.
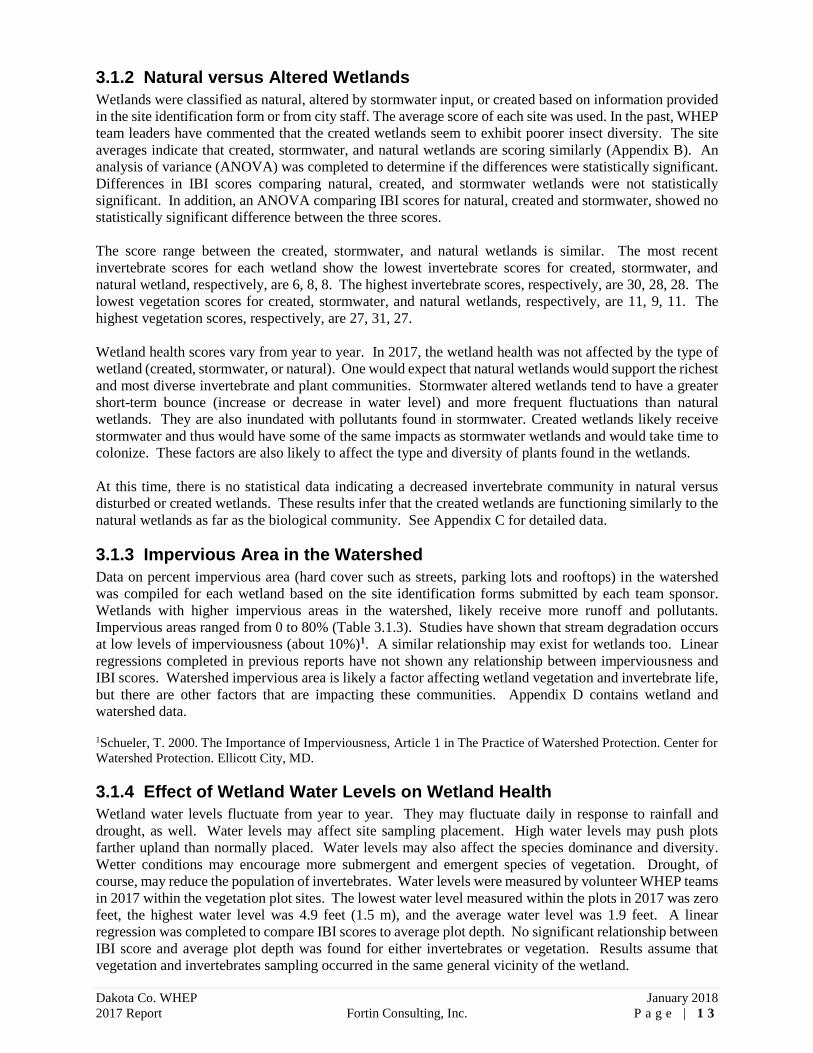
3.2.1 2017 Cross-checks
Each city team was responsible for evaluating one wetland in another city (Table 3.2.1). This citizen cross-
check provides a second sample for the selected wetland. The purpose of this check is to determine if two
different samples provide similar results for the vegetation and invertebrate IBI. Large wetlands and
wetlands with complex plant communities may have different site scores, depending on where the samples
are collected. The two samples are considered consistent if the IBI scores differ by six points or less. The
majority of the samples are consistent (Table 3.2.1 and Figure 3.2.1). Invertebrate scores for DC-2, H-6,
and R-21 were inconsistent, differing by 10, 10, 14 points, respectively. Vegetation scores for site DC-2
were inconsistent, differing by 10 points. The varied scores may indicate a difference in sampling
technique, a change in conditions between sample dates, differences in identification accuracy, or some
other cause. Below lists the obvious differences in scoring for those wetlands that were inconsistent. Data
collected by the original City team is used for the individual wetland analysis in Section 4.0 of this report.
Vegetation scores between City team and cross-check team for sites WSP-6 were identical. Many scores
were close in comparison.
• DC-2: The cross-check team identified a more diverse invertebrate community than the City team.
This affected the Leech, ETSD, and Snail Metrics.
• DC-2: The cross-check team identified a more diverse vegetation community than the City team.
This affected the Vascular, Grasslike, Carex, and Utricularia Metrics.
• H-6: The City team identified a more diverse invertebrate community than the cross-check team.
This affected the Odonata, ETSD, and Snail Metrics.
• R-21: The City team identified a more diverse invertebrate community than the cross-check team.
This affected the Leech, Corixidae, Odonata, ETSD, and Snail Metrics.
Table 3.2.1 Citizen cross-checks (those considered inconsistent are shown in bold)
City Team Cross-Check
Team
Wetland Evaluated
Invertebrate Score
Comparison City x-Check
Vegetation
Score Comparison City x-Check
Apple Valley Lakeville AV-12 14 20 21 19
Burnsville Dakota Co Parks B-1 18 16 21 17
Dakota County
Parks Burnsville DC-2 14 24 17 27
Eagan Rosemount E-18 14 20 17 19
Farmington North Cannon
River WMO F-7 10 16 25 21
Hastings West St. Paul H-6 22 12 21 19
Lakeville Apple Valley L-8 16 14 19 17
Mendota Heights South St. Paul MH-2 18 20 21 17
Rosemount Eagan R-21 28 14 23 17
North Cannon
River WMO Farmington NCR-2 20 16 17 13
South St. Paul Mendota Heights SSP-1 12 14 15 17
West St. Paul Hastings WSP-6 10 14 15 15
Dakota Co. WHEP January 2018
2017 Report Fortin Consulting, Inc. P a g e | 1 5
Figure 3.2.1 Cross-check Comparisons of IBI Scores
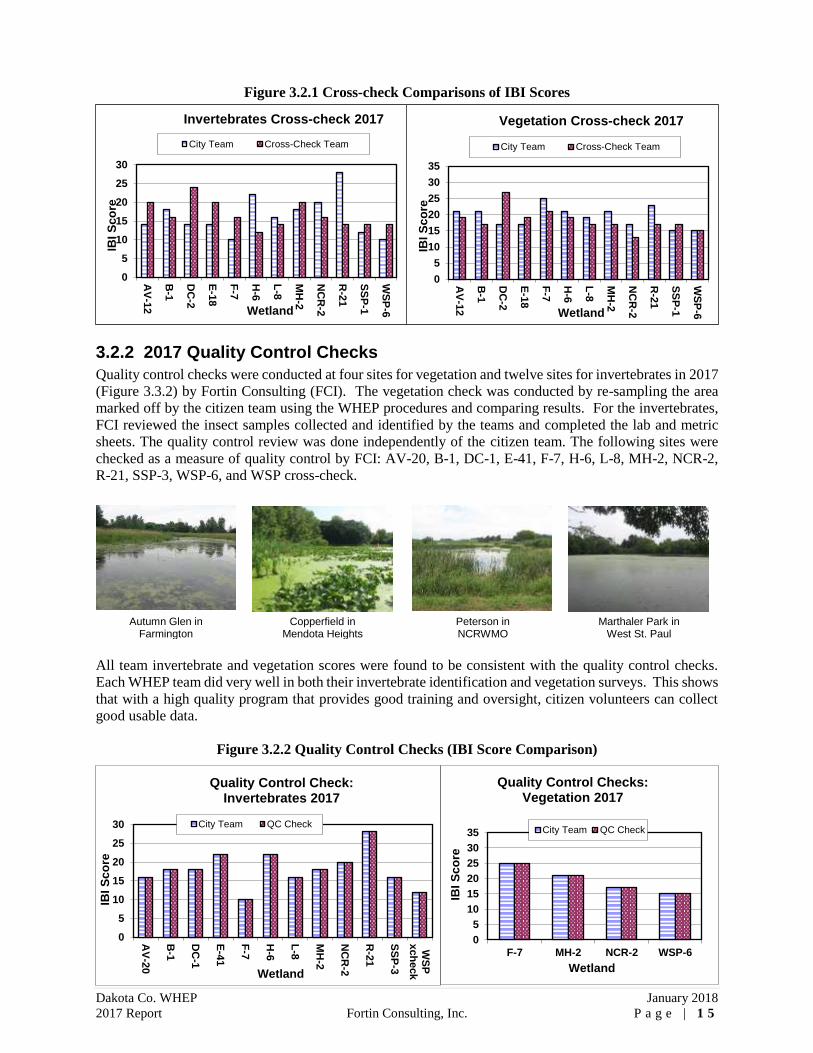
3.2.2 2017 Quality Control Checks
Quality control checks were conducted at four sites for vegetation and twelve sites for invertebrates in 2017
(Figure 3.3.2) by Fortin Consulting (FCI). The vegetation check was conducted by re-sampling the area
marked off by the citizen team using the WHEP procedures and comparing results. For the invertebrates,
FCI reviewed the insect samples collected and identified by the teams and completed the lab and metric
sheets. The quality control review was done independently of the citizen team. The following sites were
checked as a measure of quality control by FCI: AV-20, B-1, DC-1, E-41, F-7, H-6, L-8, MH-2, NCR-2,
R-21, SSP-3, WSP-6, and WSP cross-check.
All team invertebrate and vegetation scores were found to be consistent with the quality control checks.
Each WHEP team did very well in both their invertebrate identification and vegetation surveys. This shows
that with a high quality program that provides good training and oversight, citizen volunteers can collect
good usable data.
Figure 3.2.2 Quality Control Checks (IBI Score Comparison)
0
5
10
15
20
25
30
35
AV
-12
B-1
DC
-2
E-1
8
F-7
H-6
L-8
MH
-2
NC
R-2
R-2
1
SS
P-1
WS
P-6
IBI
Sc
ore
Wetland
Vegetation Cross-check 2017
City Team Cross-Check Team
0
5
10
15
20
25
30
AV
-12
B-1
DC
-2
E-1
8
F-7
H-6
L-8
MH
-2
NC
R-2
R-2
1
SS
P-1
WS
P-6
IBI
Sc
ore
Wetland
Invertebrates Cross-check 2017
City Team Cross-Check Team
Autumn Glen in Farmington
Copperfield in Mendota Heights
Peterson in NCRWMO
Marthaler Park in West St. Paul
0
5
10
15
20
25
30
35
F-7 MH-2 NCR-2 WSP-6
IBI
Sc
ore
Wetland
Quality Control Checks: Vegetation 2017
City Team QC Check
0
5
10
15
20
25
30
AV
-20
B-1
DC
-1
E-4
1
F-7
H-6
L-8
MH
-2
NC
R-2
R-2
1
SS
P-3
WS
Pxch
eck
IBI
Sc
ore
Wetland
Quality Control Check: Invertebrates 2017
City Team QC Check

Dakota Co. WHEP January 2018
2017 Report Fortin Consulting, Inc. P a g e | 1 6
WHEP also provides review of the data sheets for scoring and data transfer errors. This review is conducted
by Fortin Consulting. Table 3.2.2 shows the data sheet review results. There were 24 transfer errors. Either
the data collected was incorrectly transferred to their proper metrics or metric scores were not successfully
transferred from one set of calculations to the next. Four errors were caused by miscalculating metric
scores. Corrections affected the scores by zero to six points. Many of these errors could be prevented by
double-checking the transfer and math work on the data sheets. The quality control checks are working
well. Errors are identified and corrections are made as needed.
Table 3.2.2 Data Sheet Review Invertebrate IBI Scores Vegetation IBI Scores
Team Name Site Team Review Errors Team Review Errors
Apple Valley AV-10 8 8 0 19 17 1
AV-12 14 14 0 23 21 1
AV-20 16 16 0 17 15 1
L-8 cc* 14 14 0 19 17 1
Burnsville B-1 18 18 0 21 21 0
B-3 22 22 0 17 17 0
B-8 22 22 0 11 11 0
B-13 18 18 0 17 17 0
DC-2 cc* 24 24 0 27 27 0
Dakota Co DC-1 18 18 0 21 21 0
DC-2 14 14 0 17 17 0
DC-3 8 8 0 15 15 0
DC-4 18 18 0 19 19 0
B-1 cc* 16 16 0 17 17 0
Eagan E-18 15 14 2 15 17 1
E-41 16 22 5 19 23 5
E-42 14 12 2 19 19 5
R-21 cc* 14 14 0 17 17 0
Farmington F-3 14 14 0 20 21 1
F-7 10 10 0 25 25 0
F-8 12 12 0 15 15 0
NCR-2 cc* 16 16 0 13 13 0
Hastings H-4 10 10 0 17 17 0
H-6 22 22 0 21 21 0
H-56 28 28 0 19 19 0
H-57 12 14 1 15 15 0
WSP-6 cc* 14 14 0 15 15 0
Lakeville L-7 18 18 0 31 31 0
L-8 16 16 0 19 19 0
AV-12 cc* 20 20 0 19 19 0
Mendota Heights MH-2 18 18 0 21 21 0
MH-4 16 16 0 17 17 0
SSP-1 cc* 14 14 0 17 17 0
NCRWMO NCR-1 20 20 0 15 15 0
NCR-2 20 20 0 17 17 0
F-7 cc* 16 16 0 21 21 0

Dakota Co. WHEP January 2018
2017 Report Fortin Consulting, Inc. P a g e | 1 7
Invertebrate IBI Scores Vegetation IBI Scores
Team Name Site Team Review Errors Team Review Errors
Rosemount R-4 16 18 1 17 17 0
R-14 22 22 0 21 21 0
R-21 28 28 0 23 23 0
R-23 30 30 0 27 27 0
E-18 cc* 20 20 0 19 19 0
South St. Paul SSP-1 12 12 0 15 15 0
SSP-3 16 16 0 15 15 0
MH-2 cc* 20 20 0 17 17 0
West St. Paul WSP-3 20 20 0 17 17 0
WSP-4 12 12 0 17 17 0
WSP-6 10 10 0 15 15 0
WSP-8 16 16 0 17 17 0
H-6 cc* 12 12 0 17 19 1
cc*- indicates cross-check of another team’s wetland
3.3 WHEP Historical Data Since WHEP began in 1997, 184 wetlands have been sampled, but not all are sampled every year. Figures
3.3.1 and 3.3.2 provide an overall picture of wetland health in Dakota County based on the most recent
sample collected for each wetland. The historical data can be found for each site since the start of the
program at www.mnwhep.org. Section 4.0 includes the sites sampled in 2017 with an analysis of historical
data, identifying sampling history and trends based on a trend analysis for those with adequate data. There
is a spread in the distribution of poor, moderate and excellent ratings.

Dakota Co. WHEP January 2018
2017 Report Fortin Consulting, Inc. P a g e | 1 8
Figure 3.3.1 Most Recent Invertebrate Scores

Dakota Co. WHEP January 2018
2017 Report Fortin Consulting, Inc. P a g e | 1 9
Figure 3.3.2 Most Recent Vegetation Scores

Dakota Co. WHEP January 2018
2017 Report Fortin Consulting, Inc. P a g e | 2 0
4.0 Wetland Evaluations
4.1 Apple Valley Wetlands
Three wetlands were monitored within
the City of Apple Valley in 2017. This
is the 20th year the City has
participated in WHEP! Twenty
wetlands have been monitored in
Apple Valley since the initiation of
WHEP in 1997.
Team Leaders: Katie Koch-Laveen
and Cindy Taintor
Team Members: Brad Blackett,
Emma Edwards, Kathy Joroensen,
Mikayla Lindquist, Kris Reiners, Larry
Reiners, Katie Traub, and Tessa
Venables
Katie Koch-Laveen is co-leader of the Apple Valley WHEP team. She has been
involved in WHEP since 2000, being a long-time team leader of the Farmington
team. After a year off, she returned to the program in 2017, to join Apple Valley.
She stated, “The Apple Valley Team had many volunteers of different ages - high
school to retired. Volunteers showed up regularly and shared all
responsibilities. To count bugs and complete reports we went the biology labs
of Apple Valley High School and worked with at the same time the Farmington
Team was similarly engaged. The joint effort worked out well. We were pleased
to see the Apple Valley City folks also come and observe the lab work.”
Cindy Tainter is co-leader of the Apple Valley WHEP
team. This is her first year as team leader; however,
she has been volunteering for WHEP since 2009. She commented, “I was
grateful that Katie Koch-Laveen came out of retirement to be my co-leader. Her
knowledge, experience and helpful presence made it successful and enjoyable. I
need to also give credit to Jeff Korpik, who was the previous team leader in Apple
Valley. My team consisted of very dedicated volunteers this year, and we couldn't
do it without a hardworking team.
“I have been a team member on the Apple Valley WHEP team for several years.
Biology classes were always my favorite studies in college, although that was not
my major. A few years after moving to Apple Valley, I saw a notice in the paper
about the opportunity to join a wetland team. Training was included and experience not required, so I was
immediately interested. Getting out into the wetlands is fascinating. Knowing that the data we gather is
reliable and useful is very satisfying. Nobody fell in, and the mosquitoes were barely noticeable. It was a
great first year as team leader.”
Cindy Taintor
Katie Koch-Laveen

Dakota Co. WHEP January 2018
2017 Report Fortin Consulting, Inc. P a g e | 2 1
Jessica Schaum started with Apple Valley as their Natural Resources
Coordinator three years ago, and serves as a City contact for WHEP. She
remarked, “I was immediately impressed with the ongoing water quality
programs and volunteer base Apple Valley is fortunate enough to
have. WHEP is truly an instrumental program that allows us to track local
trends and impacts over time. We utilize this data when evaluating
conditions for a new road project, when a nearby site might be redeveloped,
or in determining the best stormwater feature we could use
upstream. Sometimes unexpected projects come up – like the future North
Creek Greenway trail near our reference wetland. It will be interesting to
see potential benefits of the overall project somewhere we already have
compiled data. We have come to rely and depend on our volunteers for this
service, and without them I’m not sure we could accomplish even half of the
work on our own! I look forward to another successful year in establishing
and tracking our wetland trends.”
Jane Byron is the Water Quality Technician for the City of Apple Valley. Her
primary role in WHEP is to assist in wetland selections and provide some of the
administrative assistance needed from the City of Apple Valley. She says, "The
City finds the information gathered by WHEP volunteers invaluable. In recent
years, the data gathered has allowed us to supplement information from other
studies on some of our most impacted wetlands to give a much more detailed
picture of the quality of selected wetlands. The baseline picture painted by the
information gathered will help us gauge the success of future projects to improve
water quality. We cannot thank our volunteers enough for the important service
they provide."
Apple Valley General Wetland Health
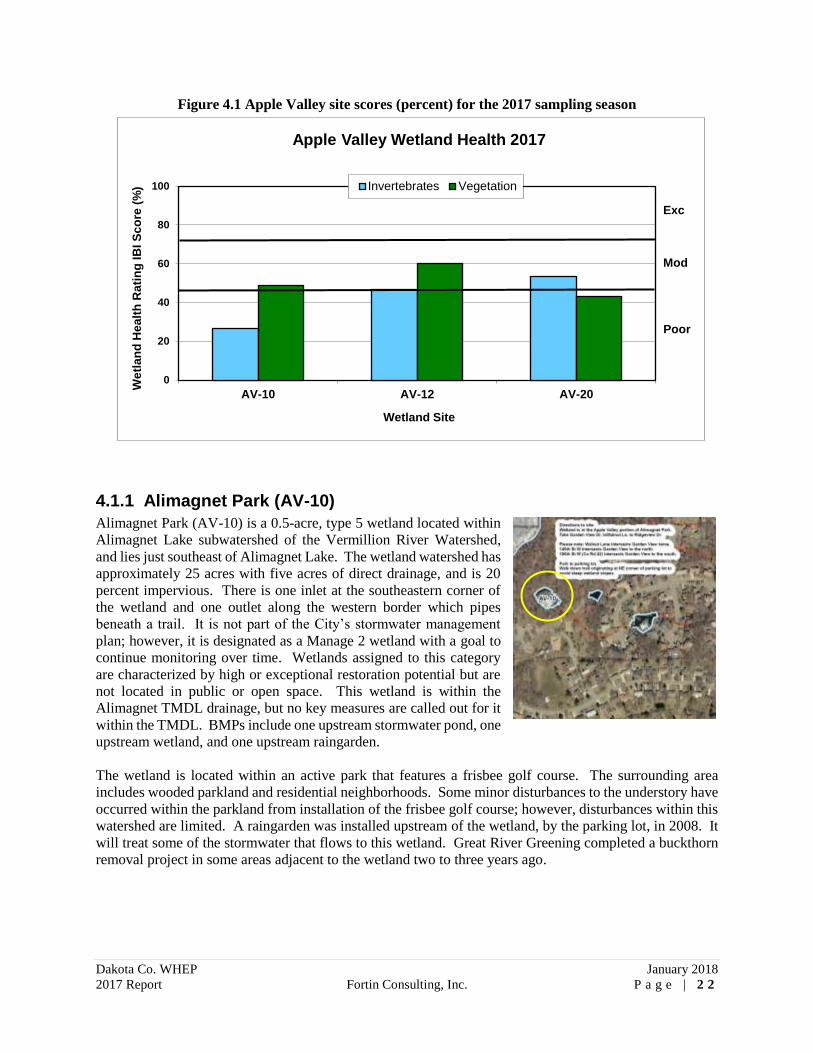
Figure 4.1 presents an overall view of wetland health for all of the 2017
monitoring sites in Apple Valley based on the IBI scores for
invertebrates and vegetation presented as a percent. Figure 4.1 also
illustrates the consistency between the IBI scores (in percent form) for
each wetland sampled. Invertebrate and vegetation scores that differ by
ten percent or less are considered consistent. Based on the IBI scores, a
wetland health rating is assigned as excellent, moderate or poor. The
Apple Valley wetlands exhibited poor to moderate wetland health based
on both invertebrate and vegetation data; however, the invertebrate and
vegetation ratings opposed each other in all three wetlands. Invertebrate
and vegetation scores for AV-20 measured a ten percent scoring
difference. The invertebrates and vegetation scores for AV-10 and AV-
12 were inconsistent and differed by 22 and 13 percent, respectively.
Jane Byron
Jessica Schaum
Apple Valley team at invertebrate training
Dakota Co. WHEP January 2018
2017 Report Fortin Consulting, Inc. P a g e | 2 2
Figure 4.1 Apple Valley site scores (percent) for the 2017 sampling season
4.1.1 Alimagnet Park (AV-10)
Alimagnet Park (AV-10) is a 0.5-acre, type 5 wetland located within
Alimagnet Lake subwatershed of the Vermillion River Watershed,
and lies just southeast of Alimagnet Lake. The wetland watershed has
approximately 25 acres with five acres of direct drainage, and is 20
percent impervious. There is one inlet at the southeastern corner of
the wetland and one outlet along the western border which pipes
beneath a trail. It is not part of the City’s stormwater management
plan; however, it is designated as a Manage 2 wetland with a goal to
continue monitoring over time. Wetlands assigned to this category
are characterized by high or exceptional restoration potential but are
not located in public or open space. This wetland is within the
Alimagnet TMDL drainage, but no key measures are called out for it
within the TMDL. BMPs include one upstream stormwater pond, one
upstream wetland, and one upstream raingarden.
The wetland is located within an active park that features a frisbee golf course. The surrounding area
includes wooded parkland and residential neighborhoods. Some minor disturbances to the understory have
occurred within the parkland from installation of the frisbee golf course; however, disturbances within this
watershed are limited. A raingarden was installed upstream of the wetland, by the parking lot, in 2008. It
will treat some of the stormwater that flows to this wetland. Great River Greening completed a buckthorn
removal project in some areas adjacent to the wetland two to three years ago.
0
20
40
60
80
100
AV-10 AV-12 AV-20
We
tla
nd
He
alt
h R
ati
ng
IB
I S
co
re (
%)
Wetland Site
Apple Valley Wetland Health 2017
Invertebrates Vegetation
Exc
Mod
Poor

Dakota Co. WHEP January 2018
2017 Report Fortin Consulting, Inc. P a g e | 2 3
Wetland Health
Site Observations: The wetland has a gentle slope and very mucky substrate. Duckweed covers the
wetland surface. Fallen trees lay in the water. Trees line the east and south edges, and patches of grasses
sprout along the west and north edges of the wetland. A painted turtle and a family of mallards were
observed.
Table 4.1.1 Alimagnet Park (AV-10) Wetland Health based on Index of Biotic Integrity (IBI)
2017 Data (AV-10)
Invertebrates
Vegetation
Wetland Health Rating (IBI score) Poor (8) Moderate (17)
Trend 2007-2017 Not enough data Not enough data
Figure 4.1.1 Invertebrate and vegetation trends for Alimagnet Park (AV-10)
Site Summary: Alimagnet Park has been surveyed three times since 2007; but has not been surveyed since
2012. Invertebrate health scores have remained poor all three surveys. The vegetation health scores were
poor in past surveys, but in 2017 improved to moderate. The health scores have declined since the initial
surveys in the early 2000’s, and the health trends agree. In 2017, very few invertebrates were collected
including one family of leech, one family of snail, one family of clams, and three individual true bugs. The
vegetation plot contained no submergent vegetation. Floating vegetation covered nearly 100 percent of the
wetland surface. Dense floating vegetation can shade out submergent vegetation. Sparse submergent
vegetation will limit invertebrate habitat.
0
20
40
60
80
100
2007 2009 2011 2013 2015 2017
Alimagnet Park (AV-10) 2007-2017
Invertebrates Vegetation
Invertebrates Trend Vegetation Trend
IBI S
co
re(%
)

Dakota Co. WHEP January 2018
2017 Report Fortin Consulting, Inc. P a g e | 2 4
4.1.2 Everest Pond (AV-12)
Everest Pond (AV-12), also known as EVR-P12 and Public
Water 19-225W, is a 5.7-acre, type 5 wetland within the EVR-
P12 subwatershed within the Vermillion River Watershed. The
subwatershed has approximately 527 acres of total drainage in
which all 61 acres drain directly. There is one inlet in the
northwest corner of the wetland, and one inlet along the
southwestern shoreline. There is one outlet in the northwest
corner of the wetland, and one outlet along the northeastern
shoreline. Everest Pond is part of the City’s stormwater
management plan and is designated as a Manage 1 wetland.
Wetlands in this classification have medium floral
diversity/integrity, but also have direct stormwater input. The
wetland must have high or exceptional restoration potential and be located in public or open space in order
to meet the restoration classification.
This wetland is a key drainage area to Long Lake and Farquar lake,
both of which are impaired for phosphorus. Approximately 68
percent of the external phosphorus load entering Long Lake comes
from this pond. Several projects have been completed in the pond
and the overall drainage as part of addressing the TMDL. The area
surrounding this wetland is primarily residential. More than half of
the wetland is surround by a wooded buffer, and the rest by
manicured lawn. There are algal blooms in the summer, and the
presence of goldfish has been noted.
Wetland Health
Site Observations: The nearshore area is woody and includes willow, aspen, and cottonwood trees. Some
duckweed and cattails are present. Reed canary grass is present. There is a gentle slope, and the substrate
is clay/sand mix. Rocks and other submerged hazards exist. Minnows, sunfish, and bluegills were observed
in the nearshore water. Mystery snails were observed/collected from this wetland.
Table 4.1.2 Everest Pond (AV-12) Wetland Health based on IBI
2017 Data (AV-12)
Invertebrates
Vegetation
Wetland Health Rating (IBI score) Poor (14) Moderate (21)
Cross-check Rating (IBI score) Moderate (20) Moderate (19)
Trend 2007-2017 Not enough data Not enough data
Long Lake
Apple Valley team in lab
Dakota Co. WHEP January 2018
2017 Report Fortin Consulting, Inc. P a g e | 2 5
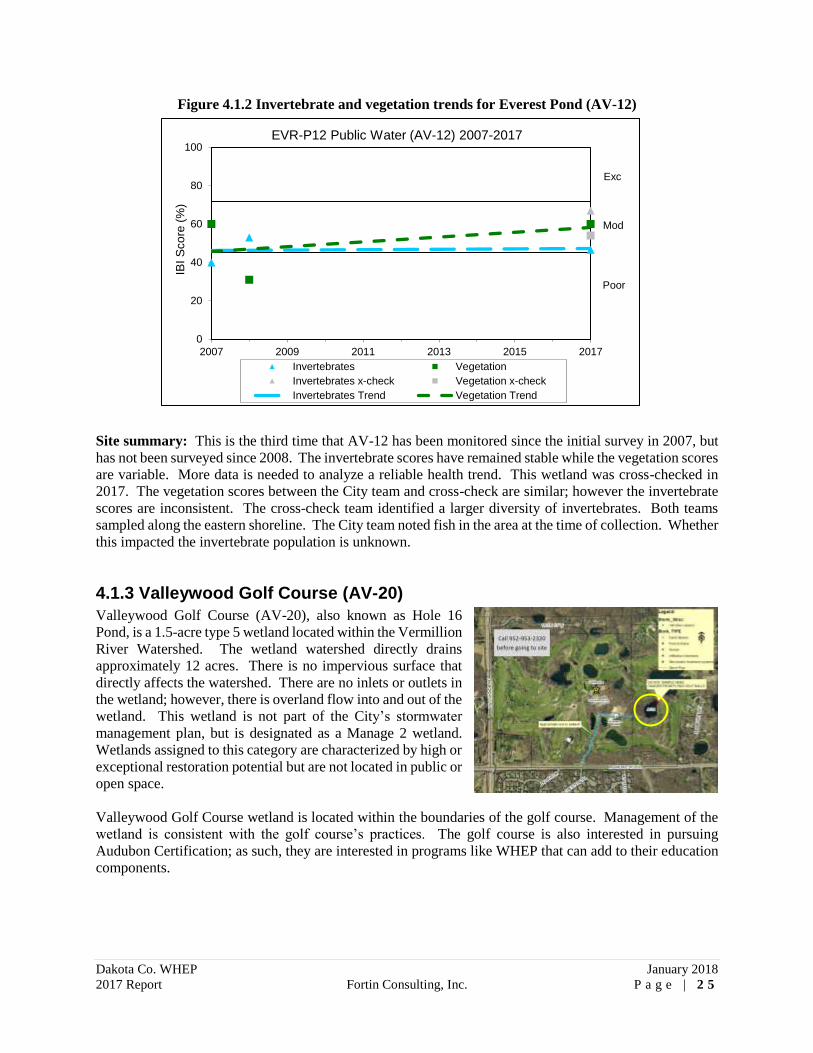
Figure 4.1.2 Invertebrate and vegetation trends for Everest Pond (AV-12)
Site summary: This is the third time that AV-12 has been monitored since the initial survey in 2007, but
has not been surveyed since 2008. The invertebrate scores have remained stable while the vegetation scores
are variable. More data is needed to analyze a reliable health trend. This wetland was cross-checked in
2017. The vegetation scores between the City team and cross-check are similar; however the invertebrate
scores are inconsistent. The cross-check team identified a larger diversity of invertebrates. Both teams
sampled along the eastern shoreline. The City team noted fish in the area at the time of collection. Whether
this impacted the invertebrate population is unknown.
4.1.3 Valleywood Golf Course (AV-20)
Valleywood Golf Course (AV-20), also known as Hole 16
Pond, is a 1.5-acre type 5 wetland located within the Vermillion
River Watershed. The wetland watershed directly drains
approximately 12 acres. There is no impervious surface that
directly affects the watershed. There are no inlets or outlets in
the wetland; however, there is overland flow into and out of the
wetland. This wetland is not part of the City’s stormwater
management plan, but is designated as a Manage 2 wetland.
Wetlands assigned to this category are characterized by high or
exceptional restoration potential but are not located in public or
open space.
Valleywood Golf Course wetland is located within the boundaries of the golf course. Management of the
wetland is consistent with the golf course’s practices. The golf course is also interested in pursuing
Audubon Certification; as such, they are interested in programs like WHEP that can add to their education
components.
0
20
40
60
80
100
2007 2009 2011 2013 2015 2017
IBI
Sco
re (
%)
EVR-P12 Public Water (AV-12) 2007-2017
Invertebrates Vegetation
Invertebrates x-check Vegetation x-check
Invertebrates Trend Vegetation Trend
Exc
Mod
Poor
Dakota Co. WHEP January 2018
2017 Report Fortin Consulting, Inc. P a g e | 2 6
Wetland Health
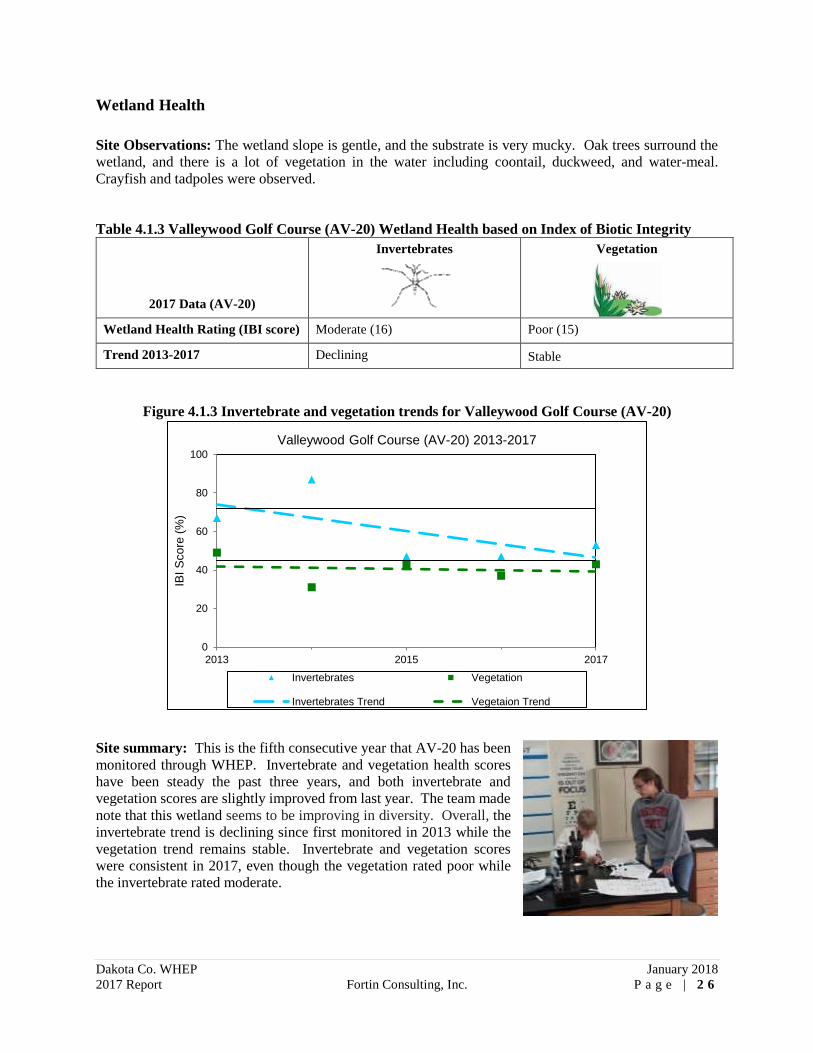
Site Observations: The wetland slope is gentle, and the substrate is very mucky. Oak trees surround the
wetland, and there is a lot of vegetation in the water including coontail, duckweed, and water-meal.
Crayfish and tadpoles were observed.
Table 4.1.3 Valleywood Golf Course (AV-20) Wetland Health based on Index of Biotic Integrity
2017 Data (AV-20)
Invertebrates
Vegetation
Wetland Health Rating (IBI score) Moderate (16) Poor (15)
Trend 2013-2017 Declining Stable
Figure 4.1.3 Invertebrate and vegetation trends for Valleywood Golf Course (AV-20)
Site summary: This is the fifth consecutive year that AV-20 has been
monitored through WHEP. Invertebrate and vegetation health scores
have been steady the past three years, and both invertebrate and
vegetation scores are slightly improved from last year. The team made
note that this wetland seems to be improving in diversity. Overall, the
invertebrate trend is declining since first monitored in 2013 while the
vegetation trend remains stable. Invertebrate and vegetation scores
were consistent in 2017, even though the vegetation rated poor while
the invertebrate rated moderate.
0
20
40
60
80
100
2013 2015 2017
IBI
Sco
re (
%)
Valleywood Golf Course (AV-20) 2013-2017
Invertebrates Vegetation
Invertebrates Trend Vegetaion Trend

Dakota Co. WHEP January 2018
2017 Report Fortin Consulting, Inc. P a g e | 2 7
4.2 Burnsville Wetlands Four wetlands were monitored within the City of
Burnsville in 2017. This is the 21st year the City has
participated in WHEP! Sixteen wetlands have been
monitored in Burnsville since the initiation of WHEP in
1997.
Team Leader: Dianne Rowse
Team Members: Holly Check, Pete Curtis, Bernie
DeMaster, Katie Dennis, Tracy Few, Patrick Heim,
Kevin Nelson, Travis Nelson, Jeff Richards, Nick
Rowse, Melody Schake, Daniel Shaughnessy, and
Matthew Tyrrell
Dianne Rowse is the
Burnsville team leader. She
started participating in
WHEP in 1998 as the
Farmington team leader for
three years. Then she led the
Burnsville team for seven
years. She took a break from
WHEP to lead the statewide dragonfly survey for two years and continues survey
work as a volunteer for the Minnesota Dragonfly Society. She returned to WHEP
in 2016, and is excited to lead the Burnsville team again.
Dianne is a retired Professional Naturalist and enjoys wading into wetlands, identifying plants and bugs,
and sharing this with others. She says “I am delighted to have a dedicated team of extraordinary citizen
scientists. I hope they’ll return in 2018!”
Liz Forbes is the city contact for the Burnsville WHEP team. Her role is to
select wetlands for evaluation, provide team support as needed and help
recruit volunteers.
She said, “As City contact, I select the wetlands to be evaluated each year
and help recruit volunteers. I’ve been involved with Dakota County WHEP
since I began working for the City of Burnsville in 2011, though the City has
participated since the program began.
“The 20 years’ worth of wetland data collected by WHEP volunteers
provides a valuable reference tool for the City. In addition to guiding surface water management decisions,
the data comes in handy when responding to inquiries about water bodies or applying for habitat restoration
grants.
“The City truly appreciates the efforts made by the Burnsville WHEP team. This year, team leader, Dianne
Rowse gave a presentation about WHEP at a City Parks & Natural Resources Commission meeting. Also
attending were volunteers Nick Rowse and Bernie DeMaster (former team leader). The talk was well-
received and led to some discussion about ways to protect wetland water quality.”
Dianne Rowse
Liz Forbes with husband Andy

Dakota Co. WHEP January 2018
2017 Report Fortin Consulting, Inc. P a g e | 2 8
Burnsville General Wetland Health
Figure 4.2 presents an overall view of wetland health for all of the 2017 monitoring sites in Burnsville
based on the IBI scores for invertebrates and vegetation presented as a percent. Figure 4.2 also illustrates
the consistency between the IBI scores (in percent form) for each wetland sampled. Invertebrate and
vegetation scores that differ by ten percent or less are considered consistent. Based on the IBI scores, a
wetland health rating is assigned as excellent, moderate or poor. The Burnsville wetlands exhibited poor
to moderate wetland health based on invertebrate and vegetation data. Only wetland B-8 rated poor for
vegetation. B-1, B-3, and B-13 scored moderate for both invertebrate and vegetation. Invertebrate and
vegetation scores were inconsistent for B-3, B-8, and B-13 and differed by 24 ,42, and 11 percent,
respectively. Invertebrate and vegetation scores for B-1 were perfectly consistent.
Figure 4.2 Burnsville site scores (percent) for the 2017 sampling season
4.2.1 Crystal Lake West (B-1)
Crystal Lake West (B-1) is a one-
acre, type 3 wetland located in the
CL6 Drainage Area of Crystal Lake
subwatershed within the Blackdog
watershed. The CL6 Drainage area
is 444.5 acres, and is five percent
impervious. There are no inlets or
outlets in the wetland. The wetland
is part of the wetland management
plan and is designated as an
Improvement Class. The goal for
the wetland is to improve its quality.
Crystal Lake
0
20
40
60
80
100
B-1 B-3 B-8 B-13
We
tla
nd
Hea
lth
Ra
tin
g IB
I S
co
re (
%)
Wetland Site
Burnsville Wetland Health 2017
Invertebrates Vegetation
Exc
Mod
Poor
B-1

Dakota Co. WHEP January 2018
2017 Report Fortin Consulting, Inc. P a g e | 2 9
The wetland has invasive species problems, including reed canary grass. There is some recreational vehicle
disturbances (mostly in the winter). The wetland is very close to a bay on the west side of Crystal Lake,
and is within a large, naturally vegetated, City-owned park called Crystal Lake West Park.
Wetland Health
Site Observations: This wetland is located off of a hiking trail system within a densely wooded natural
area. The wetland has a gentle slope, and the substrate is very mucky. A ring of reed canary grass surrounds
the wetland. The wetland surface is densely covered in white water lilies. Submergent vegetation including
coontail and pondweed are prolific. Chara was present during the June invertebrate sampling. A large
diversity of invertebrate taxa were collected; however, there were very few individuals per taxa represented.
Table 4.2.1 Crystal Lake West (B-1) Wetland Health based on Index of Biotic Integrity
2017 Data (B-1)
Invertebrates
Vegetation
Wetland Health Rating (IBI score) Moderate (18) Moderate (21)
Cross-check Rating (IBI score) Moderate (16) Moderate (17)
Trend 1999-2017 Variable but stable Variable but declining
Figure 4.2.1 Invertebrate and vegetation trends for Crystal Lake West (B-1)
Site summary: This is the seventeenth time that B-1 has been surveyed since 1999, and eighth consecutive
survey since 2010 (it was not surveyed in 2006 and 2009). The invertebrate and vegetation scores both
indicate that the wetland has moderate health. Throughout the years of monitoring, the scores have varied
and ranged from poor to excellent. This site was cross-checked by another WHEP team in 2017. All scores
from both monitoring teams were identical to 2016 scores. Scores between the City team and the cross-
check team were consistent. The invertebrate trend line indicates variable but overall stable wetland health.
0
20
40
60
80
100
1999 2001 2003 2005 2007 2009 2011 2013 2015 2017
IBI
Sco
re (
%)
Crystal Lake West (B-1) 1999-2017
Vegetation Invertebrates x-checkVegetation x-check InvertebratesVegetation Trend Invertebrates Trend
Exc
Mod
Poor

Dakota Co. WHEP January 2018
2017 Report Fortin Consulting, Inc. P a g e | 3 0
The vegetation trend indicates variable but overall declining health. The Burnsville team expressed concern
for the annual human impact of monitoring this wetland, how it may affect the wetland biological health.
4.2.2 Kraemer Preserve (B-3)
B-3, also known as Kraemer Preserve, is a restored public water
wetland in the City of Burnsville. It is a 29.7-acre, type 3
wetland located within the NW21 drainage area of Northwest
Subwatershed (1,404 acres) of the Lower Minnesota Watershed
(40,960 acres). The NW21 drainage area is 93 acres and
approximately 30 percent impervious. The wetland is part of
the City’s stormwater management plan, and is designated as
Protection Class wetland. It has one inlet on the south side and
one inlet on the east side. It also has one outlet in the northwest
corner and one outlet on the north side. The wetland
management goal is to protect the wetland, maintain flood
protection, control sediment, and remove nutrients.
The large wetland was installed in 1997 to mitigate for wetland disturbances by Kraemer & Sons, Inc. Land
use in the watershed is mainly residential and industrial. The upland buffer has been restored to prairie and
some stormwater ponds are in place to protect the wetland. Upland vegetation is managed through burning,
spraying, and interseeding. A gravel path encircles the wetland. It is a protected wetland and provides
migratory bird habitat. Invasive species are cause for concern.
Wetland Health
Site Observations: This is a large wetland surrounded by a walking trail. Dense cattail surround the
wetland, encroaching 10 or more meters from the shore to the open water. There is no standing water in
the cattails. There is an approximately two foot drop off from the edge of the cattail into the open water.
The wetland substrate is mucky. Coontail, pondweed, northern water milfoil, water crowfoot, and
duckweed flourished in the wetland. Only submergent and floating leaved aquatic forbs and cattail were
documented in the vegetation plot. Several taxa of dragonflies, damselflies, mayflies, caddisflies, snails,
and true flies were recorded. Fish, filamentous algae, Chinese mystery snail and banded mystery snails
were also observed.
Table 4.2.2 Kraemer Preserve (B-3) Wetland Health based on Index of Biotic Integrity
2017 Data (B-3)
Invertebrates
Vegetation
Wetland Health Rating (IBI score) Moderate (22) Moderate (17)
Trend 1998-2017 Variable but stable Overall decline, but stable since
2005
B-3

Dakota Co. WHEP January 2018
2017 Report Fortin Consulting, Inc. P a g e | 3 1
Figure 4.2.2 Invertebrate and vegetation trends for Kraemer Preserve (B-3)
Site summary: This is the twentieth consecutive year of sampling for Kraemer Preserve (B-3), and was
first surveyed in 1998. Invertebrate and vegetation scores have remained inconsistent since 2014 with
invertebrates scoring higher (excellent or nearly excellent) than vegetation (poor or nearly poor). Despite
a couple of years scoring poor, in 2012 and 2013, the invertebrates trend appears to be stable. The overall
vegetation trend implies decreasing health; however, it has remained stable since 2005 (prior to 2005
vegetation scores were high moderate). The wide cattail ring impedes plot placement, eliminating the
potential to include emergent forbs and grasses, and limiting the vegetation diversity; however, the dense
population of submergent vegetation provides habitat benefiting the invertebrate population.
4.2.3 Red Oak (B-8)
Red Oak (B-8) is a 0.5-acre, type 3 wetland located within the E4 Drainage
of the East Subwatershed (2,170 acres) within the Black Dog Watershed
(3,700 acres). The E4 Drainage is 121 acres with approximately 25 percent
impervious surface. There are no inlets, but one outlet at the northern end
of the wetland. The wetland is part of the City’s stormwater management
plan. It is designated as an Protection Class wetland and is managed to
maintain or improve existing habitat.
The wetland is located on the northwest side of a 36-acre Red Oak Park.
Mixed grassland and woodland buffer the wetland. Large athletic fields
(baseball and soccer) are to the north and east of the wetland. A paved
park trail lies 100 feet away on the east and south sides of the wetland. A
footpath for the disc golf course is west and south of the wetland. North
and west of the wetland are residential neighborhoods. This wetland receives runoff from the adjacent
residential areas and athletic fields.
0
20
40
60
80
100
1998 2000 2002 2004 2006 2008 2010 2012 2014 2016
IBI
Sco
re (
%)
Kraemer (B-3) 1998-2017
Invertebrates Vegetation
Invertebrates Trend Vegetation Trend
Exc
Mod
Poor

Dakota Co. WHEP January 2018
2017 Report Fortin Consulting, Inc. P a g e | 3 2
Wetland Health
Site Observations: The wetland substrate is firm but mucky, and the slope is gentle. There is minimal
open water. The wetland is choked with cattails. No submergent vegetation was documented.
Ricciocarpus was observed during the invertebrate collection, but not within the vegetation plot.
Tadpoles were found in the bottle traps.
Table 4.2.3 Red Oak (B-8) Wetland Health based on Index of Biotic Integrity
2017 Data (B-8)
Invertebrates
Vegetation
Wetland Health Rating (IBI score) Moderate (22) Poor (11)
Trend 2001-2017 Not enough data Not enough data
Figure 4.2.3 Invertebrate and vegetation trends for Red Oak (B-8)
Site summary: This is the third time that Red Oak (B-8) has
been surveyed since initially surveyed in 2001. Invertebrate
and vegetation scores were inconsistent with invertebrates
rating moderate while vegetation rated poor. The invertebrate
diversity is healthy; however, few individuals per taxa were
collected. The wetland is choked with cattail limiting
vegetation diversity, and possibly affecting the invertebrate
density.
0
20
40
60
80
100
2001 2003 2005 2007 2009 2011 2013 2015 2017
IBI
Sco
re (
%)
Red Oak (B-8) 2001-2017
Invertebrates Vegetation
Invertebrates Trend Vegetation Trend
Exc
Mod
Poor
Burnsville team at WHEP Invertebrate Training

Dakota Co. WHEP January 2018
2017 Report Fortin Consulting, Inc. P a g e | 3 3
4.2.4 Sunset Pond (B-13)
Sunset Pond (B-13) is a 48-acre, type 3 wetland located within the SP1
drainage area of Sunset Pond Subwatershed (2,488 acres) of the Black Dog
Watershed (3,700 acres). The SP1 drainage area is 402 acres and
approximately 40 percent impervious. The wetland has eight inlets on all
sides. There is one outlet on the north end. The wetland is part of the
City's stormwater management plan and wetland management plan. It is
designated as an Improvement Class wetland and is being managed to
maintain the wetland without degrading its existing functions, values, and
wildlife habitat. Its functions include flood and stormwater attenuation and
water quality protection. Its values include flood protection, sediment
control, nutrient removal, open space, and aesthetics.
The entire shoreline is owned by the City and maintained as a natural park. A heavily-used trail circles the
wetland. Invasive species (narrow-leaf cattail and reed canary grass), stormwater inflow, sediment
pollution, and encroachment of natural areas by neighboring properties into the conservation easement are
all disturbance concerns. Herbicide treatment and controlled burns are used as measures of weed control
and management in the surrounding upland buffer. A conservation easement exists on the neighboring
private properties that restrict structures and requires natural vegetation buffers.
Wetland Health
Site Observations: The wetland has a gentle slope and a mucky substrate. A 10 to 30 meter wide ring of
cattails surrounds the perimeter of the wetland. Coontail and duckweed dominated the vegetation;
however, other submergent and emergent plants were present. Eurasian water milfoil is present, as well
as purple loosestrife, reed canary grass, and Chinese and banded mystery snails. There is a restored
prairie to the east of the wetland. Tadpoles were present in the bottle traps.
Table 4.2.4 Sunset Pond (B-13) Wetland Health based on Index of Biotic Integrity
2017 Data (B-13)
Invertebrates
Vegetation
Wetland Health Rating (IBI score) Moderate (18) Moderate (17)
Trend 2009-2017 Not enough data Not enough data
Tracy Few and Katie Dennis
Bernie DeMaster, Kevin Nelson, Tracy Few, Katie Dennis, Matt Tyrrell, and Melody Schake
Jeff Richards
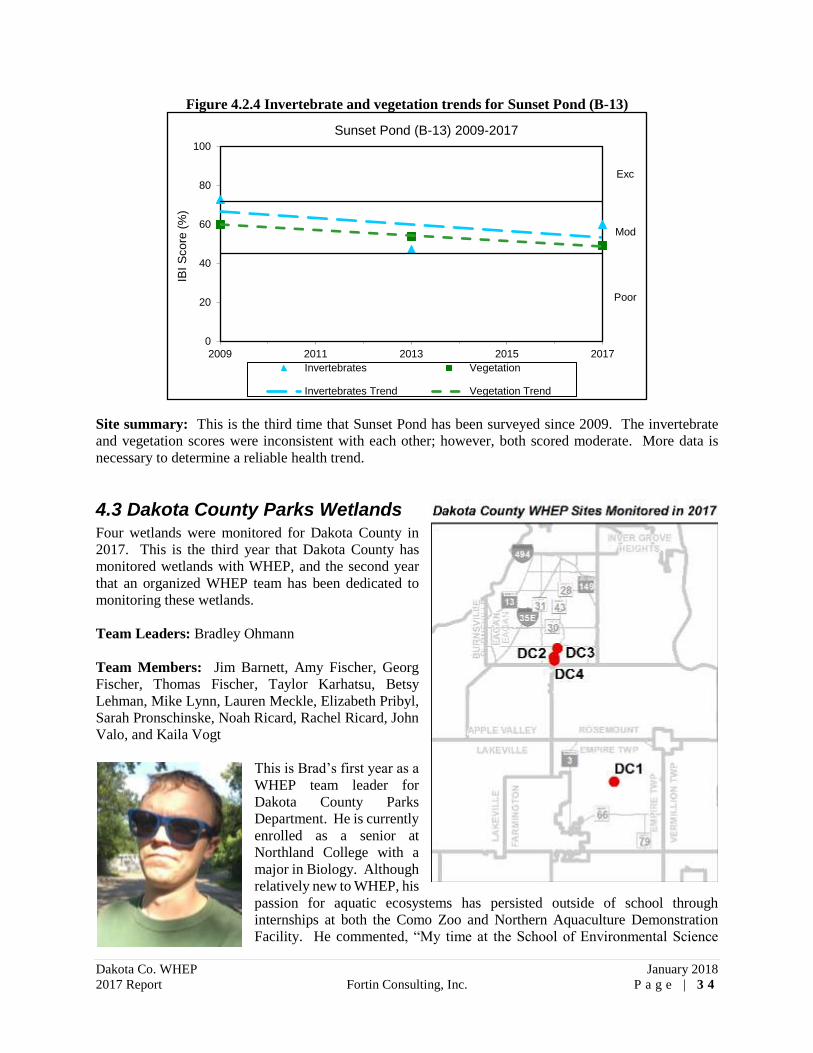
Dakota Co. WHEP January 2018
2017 Report Fortin Consulting, Inc. P a g e | 3 4
Figure 4.2.4 Invertebrate and vegetation trends for Sunset Pond (B-13)
Site summary: This is the third time that Sunset Pond has been surveyed since 2009. The invertebrate
and vegetation scores were inconsistent with each other; however, both scored moderate. More data is
necessary to determine a reliable health trend.
4.3 Dakota County Parks Wetlands Four wetlands were monitored for Dakota County in
2017. This is the third year that Dakota County has
monitored wetlands with WHEP, and the second year
that an organized WHEP team has been dedicated to
monitoring these wetlands.
Team Leaders: Bradley Ohmann
Team Members: Jim Barnett, Amy Fischer, Georg
Fischer, Thomas Fischer, Taylor Karhatsu, Betsy
Lehman, Mike Lynn, Lauren Meckle, Elizabeth Pribyl,
Sarah Pronschinske, Noah Ricard, Rachel Ricard, John
Valo, and Kaila Vogt
This is Brad’s first year as a
WHEP team leader for
Dakota County Parks
Department. He is currently
enrolled as a senior at
Northland College with a
major in Biology. Although
relatively new to WHEP, his
passion for aquatic ecosystems has persisted outside of school through
internships at both the Como Zoo and Northern Aquaculture Demonstration
Facility. He commented, “My time at the School of Environmental Science
0
20
40
60
80
100
2009 2011 2013 2015 2017
IBI
Sco
re (
%)
Sunset Pond (B-13) 2009-2017
Invertebrates Vegetation
Invertebrates Trend Vegetation Trend
Exc
Mod
Poor

Dakota Co. WHEP January 2018
2017 Report Fortin Consulting, Inc. P a g e | 3 5
really cemented my passion for the environment, and combined with my passion for aquatic environments
this seemed like a perfect fit. I’m thankful for having an amazing group of volunteers and Dakota County
contacts that made my transition to a leadership position simple.”
Meghan Manhattan is Dakota County Parks’ WHEP contact. She said, “Dakota
County Parks’ mission is to enrich lives by providing high quality recreation and
education opportunities in harmony with natural resource preservation and
stewardship. We’re currently managing over $2 million in natural resource
restoration projects across 800 acres within our park system. We’re committed
to ongoing monitoring of our restorations to ensure that we achieve positive
outcomes for wildlife and vegetation in our park system.
“We began our partnership with WHEP in 2015 at one wetland site, Buck Pond,
planned for restoration the following year. The data we received helped inform
our restoration approach at that site. Since then, we expanded to four locations within areas of our parks
where we’re actively doing restoration. WHEP is a great resource for important water quality measures,
and is a great complement to our other vegetation and wildlife monitoring programs. We also love that this
program engages volunteers in such a meaningful way.”
Dakota County Parks General Wetland Health
Figure 4.3 presents an overall view of wetland health for all of the 2017 monitoring sites in Dakota County
Parks based on the IBI scores for invertebrates and vegetation presented as a percent. Figure 4.3 also
illustrates the consistency between the IBI scores (in percent form) for each wetland sampled. Invertebrate
and vegetation scores that differ by ten percent or less are considered consistent. Based on the IBI scores,
a wetland health rating is assigned as excellent, moderate or poor. The Dakota County wetlands exhibited
poor to moderate wetland health based on invertebrate and vegetation data. Invertebrate and vegetation
scores for DC-3 were inconsistent, differing by 16 percent.
Figure 4.3 Dakota County Parks site scores (percent form) for the 2017 sampling season
Meghan Manhattan with Quinn Jones
0
20
40
60
80
100
DC-1 DC-2 DC-3 DC-4
We
tla
nd
Hea
lth
Ra
tin
g IB
I S
co
re (
%)
Wetland Site
Dakota County Wetland Health 2017
Invertebrates Vegetation
Exc
Mod
Poor

Dakota Co. WHEP January 2018
2017 Report Fortin Consulting, Inc. P a g e | 3 6
4.3.1 Empire Lake (DC-1)
Empire Lake (DC-1) is a 25.1-acre, type 5 wetland located in the
Vermillion River Watershed. The subwatershed is 6 square miles
and 5 percent impervious. Empire Lake is the man-made result of
impounding an unnamed tributary stream to the Vermillion River.
This dike was built in 1965. Some improvements have been made
to the dike since the original construction. Water enters the lake
on the west side via a stream channel and exits at the dike on the
east.
Empire Lake is located within Whitetail Woods Regional Park.
The surrounding area includes agricultural fields, natural areas,
and gravel mining. The adjacent woodland is highly disturbed by
invasive buckthorn. Dakota County began implementing major
ecological restoration of the adjacent uplands, including
buckthorn removal, in the fall of 2015 and is ongoing. Data
collected before, during, and after the restoration will monitor the
effects of the project on the wetland. A Natural Resources System
Management Plan for Dakota County, along with an individual
Management Plan for Whitetail Woods Regional Park addresses
water quality and lake quality. A water quality survey was
completed on this lake in 2009 measuring healthy phosphorus
levels. Secchi disk measurements also indicate higher water
clarity.
Wetland Health
Site Observations: The wetland has a gentle slope. The substrate is very mucky and difficult to walk. A
lot of driftwood is present. Near the releve were many floating mats of vegetation, most of which are
sedges. The wetland is within a recreational park including trails, picnic pavilions, and campsites.
Farmland stretches just outside of the regional park.
Table 4.3.1 Empire Lake (DC-1) Health based on Index of Biotic Integrity
2017 Data (DC-1)
Invertebrates
Vegetation
Wetland Health Rating (IBI score) Moderate (18) Moderate (21)
Trend 2015-2017 Not enough data Not enough data

Dakota Co. WHEP January 2018
2017 Report Fortin Consulting, Inc. P a g e | 3 7
Figure 4.3.1 Invertebrate and vegetation trends for Empire Lake (DC-1)
Site summary: This is the third consecutive year that Empire Lake has been monitored by WHEP. The
invertebrate and vegetation scores have remained consistent with each other, both scoring 60 percent. Both
scores are lower than in previous years, which shows declining health trends in the short term; however,
more years of monitoring is needed to determine a more reliable wetland health trends.
4.3.2 Buck Pond (DC-2)
Buck Pond (DC-2) is a 1.6-acre, type 3 wetland located in the
Lower Minnesota River watershed. The pond’s watershed is
approximately 12 acres with zero impervious surface. It is a
small, round pond/wetland located near the center of Lebanon
Hills Regional Park. It’s an isolate terrene basin, within 700-
1200 feet of larger lakes to the east and south. It is classified as
“shallow marsh” and a “freshwater emergent wetland”. It is
surrounded by smooth brome-dominated uplands and overgrown
savanna/woodland. It was likely grazed historically. The
wetland is dominated by reed canary grass, and deposition from
the surrounding land has caused build-up in the wetland
covering the native emergent vegetation with fine sands.
Dakota County began implementing major ecological restoration of this wetland in December 2015 and
will continue through June 2018. In December of 2015, the wetland was scraped 1.5 feet deep from the
wetland edge in hopes that it would remove the rhizomatous root system of reed canary grass, and to expose
and reestablish the native wetland seed bank. Prior to the scrape, there was very low plant diversity within
the basin and very little native emergent vegetation; however, following the scrape in June 2016, the native
seedbank began emerging during the growing season. Data collected before, during, and after the
restoration will monitor the effects of the project on the wetland. A Natural Resources System Management
Plan for Dakota County, along with an individual Management Plan for Lebanon Hills Regional Park
addresses water quality, lake quality, and other data.
0
20
40
60
80
100
2015 2016 2017
IBI
Sco
re (
%)
Empire Lake (DC-1) 2015-2017
Invertebrates Vegetation
Invertebrates x-check Vegetation x-check
Invertebrates Trend Vegetation Trend
Exc
Mod
Poor

Dakota Co. WHEP January 2018
2017 Report Fortin Consulting, Inc. P a g e | 3 8
Wetland Health
Site Observations: The wetland slope is gentle. The wetland substrate is solid with very little muck.
Families of dragonflies, damselflies, mayflies, caddisflies, true flies, leeches, snails, and crustaceans were
present. Grasses, duckweed, water-meal, and narrowleaf arrowhead dominates. Tadpoles, adult frogs,
and salamanders were found in the bottle traps. One buck, three does, and one fawn were observed during
a vegetation survey.
Table 4.3.2 Buck Pond (DC-2) Health based on Index of Biotic Integrity
2017 Data (DC-2)
Invertebrates
Vegetation
Wetland Health Rating (IBI score) Poor (14) Moderate (17)
Cross-check Rating (IBI score) Excellent (24) Excellent (27)
Trend 2015-2017 Not enough data Not enough data
Figure 4.3.2 Invertebrate and vegetation trends for Buck Pond (DC-2)
Site summary: This is the third consecutive year that Buck Pond has been monitored by WHEP. This
wetland was cross-checked by another WHEP team in 2017. Each team calculated invertebrate and
vegetation scores that were consistent with each other; however, the compared invertebrate and vegetation
scores between the two teams were inconsistent with each other, differing by 33 and 28 percent,
respectively. The invertebrate and vegetation scores rated moderate for the City team, and excellent for the
cross-check team. The short-term health trends for both invertebrates and vegetation (not including the
cross-check team scores) is improving; however, more years of monitoring is needed to determine more
reliable wetland health trends. The invertebrate diversity was similar for each team. The cross-check team
did identify mayflies and caddisflies, though, which enhanced their invertebrates score. The vegetation
species identified by the two teams were quite different. The cross-check team identified a larger diversity
of species, including bladderwort.
0
20
40
60
80
100
2015 2016 2017
IBI
Sco
re (
%)
Buck Pond (DC-2) 2015-2017
Invertebrates VegetationInvertebrates x-check Vegetation x-checkInvertebrates Trend Vegetation Trend
Exc
Poor

Dakota Co. WHEP January 2018
2017 Report Fortin Consulting, Inc. P a g e | 3 9
4.3.3 Tamarack Swamp (DC-3)
Tamarack Swamp (DC-3) is a 7.7-acre, type 3 wetland
located in the Lower Minnesota River watershed. The
wetland’s watershed is approximately 40 acres with zero
impervious surface. No large scale alterations to the
historic hydrology of the swamp have been detected, and
efforts have been made throughout the history of the park
to protect this unique feature from human impact.
Tamarack Swamp is a 24 acre basin that contains a
remnant Tamarack Swamp in Lebanon Hills Regional
Park. It is the southernmost example of tamarack swamp
remaining in Minnesota. Surrounding the swamp are oak
woodland and oak forest plant communities. The natural
area is comprised of a matrix of glacial moraine hills, plains and kettle hole lakes and ponds. The dominant
land cover types pre-settlement would have been primarily oak forest, shallow lakes and wetlands, and
prairie/savanna.
Dakota County Natural Resource Department’s primary goal is to create conditions in this wetland that
favor tamarack regeneration through the removal of shrubs and invasive herbaceous species within the
swamp, and to buffer the swamp by removing invasive species from the adjacent plant communities with
the swamp watershed. Monitoring will give the County baseline data and on-going data collection in the
following years. Minnesota County Biological Survey surveyed the park, including the Tamarack Swamp,
and found the swamp to be of moderate biological diversity significance. This wetland has also been
monitored by MPCA for the past decade. A Natural Resources System Management Plan for Dakota
County, along with an individual Management Plan for Lebanon Hills Regional Park addresses water
quality, lake quality, and other data.
Wetland Health
Site Observations: The wetland slope is gentle, and the
wetland substrate is mucky. The wetland surface is covered
in 95 percent duckweed. Horsetail, willow, three-way sedge,
spike rush, arrowhead, and smartweed were also present. A
large track of vegetation has recently been removed east of
the wetland. A stand of trees exists west of the wetland.
Table 4.3.3 Tamarack Swamp (DC-3) Health based on Index of Biotic Integrity
2017 Data (DC-3)
Invertebrates
Vegetation
Wetland Health Rating (IBI score) Poor (8) Poor (15)
Trend 2016-2017 Not enough data Not enough data
Dakota County Parks team at WHEP Invertebrate Training

Dakota Co. WHEP January 2018
2017 Report Fortin Consulting, Inc. P a g e | 4 0
Figure 4.3.3 Invertebrate and vegetation trends for Tamarack Swamp (DC-3)
Site summary: This is the second year that Tamarack Swamp has been monitored by WHEP. The
invertebrate and vegetation scores were not consistent with each other, differing by 16 percent; however,
they both rated poor. The vegetation score is similar to surveys taken in 2016, but the invertebrate score
has declined. Only three taxa of leeches, one taxa of snails, one taxa of true flies, water boatman and other
true bugs and beetles were collected from this wetland in 2017. In 2016, dragonflies and damselflies were
also present, as well as more taxa of snails and true flies. Only nine species of vegetation were observed in
the vegetation plot. More years of monitoring is needed to determine reliable wetland health trends.
4.3.4 Jensen Lake (DC-4)
Jensen Lake (DC-4) is a 50-acre, type 5 wetland located in the Lower
Minnesota River watershed. The pond’s watershed is approximately 330
acres with seven percent impervious surface. The watershed in this area of
the south metro has been greatly changed/altered with the building of roads,
commercial industry, and residential areas. The general water flow is still
in the same direction; however, altered with the addition of Pilot Knob Road
culverts and overall landscape altering. There is a culvert running under
Pilot Knob Road that connects two small ponds on either side of the road.
The pond adjacent to Jensen Lake was created to collect sediment, salt, and
fertilizers from entering into Jensen Lake. When this pond reaches a certain
depth, the excess water flows into Jensen without these contaminants.
Jensen Lake drains into Sedge Pond in the northeast corner.
Historically, the land north of Jensen Lake was agriculture and pastured land. The woodland surrounding
Jensen Lake was most likely grazed with cattle. The Natural Resource Department is in the process of
restoring 175 acres in the surrounding adjacent acres in Lebanon Hills. The north woodland slope of Jensen
Lake was identified by the MN DNR as a high quality natural community. The north and east woodlands
are more degraded with invasive species like buckthorn and honeysuckle which will be removed and treated
with the completion of the restoration of this area. Baseline data is wanted to monitor the change over time
in this natural area as the land is restored and maintained to the proper native plant community. Dakota
County would like to use the WHEP data to monitor this restoration area. Turtle surveys are also conducted
0
20
40
60
80
100
2016 2017
Tamarack Swamp (DC-3) 2016-2017
Invertebrates Vegetation
Invertebrates Trend Vegetation Trend
IBI
Sco
re (
%)
Exc
Mod
Poor

Dakota Co. WHEP January 2018
2017 Report Fortin Consulting, Inc. P a g e | 4 1
in the area. A Natural Resources System Management Plan is being completed for Dakota County, along
with an individual Management Plan for Lebanon Hills Regional Park which will address water quality,
lake quality, and other data.
Wetland Health
Site Observations: The wetland slope is gentle, and the wetland substrate is very mucky. A boat path
through the water lilies, allowing access to survey sites. Fish were present in the bottle traps. Coontail was
very dense. Coontail, waterweed, white water-lily, and pondweed dominated the vegetation. Some
duckweed and yellow pond-lily were present.
Table 4.3.4 Jensen Lake (DC-4) Health based on Index of Biotic Integrity
2017 Data (DC-4)
Invertebrates
Vegetation
Wetland Health Rating (IBI score) Moderate (18) Moderate (19)
Trend 2016-2017 Not enough data Not enough data
Figure 4.3.4 Invertebrate and vegetation trends for Jenson Lake (DC-4)
Site summary: This is the second year that Jensen Lake has been monitored by WHEP. The invertebrate
and vegetation scores were inconsistent with each other, rating moderate. The invertebrate diversity is
increased from 2016, improving the score. The vegetation score is similar to the 2016 score. More years
of monitoring is needed to determine reliable wetland health trends.
0
20
40
60
80
100
2016 2017
Jenson Lake (DC-4) 2016-2017
Invertebrates Vegetation
Invertebrates Trend Vegetation Trend
IBI
Sco
re (
%)
Exc
Mod
Poor

Dakota Co. WHEP January 2018
2017 Report Fortin Consulting, Inc. P a g e | 4 2
4.4 Eagan Wetlands Three wetlands were monitored within
the City of Eagan in 2017. The City
has 20 years of data! Forty-one
wetlands have been monitored in
Eagan since the initiation of WHEP in
1997.
Team Leaders: Marianne McKeon
Team Members: Robert Giefer, Pat
Graham, Craig Harnagel, Doris Ikier,
Ivette Izea-Martinez, Felix Martinez-
Paz, Ava McKeon, Mark Niznik, Gari
Plehal, Joe Schulte, Greg Searle, and
Trent Young
Marianne McKeon has been involved in WHEP since 2007, and has been
Eagan’s team leader for the past seven years. She commented, “As always, I am
so grateful for our citizen-scientists! They have such dedication to our work and
are great company too! Of the sites we monitored in 2017, the most notable was
Moonshine Pond as it had large amounts of trash. It would seem it is serving its
purpose of protecting Lemay Lake.”
Jessie Koehle is the Water Resources Specialist for
the City of Eagan, and has a background in aquatic
biology and fisheries management. She explained,
“I have been involved with selection of Eagan’s
WHEP sites since I joined the City of Eagan in
2007. Throughout the year, I communicate frequently with Marianne to help
plan and strategize the WHEP sampling season. Whenever I am able to meet
volunteers in the field, I enjoy getting to know them and practicing my plant
and invertebrate identification. We are building a group of wetland
ambassadors that are an invaluable resource to our program and the Eagan
community.
“At the City of Eagan, WHEP data is used as a qualitative, informative source
of support for protection or improvement as needed for development projects,
as well as historical recordkeeping for future changes. We have a unique challenge of tracking the health
of our 820-some natural waterbodies! It can be difficult to choose just a few to sample, but we feel it’s a
good problem to have. Thanks to all the WHEP staff and volunteers for your dedication and time spent on
this excellent program.”
Jessie Koehle
E37
Marianne McKeon

Dakota Co. WHEP January 2018
2017 Report Fortin Consulting, Inc. P a g e | 4 3
Since 1999, Eric Macbeth has managed Eagan’s water resources programs
that focus on protecting and improving lakes, conserving wetlands, and
preventing stormwater pollution. “The City of Eagan has supported
WHEP from the beginning, when we helped develop the program with
Dakota County in 1997,” he says. “WHEP gives residents a wonderful
opportunity to be involved and learn about wetlands. Volunteers literally
get their hands wet,” he says. “With over 700 lakes and wetlands and over
400 storm basins in Eagan, most residents live very near surface water or
regularly visit parks with wetlands. WHEP helps strengthen our
community's appreciation of these resources and enhances public support
of our programs.”
Eagan General Wetland Health
Figure 4.4 presents an overall view of wetland health for all of the 2017 monitoring sites in Eagan based
on the IBI scores for invertebrates and vegetation presented as a percent. Figure 4.4 also illustrates the
consistency between the IBI scores (in percent form) for each wetland sampled. Invertebrate and vegetation
scores that differ by ten percent or less are considered consistent. Based on the IBI scores, a wetland health
rating is assigned as excellent, moderate or poor. Three wetlands were monitored in the City of Eagan in
2017. The invertebrates and vegetation scores for E-42 were inconsistent, differing by 14 percent. E-18
and E-42 each rated poor for invertebrates but moderate for vegetation. Wetland site E-41 rated moderate
in both categories.
Figure 4.4 Eagan site scores (percent form) for the 2017 sampling season
Eric Macbeth
0
20
40
60
80
100
E-18 E-41 E-42
We
tla
nd
Hea
lth
Ra
tin
g IB
I S
co
re (
%)
Wetland Site
Eagan Wetland Health 2017
Invertebrates Vegetation
Exc
Mod
Poor

Dakota Co. WHEP January 2018
2017 Report Fortin Consulting, Inc. P a g e | 4 4
4.4.1 Moonshine Park Pond (E-18)
Moonshine Park Pond (E-18), also known as DP-14, is a 2.5-acre,
type 3 wetland within the Eagan-Inver Grove Heights Watershed,
and flows to LeMay Lake. Its watershed is 34 acres including
approximately 25 percent impervious surface. There are two inlets;
one in the southwest and one on the western shore. There is one
outlet on the east side of the wetland. The wetland is part of the
City’s stormwater management plan. The City has a general wetland
management plan, but no specific plans for this particular wetland.
The management goal is to protect water quality in LeMay Lake.
The City would like to continue to educate the public about the
importance of clean stormwater.
Most of the shoreline is wooded and is located within Moonshine Park. The very north shoreline is private
property. A new parking lot and play area was constructed southeast of the wetland. The wetland receives
stormwater runoff from the surrounding residential areas, as well as from the new parking lot/play area. A
raingarden filters water from the new parking lot/play area; however, overflow is directed into the wetland.
Water lettuce (Pistia stratiotes), an Early Detection Target, has been found in the wetland. Water lettuce
is a plant sold through aquarium and pond supply dealers. It is believed to be susceptible to hard freezes,
so it may not survive Minnesota winters. It has not been observed recently. Buckthorn has been removed
from the area in the recent past.
Wetland Health
Site Observations: The wetland slope is gentle. The wetland substrate
is very mucky, and the wetland is foul smelling. Mixed deciduous
trees, shrubs, and vines line the shore. The wetland surface is covered
with duckweed and water-meal. Reed canary grass is present.
Table 4.4.1 Moonshine Park Pond (E-18) Wetland Health based on Index of Biotic Integrity
2017 Data (E-18)
Invertebrates
Vegetation
Wetland Health Rating (IBI score) Poor (14) Moderate (17)
Cross-check Rating (IBI score) Moderate (20) Moderate (19)
Trend 2003-2017 Not enough data Not enough data
Eagan team at WHEP Invertebrate Training
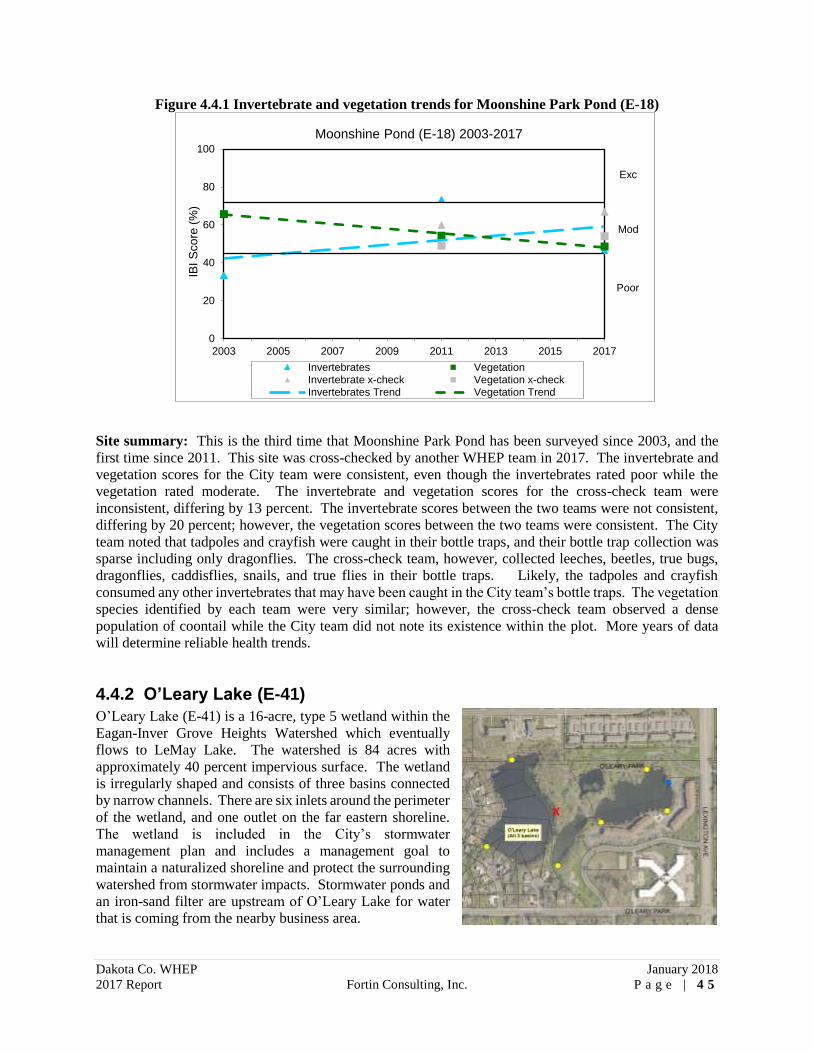
Dakota Co. WHEP January 2018
2017 Report Fortin Consulting, Inc. P a g e | 4 5
Figure 4.4.1 Invertebrate and vegetation trends for Moonshine Park Pond (E-18)
Site summary: This is the third time that Moonshine Park Pond has been surveyed since 2003, and the
first time since 2011. This site was cross-checked by another WHEP team in 2017. The invertebrate and
vegetation scores for the City team were consistent, even though the invertebrates rated poor while the
vegetation rated moderate. The invertebrate and vegetation scores for the cross-check team were
inconsistent, differing by 13 percent. The invertebrate scores between the two teams were not consistent,
differing by 20 percent; however, the vegetation scores between the two teams were consistent. The City
team noted that tadpoles and crayfish were caught in their bottle traps, and their bottle trap collection was
sparse including only dragonflies. The cross-check team, however, collected leeches, beetles, true bugs,
dragonflies, caddisflies, snails, and true flies in their bottle traps. Likely, the tadpoles and crayfish
consumed any other invertebrates that may have been caught in the City team’s bottle traps. The vegetation
species identified by each team were very similar; however, the cross-check team observed a dense
population of coontail while the City team did not note its existence within the plot. More years of data
will determine reliable health trends.
4.4.2 O’Leary Lake (E-41)
O’Leary Lake (E-41) is a 16-acre, type 5 wetland within the
Eagan-Inver Grove Heights Watershed which eventually
flows to LeMay Lake. The watershed is 84 acres with
approximately 40 percent impervious surface. The wetland
is irregularly shaped and consists of three basins connected
by narrow channels. There are six inlets around the perimeter
of the wetland, and one outlet on the far eastern shoreline.
The wetland is included in the City’s stormwater
management plan and includes a management goal to
maintain a naturalized shoreline and protect the surrounding
watershed from stormwater impacts. Stormwater ponds and
an iron-sand filter are upstream of O’Leary Lake for water
that is coming from the nearby business area.
0
20
40
60
80
100
2003 2005 2007 2009 2011 2013 2015 2017
IBI
Sco
re (
%)
Moonshine Pond (E-18) 2003-2017
Invertebrates VegetationInvertebrate x-check Vegetation x-checkInvertebrates Trend Vegetation Trend
Exc
Mod
Poor

Dakota Co. WHEP January 2018
2017 Report Fortin Consulting, Inc. P a g e | 4 6
The wetland shoreline is both publicly and privately owned. O’Leary Park includes the northern portions
of the shoreline. Businesses and parking lots, as well as a new development, lies to the north of the City
park. The most immediate shoreline is vegetated. The pond is very shallow (maximum depth is 4 feet).
Cattails and floating leaf vegetation cover the wetland surface most of the summer.
Wetland Health
Site Observations: The survey site is on the eastern shoreline of the western basin. The wetland slope is
gentle. The wetland substrate is in between solid and mucky. Several species of leeches, dragonflies,
damselflies, mayflies, caddisflies, snails, and true flies were present. Coontail and white water-lily
dominated the vegetation plots. Reed canary grass is present.
Table 4.4.2 O’Leary Lake (E-41) Wetland Health based on Index of Biotic Integrity
2017 Data (E-41)
Invertebrates
Vegetation
Wetland Health Rating (IBI score) Moderate (22) Moderate (23)
Trend 2017 Not enough data Not enough data
Site summary: This is the first time that O’Leary Lake has been surveyed. Invertebrate and vegetation
scores were consistent, and both rated moderate. More years of data will help determine reliable health
trends.
4.4.3 Pond LP-44 (E-42)
Pond LP-44 (E-42) is a 2.4-acre, type 4 wetland is within the
Eagan-Inver Grove Heights Watershed. The wetland watershed is
46 acres and approximately 30 percent impervious. There are
three inlets; one on the north shore, one on the west shore, and one
on the south-southwest shore. There is one outlet at the farthest
southern point which flows to Carlson Lake. The wetland is part
of the City’s stormwater management plan. The City has a general
wetland management plan that includes protecting water quality
in Carlson Lake. The City has increased street sweepings in the
area to protect Carlson Lake.
The wetland is completely surrounded by private residential
properties. Access to the wetland is limited by private fences.
Shoreline maintenance varies between completely manicured lawns to vegetative shoreline buffers. Some
residents have installed native shoreline vegetation along their shorelines. There is approximately 30
percent tree cover around the wetland shoreline. Reed canary grass, curlyleaf pondweed, and, possibly
goldfish are present in the wetland. The wetland has received alum treatments in the past.
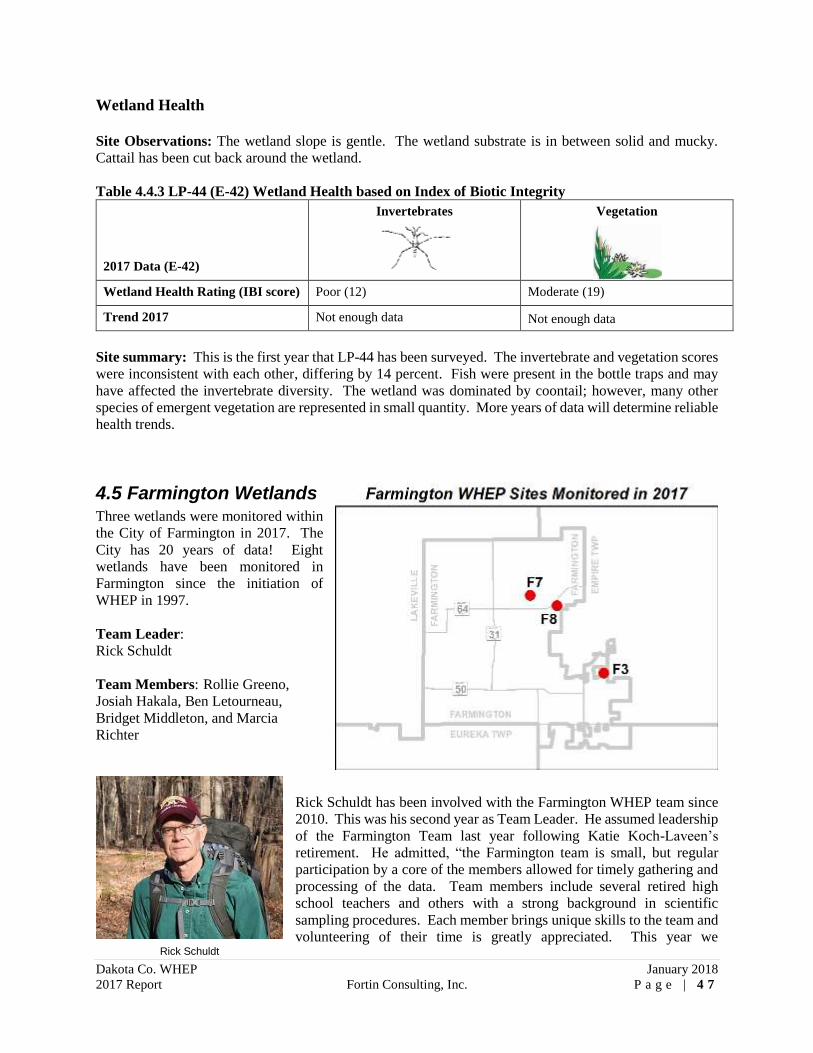
Dakota Co. WHEP January 2018
2017 Report Fortin Consulting, Inc. P a g e | 4 7
Wetland Health
Site Observations: The wetland slope is gentle. The wetland substrate is in between solid and mucky.
Cattail has been cut back around the wetland.
Table 4.4.3 LP-44 (E-42) Wetland Health based on Index of Biotic Integrity
2017 Data (E-42)
Invertebrates
Vegetation
Wetland Health Rating (IBI score) Poor (12) Moderate (19)
Trend 2017 Not enough data Not enough data
Site summary: This is the first year that LP-44 has been surveyed. The invertebrate and vegetation scores
were inconsistent with each other, differing by 14 percent. Fish were present in the bottle traps and may
have affected the invertebrate diversity. The wetland was dominated by coontail; however, many other
species of emergent vegetation are represented in small quantity. More years of data will determine reliable
health trends.
4.5 Farmington Wetlands Three wetlands were monitored within
the City of Farmington in 2017. The
City has 20 years of data! Eight
wetlands have been monitored in
Farmington since the initiation of
WHEP in 1997.
Team Leader:
Rick Schuldt
Team Members: Rollie Greeno,
Josiah Hakala, Ben Letourneau,
Bridget Middleton, and Marcia
Richter
Rick Schuldt has been involved with the Farmington WHEP team since
2010. This was his second year as Team Leader. He assumed leadership
of the Farmington Team last year following Katie Koch-Laveen’s
retirement. He admitted, “the Farmington team is small, but regular
participation by a core of the members allowed for timely gathering and
processing of the data. Team members include several retired high
school teachers and others with a strong background in scientific
sampling procedures. Each member brings unique skills to the team and
volunteering of their time is greatly appreciated. This year we Rick Schuldt

Dakota Co. WHEP January 2018
2017 Report Fortin Consulting, Inc. P a g e | 4 8
coordinated processing of invertebrate samples with the Apple Valley Team at the Apple High School labs.
This worked well for sharing of information, expertise, and equipment.”
Rick is a retiree of the U.S. Fish and Wildlife Service and for many years worked throughout the Great
Lakes in the Service’s Sea Lamprey Control Program. He spent many years evaluating the effects of a
chemicals fed into streams to eliminate larval sea lampreys and the effects of those chemicals on non-target
organisms. He enjoys the switch to small wetlands to learn about a different suite of organisms and plants
and to follow their changes from year to year.
Jennifer Dullum has administered the WHEP program for the City of
Farmington since 2003. The role of the City is to determine the wetlands to be
monitored, provide administrative support to the volunteers, review of the data
collected and publicize the program through local media sources. She says, "The
WHEP program is important to the City in comparing past data to see changes
occurring within the wetland system as development increases in
Farmington. WHEP volunteers are extremely dedicated and all their hard work
is appreciated and a value to the City. Because of the volunteers, wetland health
is monitored at a much higher level than it would be without their
assistance." Jen decided to change career paths in April departing the City, but
left a well-run program for her predecessor. Katy Gehler, Public Works
Director, has served the administrative role in the interim.
Farmington General Wetland Health
Figure 4.5 presents an overall view of wetland health for all of the 2017 monitoring sites in Farmington
based on the IBI scores for invertebrates and vegetation presented as a percent. Figure 4.5 also illustrates
the consistency between the IBI scores (in percent form) for each wetland sampled. Invertebrate and
vegetation scores that differ by ten percent or less are considered consistent. Based on the IBI scores, a
wetland health rating is assigned as excellent, moderate or poor. Scores for the three wetlands indicate poor
to moderate wetland health. Invertebrate and vegetation health scores were inconsistent for F-3 and F-7,
differing by 13 and 38 percent, respectively. Invertebrates rated poor in all three wetlands. Vegetation
rated poor for wetland F-8, and rated moderate for wetland F-3 and F-7.
Figure 4.5 Farmington site scores (percent) for the 2017 sampling season
0
20
40
60
80
100
F-3 F-7 F-8
We
tla
nd
He
alt
h R
ati
ng
IB
I S
co
re (
%)
Wetland Site
Farmington Wetland Health 2017
Invertebrates Vegetation
Exc
Mod
Poor
Jen Dullum

Dakota Co. WHEP January 2018
2017 Report Fortin Consulting, Inc. P a g e | 4 9
4.5.1 Kral Pond (F-3)
F-3, also known as Kral Pond, is a 10-acre, type 4 wetland located within
the Vermillion River Watershed. The wetland watershed is 41.8 acres and
6.6 percent impervious. There is one inlet in the southwest corner, one
inlet in the northeast corner, and one outlet on the north end of the wetland.
It is obvious, based on its shape, that this wetland has been altered in the
past, likely to accommodate farming practices. Kral Pond is included in
the City’s wetland management plan and is designated as a Manage 2
wetland. Manage 2 wetlands have usually been altered by human
activities. These wetlands have low to medium floral diversity and
wildlife habitat components, and are slightly susceptible to impacts from
stormwater. There is development to the north, south, and west, and
agriculture to the east. Wetland buffers are in place. The wetland
management goal is to document how housing and agriculture impact the
man-made wetlands.
Wetland Health
Site Observations: The wetland slope is gentle. The wetland
substrate is firm. This is a large wetland with extensive stands
of cattail. There is an abundance of filamentous green algae
along the cattails. The sampling location is adjacent to a road
which provides easy access for fishing and non-motorized
watercraft. Sampling has not provided a great variety of
invertebrates over the years owing to the lake-like habitat. This
results in IBI scores in the poor range most years. The team
finds a rich variety of aquatic plants at the site each year.
Eurasian water-milfoil and reed canary grass are present. Green
frogs were heard.
Table 4.5.1 Kral Pond (F-3) Wetland Health based on Index of Biotic Integrity
2017 Data (F-3)
Invertebrates
Vegetation
Wetland Health Rating (IBI score) Poor (14) Moderate (21)
Trend 1998-2017 Stable, but variable Stable, but variable
Rick Schuldt, Josiah Hakala, and Bridgit Middleton work with the West St Paul team at the
WHEP invertebrate training

Dakota Co. WHEP January 2018
2017 Report Fortin Consulting, Inc. P a g e | 5 0
Figure 4.5.1 Invertebrate and vegetation trends for Kral Pond (F-3)
Site summary: Kral Pond has been monitored for 20 consecutive years. The invertebrate and vegetation
scores were inconsistent again in 2017, differing by 13 percent. Invertebrates received a poor health score
while vegetation received a moderate health score. In 2017, very few macroinvertebrates were found in the
bottle traps, but fish were collected. Dragonflies, mayflies, snails, and crustaceans were collected by
dipnets. A dense and diverse population of submergent vegetation was present, including bladderwort. The
data throughout the years has been variable; gradually decreasing from 1998 to 2008 and then improving
from 2008 to 2017. Vegetation scores are more often higher than invertebrate scores; however, invertebrate
and vegetation scores are consistent with each other for many of the years of data and follow a similar
pattern. The long-term health trends are stable. The area was historically agricultural. Development
surrounding the wetland may have impacted the wetland. In some cases, conversion from agriculture to
residential development can improve water quality since stormwater treatment is added. The fluctuation in
the health trend may be in response to development in the area.
4.5.2 Autumn Glen (F-7) Autumn Glen (F-7) is a 2.9-acre wetland within the Vermillion
River Watershed. The wetland watershed is ten acres and four
percent impervious. There is one inlet in the northwest corner of
the wetland along Dunbury Avenue and one outlet in the
northeast corner. The wetland is included in the City’s
stormwater management plan; however, it does not have a
designated classification. The wetland management goal is to
understand the health of a wetland surrounded by forest,
agriculture, and residential homes in an area with potential
development. There is development to the north and west, and
forest and agriculture to the east. Man-made ponds lie to the
north and south. The water ultimately flows to North Creek.
Autumn Glen is located within a trail system, but is not easily spotted from the trail. Tall grasses (including
reed canary grass) and tree lines obstruct views. The wetland is approximately 50 meters from the trail.
0
20
40
60
80
100
1998 2000 2002 2004 2006 2008 2010 2012 2014 2016
IBI
Sco
re (
%)
Kral Pond (F-3) 1998-2017
Invertebrates VegetationInvertebrates x-check Vegetation x-checkInvertebrates Trend Vegetation Trend
Exc
Mod
Poor

Dakota Co. WHEP January 2018
2017 Report Fortin Consulting, Inc. P a g e | 5 1
Wetland Health
Site Observations: The wetland slope is gentle, and the
substrate is moderately mucky. Reed canary grass surrounds the
wetland. Low water has made monitoring challenging in past
years, but frequent rains this year maintained suitable water
levels. Spike-rush, bulrush, coontail, bladderwort, duckweed,
water-meal, and bur-reed were present. Snails and leeches are
abundant. The wetland is natural and secluded. A bicycle path
runs along the south side of the wetland separated by a wide
stand of reed canary grass. The site provides ideal breeding
habitat for frogs and attracts hungry egrets and great blue herons.
Frogs, dragonflies, and water fowl observed. The City team
sampled two weeks later this year.
Table 4.5.2 Autumn Glen (F-7) Wetland Health based on Index of Biotic Integrity
2017 Data (F-7)
Invertebrates
Vegetation
Wetland Health Rating (IBI score) Poor (10) Moderate (25)
Cross-check Rating (IBI score) Moderate (16) Moderate (21)
Trend 2011-2017 Variable Improving
Figure 4.5.2 Invertebrate and vegetation trends for Autumn Glen (F-7)
Site Summary: This is the seventh consecutive year that Autumn Glen has been monitored. This wetland
was cross-checked by another WHEP team in 2017. The invertebrate and vegetation scores surveyed by
the City team were not consistent with each other, differing by 38 percent. The invertebrate rated poor and
0
20
40
60
80
100
2011 2013 2015 2017
IBI
Sco
re (
%)
Autumn Glen (F-7) 2011-2017
Invertebrates Vegetation
Invertebrates x-check Vegetation x-check
Invertebrates Trend Vegetation Trend
Mod
Poor
Josiah Hakala, Marcia Richter, Ben Letourneau, Rick Schuldt, and Rollie Greeno

Dakota Co. WHEP January 2018
2017 Report Fortin Consulting, Inc. P a g e | 5 2
the vegetation rated moderate. The invertebrate and vegetation scores surveyed by the cross-check team
were consistent, though, both rating moderate. In 2017, the vegetation scores between the City team and
the cross-check team were consistent, but the invertebrate scores were not. The City team and cross-check
team found very similar plant species; however, the City team identified sedges which improved their
vegetation score. Each of the teams found an abundance of leeches, bugs, and beetles in the bottle traps.
One species of snail and one species of truefly were the only other species of invertebrate collected by the
City team in 2017. The cross-check team collected dragonflies, caddisflies, and multiple snail and truefly
taxa. Both teams commented that tadpoles were present in the bottle traps. Fortin Consulting also
completed a vegetation survey in Autumn Glen in 2017. FCI observed similar plant species as the City
team, and calculated an identical vegetation health score. The vegetation trend appears to be improving.
The invertebrate scores are variable, but the trend appears to be declining slightly.
4.5.3 Mystic Meadows (F-8)
Mystic Meadows (F-8) is a 6.2-acre, type 2 wetland within the Vermillion
River Watershed. The wetland drainage area is 8.2 acres and flows north to
North Creek. There is one inlet on the southwest corner of the wetland.
There is one outlet in the southeast corner and one outlet in the northeast
corner of the wetland.
Mystic Meadows wetland is a created wetland which accompanied a City
road construction project. The wetland is being managed to better
understand the dynamics of a created wetland and actively managed upland
prairie. There is development to the south and agriculture to the north.
Wetland buffers are in place.
Wetland Health
Site Observations: The sampling site is in a circle of open water at the center of the wetland, surrounded
by cattails. The team commented, “the hike in through the cattails is a real adventure. This year we were
surprised by a neighbor who flew his drone overhead documenting our trek into the site. He filmed our
adventure and we await its showing on one of those survival episodes on TV. We were disappointed with
our survey this year as neither plants nor invertebrates fared as well. Toad tadpoles were extremely
abundant this year and their decaying black bodies filled the bottle traps. We also captured brook
sticklebacks in the traps and observed a large snapping turtle. Since the site is surrounded by cattails, there
is no opportunity in the vegetation surveys to collect common shoreline plants.”
Table 4.5.3 Mystic Meadows (F-8) Wetland Health based on Index of Biotic Integrity
2017 Data (F-8)
Invertebrates
Vegetation
Wetland Health Rating (IBI score) Poor (12) Poor (15)
Trend 2016-2017 Not enough data Not enough data

Dakota Co. WHEP January 2018
2017 Report Fortin Consulting, Inc. P a g e | 5 3
Figure 4.5.3 Invertebrate and vegetation trends for Mystic Meadows (F-8)
Site Summary: This is the second time that Mystic Meadows has been surveyed. Invertebrate and
vegetation scores were consistent with each other, both rating poor health. Muskgrass, duckweed, and
water-meal dominated the vegetation community. Only six species of vegetation were present in the
vegetation plot. The vegetation data is similar to 2016. The team commented that the dense stand of
cattails deprives the vegetation plot from emergent and grasslike vegetation. Leeches, snails, dragonflies,
and scuds were collected in the dipnets. Tadpoles and fish were present in the bottle traps. The invertebrate
score declined. In 2016, the invertebrate collection included multiple taxa of leeches and dragonflies, which
enhanced the diversity and health score.
4.6 Hastings Wetlands Four wetlands were monitored within
the City of Hastings in 2017. The City
has 19 years of data! Nine wetlands
have been sampled in the City of
Hastings through the WHEP program
since 1999.
Team Leader: Jessie Eckroad
Team Members: Cody Dalrymple,
Alex Franzen, Sue Gerlach, Brian
Huberty, Mike Nelson, and Dwight
Smith
0
20
40
60
80
100
2016 2017
IBI
Sco
re (
%)
Mystic Meadows (F-8) 2016-2017
Invertebrates Vegetation
Invertebrates Trend Vegetation Trend
Exc
Mod
Poor

Dakota Co. WHEP January 2018
2017 Report Fortin Consulting, Inc. P a g e | 5 4
This was Jessie Eckroad’s third year as a WHEP team leader. She wrote, “I joined WHEP in the Spring of 2015 with the intent to gain experience as a leader and scientist, and although field sessions and lab ID work were incredibly fascinating and educational, I found that my favorite part of WHEP was the amazing group of people I am privileged to call my team and my friends. Because of their incredible patience, dedication, experience, and support, I transformed from an apprehensive rookie into a confident, knowledgeable, fun-
loving leader. This summer, it was great to build on the relationships I formed with my team mates in past years, and we made many great memories this
season!”
John Caven is the Assistant City Engineer for the City
of Hastings. He has been the WHEP City contact and
administrator since 2010. His role includes selecting
the wetlands to be monitored as well as being a
communication link for the City. He said, “The City
really appreciates the volunteer’s hours of hard work. The data collected
provides the City a biological snapshot of the health of area ponds. Through time,
the City can see how surrounding land management practices affect a local
ponding basin.”
Hastings General Wetland Health
Figure 4.6 presents an overall view of wetland health for all of the
2017 monitoring sites in Hastings based on the IBI scores for
invertebrates and vegetation presented as a percent. Figure 4.6
also illustrates the consistency between the IBI scores (in percent
form) for each wetland sampled. Invertebrate and vegetation
scores that differ by ten percent or less are considered consistent.
Based on the IBI scores, a wetland health rating is assigned as
excellent, moderate or poor. The wetlands showed poor to
excellent wetland health in 2017. Invertebrate and vegetation
scores for H-4, H-6, and H-56 were inconsistent, differing by 16,
13, and 39 percent, respectively. H-56 scored excellent for
invertebrates.
John Caven
Jessie Eckroad
Hastings team at WHEP Invertebrate Training

Dakota Co. WHEP January 2018
2017 Report Fortin Consulting, Inc. P a g e | 5 5
Figure 4.6 Hastings site scores (percent) for the 2017 sampling season
4.6.1 Stonegate Treated Wetland (H-4)
H-4, also known as Stonegate Treated, is the second cell of a two-celled
stormwater management system created to treat runoff from surrounding
residential development. It is a 1.2-acre, type 4 stormwater detention pond
located within the Vermillion River Watershed. The watershed is nine to
ten acres, and is 30 to 40 percent impervious. The wetland has one inlet
in the southeast corner and one outlet on the north end. It is part of the
stormwater management plan with a goal to improve water quality of the
stormwater runoff before it adversely affects the Vermillion River.
The watershed is primarily residential with private property on three sides
and a public trail along the south side of the wetland. Private landowners within the Wyndham Hills
Neighborhood Association manage their own frontages of the pond with rip-rap, mowing, and chemical
use. Several property owners demonstrate good management practices by maintaining shoreland buffers
to protect water quality and provide wildlife habitat. In 2004, the Wyndham Hills Neighborhood
Association partnered with the City of Hastings and the DNR to provide native plantings around the pond.
A private trail access divides Stonegate pond from another pond just south of the site. Some concerns
compromising the health of the pond include invasive species, mowing too close to the water’s edge, and
the use of chemicals on adjacent shoreline turf.
Wetland Health
Site Observations: The wetland slope is moderate. The substrate is very mucky. The cattail population
is very dense. Willows overhang the sample area. There was no submergent vegeation present in the
vegetation plot; however, curly leaf pondweed was noted during the invertebrate sampling.
0
20
40
60
80
100
H-4 H-6 H-56 H-57
We
tla
nd
He
alt
h R
ati
ng
IB
I S
co
re (
%)
Wetland Site
Hastings Wetland Health 2017
Invertebrates Vegetation
Exc
Mod
Poor

Dakota Co. WHEP January 2018
2017 Report Fortin Consulting, Inc. P a g e | 5 6
Table 4.6.1 Stonegate Treated (H-4) Health based on Index of Biotic Integrity
2017 Data (H-4)
Invertebrates
Vegetation
Wetland Health Rating (IBI score) Poor (10) Moderate (17)
Trend 2001-2017 Variable, but stable Stable
Figure 4.6.1 Invertebrate and vegetation trends for Stonegate Treated (H-4)
Site summary: This is the seventeenth consecutive year that Stonegate Treated has been surveyed. The
invertebrates and vegetation scores were inconsistent in 2017, differing by 16 percent. The invertebrates
rated poor, while the vegetation rated moderate. The vegetation trend analysis indicates that wetland health
is gradually improving; although it has been fairly stable remaining in the moderate category since the poor
scores found in 2001 and 2002. Despite only a few individual plants of each recorded species, the
vegetation health rated moderate. Since 2014, the vegetation health has received the same score. The plant
community has been similar in all four years with slight variability of emergent forbs. The invertebrate
data varies from year to year; however, the trend analysis indicates stable invertebrate health. The
invertebrate health has scored poor the past two years. Fish were present in the bottle traps and may have
impacted the invertebrate diversity. In addition, there was little to no submergent plants present to provide
habitat in the sampling area.
0
20
40
60
80
100
2001 2003 2005 2007 2009 2011 2013 2015 2017
IBI
Sco
re (
%)
Stonegate Treated (H-4) 2001-2017
Invertebrates Vegetation
Invertebrates Trend Vegetation Trend
Exc
Mod
Poor

Dakota Co. WHEP January 2018
2017 Report Fortin Consulting, Inc. P a g e | 5 7
4.6.2 Lake Rebecca Wetland (H-6)
Lake Rebecca, H-6, also known as Rebecca EM 1&2, is a public water
wetland in the City of Hastings. It is a 19-acre, type 5 open water
wetland located in the Vermillion River Watershed. The wetland
drainage area is 56 acres, and is 1 percent impervious. The wetland has
two stormwater inlets along the southwest shoreline and one controlled
outlet on the southeast end. The wetland is part of the City’s stormwater
management plan, and is designated as a High Quality Wetland. It is
being managed as a wildlife habitat area and for recreational use. A
natural shoreline buffer zone exists along much of the lake’s perimeter.
The Mississippi River Flats Natural Resource Management and
Restoration Plan was adopted in December 2002. One of the inflow
areas to the lake is fitted with a series of sediment control structures.
These are maintained by the City Public Works Department. The City
Parks Department operates an aeration system during the winter season to benefit the game fish.
The wetland is an emergent marsh and shoreline/floodplain forest. Spring fed water from the bluffs helps
maintain water levels. Jaycee Park provides access for recreation on the lake, including a boat launch.
Diversion of stormwater into the lake and an impervious parking lot/boat launch adjacent to the eastern
edge of the lake are of growing concern. Purple loosestrife and zebra mussels are present, and compromise
the health of the lake.
Wetland Health
Site Observations: Access to the monitoring site is via the bikepath on the levee that divides the
Mississippi River and Lake Rebecca. The slope from the bike path to the water is very steep and is covered
with tall grasses and forbs. The wetland slope is moderate, but many submerged logs create tripping
hazards. The substrate is very mucky in the shallow areas, but more solid in deeper water. Water has algae
on the surface. There is a small fringe of cattails and a ring of reed canary grass. Eagles and great blue
Herons were observed.
Table 4.6.2 Lake Rebecca (H-6) Wetland Health based on Index of Biotic Integrity
2017 Data (H-6)
Invertebrates
Vegetation
Wetland Health Rating (IBI score) Moderate (22) Moderate (21)
Cross-check Rating (IBI score) Poor (12) Moderate (19)
Trend 2003-2017 Improving Variable, stable
Lake Rebecca

Dakota Co. WHEP January 2018
2017 Report Fortin Consulting, Inc. P a g e | 5 8
Figure 4.6.2 Invertebrate and vegetation trends for Lake Rebecca (H-6)
Site summary: This is the fifteenth consecutive year of monitoring for Lake Rebecca. There was a lot of
variability in the invertebrate data prior to 2009; however, since then, the invertebrate health has remained
stable and the long term trend appears to be improving for invertebrates. The vegetation data is still
variable; however, the long term trend appears stable. The vegetation scores were the same in 2016 and
2017. This wetland was cross-checked by another WHEP team in 2017. The invertebrate and vegetation
scores were not consistent for the City team, differing by 13 percent. The scores of the cross-check team
were also inconsistent, differing by 14 percent. The invertebrate scores compared between the teams were
inconsistent, differing by 33 percent. The City team calculated higher invertebrate and vegetation scores
than the cross-check team. The City team collected a larger diversity of invertebrates, including multiple
species of dragonflies, caddisflies, snails, and trueflies. There was only one water boatman and two beetles
caught in the cross-check team’s bottle traps. The vegetation species present in each team plot were similar.
4.6.3 180th Street Marsh (H-56)
H-56, also known as 180th Street Marsh, is a 20-acre type 5 open water
wetland located in the Vermillion River Watershed. The wetland
drainage area is 340 acres, and is less than one percent impervious. The
wetland has one inlet on the west side. It also has one outlet that flows
south to the Vermillion River from a culvert under 180th Street. This
wetland is not part of the City’s stormwater management plan; it is in
Dakota County and not under the management of the City.
The wetland is a part of several natural ponds in this agricultural area.
The ponds partially cover several parcels of land, each parcel owned by
a different party. Management practices are dependent on individual
property owners. The landowner has not communicated any plans on
management of the wetland. There is a concern that when the ponds are
dry, the landowners may put the land into production. Farming practices to the south restrict any above
ground outflow to the Vermillion River. Wildlife management is protected through the Farmland and
Natural Area Program. The wetland management goal is for agriculture to continue on surrounding land,
and wildlife habitat management to be practiced in the wetland areas.
0
20
40
60
80
100
2003 2005 2007 2009 2011 2013 2015 2017
IBI
Sco
re (
%)
Lake Rebecca (H-6) 2003-2017
Invertebrates VegetationInvertebrate x-check Vegetation x-checkInvertebrates Trend Vegetation Trend
Exc
Mod
Poor

Dakota Co. WHEP January 2018
2017 Report Fortin Consulting, Inc. P a g e | 5 9
Wetland Health
Site Observations: The wetland slope is moderate. The wetland substrate is somewhat solid, but not rocky,
with matted vegetation. Reed canary grass and cattail dominate the shoreline. Other emergent and
submergent forbs are present in deeper water. Tadpoles were present in bottle traps. Water was very high
in 2017, connecting the adjacent ponds.
Table 4.6.3 180th Street Marsh (H-56) Wetland Health based on Index of Biotic Integrity
2017 Data (H-56)
Invertebrates
Vegetation
Wetland Health Rating (IBI score) Excellent (28) Moderate (19)
Trend 2005-2017 Improving Variable, but improving
Figure 4.6.3 Invertebrate and vegetation trends for 180th Street Marsh (H-56)
Site summary: This is the thirteenth consecutive year that H-56 has been monitored. Both the invertebrate
and vegetation data are variable from year to year; however, both trends appear to be increasing. The
invertebrate score in 2017 is the highest for this wetland over all the years of monitoring. The vegetation
score is lower in 2017 than in 2016; however, vegetation scored the same as in 2014 and 2015. Invertebrate
and vegetation data were not consistent in 2017, differing by 39 percent. Multiple species of dragonflies,
damselflies, mayflies, caddisflies, leeches, snails, and trueflies were present. Reed canary grass dominated
the emergent plant community. Coontail, pondweed, duckweed, and arrowhead dominated the submergent
and floating leaved forb communities. Bulrush, bur-reed, waterweed, and water-meal were also present.
0
20
40
60
80
100
2005 2007 2009 2011 2013 2015 2017
IBI
Sco
re (
%)
180th Street Marsh (H-56) 2005-2017
Invertebrates VegetationInvertebrate x-check Vegetation x-checkInvertebrates Trend Vegetation Trend
Exc
Mod
Poor

Dakota Co. WHEP January 2018
2017 Report Fortin Consulting, Inc. P a g e | 6 0
4.6.4 Cari Park Pond (H-57)
Cari Park Pond (H-57) is a 0.78-acre stormwater detention pond located
in the Vermillion River Watershed. The wetland drainage area is 29
acres, and 14 percent impervious. The wetland has four inlets of which
three are located on the east side of the pond and one on the west side.
It also has one outlet on the west side. This wetland is part of the City’s
stormwater management plan. It is a man-made sedimentation pond
that was constructed in 1989. It is designated as a Medium Quality
Wetland. It serves as a stormwater detention pond within a developed
neighborhood. The goal for the wetland is to improve water quality of
the stormwater runoff before it adversely affects the Vermillion River.
The City has erosion control regulations in place to minimize the
impacts of development within the watershed.
Private landowners within the Cari Park neighborhood manage their own frontages of the pond with rip-
rap, mowing, and chemical use. On the south and east sides of the pond, a City bituminous path connects
the neighborhoods through Cari Park. Cari Park offers recreational opportunities on the south side of the
pond. A bike trail runs along the south and east sides of the pond.
Wetland Health
Site Observations: The wetland is surrounded by residential homes, and a nearby park. The wetland
substrate is very mucky, and the slope is moderate. Tadpoles and fish were present in the bottle traps. Trees
overhang portions of the wetland shoreline. Grasslike plants dominated the vegetation, and little to no
submergent vegetation were present. There was a lot of trash and the wetland was smelly (similar notes in
2016 and 2017). Mallards were observed.
Table 4.6.4 Cari Park Pond (H-57) Wetland Health based on Index of Biotic Integrity
2017 Data (H-57)
Invertebrates
Vegetation
Wetland Health Rating (IBI score) Poor (14) Poor (15)
Trend 2013-2017 Variable Stable

Dakota Co. WHEP January 2018
2017 Report Fortin Consulting, Inc. P a g e | 6 1
Figure 4.6.4 Invertebrate and vegetation trends for Cari Park Pond (H-57)
Site summary: This is the fifth consecutive year that Cari Park Pond has been monitored. The vegetation
and invertebrate scores were consistent with each other in 2017. The vegetation rating dropped just below
moderate; however, the vegetation trend is remaining stable over the five years of surveys. The invertebrate
health rated moderate in 2017. Except for a large drop in score in 2016, the invertebrate scores have
remained stable. Additional years of data will help determine more reliable health trends. Multiple species
of leeches, snails, and trueflies were collected. The invertebrate make-up was different in 2017 than 2016.
4.7 Lakeville Wetlands Two wetlands were monitored within
the City of Lakeville in 2017. The City
has 20 years of data! Ten wetlands
have been sampled in the City of
Lakeville through the WHEP program
since 1998.
Team Leader: Steve Weston
Team Members: David Collins,
David Leard, Dominique Menard,
Shelby Richard, and Emily Smith
0
20
40
60
80
100
2013 2015 2017
IBI
Sco
re (
%)
Cari Park Pond (H-57) 2013-2017
Invertebrates Vegetation
Invertebrates Trend Vegetation Trend

Dakota Co. WHEP January 2018
2017 Report Fortin Consulting, Inc. P a g e | 6 2
Steve Weston has participated in WHEP for over 15 years. He describes himself
as a naturalist, and says, “I am best known for my bird observations, but people
who join me on field trips realize that I am really interested in all components of
the environment. I have little formal biological training.”
Ann Messerschmidt is the WHEP contact at the City of
Lakeville. Her role is to determine which wetlands
should be monitored by WHEP volunteers as well as
review the collected data. She uses the data to compare
to past years data and see what changes are occurring
with the wetlands. She says, "Over time, we hope to be
able to see trends in the data." Ann believes, "The
WHEP program is a great opportunity for residents interested in the natural
environment to learn about wetland plants and invertebrates. This is a valuable
asset to the volunteers. Because of the work by the volunteers, the community as
a whole can now find in-depth information about the connections of the
environment to its inhabitants and how that reflects the overall health of the
system. This helps residents of our community learn how their actions can directly
affect water quality."
Lakeville General Wetland Health Figure 4.7 presents an overall view of wetland health for all the 2017 monitoring sites in Lakeville based
on the IBI scores for invertebrates and vegetation presented as a percent. Figure 4.7 also illustrates the
consistency between the IBI scores (in percent form) for each wetland sampled. Invertebrate and vegetation
scores that differ by ten percent or less are considered consistent. Based on the IBI scores, a wetland health
rating is assigned as excellent, moderate or poor. L-7 scored moderate invertebrate health and excellent
vegetation health. L-8 scored moderate health for both invertebrates and vegetation. Invertebrate and
vegetation data for site L-7 were inconsistent, differing by 29 percent.
Figure 4.7 Lakeville site scores (percent) for the 2017 sampling season
Ann Messerschmidt
Steve Weston
0
20
40
60
80
100
L-7 L-8
We
tla
nd
Hea
lth
Ra
tin
g IB
I S
co
re (
%)
Wetland Site
Lakeville Wetland Health 2017
Invertebrates Vegetation
Exc
Mod
Poor
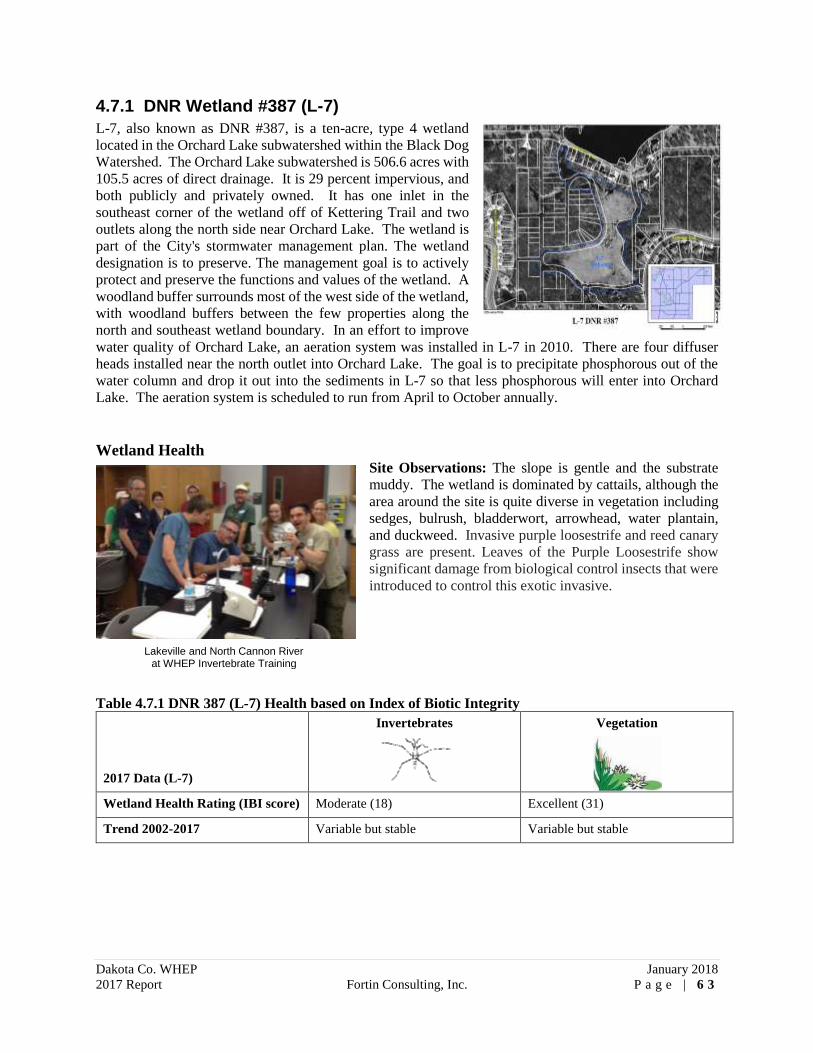
Dakota Co. WHEP January 2018
2017 Report Fortin Consulting, Inc. P a g e | 6 3
4.7.1 DNR Wetland #387 (L-7)
L-7, also known as DNR #387, is a ten-acre, type 4 wetland
located in the Orchard Lake subwatershed within the Black Dog
Watershed. The Orchard Lake subwatershed is 506.6 acres with
105.5 acres of direct drainage. It is 29 percent impervious, and
both publicly and privately owned. It has one inlet in the
southeast corner of the wetland off of Kettering Trail and two
outlets along the north side near Orchard Lake. The wetland is
part of the City's stormwater management plan. The wetland
designation is to preserve. The management goal is to actively
protect and preserve the functions and values of the wetland. A
woodland buffer surrounds most of the west side of the wetland,
with woodland buffers between the few properties along the
north and southeast wetland boundary. In an effort to improve
water quality of Orchard Lake, an aeration system was installed in L-7 in 2010. There are four diffuser
heads installed near the north outlet into Orchard Lake. The goal is to precipitate phosphorous out of the
water column and drop it out into the sediments in L-7 so that less phosphorous will enter into Orchard
Lake. The aeration system is scheduled to run from April to October annually.
Wetland Health Site Observations: The slope is gentle and the substrate
muddy. The wetland is dominated by cattails, although the
area around the site is quite diverse in vegetation including
sedges, bulrush, bladderwort, arrowhead, water plantain,
and duckweed. Invasive purple loosestrife and reed canary
grass are present. Leaves of the Purple Loosestrife show
significant damage from biological control insects that were
introduced to control this exotic invasive.
Table 4.7.1 DNR 387 (L-7) Health based on Index of Biotic Integrity
2017 Data (L-7)
Invertebrates
Vegetation
Wetland Health Rating (IBI score) Moderate (18) Excellent (31)
Trend 2002-2017 Variable but stable Variable but stable
Lakeville and North Cannon River at WHEP Invertebrate Training

Dakota Co. WHEP January 2018
2017 Report Fortin Consulting, Inc. P a g e | 6 4
Figure 4.7.1 Invertebrate and vegetation trend for DNR 387 (L-7)
Site summary: This is the sixteenth consecutive year that DNR 387 has been monitored. The invertebrate
and vegetation scores are both variable throughout the years. The vegetation scores remain moderate to
excellent while the invertebrate scores fluctuate from poor to moderate to excellent. In 2017, the
invertebrate and vegetation scores were inconsistent, differing by 29 percent. The vegetation scored
excellent health while the invertebrates scored moderate health. Both categories indicate variable, yet stable
health trends. Many species of emergent grasslike plants and forbs, submergent forbs, and floating leaved
forbs were present. Leeches, dragonflies, damselflies, snails, and trueflies were present.
4.7.2 DNR #393 (L-8)
L-8, also known as DNR #393, is a 9.6-acre, type 5 wetland located
in the Lake Marion subwatershed of the Vermillion River
Watershed. The wetland drainage area is 74.7 acres, and 17
percent impervious. It is a publicly owned wetland. It has one
non-stormwater inlet on the west side, and one outlet on the south
side. There is a structure on the west side of the wetland that is
connected to another wetland; however, it does not receive
stormwater. The wetland is included in the City’s stormwater
management plan and is designated to preserve. The wetland
management plan is to actively protect and preserve the function
and values of the wetland to the maximum extent feasible. The
wetland is within a residential neighborhood where development began in 2003 and ended in 2008. A
conservation easement of varying widths exists along all sides of this wetland, with vegetative buffer.
Wetland Health
Site Observations: The wetland slope is gentle at the shoreline, but moderate in the water. The substrate
is solid, but covered with some mud. Willows and aspens grow near the water. Dense populations of
0
20
40
60
80
100
2002 2004 2006 2008 2010 2012 2014 2016
IBI
Sco
re (
%)
DNR 387 (L-7) 2002-2017
Invertebrates VegetationInvertebrate x-check Vegetation x-checkInvertebrates Trend Vegetation Trend
Exc
Mod
Poor

Dakota Co. WHEP January 2018
2017 Report Fortin Consulting, Inc. P a g e | 6 5
submergent vegetation are present, including coontail, pondweed, and water-milfoil. Several grasslike
emergent plants are also present, including multiple varieties of rush, and reed canary grass.
Table 4.7.2 DNR Wetland 393 (L-8) Health based on Index of Biotic Integrity
2017 Data (L-8)
Invertebrates
Vegetation
Wetland Health Rating (IBI score) Moderate (16) Moderate (19)
Cross-check Rating (IBI score) Poor (14) Moderate (17)
Trend 2002-2017 Stable Improving
Figure 4.7.2 Invertebrate and vegetation trends for DNR 393 (L-8)
Site summary: DNR 393 has been monitored sixteen consecutive years. This wetland was cross-checked
by another WHEP team in 2017. The invertebrate and vegetation scores were consistent with each other
for both teams’ data. The invertebrates score has maintained an excellent rating for most years of
monitoring; however, in 2017, the invertebrates score dropped to moderate. Fewer taxa of invertebrates
were identified in 2017 than in the past. The invertebrates trend remains stable, though. The vegetation
score has been variable throughout the years; however, the vegetation health trend shows improvement.
The City scores and cross-check scores were consistent with each other for both invertebrates and
vegetation; however, the City team calculated higher invertebrate and vegetation scores than the cross-
check team. Though neither team found an abundance of beetles and bugs in their bottle traps, the cross-
check team did find a higher percentage of water boatman which lowered their Corixid Proportion Metric
Score. The teams identified very similar vegetation species.
0
20
40
60
80
100
2002 2004 2006 2008 2010 2012 2014 2016
IBI
Sco
re (
%)
DNR 393 (L-8) 2002-2017
Invertebrates VegetationInvertebrates x-check Vegetation x-checkInvertebrates Trend Vegetation Trend
Exc
Mod
Poor

Dakota Co. WHEP January 2018
2017 Report Fortin Consulting, Inc. P a g e | 6 6
4.8 Mendota Heights Wetlands Two wetlands were monitored within
the City of Mendota Heights, in 2017.
The City has 20 years of WHEP data!
Seventeen wetlands have been
monitored in Mendota Heights since
the start of the WHEP program.
Team Leader:
Darcy Tatham
Team Members: Devor Barton, John
Bottomley, Nancy Brandes, James
Chastek, Alison Hruby, Jessica Larson,
Randall Mateo, Rachel Quick,
Marjorie Savage, Michelle Skog, Mary
Stade, Anneliese Tatham, and Allyson Tenold
Mendota Heights’ team leader, Darcy Tatham, has been part of the WHEP
for more than 17 years. She remarked, “I enjoyed another year monitoring
the wetlands. I like seeing how the ponds change over time. Copperfield,
being our reference site, is a prime example since it has been monitored
every year for several years. Whether the change is a natural progression,
or influenced by human activity or by weather/climate changes, there is
always change. Thank you to my wonderful crew of volunteers, both
seasoned and new. I remember only one instance of someone getting water
in their waders. Thank you also to Ryan at the City for his support and
confidence in what we are doing. It was another successful year!
Ryan Ruzek has been involved in WHEP since 2005. He is currently the
Public Works Director for Mendota Heights and selects and coordinates the
wetlands to be monitored. Ryan has served as a volunteer on the Mendota
Heights team in the past to gain a better understanding of the program. He
commented, “Mendota Heights monitors two wetlands every year. One
wetland is monitored year after year, and the city selects a second wetland
where future BMP’s are proposed to be installed. The City will then
monitor that wetland again to see if the BMP was a success. WHEP has
also been a great community involvement and education tool. Residents
regularly stop by and inquire about the project.”
Darcy Tatham
Ryan Ruzek
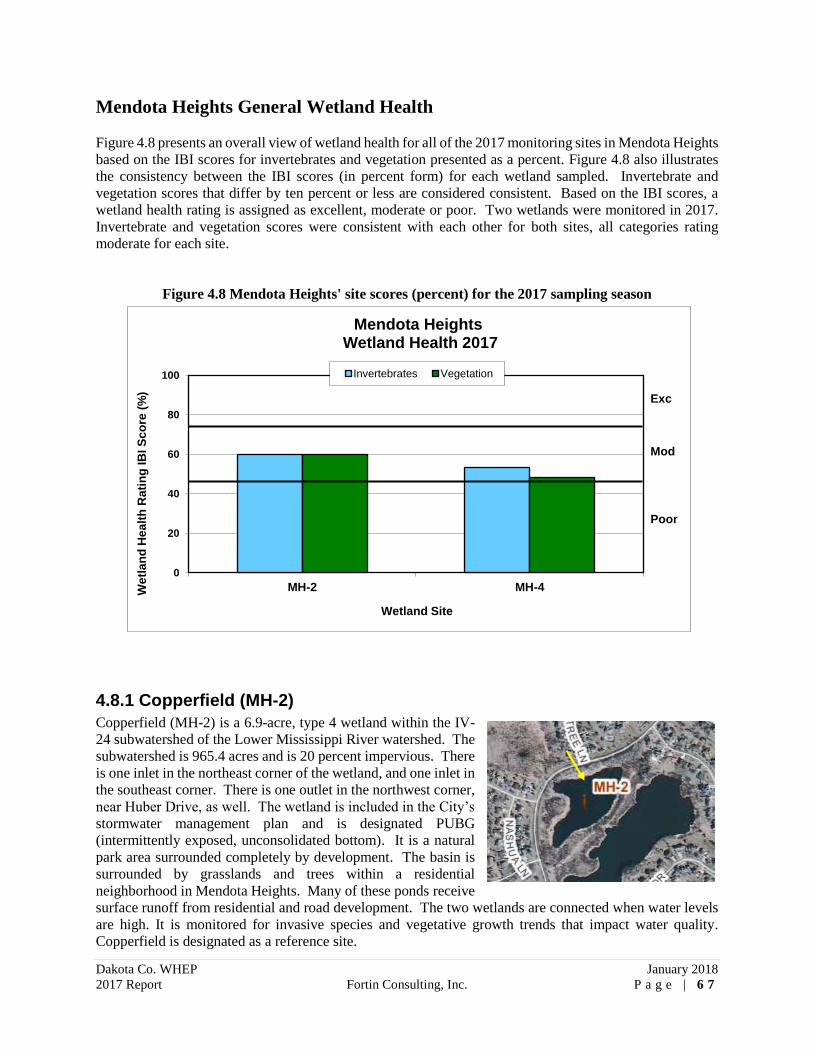
Dakota Co. WHEP January 2018
2017 Report Fortin Consulting, Inc. P a g e | 6 7
Mendota Heights General Wetland Health
Figure 4.8 presents an overall view of wetland health for all of the 2017 monitoring sites in Mendota Heights
based on the IBI scores for invertebrates and vegetation presented as a percent. Figure 4.8 also illustrates
the consistency between the IBI scores (in percent form) for each wetland sampled. Invertebrate and
vegetation scores that differ by ten percent or less are considered consistent. Based on the IBI scores, a
wetland health rating is assigned as excellent, moderate or poor. Two wetlands were monitored in 2017.
Invertebrate and vegetation scores were consistent with each other for both sites, all categories rating
moderate for each site.
Figure 4.8 Mendota Heights' site scores (percent) for the 2017 sampling season
4.8.1 Copperfield (MH-2)
Copperfield (MH-2) is a 6.9-acre, type 4 wetland within the IV-
24 subwatershed of the Lower Mississippi River watershed. The
subwatershed is 965.4 acres and is 20 percent impervious. There
is one inlet in the northeast corner of the wetland, and one inlet in
the southeast corner. There is one outlet in the northwest corner,
near Huber Drive, as well. The wetland is included in the City’s
stormwater management plan and is designated PUBG
(intermittently exposed, unconsolidated bottom). It is a natural
park area surrounded completely by development. The basin is
surrounded by grasslands and trees within a residential
neighborhood in Mendota Heights. Many of these ponds receive
surface runoff from residential and road development. The two wetlands are connected when water levels
are high. It is monitored for invasive species and vegetative growth trends that impact water quality.
Copperfield is designated as a reference site.
0
20
40
60
80
100
MH-2 MH-4We
tla
nd
Hea
lth
Ra
tin
g IB
I S
co
re (
%)
Wetland Site
Mendota HeightsWetland Health 2017
Invertebrates Vegetation
Exc
Mod
Poor

Dakota Co. WHEP January 2018
2017 Report Fortin Consulting, Inc. P a g e | 6 8
Wetland Health
Site Observations: Copperfield is part of a chain of ponds within
an established neighborhood, but is City-owned with no houses
around it. The wetland slope is gentle, and the substrate is very
mucky. Dominant vegetation includes grasses, coontail,
waterweed, duckweed, white water-lilies, and water-meal. A large
diversity of submergent, floating-leaved, and emergent vegetation
were present. Reed canary grass and purple loosestrife were
present.
Table 4.8.1 Copperfield (MH-2) Wetland Health based on Index of Biotic Integrity
2017 Data (MH-2)
Invertebrates
Vegetation
Wetland Health Rating (IBI score) Moderate (18) Moderate (21)
Cross-check Rating (IBI score) Moderate (20) Moderate (17)
Trend 1998-2017 Variable, but stable Variable, but improving
Figure 4.8.1 Invertebrate and vegetation trends for Copperfield (MH-2)
0
20
40
60
80
100
1998 2003 2008 2013
IBI
Sco
re (
%)
Copperfield/Friendly Hills (MH-2) 1998-2017
Invertebrates VegetationInvertebrate x-check Vegetation x-checkInvertebrates Trend Vegetation Trend
Exc
Mod
Poor
Mendota Heights team members at WHEP Invertebrate Training

Dakota Co. WHEP January 2018
2017 Report Fortin Consulting, Inc. P a g e | 6 9
Site Summary: This is the nineteenth year that MH-2 has
been monitored since 1998. There is a lot of variability in the
data throughout the years of monitoring. The invertebrate and
vegetation scores calculated by the City team are exactly
consistent. The invertebrate scores have been in decline the
last three years, but the health trend is showing improvement.
The vegetation health trend remains stable. This wetland was
cross-checked by another WHEP team in 2017. The
invertebrate scores between the two teams were consistent,
but the vegetation scores were not consistent, differing by 11
percent. The City team surveyed a vegetation releve with a
higher diversity of submergent and emergent forbs which
improved the vegetation health score. Fortin Consulting also
completed a vegetation survey at Copperfield. There were minor differences in species identification
between the City team and FCI, and FCI did observe bladderwort; however, the differences averaged out,
and the calculated vegetation health scores were identical.
4.8.2 Industrial Park (MH-4)
Industrial Park (MH-4) is a 0.3-acre, type 4 wetland located within the
IP-12 subwatershed of the Lower Mississippi River Watershed. The
watershed is 30.1 acres and 80 percent impervious. There are three inlets
on the south/southeast side of the wetland, and one outlet on the
southwest side. Industrial Park is part of the City’s stormwater
management plan with a management goal, and used for stormwater
treatment. There are steep slopes around the wetland, and a slope failure
occurred in 2006.
Wetland Health
Site Observations: The wetland is located in a developed industrial area. There are steep slopes all around
the wetland. The wetland substrate is mucky. There is some diversity and some wildlife around the
wetland, but not a lot. Trees surround most of the wetland. Waterweed and pondweed dominate the
submergent vegetation. Rabbits, muskrat, dragonflies, tadpoles, ducks, frogs/toads were observed. A lot
of garbage is present. Tadpoles and fish were caught in the bottle traps.
Table 4.8.2 Industrial Park (MH-4) Wetland Health based on Index of Biotic Integrity
2017 Data (MH-4)
Invertebrates
Vegetation
Wetland Health Rating (IBI score) Moderate (16) Moderate (17)
Trend 1998-2017 Not enough data Not enough data
Mendota Heights Team in the wetland
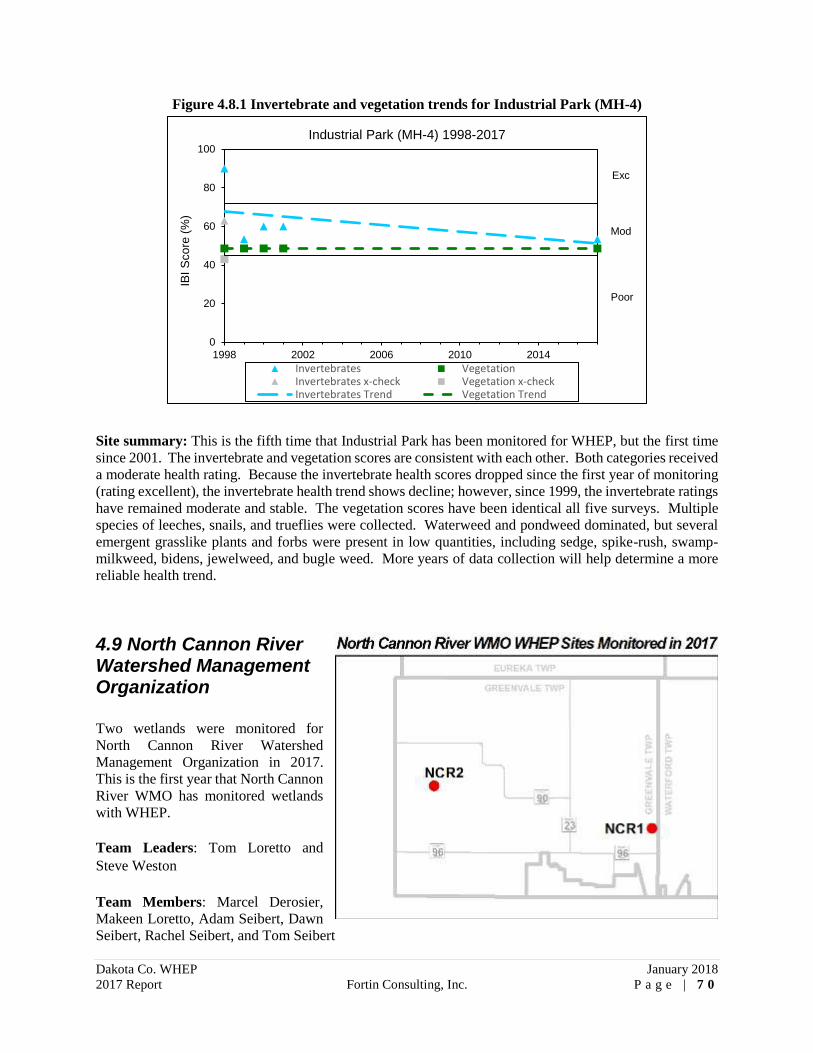
Dakota Co. WHEP January 2018
2017 Report Fortin Consulting, Inc. P a g e | 7 0
Figure 4.8.1 Invertebrate and vegetation trends for Industrial Park (MH-4)
Site summary: This is the fifth time that Industrial Park has been monitored for WHEP, but the first time
since 2001. The invertebrate and vegetation scores are consistent with each other. Both categories received
a moderate health rating. Because the invertebrate health scores dropped since the first year of monitoring
(rating excellent), the invertebrate health trend shows decline; however, since 1999, the invertebrate ratings
have remained moderate and stable. The vegetation scores have been identical all five surveys. Multiple
species of leeches, snails, and trueflies were collected. Waterweed and pondweed dominated, but several
emergent grasslike plants and forbs were present in low quantities, including sedge, spike-rush, swamp-
milkweed, bidens, jewelweed, and bugle weed. More years of data collection will help determine a more
reliable health trend.
4.9 North Cannon River Watershed Management Organization
Two wetlands were monitored for
North Cannon River Watershed
Management Organization in 2017.
This is the first year that North Cannon
River WMO has monitored wetlands
with WHEP.
Team Leaders: Tom Loretto and
Steve Weston
Team Members: Marcel Derosier,
Makeen Loretto, Adam Seibert, Dawn
Seibert, Rachel Seibert, and Tom Seibert
0
20
40
60
80
100
1998 2002 2006 2010 2014
Industrial Park (MH-4) 1998-2017
Invertebrates VegetationInvertebrates x-check Vegetation x-checkInvertebrates Trend Vegetation Trend
IBI
Sco
re (
%)
Exc
Mod
Poor

Dakota Co. WHEP January 2018
2017 Report Fortin Consulting, Inc. P a g e | 7 1
Tom Loretto is the new co-team leader for North Cannon River Watershed
Management Organization. He is a geologist with a career in oil and gas
exploration. Tom has worked in New Orleans, Nigeria and Saudi Arabia,
reviewing and selecting well locations in those regions. In 2015, Tom and his
family moved to Northfield, and admitted that he is “back in touch with his
childhood pursuits of chasing wildlife in open fields.” Tom recently completed
(2017) the Professional Certificate program in Geographic Information Systems
(GIS), through Itasca Community College. He uses GIS to generate maps in
support of sustainable agriculture projects, and to monitor the health of wetlands.
Steve Weston is co-team leader for North Cannon River Watershed Management
Organization, and also team leader to Lakeville. He has participated in WHEP for
over 15 years. He describes himself as a naturalist, and says, “I am best known
for my bird observations, but people who join me on field trips realize that I am
really interested in all components of the environment. I have little formal
biological training.”
Ashley Gallagher is a Resource Conservationist for
Dakota County Soil and Water Conservation
District. She explained, “We serve as the
Administrator for the North Cannon River Watershed
Management Organization (NCRWMO). The
NCRWMO is a watershed in the southern part of
Dakota County. A Board of managers with representation from eight townships
and three cities oversees watershed management and planning in the North
Cannon River Watershed area. One goal within the NCRWMO watershed
management plan is ‘to inform landowners, children, and local units of
government, about the watershed and human impacts on water quality and
quantity, and to invite public participation in watershed management
processes.’ In 2017, the Board decided to participate in WHEP for the first
time. They are pleased with the way the program uses volunteers to conduct the monitoring, which helps
increase public awareness of the watershed and the issues it faces. NCRWMO chose two wetlands, both
in rural landscapes, for monitoring in 2017. It is likely that the same two wetlands will continue to be
monitored in order to establish some trends in data. In the future this data can help the NCRWMO achieve
another goal, which is ‘to protect wetlands from destruction or deterioration due to development, drainage,
agriculture, and other adverse activities’.”
North Cannon River WMO General Wetland Health
Figure 4.9 presents an overall view of wetland health for all the 2017 monitoring sites in North Cannon
River WMO based on the scores for invertebrates and vegetation presented as a percent. Figure 4. 9 also
illustrates the consistency between the IBI scores (in percent form) for each wetland sampled. Invertebrate
and vegetation scores that differ by ten percent or less are considered consistent. Based on the IBI scores,
a wetland health rating is assigned as excellent, moderate or poor. Invertebrate and vegetation scores for
each site were inconsistent with each other. NCR-1 rated moderate for invertebrate health and poor for
vegetation health, and their scores differed by 24 percent. NCR-2 rated moderate health for both
invertebrates and vegetation, but their scores differed by 18 percent.
Ashley Gallagher
Steve Weston
Tom Loretto

Dakota Co. WHEP January 2018
2017 Report Fortin Consulting, Inc. P a g e | 7 2
Figure 4.9 North Cannon River WMO site scores (percent) for 2017
4.9.1 Wasner (NCR-1)
Wasner (NCR-1) is a 0.5-acre, type 4 wetland within the Cannon River
watershed. The wetland watershed is 160 acres with four percent
impervious surface. A wetland restoration was completed in 1996. The
wetland management goal is to maintain the wetland and determine the
effectiveness of the restoration.
This wetland is located within the Greenvale Township in southwest
Dakota County. The surrounding area is predominately agricultural.
There is potential for future development in the area.
Wetland Health
Site Observations: The wetland substrate is muddy. Leeches,
dragonflies, snails, and trueflies were present. Pondweed, a
submergent forb, dominated the wetland. Duckweed and water-
meal covered most of the wetland surface. Bur-reed, bidens,
smartweed, and spike-rush were present. Reed canary grass
dominated the shoreline with some patches of cattails. Green
heron, great egret, common yellowthroat, song sparrow, marsh
wren, and tree swallow were observed.
0
20
40
60
80
100
NCR-1 NCR-2
North Cannon River Wetland Health 2017
Invertebrates Vegetation
North Cannon River team in the wetland

Dakota Co. WHEP January 2018
2017 Report Fortin Consulting, Inc. P a g e | 7 3
Table 4.9.1 Wasner (NCR-1) Wetland Health based on Index of Biotic Integrity
2017 Data (NCR-1)
Invertebrates
Vegetation
Wetland Health Rating (IBI score) Moderate (20) Poor (15)
Trend 2017 Not enough data Not enough data
Site summary: This is the first time that Wasner has been monitored by WHEP volunteers. The
invertebrate and vegetation health scores were not consistent, differing by 24 percent. The invertebrate
health rated moderate while the vegetation health rated poor. More years of data will help determine a
more reliable health trend.
4.9.2 Peterson (NCR-2)
Peterson (NCR-2) is a 2-acre, type 5 wetland within the Cannon River
watershed. The wetland watershed is 55 acres with no impervious surface.
It is an excavated wetland. The wetland may be affected by the flow
changes of nearby Dutch Creek.
This wetland is located within the Greenvale Township in southwestern
Dakota County. The surrounding area is predominately agricultural.
Wetland Health
Site Observations: The wetland slope is deep entering from the roadside ditch. The wetland substrate is
firm, but covered in six inches of mud. Water is flowing in the roadside ditch adjacent to the wetland.
Cattails and reed canary grass surround this open water wetland in the middle of farm fields. Coontail
dominates the submergent vegetation. A gelatinous, black material covers the coontail. Lemna and water-
meal cover the surface of the wetland. Leeches, dragonflies, mayflies, snails, trueflies, and crustaceans
were collected.
Table 4.9.2 Peterson (NCR-2) Wetland Health based on Index of Biotic Integrity
2017 Data (NCR-2)
Invertebrates
Vegetation
Wetland Health Rating (IBI score) Moderate (20) Moderate (17)
Cross-check Rating (IBI score) Moderate (16) Poor (13)
Trend 2017 Not enough data Not enough data

Dakota Co. WHEP January 2018
2017 Report Fortin Consulting, Inc. P a g e | 7 4
Site summary: This is the first year that Peterson wetland
has been monitored by WHEP volunteers. This wetland was
also cross-checked by another WHEP team in 2017. The
invertebrate and vegetation scores were not consistent with
each other for either team. The NCR team calculated
moderate ratings for both invertebrate and vegetation health,
but the scores differed by 18 percent. The invertebrate and
vegetation scores differed by 16 percent for cross-check
team. The scores between teams were not consistent either.
While the City team and cross-check team both calculated
moderate ratings for invertebrates, the scores differed by 14
percent. The vegetation scores differed by 12 percent. The
results of both teams showed the invertebrates scoring better
health than vegetation. Bulrush, reed canary grass, coontail, duckweed, water-meal, bur-reed, and cattail
were the dominant vegetation. Only small populations of a few other species of vegetation were
represented. Fortin Consulting also completed a vegetation survey in Peterson wetland. FCI observed
vegetation species similar to the City team, and the vegetation health scores were identical. Additional
years of monitoring will help to determine more reliable wetland health trends.
4.10 Rosemount Wetlands
Four wetlands were monitored in the
City of Rosemount in 2017. The City
has 20 years of WHEP data! Twenty-
four wetlands have been monitored in
Rosemount since the start of WHEP.
Team Leaders: Amy Jo Forslund
Team Members: Maisy Bach, Cody
Bahr, Jacob Geller, Greg Lund, Bill
Meyer, Eric Nelson, Janet Pettersen,
Jane Porterfield, Geri Reinardy, Andy
Simon, Averie Simon, Peyton Simon,
and Denise Wilkens
Amy Jo Forslund is the team leader for Rosemount. She explained, “This was
my second year being the Rosemount team leader. I was a WHEP volunteer on
the Eagan team for seven years, from 2007 to 2012, and asked to come back as a
team leader for Rosemount. In my work life I am a substitute preschool teacher
and an environmental educator. I have worked at many Metro area parks
including Three Rivers Park District, Dakota County Parks, and Tamarack Nature
Center. As an environmental educator I have taught many elementary age
children about natural history topics, and one of my favorite topics is wetlands.
Being a part of WHEP has been a great opportunity to delve deeper into the
wetland world. I want to thank the WHEP Rosemount team for their dedication,
knowledge, and their masterful wetland and lab skills. It is honor to be a part of
such a wonderful Citizen Science project.” Amy Jo Forslund
North Cannon River and Lakeville teams at WHEP Invertebrate Training

Dakota Co. WHEP January 2018
2017 Report Fortin Consulting, Inc. P a g e | 7 5
The City of Rosemount considers its
wetlands a critical part of its Natural
Resources. We have participated in the
WHEP program since it began because it provides essential information that
allows the city to better manage and restore its wetland biodiversity both now
and in the future.
Over the years, the WHEP volunteers have provided the city with high-quality
quantitative data for numerous wetlands, which would otherwise be very difficult
to obtain with our limited staff time and resources. The data they collect is
primarily used to document wetland quality and track changes in wetland health
trends. The volunteer efforts are greatly appreciated!
Rosemount General Wetland Health
The City of Rosemount has a wetland management plan which includes four different categories of
protection. Vegetated buffers are required around wetlands in new developments, with the buffer size
determined by the wetland protection designation.
Wetland designation Required buffer
Preserve Wetlands 75 feet
Manage I Wetlands 50 feet
Manage II Wetlands 30 feet
Utilize Wetlands 15 feet in non-agricultural areas only
Figure 4.10 Rosemount site scores (percent) for 2017
Christine Watson, City of Rosemount
0
20
40
60
80
100
R-4 R-14 R-21 R-23
We
tla
nd
Hea
lth
Ra
tin
g IB
I S
co
re (
%)
Wetland Site
Rosemount Wetland Health 2017
Invertebrates Vegetation
Exc
Mod
Poor
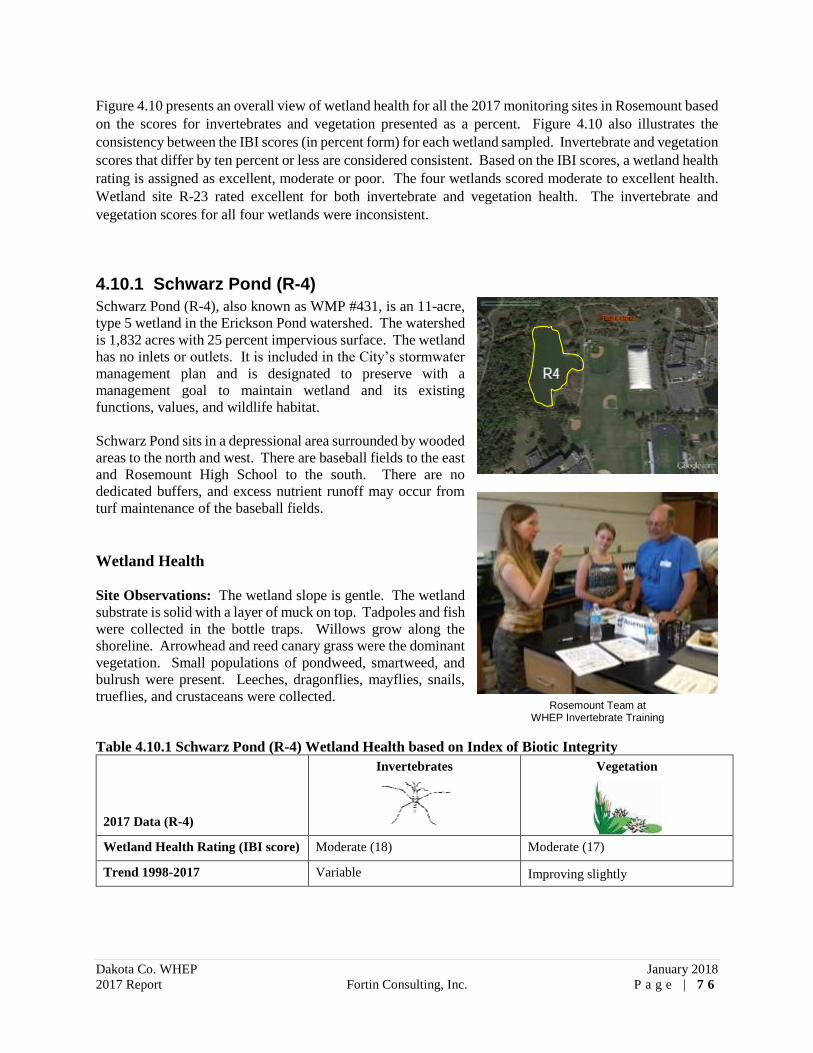
Dakota Co. WHEP January 2018
2017 Report Fortin Consulting, Inc. P a g e | 7 6
Figure 4.10 presents an overall view of wetland health for all the 2017 monitoring sites in Rosemount based
on the scores for invertebrates and vegetation presented as a percent. Figure 4.10 also illustrates the
consistency between the IBI scores (in percent form) for each wetland sampled. Invertebrate and vegetation
scores that differ by ten percent or less are considered consistent. Based on the IBI scores, a wetland health
rating is assigned as excellent, moderate or poor. The four wetlands scored moderate to excellent health.
Wetland site R-23 rated excellent for both invertebrate and vegetation health. The invertebrate and
vegetation scores for all four wetlands were inconsistent.
4.10.1 Schwarz Pond (R-4)
Schwarz Pond (R-4), also known as WMP #431, is an 11-acre,
type 5 wetland in the Erickson Pond watershed. The watershed
is 1,832 acres with 25 percent impervious surface. The wetland
has no inlets or outlets. It is included in the City’s stormwater
management plan and is designated to preserve with a
management goal to maintain wetland and its existing
functions, values, and wildlife habitat.
Schwarz Pond sits in a depressional area surrounded by wooded
areas to the north and west. There are baseball fields to the east
and Rosemount High School to the south. There are no
dedicated buffers, and excess nutrient runoff may occur from
turf maintenance of the baseball fields.
Wetland Health
Site Observations: The wetland slope is gentle. The wetland
substrate is solid with a layer of muck on top. Tadpoles and fish
were collected in the bottle traps. Willows grow along the
shoreline. Arrowhead and reed canary grass were the dominant
vegetation. Small populations of pondweed, smartweed, and
bulrush were present. Leeches, dragonflies, mayflies, snails,
trueflies, and crustaceans were collected.
Table 4.10.1 Schwarz Pond (R-4) Wetland Health based on Index of Biotic Integrity
2017 Data (R-4)
Invertebrates
Vegetation
Wetland Health Rating (IBI score) Moderate (18) Moderate (17)
Trend 1998-2017 Variable Improving slightly
Rosemount Team at WHEP Invertebrate Training

Dakota Co. WHEP January 2018
2017 Report Fortin Consulting, Inc. P a g e | 7 7
Figure 4.9.1 Invertebrate and vegetation trends for Schwarz Pond (R-4)
Site summary: This is the sixth time Schwarz Pond has been monitored since 1998. The invertebrate and
vegetation health scores were inconsistent in 2017. Both categories rated moderate, but the scores differed
by 11 percent. The invertebrate scores have been variable throughout the years of monitoring, but
maintaining a moderate health rating. In 2017, the vegetation rating jumped from poor to moderate. The
health trend appears to be improving slightly. More years of data will help determine more reliable health
trends.
4.10.2 Mare Pond North (R-14)
Mare Pond North (R-14), also known as WMP #379, is a
4.8-acre, type 5 wetland within the White Lake watershed.
The wetland watershed is 81-acres with 30 percent
impervious surface. R-14 is part of the City’s stormwater
management plan and is designated to preserve with a
management goal to maintain the wetland and its existing
functions, values, and wildlife habitat.
The wetland is located in a basin surrounded by grassland
with sparse trees and shrubs. The wetland receives
stormwater runoff from the adjacent road along the south
side of the wetland. Nutrient loading from nearby
agriculture to the north and residential development to the south are of concern. New developments in the
area require a 75-foot buffer.
Wetland Health
Site Observations: There is a steep, 45 degree slope into the wetland. The wetland substrate is somewhat
mucky. Dominant vegetation include reed canary grass, coontail, pondweed, and arrowhead. Leeches,
dragonflies, snails, trueflies, and crustaceans were collected. There is a lot of litter in the water.
0
20
40
60
80
100
1998 2000 2002 2004 2006 2008 2010 2012 2014 2016
IBI
Sco
re (
%)
Schwarz Pond (R-4) 1998-2017
Invertebrates Vegetation
Invertebrates Trend Vegetation Trend
Exc
Mod
Poor
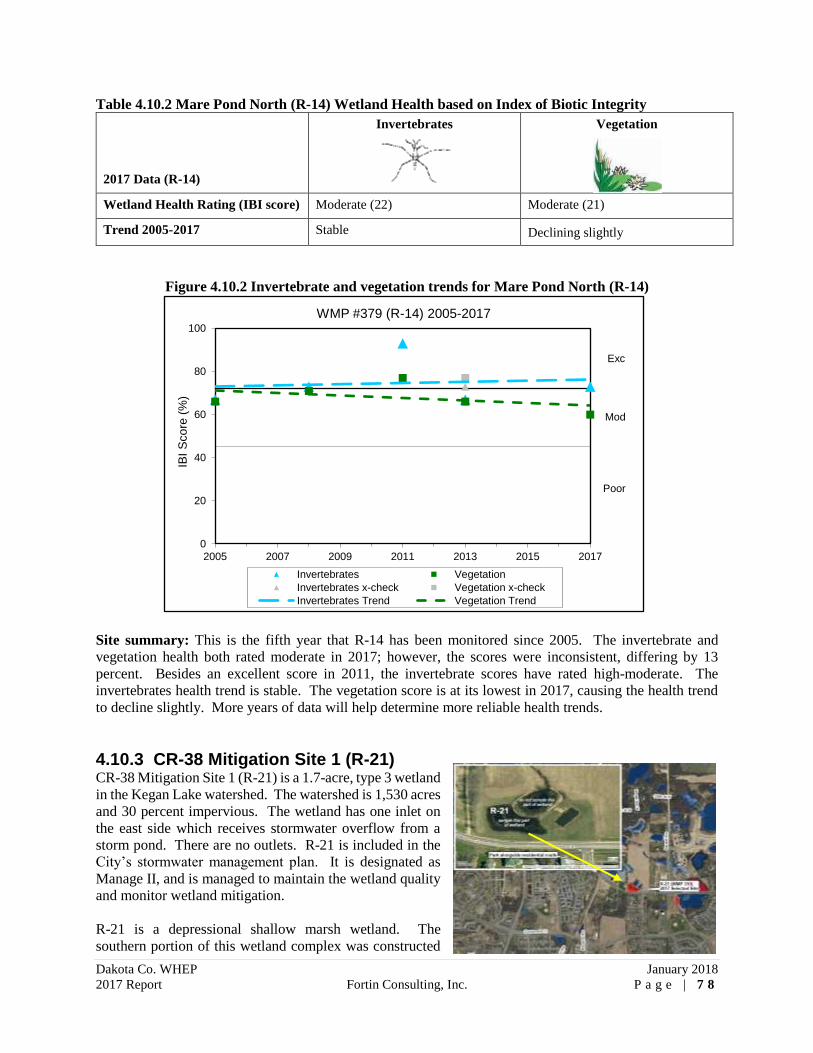
Dakota Co. WHEP January 2018
2017 Report Fortin Consulting, Inc. P a g e | 7 8
Table 4.10.2 Mare Pond North (R-14) Wetland Health based on Index of Biotic Integrity
2017 Data (R-14)
Invertebrates
Vegetation
Wetland Health Rating (IBI score) Moderate (22) Moderate (21)
Trend 2005-2017 Stable Declining slightly
Figure 4.10.2 Invertebrate and vegetation trends for Mare Pond North (R-14)
Site summary: This is the fifth year that R-14 has been monitored since 2005. The invertebrate and
vegetation health both rated moderate in 2017; however, the scores were inconsistent, differing by 13
percent. Besides an excellent score in 2011, the invertebrate scores have rated high-moderate. The
invertebrates health trend is stable. The vegetation score is at its lowest in 2017, causing the health trend
to decline slightly. More years of data will help determine more reliable health trends.
4.10.3 CR-38 Mitigation Site 1 (R-21) CR-38 Mitigation Site 1 (R-21) is a 1.7-acre, type 3 wetland
in the Kegan Lake watershed. The watershed is 1,530 acres
and 30 percent impervious. The wetland has one inlet on
the east side which receives stormwater overflow from a
storm pond. There are no outlets. R-21 is included in the
City’s stormwater management plan. It is designated as
Manage II, and is managed to maintain the wetland quality
and monitor wetland mitigation.
R-21 is a depressional shallow marsh wetland. The
southern portion of this wetland complex was constructed
0
20
40
60
80
100
2005 2007 2009 2011 2013 2015 2017
IBI
Sco
re (
%)
WMP #379 (R-14) 2005-2017
Invertebrates Vegetation
Invertebrates x-check Vegetation x-check
Invertebrates Trend Vegetation Trend
Exc
Mod
Poor

Dakota Co. WHEP January 2018
2017 Report Fortin Consulting, Inc. P a g e | 7 9
as mitigation for impacts to other wetlands as a result of street reconstruction, and is an extension of an
existing wetland dominated by reed canary grass. The nutrient loading from adjacent agriculture and reed
canary grass impede upon this wetland.
Wetland Health
Site Observations: The slope of the wetland is steep from the road and becomes flat entering the wetland.
The wetland substrate is mucky with a thick layer of submergent vegetation. The wetland is choked with
cattails. Only a small area of open water exists. The cattail population seems thicker than previous years.
The wetland is in between a housing development and farmland with woods nearby. Muskrat trails and
deer observed.
Table 4.10.3 CR-38 Mitigation Site 1 (R-21) Wetland Health based on Index of Biotic Integrity
2017 Data (R-21)
Invertebrates
Vegetation
Wetland Health Rating (IBI score) Excellent (28) Moderate (23)
Cross-check Rating (IBI score) Poor (14) Moderate (17)
Trend 2009-2017 Improving Improving
Figure 4.10.3 Invertebrate and vegetation trends for CR-38 Mitigation Site 1 (R-21)
Site summary: This is the eighth year that R-21 has been monitored by the WHEP volunteers since 2009.
The invertebrate health rated excellent in 2017, and achieved the highest score for the wetland. The wetland
has rated excellent several different years, sometimes dropping to high-moderate. The invertebrate health
trend shows improvement. The vegetation health rating has fluctuated between low-to-high-moderate. The
0
20
40
60
80
100
2009 2011 2013 2015 2017
CR-38 Mitigation Site 1 (R-21) 2009-2017
Invertebrate Vegetation
Invertebrate x-check Vegetation x-check
Invertebrates Trend Vegetation Trend
Mod
Poor

Dakota Co. WHEP January 2018
2017 Report Fortin Consulting, Inc. P a g e | 8 0
vegetation health also shows improving trends. The invertebrate
and vegetation scores were not consistent, in 2017. This wetland
was also cross-checked by another WHEP team in 2017. The scores
between the two teams were not consistent. The invertebrates scores
differed by 46 percent. The vegetation scores differed by 17 percent.
The City team collected and identified a more diverse collection of
macroinvertebrates including multiple species of leeches,
dragonflies, damselflies, mayflies, caddisflies, snails, trueflies, and
crustaceans. The City team identified slender Riccia and purple-
fringed Riccia which enhanced the nonvascular metric and the
aquatic guild metric. Both teams found an abundance of
bladderwort in their vegetation plots.
4.10.4 CR-38 Mitigation Site 2 (R-23)
CR-38 Mitigation Site 2 (R-23) is 0.3-acre, type 3 wetland
in the White Lake Watershed. The White Lake watershed
is 998 acres of which 30 percent is impervious surface.
There are no inlets or outlets. This wetland is not part of
the City’s stormwater management plan. It was created in
2008 after the plan was developed. The wetland
management goal is to maintain the wetland without any
loss of function and value, and to monitor the success of
this wetland’s creation.
R-23 is a small depressional shallow marsh wetland. The
wetland was constructed to mitigate impacts to other
wetlands as a result of street reconstruction. It was constructed near an existing wetland that is dominated
by reed canary grass.
Wetland Health
Site Observations: The wetland is shallow and small with a gentle slope and firm substrate. It is adjacent
to Mare Pond North. Reed canary dominates the shoreline.
Table 4.10.4 CR Mitigation Site 2 (R-23) Wetland Health based on Index of Biotic Integrity
2017 Data (R-23)
Invertebrates
Vegetation
Wetland Health Rating (IBI score) Excellent (30) Excellent (27)
Trend 2010-2017 Variable Improving
Rosemount team at WHEP Invertebrate Training
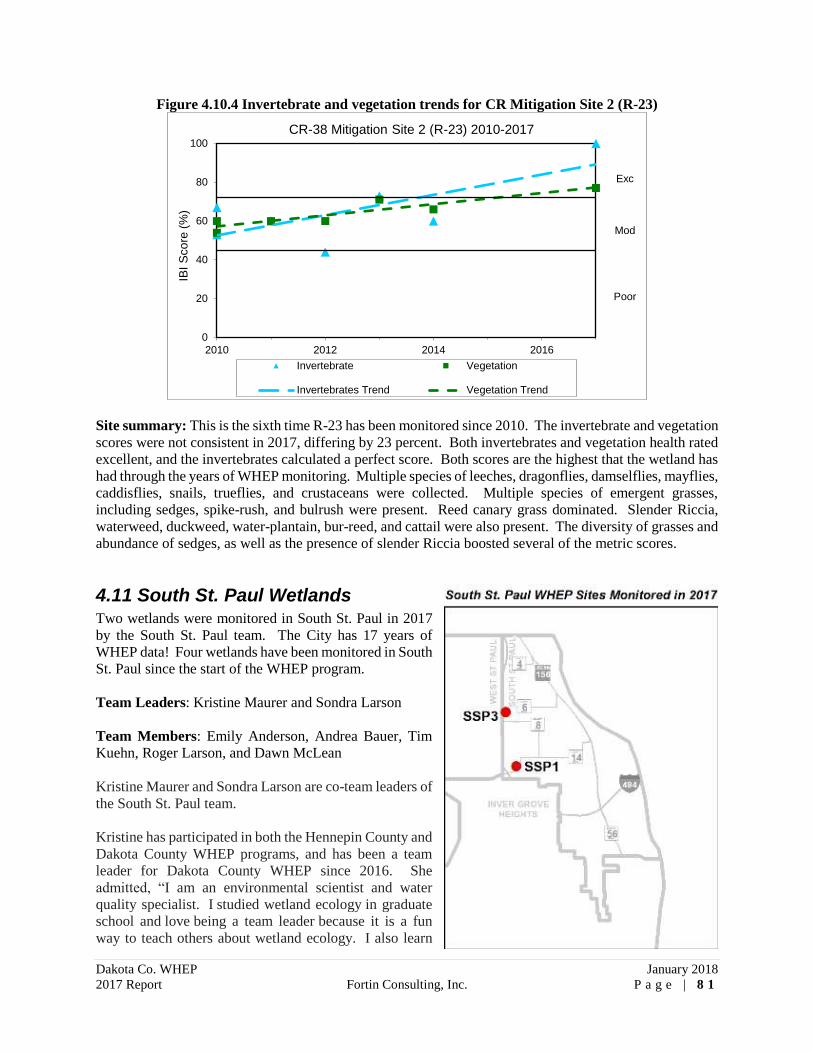
Dakota Co. WHEP January 2018
2017 Report Fortin Consulting, Inc. P a g e | 8 1
Figure 4.10.4 Invertebrate and vegetation trends for CR Mitigation Site 2 (R-23)
Site summary: This is the sixth time R-23 has been monitored since 2010. The invertebrate and vegetation
scores were not consistent in 2017, differing by 23 percent. Both invertebrates and vegetation health rated
excellent, and the invertebrates calculated a perfect score. Both scores are the highest that the wetland has
had through the years of WHEP monitoring. Multiple species of leeches, dragonflies, damselflies, mayflies,
caddisflies, snails, trueflies, and crustaceans were collected. Multiple species of emergent grasses,
including sedges, spike-rush, and bulrush were present. Reed canary grass dominated. Slender Riccia,
waterweed, duckweed, water-plantain, bur-reed, and cattail were also present. The diversity of grasses and
abundance of sedges, as well as the presence of slender Riccia boosted several of the metric scores.
4.11 South St. Paul Wetlands
Two wetlands were monitored in South St. Paul in 2017
by the South St. Paul team. The City has 17 years of
WHEP data! Four wetlands have been monitored in South
St. Paul since the start of the WHEP program.
Team Leaders: Kristine Maurer and Sondra Larson
Team Members: Emily Anderson, Andrea Bauer, Tim
Kuehn, Roger Larson, and Dawn McLean
Kristine Maurer and Sondra Larson are co-team leaders of
the South St. Paul team.
Kristine has participated in both the Hennepin County and
Dakota County WHEP programs, and has been a team
leader for Dakota County WHEP since 2016. She
admitted, “I am an environmental scientist and water
quality specialist. I studied wetland ecology in graduate
school and love being a team leader because it is a fun
way to teach others about wetland ecology. I also learn
0
20
40
60
80
100
2010 2012 2014 2016
IBI
Sco
re (
%)
CR-38 Mitigation Site 2 (R-23) 2010-2017
Invertebrate Vegetation
Invertebrates Trend Vegetation Trend
Exc
Mod
Poor

Dakota Co. WHEP January 2018
2017 Report Fortin Consulting, Inc. P a g e | 8 2
new things every year, whether it is from the class instructors or fellow
volunteers. One of my favorite 2017 WHEP memories from this summer was
working with Sondra and the volunteers to identify bugs in the lab. I love
looking at the intricate casings of the different tricoptera!”
Sondra explained, “It was my first year being
involved with WHEP. I studied environmental
science in school and have always loved spending
time outdoors whether it is just relaxing and enjoying
+-my surroundings or hiking around with my field
guide trying to ID everything! I learned a lot from my
first year as a co-team lead in WHEP. My favorite
parts of the summer were taking our wetland
vegetation inventory. It was an amazing opportunity putting on waders, getting
in the water and being able to spend time observing each wetland closely to really
recognize their differences and similarities. I am excited for the new learning
opportunities that the next field season will bring!”
Chris Hartzell is the City of South St. Paul’s City Engineer. He commented,
“The City of South St. Paul places a high value on the function and importance
of wetlands within the community. We have relatively few wetlands compared
to some communities, but the ones we do have help reduce the impacts from
pollutants in our lakes and waterbodies. I look forward to staying involved in
the WHEP program”.
South St. Paul General Wetland Health Figure 4.11 presents an overall view of wetland health for all of the 2017 monitoring sites in South St. Paul
based on the IBI scores for invertebrates and vegetation presented as a percent. Figure 4.11 also illustrates
the consistency between the IBI scores (in percent form) for each wetland sampled. Invertebrate and
vegetation scores that differ by ten percent or less are considered consistent. Based on the IBI scores, a
wetland health rating is assigned as excellent, moderate or poor. In 2017, the invertebrates and vegetation
health both rated poor at wetland site SSP-1. Wetland site SSP-3 rated moderate health for invertebrates
and poor health for vegetation. The invertebrates and vegetation scores of each wetland were consistent.
Chris Hartzell
South St. Paul WHEP members
Sondra Larson
Kristine Maurer
Sondra Larson and Tim Kuehn Roger Larson

Dakota Co. WHEP January 2018
2017 Report Fortin Consulting, Inc. P a g e | 8 3
Figure 4.11 South St. Paul site scores (percent) for the 2017 sampling season
4.11.1 Anderson Pond (SSP-1)
Anderson Pond (SSP-1) is a 2.4-acre, type 4 wetland within the
Lower Mississippi River watershed. The drainage area is 168 acres,
and is approximately 15 percent impervious. It is publicly owned. It
has three inlets: one inlet on the north side of the wetland, one inlet
on the west side, and one inlet on the south side. There is also an
outlet on the south side of the wetland. It is part of the City's
Stormwater Management Plan. The City does not have a wetland
management plan.
Virtually all of the area that contributes to this wetland is fully
developed. In 2008, the City performed an extensive dredging of
Anderson Pond. The cattails are already returning on the east and
west sides of the pond. A separate maintenance cell was created near
the northwest inlet in order to facilitate future dredging and other
maintenance activities. Additional dredging was done in late 2011 and 2012. In 2009, Southview Pond
was constructed as a pre-treatment measure for the runoff from Highway 52 and West St. Paul, prior to
conveyance into Anderson Pond. Highway 52 is a major contributor to Anderson Pond as is the City of
West St. Paul (over 90% of the pond's watershed is in West St. Paul). The pond is in an older established
residential area surrounded by roads, apartment blocks, and houses.
0
20
40
60
80
100
SSP-1 SSP-3
We
tla
nd
He
alt
h R
ati
ng
IB
I S
co
re (
%)
Wetland Site
South St. Paul Wetland Health 2017
Invertebrates Vegetation
Mod
Poor

Dakota Co. WHEP January 2018
2017 Report Fortin Consulting, Inc. P a g e | 8 4
Wetland Health Site Observations: The wetland slope is gradual to the edge of the water, but then the water gets deep
quickly. The deep water requires a 5x20 meter vegetation plot. The substrate is firm, with a layer of muck.
Sunken tree branches and cattail roots make walking difficult. A thick band of cattails surrounds about 75
percent of the wetland shoreline. The area without the cattails has large overhanging trees. Fish were
caught in the bottle traps.
Table 4.11.1 Anderson Pond (SSP-1) Wetland Health based on Index of Biotic Integrity
2017 Data (SSP-1)
Invertebrates
Vegetation
Wetland Health Rating (IBI score) Poor (12) Poor (15)
Cross-check Rating (IBI score) Poor (14) Moderate (17)
Trend 2001-2017 Stable Stable
Figure 4.11.1 Invertebrate and vegetation trends for Anderson Pond (SSP-1)
Site Summary: This is the ninth time that SSP-1 has been monitored since 2001. The invertebrate and
vegetation scores are consistent, in 2017. Initial low scores in 2001 make the vegetation health trend appear
to be increasing; however, since 2009, the vegetation scores seem to be remaining stable. Invertebrates
scores have ranged from poor to moderate health. Invertebrate scores have been lower in recent years of
surveys compared to moderate ratings in previous years. Despite these score differences, the invertebrate
health trend remains stable. This wetland is described as a poor site, and the scores are reflecting its physical
image. Highway 52 contributes stormwater input to the wetland. This wetland was cross-checked by
another WHEP team in 2017. The scores between teams were consistent. The invertebrate and vegetation
species identified by each team were similar in representation.
0
20
40
60
80
100
2001 2003 2005 2007 2009 2011 2013 2015 2017
Anderson Pond (SSP-1) 2001-2017
Invertebrates VegetationInvertebrates x-check Vegetation x-checkInvertebrates Trend Vegetation Trend
IBI
Sco
re (
%)
Exc
Mod
Poor

Dakota Co. WHEP January 2018
2017 Report Fortin Consulting, Inc. P a g e | 8 5
4.11.2 LeVander Pond (SSP-3)
LeVander Pond, also known as SSP-3, is a 3.4-acre, type 4 wetland within
the Lower Mississippi River Watershed. Its watershed is 37.9 acres
which is approximately 20 percent impervious. It is part of a City of
South St. Paul easement. There is one inlet on the west side, one on the
north side, and one on the east side. There is one outlet on the north side
of the wetland. It is part of the City's stormwater management plan.
Virtually all of the area that contributes to this wetland is fully developed.
In 2008, LeVander Estates, a new development was completed on the east
side of LeVander Pond. A trail was constructed down to the pond.
Mn/DOT recently completed an upgrade of Wentworth/Thompson
interchanges and in doing so enhanced some of the drainage in LeVander
Pond by installing a pretreatment basin south of the pond. TH52 is a
major contributor to LeVander Pond as is the City of West St. Paul.
Wetland Health
Site Observations: The wetland slope is gentle. The substrate is very mucky. Cattails, tall grass, and
algae cover the entire wetland. A lot of litter present. Ducks and geese observed.
Table 4.11.2 LeVander Pond (SSP-3) Wetland Health based on Index of Biotic Integrity
2017 Data (SSP-3)
Invertebrates
Vegetation
Wetland Health Rating (IBI score) Moderate (16) Poor (15)
Trend 2009-2017 Variable Declining
Figure 4.11.2 Invertebrate and vegetation trends for LeVander Pond (SSP-3)
0
20
40
60
80
100
2009 2011 2013 2015 2017
LeVander Pond (SSP-3) 2009-2017
Invertebrates VegetationInvertebrates x-check Vegetation x-checkInvertebrates Trend Vegetation Trend
IBI
Sco
re (
%)
Exc
Mod
Poor

Dakota Co. WHEP January 2018
2017 Report Fortin Consulting, Inc. P a g e | 8 6
Site summary: This is the ninth consecutive year of monitoring LeVander Pond. The vegetation and
invertebrates scores were consistent with each other in 2017. The invertebrate scores have fluctuated
between poor and excellent over the years. In 2017, invertebrate health rated moderate. The vegetation
health score remains poor, as it has been since the second year of monitoring. Three families of leeches,
one family of dragonfly, one family of damselfly, one family of caddisfly, two families of snails, and one
family of crustaceans were collected in 2017. The vegetation presence in 2017 was very similar to 2016.
The only emergent vegetation included reed canary grass and cattail, which dominate the shoreline.
Duckweed and water-meal covered the water surface, and little to no submergent vegetation was present.
Only a few small sprigs of coontail were identified. Otherwise, the vegetation diversity is sparse.
4.12 West St. Paul Wetlands Four wetlands were monitored in West St. Paul in 2017
by the West St. Paul team. The City of West St. Paul
has 18 years of WHEP data! Twelve wetlands have
been monitored in West St. Paul since the City became
involved with WHEP in 1999. This is the fourth year
that the City of West St. Paul has had its own designated
WHEP team again since 1999-2003.
Team Leaders: Maggie Karschnia and Tim Martin
Team Members: Rachel Crownhart, Jan Henley,
Delaney Karschnia, Alana Karschnia, Mike Lynn,
Christian O'Hare, and Kelsey White
Maggie became a WHEP
volunteer in 2007 for
Hennepin County, and
was eventually enlisted
as a team leader for West
St. Paul ahead of the
2013 season. This was
her fourth year as team
leader. She expressed, “We had another great monitoring season this year
with one of the best volunteer teams I've ever worked with. I couldn't imagine
a more fun, capable, and supportive team. This year, we also had the
opportunity once again to represent WHEP at a booth at the Take a Kid
Fishing event held at Thompson Park in West St Paul. It was a great
opportunity to highlight what we're doing to the residents in the local
community.”
This was Tim Martin’s fourth year as team leader of West St. Paul. He
admitted, “I developed a passion for field biology during my undergraduate
studies in environmental science and WHEP has given me an outlet to expand
my knowledge of wetland ecosystems. Partly inspired by my work with
WHEP, I entered a Master's degree in Water Resource Science at the
University of Minnesota in 2015. In addition to the educational benefits, this
program also gives me a chance to spend time outdoors, which I greatly
Maggie Karschnia
Tim Martin

Dakota Co. WHEP January 2018
2017 Report Fortin Consulting, Inc. P a g e | 8 7
appreciate after a long day of working at a desk. It also helps to have a great
team helping us. Such a dedicated group makes all of the work much easier”
Ross Beckwith is the City of West St. Paul’s City Engineer/Public Works and
Parks Director. He commented, “This is my second year in the WHEP program
at West St. Paul, and I certainly value the importance of a functioning
wetland. The data collected through this program is so valuable as it allows us
to track the condition of these precious resources over time. Thank you to all
the volunteers who make this program happen and allow it to remain
affordable.”
Dave Schletty is the Assistant Parks & Recreation Director at the City of West
St Paul. He has been assisting with coordination of the program for five
years. Dave helps select which wetlands to monitor each year and reviews the
data. He also supervises the City’s Environmental Committee, shares WHEP
data with the group, and together they educate the community about improving
water quality. He said, “With so few wetlands within the mostly developed five
square mile City, I understand the importance of keeping them healthy.”
West St. Paul General Wetland Health
Figure 4.12 presents an overall view of wetland health for all of the 2017 monitoring sites in West St. Paul
based on the IBI scores for invertebrates and vegetation presented as a percent. Figure 4.12 also illustrates
the consistency between the IBI scores (in percent form) for each wetland sampled. Invertebrate and
vegetation scores that differ by ten percent or less are considered consistent. Based on the IBI scores, a
wetland health rating is assigned as excellent, moderate or poor. The West St. Paul wetland ratings ranged
from poor to moderate wetland health in 2017. The invertebrate and vegetation scores for WSP-4, WSP-5,
and WSP-8 were each consistent. Although both the invertebrates and vegetation health scores rated
moderate, they were inconsistent with each other, differing by 18 percent.
Figure 4.12 West St. Paul site scores (percent) for the 2017 sampling season
Dave Schletty
0
20
40
60
80
100
WSP-3 WSP-4 WSP-6 WSP-8
We
tla
nd
Hea
lth
Ra
tin
g IB
I S
co
re (
%)
Wetland Site
West St. Paul Wetland Health 2017
Invertebrates Vegetation
Ross Beckwith
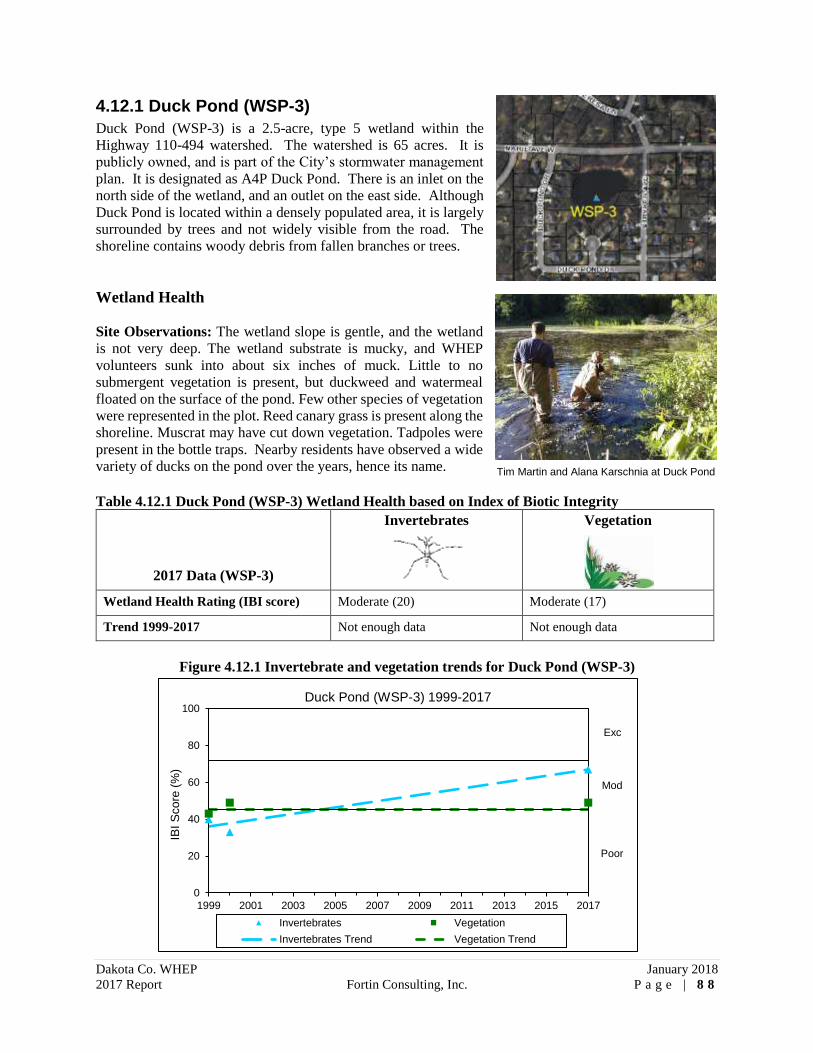
Dakota Co. WHEP January 2018
2017 Report Fortin Consulting, Inc. P a g e | 8 8
4.12.1 Duck Pond (WSP-3)
Duck Pond (WSP-3) is a 2.5-acre, type 5 wetland within the
Highway 110-494 watershed. The watershed is 65 acres. It is
publicly owned, and is part of the City’s stormwater management
plan. It is designated as A4P Duck Pond. There is an inlet on the
north side of the wetland, and an outlet on the east side. Although
Duck Pond is located within a densely populated area, it is largely
surrounded by trees and not widely visible from the road. The
shoreline contains woody debris from fallen branches or trees.
Wetland Health Site Observations: The wetland slope is gentle, and the wetland
is not very deep. The wetland substrate is mucky, and WHEP
volunteers sunk into about six inches of muck. Little to no
submergent vegetation is present, but duckweed and watermeal
floated on the surface of the pond. Few other species of vegetation
were represented in the plot. Reed canary grass is present along the
shoreline. Muscrat may have cut down vegetation. Tadpoles were
present in the bottle traps. Nearby residents have observed a wide
variety of ducks on the pond over the years, hence its name.
Table 4.12.1 Duck Pond (WSP-3) Wetland Health based on Index of Biotic Integrity
2017 Data (WSP-3)
Invertebrates
Vegetation
Wetland Health Rating (IBI score) Moderate (20) Moderate (17)
Trend 1999-2017 Not enough data Not enough data
Figure 4.12.1 Invertebrate and vegetation trends for Duck Pond (WSP-3)
0
20
40
60
80
100
1999 2001 2003 2005 2007 2009 2011 2013 2015 2017
Duck Pond (WSP-3) 1999-2017
Invertebrates Vegetation
Invertebrates Trend Vegetation Trend
IBI
Sco
re (
%)
Exc
Mod
Poor
Tim Martin and Alana Karschnia at Duck Pond

Dakota Co. WHEP January 2018
2017 Report Fortin Consulting, Inc. P a g e | 8 9
Site Summary: This is the third year that Duck Pond has been
surveyed by WHEP volunteers, since 1999. Prior to 2017, it had
not been surveyed since 2000. The invertebrate and vegetation
scores both rated moderate health; however, their scores are not
consistent with each other, differing by 18 percent. In 2017, the
invertebrate was higher than previous surveys, but the vegetation
score is similar to previous surveys. More years of data will help
determine a more reliable health trend. Despite the lack of
vegetation in the pond, invertebrates were present, including five
families of leeches, one family of dragonfly, one family of
damselfly, two families of snail, three families of trueflies, and one
family of crustacean. There was little to no submergent vegetation
at the time of the vegetation survey. The wetland vegetation
present included only small populations of muskgrass, bulrush,
water-nymph, duckweed, and water-meal.
4.12.2 Weschcke Pond (WSP-4)
Weschcke Pond (WSP-4) is a 1.3-acre, type 3 wetland within the
Ivy Falls Creek Watershed. The watershed is 42.4 acres. It is
publicly owned, and part of the City’s stormwater management
plan. It is designated as IF1BP Weschcke Pond. It has no inlets,
but one outlet on the north side.
Wetland Health Site Observations: The wetland is located within Weschcke
Park. It has a gentle slope and a very mucky substrate. The
surface of the water is completely covered in duckweed and
water-meal, and there is little to no submergent vegetation. Trash
was littered along the shoreline and there was woody debris on
the bottom of the wetland.
Table 4.12.2 Weschcke Pond (WSP-4) Wetland Health based on Index of Biotic Integrity
2017 Data (WSP-4)
Invertebrates
Vegetation
Wetland Health Rating (IBI score) Poor (12) Moderate (17)
Trend 2000-2017 Not enough data Not enough data
Jan Henley, Tim Martin, Kelsey White, Christian O’Hare and Mike Lynn at Weschcke Pond
Christian O’Hare, Jan Henley, Kelsey White, Mike Lynn, Tim Martin, and Alana Karschnia (in front)

Dakota Co. WHEP January 2018
2017 Report Fortin Consulting, Inc. P a g e | 9 0
Figure 4.12.2 Invertebrate and vegetation trends for Weschcke Pond (WSP-4)
Site Summary: This is the third time that WSP-4 has been surveyed for
WHEP since 2000. Prior to 2017, it had not been surveyed since 2001.
The invertebrates rated poor while the vegetation rated moderate;
however, the scores were consistent with each other. The vegetation
score is lower in 2017 than previous years of surveys, while the
invertebrate score is the same. The vegetation diversity was great enough
to boost the vegetation health rating, but the density of each species
represented was very low. Small populations of sedge, spike-rush, reed
canary grass, coontail, pondweed, and purple loosestrife were
represented. The dominating vegetation were the floating leaved forbs,
which included duckweed and water-meal. The lack of vegetation may
be impacting the invertebrate population. Three families of leeches, one family of snail, two families of
trueflies, and one family of crustacean were collected. More years of monitoring will help determine a
more reliable health trend.
4.12.3 Marthaler Park (WSP-6)
Marthaler Park (WSP-6) is a 4.5-acre, type 5 wetland within the Simon
Ravine District drainage area. Its watershed is 23 acres. It is publicly
owned, and it is part of the City’s stormwater management plan. It is
designated as SR4P Marthaler Pond. There is one inlet on the east side, but
no outlets.
The wetland is located within Marthaler Park. Most of the surrounding area
is undisturbed with trees and other vegetation. Humboldt Avenue runs along
the eastern side of the wetland. Residential neighborhoods exist to the south
and east of the wetland. The West St. Paul Sports Center is northeast of the
wetland.
0
20
40
60
80
100
2000 2005 2010 2015
Weshke Pond (WSP-4) 2000-2017
Invertebrates Vegetation
Invertebrates Trend Vegetation Trend
IBI
Sco
re (
%)
Exc
Mod
Poor
West St. Paul team in the wetland
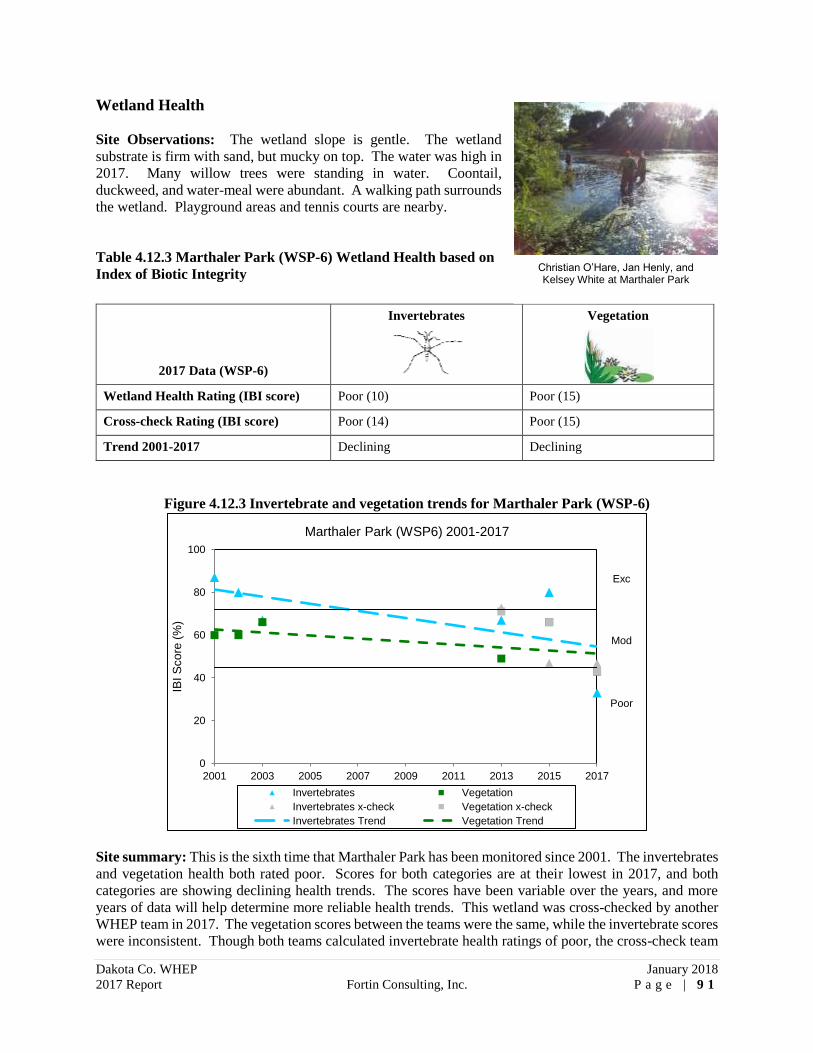
Dakota Co. WHEP January 2018
2017 Report Fortin Consulting, Inc. P a g e | 9 1
Wetland Health
Site Observations: The wetland slope is gentle. The wetland
substrate is firm with sand, but mucky on top. The water was high in
2017. Many willow trees were standing in water. Coontail,
duckweed, and water-meal were abundant. A walking path surrounds
the wetland. Playground areas and tennis courts are nearby.
Table 4.12.3 Marthaler Park (WSP-6) Wetland Health based on
Index of Biotic Integrity
2017 Data (WSP-6)
Invertebrates
Vegetation
Wetland Health Rating (IBI score) Poor (10) Poor (15)
Cross-check Rating (IBI score) Poor (14) Poor (15)
Trend 2001-2017 Declining Declining
Figure 4.12.3 Invertebrate and vegetation trends for Marthaler Park (WSP-6)
Site summary: This is the sixth time that Marthaler Park has been monitored since 2001. The invertebrates
and vegetation health both rated poor. Scores for both categories are at their lowest in 2017, and both
categories are showing declining health trends. The scores have been variable over the years, and more
years of data will help determine more reliable health trends. This wetland was cross-checked by another
WHEP team in 2017. The vegetation scores between the teams were the same, while the invertebrate scores
were inconsistent. Though both teams calculated invertebrate health ratings of poor, the cross-check team
0
20
40
60
80
100
2001 2003 2005 2007 2009 2011 2013 2015 2017
IBI
Sco
re (
%)
Marthaler Park (WSP6) 2001-2017
Invertebrates Vegetation
Invertebrates x-check Vegetation x-check
Invertebrates Trend Vegetation Trend
Exc
Mod
Poor
Christian O’Hare, Jan Henly, and Kelsey White at Marthaler Park

Dakota Co. WHEP January 2018
2017 Report Fortin Consulting, Inc. P a g e | 9 2
collected a larger diversity of invertebrates which boosted their invertebrate score. Fish were present in the
wetland, possibly impacting the City team’s bottle traps. Only two families of trueflies, one family of
crustacean, and two families of snails (including the invasive mystery snail) were collected with dipnets.
The cross-check team collected one family of dragonfly, one family of mayfly, three families of snails
(none invasive), two families of trueflies, and two families of crustacean. The vegetation diversity and
abundance represented in each of the team plots were very similar, and this reflected in the identical
vegetation score. Vegetation included several woody species and reed canary grass. The dominant
vegetation included coontail, waterweed, pondweed, duckweed, and water-meal. Fortin Consulting also
complete a vegetation survey at Marthaler Park wetland. The observed vegetation species were similar,
and the vegetation health score were identical between all parties.
4.12.4 Dodge Nature Center Prairie Pond (WSP-8)
Dodge Nature Center Prairie Pond (WSP-8) is a 2.9-acre, type 3
wetland within the Valley Creek (Marie) drainage area. Its watershed
is 113 acres and is publicly owned by the City. There are no inlets or
outlets. The wetland is part of the City’s stormwater management
plan. It is designated as MR8P Dodge Center Pond.
It is located within the Olivia Dodge Nature Center. The surrounding
area is undisturbed with trees and other vegetation.
Wetland Health
Site Observations: The wetland slope is gentle, and the wetland
substrate is mucky. Submergent vegetation, including coontail and
pondweed, are dominant. Duckweed and water-meal cover the water
surface. Reed canary grass surrounds the wetland. Tadpoles and fish
were collected in the bottle traps. A bunch of small frogs were found
at the site which delighted the younger volunteers!
Table 4.12.4 DNC Prairie Pond (WSP-8) Wetland Health based on Index of Biotic Integrity
2017 Data (WSP-8)
Invertebrates
Vegetation
Wetland Health Rating (IBI score) Moderate (16) Moderate (17)
Trend 2003-2017 Not enough data Not enough data
Dodge Nature Center Prairie Pond

Dakota Co. WHEP January 2018
2017 Report Fortin Consulting, Inc. P a g e | 9 3
Figure 4.12.4 Invertebrate and vegetation trends for DNC Prairie Pond (WSP-8)
Site summary: This is the second year WSP-8 has been monitored since 2003. The invertebrate and
vegetation scores are consistent with each other in 2017, as well as in 2003. Both categories scored higher
in 2017 than in 2003; however, the scores for each category have remained consistent. More years of data
will help determine more reliable health trends. One family of leech, one family of mayfly, one family of
caddisfly, three families of snails, and one family of crustacean were collected with dipnets. Fish and
tadpoles were present in the bottle traps which probably impacted the invertebrate collection.
0
20
40
60
80
100
2003 2005 2007 2009 2011 2013 2015 2017
DNC Prairie Pond (WSP-8) 2003-2017
Invertebrates Vegetation
Invertebrates Trend Vegetation Trend
IBI
Sco
re (
%)
Exc
Mod
Poor

Dakota Co. WHEP January 2018
2017 Report Fortin Consulting, Inc. P a g e | 9 4
Appendix A-1. Invertebrate Metric Scores
Site Number Leech Metric
Corixid Metric
Odonata Metric
ETSD Metric
Snail Metric
Total Taxa
Metric Total IBI
Score
AV-10 1 3 1 1 1 1 8
AV-12 1 3 1 3 3 3 14
AV-20 5 5 1 1 1 3 16
B-1 1 3 1 3 5 5 18
B-3 1 5 1 5 5 5 22
B-8 3 5 1 3 5 5 22
B-13 1 3 1 3 5 5 18
DC-1 1 5 3 3 3 3 18
DC-2 1 5 3 1 1 3 14
DC-3 3 1 1 1 1 1 8
DC-4 3 5 1 3 1 5 18
E-18 3 5 1 1 1 3 14
E-41 5 5 1 5 1 5 22
E-42 1 5 1 1 1 3 12
F-3 1 5 1 3 1 3 14
F-7 3 3 1 1 1 1 10
F-8 1 3 1 3 1 3 12
H-4 1 1 1 3 1 3 10
H-6 1 3 5 3 5 5 22
H-56 3 5 5 5 5 5 28
H-57 5 3 1 1 1 3 14
L-7 1 5 1 3 3 5 18
L-8 1 5 3 3 1 3 16
MH-2 1 3 3 5 1 5 18
MH-4 3 3 1 1 3 5 16
NCR-1 3 5 1 3 3 5 20
NCR-2 3 5 1 3 3 5 20
R-4 3 1 5 3 1 5 18
R-14 5 5 1 3 3 5 22
R-21 3 5 5 5 5 5 28
R-23 5 5 5 5 5 5 30
SSP-1 3 3 1 1 1 3 12
SSP-3 3 5 1 3 1 3 16
WSP-3 5 3 1 3 3 5 20
WSP-4 3 3 1 1 1 3 12
WSP-6 1 5 1 1 1 1 10
WSP-8 1 5 1 3 3 3 16
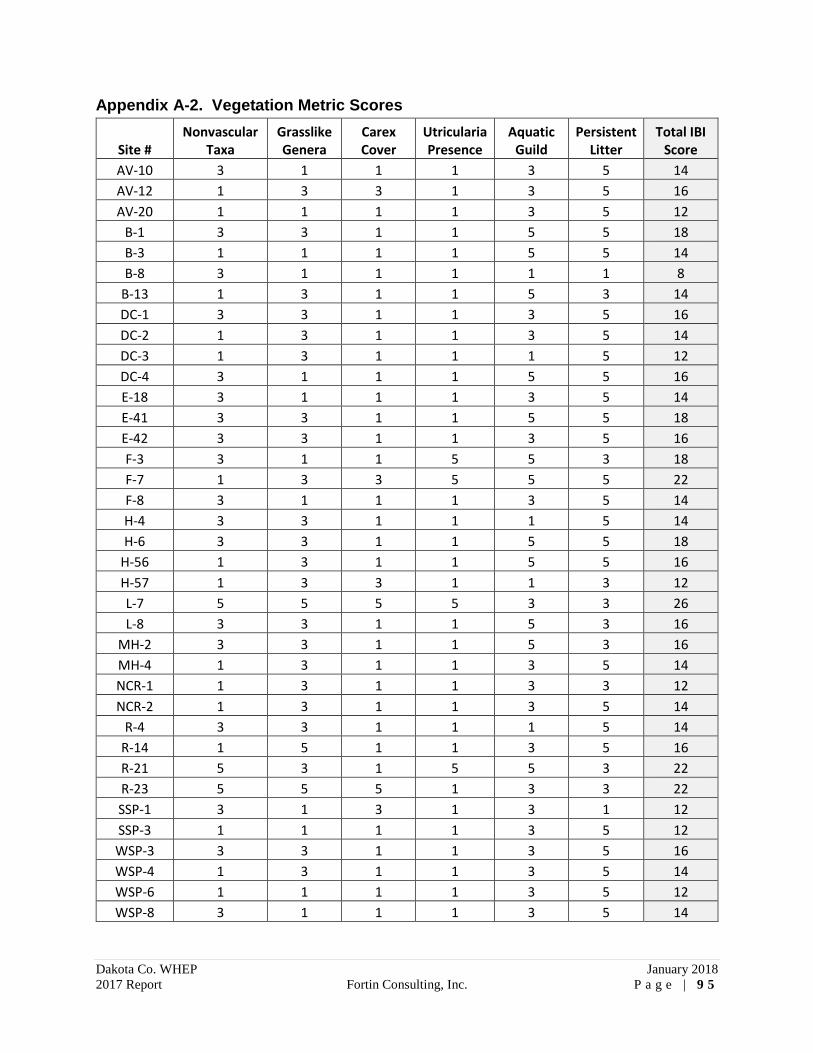
Dakota Co. WHEP January 2018
2017 Report Fortin Consulting, Inc. P a g e | 9 5
Appendix A-2. Vegetation Metric Scores
Site # Nonvascular
Taxa Grasslike Genera
Carex Cover
Utricularia Presence
Aquatic Guild
Persistent Litter
Total IBI Score
AV-10 3 1 1 1 3 5 14
AV-12 1 3 3 1 3 5 16
AV-20 1 1 1 1 3 5 12
B-1 3 3 1 1 5 5 18
B-3 1 1 1 1 5 5 14
B-8 3 1 1 1 1 1 8
B-13 1 3 1 1 5 3 14
DC-1 3 3 1 1 3 5 16
DC-2 1 3 1 1 3 5 14
DC-3 1 3 1 1 1 5 12
DC-4 3 1 1 1 5 5 16
E-18 3 1 1 1 3 5 14
E-41 3 3 1 1 5 5 18
E-42 3 3 1 1 3 5 16
F-3 3 1 1 5 5 3 18
F-7 1 3 3 5 5 5 22
F-8 3 1 1 1 3 5 14
H-4 3 3 1 1 1 5 14
H-6 3 3 1 1 5 5 18
H-56 1 3 1 1 5 5 16
H-57 1 3 3 1 1 3 12
L-7 5 5 5 5 3 3 26
L-8 3 3 1 1 5 3 16
MH-2 3 3 1 1 5 3 16
MH-4 1 3 1 1 3 5 14
NCR-1 1 3 1 1 3 3 12
NCR-2 1 3 1 1 3 5 14
R-4 3 3 1 1 1 5 14
R-14 1 5 1 1 3 5 16
R-21 5 3 1 5 5 3 22
R-23 5 5 5 1 3 3 22
SSP-1 3 1 3 1 3 1 12
SSP-3 1 1 1 1 3 5 12
WSP-3 3 3 1 1 3 5 16
WSP-4 1 3 1 1 3 5 14
WSP-6 1 1 1 1 3 5 12
WSP-8 3 1 1 1 3 5 14

Dakota Co. WHEP January 2018
2017 Report Fortin Consulting, Inc. P a g e | 9 6
Appendix B. Invasive Species Presence 2012-2017
Site Purple loose-strife
Reed canary grass
Curly-leaf pond-weed
Eurasian Water-milfoil
Honey-suckle
Buckthorn Chinese mystery
snail
Banded mystery
snail
AV-1 1 1
AV-6 1
AV-10 1 1 1
AV-11 1 1
AV-12 1 1 1
AV-13 1 1
AV-18 1 1
AV-19 1
AV-20 1 1
B-1 1 1 1
B-2 1 1
B-3 1 1
B-4 1
B-6 1 1
B-7 1
B-8 1 1
B-9 1 1
B-10 1
B-12 1
B-13 1 1 1 1 1
B-17 1 1
DC-1 1 1
DC-2 1
DC-3 1
DC-4 1
E-7 1 1
E-10 1
E-11 1 1
E-18 1 1
E-20 1
E-32 1 1
E-33 1 1
E-34 1 1 1
E-35 1
E-36 1
E-37 1
E-38 1
E-40 1 1

Dakota Co. WHEP January 2018
2017 Report Fortin Consulting, Inc. P a g e | 9 7
Site Purple loose-strife
Reed canary grass
Curly-leaf pond-weed
Eurasian Water-milfoil
Honey-suckle
Buckthorn Chinese mystery
snail
Banded mystery
snail
E-41 1 1
E-42 1
F-3 1 1 1 1
F-6 1 1
F-7 1 1
H-4 1 1 1
H-6 1 1 1
H-56 1 1 1
H-57 1 1 1
L-7 1 1 1
L-8 1 1
L-9 1 1
L-10 1 1
LD-1 1 1 1
MH-2 1 1 1
MH-4 1
MH-16 1 1
MH-17 1
NCR-1 1
NCR-2 1
R-1 1 1
R-2 1
R-4 1 1
R-6 1
R-14 1
R-20 1
R-21 1 1 1
R-23 1 1 1
R-26 1 1
SSP-1 1 1 1 1
SSP-3 1 1 1
SSP-4 1
WSP-1 1 1 1
WSP-2 1 1
WSP-3 1
WSP-4 1 1
WSP-5 1
WSP-6 1 1 1 1 1
WSP-7 1

Dakota Co. WHEP January 2018
2017 Report Fortin Consulting, Inc. P a g e | 9 8
Site Purple loose-strife
Reed canary grass
Curly-leaf pond-weed
Eurasian Water-milfoil
Honey-suckle
Buckthorn Chinese mystery
snail
Banded mystery
snail
WSP-8 1
WSP-9 1
WSP-10 1 1
WSP-12 1
WSP-18 1
Totals: 23 79 2 2 1 8 43 2

Dakota Co. WHEP January 2018
2017 Report Fortin Consulting, Inc. P a g e | 9 9
Appendix C. Site Score Averages of Created, Stormwater, and Natural Wetland
Invertebrates Vegetation
Wetland Created
Wetlands Stormwater
wetlands Natural
Wetlands Created
Wetlands Stormwater
wetlands Natural
Wetlands
AV-1 18 21 AV-5 15 18 AV-6 15 18 AV-7 8 13 AV-8 15 21 AV-10 11 12 AV-11 17 13 AV-12 14 18 AV-13 21 12 AV-14 12 9 AV-15 11 13 AV-16 17 AV-17 18 19 AV-18 21 17 AV-19 20 16 AV-20 18 14 B-1 20 26 B-1 Alt. 15 23 B-2 16 16 B-3 20 19 B-4 18 15 B-6 19 18 B-7 17 18 B-8 22 14 B-9 13 12 B-10 20 14 B-11 18 21 B-12 14 15 B-13 18 19 B-17 20 23 DC-1 21 24 DC-2 14 17 DC-3 13 16 DC-4 16 20 E-1 20 19 E-7 22 20 E-10 11 17 E-11 17 19 E-18 15 20 E-20 19 23 E-21 20 17 E-22 16 16 E-25 16 19

Dakota Co. WHEP January 2018
2017 Report Fortin Consulting, Inc. P a g e | 1 0 0
Invertebrates Vegetation
Wetland Created
Wetlands Stormwater
wetlands Natural
Wetlands Created
Wetlands Stormwater
wetlands Natural
Wetlands
E-26 14 15 E-27 18 21 E-28 16 21 E-29 12 27 E-31 20 13 E-32 16 17 E-33 16 21 E-34 24 23 E-35 12 27 E-36 16 17 E-37 18 17 E-38 24 19 E-39 16 11 E-40 18 15 E-41 22 23 E-42 12 19 F-1 14 16 F-3 12 16 F-4 11 15 F-5 17 16 F-6 16 10 F-7 15 18 F-8 17 16 H-4 15 18 H-6 20 21 H-30 14 14 H-56 20 17 H-57 14 18 L-4 16 20 L-7 20 25 L-8 22 20 L-9 17 17 L-10 13 11 LD-1 14 17 MH-2 22 23 MH-4 19 17 MH-8 10 9 MH-9 22 24 MH-13 16 21 MH-14 22 25 MH-15 16 21 MH-16 24 29 MH-17 12 15 MH-18 22 27

Dakota Co. WHEP January 2018
2017 Report Fortin Consulting, Inc. P a g e | 1 0 1
Invertebrates Vegetation
Wetland Created
Wetlands Stormwater
wetlands Natural
Wetlands Created
Wetlands Stormwater
wetlands Natural
Wetlands
NCR-1 20 15 NCR-2 20 17 R-1 19 19 R-2 21 17 R-4 17 14 R-6 18 18 R-14 22 24 R-18 26 19 R-20 17 16 R-21 24 22 R-22 22 22 R-23 20 23 R-25 12 23 R-26 13 11 SSP-1 14 14 SSP-3 18 14 SSP-4 18 11 WSP-1 18 18 WSP-2 17 16 WSP-3 17 18 WSP-4 15 20 WSP-5 20 17 WSP-6 21 20 WSP-7 19 18 WSP-8 20 16 WSP-9 12 11 WSP-10 22 17 WSP-12 10 15
AVERAGES 16 17 17 18 18 18

Dakota Co. WHEP January 2018
2017 Report Fortin Consulting, Inc. P a g e | 1 0 2
Appendix D. Wetland and Watershed Data for 2008-2017
Site ID Site Name
Wetland size
(Acres)
Watershed Size
(Acres) %
Imperv Invert. Score
Veg. Score
AV-1 Hidden Valley 2 21 35 18 15
AV-5 Cedar Knolls Pond 0.5 8 20 14 19
AV-6 Belmont Park 1.3 202 20 8 13
AV-7 Podojil Pond 1.3 8 25 10 13
AV-8 Chaparal Pond 1.5 110 30 16 15
AV-10 Alimagnet Park 0.5 25 20 8 17
AV-11 Farquar Lift Station 2.2 373 25 10 17
AV-12 EVR-P12 Public Water 5.7 571 25 14 21
AV-13 EVR-P14 3.6 26 35 18 9
AV-14 EVR-P43, Apple Valley East Park 0.8 2738 35 12 9
AV-15 Carrollwood 1.2 398 30 10 13
AV-16 Nordic Park 1 17 25 NA 17
AV-17 AL-P9.1 Alimagnet Lift Station Chain of Ponds 0.25 7 20 18 19
AV-18 Sunset Park Pond 1 252 30 18 17
AV-19 AL-P9.3 Alimagnet Lift Station Chain of Ponds 0.25 28.5 25 18 17
AV-20 Valleywood Golf Course 1.5 12 0 16 15
B-1 Crystal Lake West 0.9 444.5 5 18 21
B-1 Alt Crystal Lake West Alternate 6 550 0 15 23
B-2 Cam Ram 0.41 0 12 11
B-3 Kraemer 30 93 30 22 17
B-4 Alimagnet 0.9 701 20 16 15
B-6 Alimagnet East/Dog Park 2.5 34 15 16 17
B-7 Terrace Oaks North 2.2 15.7 5 20 19
B-8 Red Oak 3 115 25 22 11
B-9 Crosstown West 7.2 388 50 14 15
B-10 AP-3 Cedar Pond 3.1 212 22 10 15
B-11 Valley View 1 80 10 16 13
B-12 Terrace Oaks 1.7 68 5 14 15
B-13 Sunset Lake 30 436 50 18 17
B-17 Terrace Oaks Buckthorn Pond 2.7 24 5 28 21
DC-1 Empire Lake 21 1152 NA 18 21
DC-2 Buck Pond 1.6 25 NA 14 17
DC-3 Tamarck Swamp 7.7 40 0 8 15
DC-4 Jenson Lake 50 330 7 18 19
E-1 Thomas Lake Park Pond 0.4 4 37 18 21
E-7 Discovery Pond 4.1 16.5 0 20 21
E-10 AP-3 Cedar Pond 3.1 212 25 14 17
E-11 Central Park Pond 1.8 130 20 14 21
E-18 Moonshine Park Pond 2.5 34 25 14 17
E-20 Shanahan Lake 10.9 56.4 1 10 17

Dakota Co. WHEP January 2018
2017 Report Fortin Consulting, Inc. P a g e | 1 0 3
Site ID Site Name
Wetland size
(Acres)
Watershed Size
(Acres) %
Imperv Invert. Score
Veg. Score
E-21 FP-11.5 0.26 1.6 0 20 19
E-22 FP-11.6 0.58 2.7 0 20 17
E-25 FP 4.5 1 35 55 16 19
E-26 DP-6.2, Northwoods Business Park 3.2 25 44 14 15
E-27 LP-26.54, Thomas Woods Site 0.2 5.3 29 18 21
E-28 HDP-1, Kennerick Addition Site 0.8 39 18 16 21
E-29 LP-15, Lily Pond in Lebanon Hills Pk 6.5 21.8 5.5 12 27
E-31 Walnut Hill Pond 0.65 20 2.5 20 13
E-32 City Hall Pond 6.6 81.3 14 14 15
E-33 Coventry Pond 5.5 60 35 16 21
E-34 McCarthy Lake 11.3 220 15 24 23
E-35 Prairie Pond 0.8 5.1 0 NA 27
E-36 Mooney Pond 7 41 25 16 17
E-37 Kettle Pond 0.8 23 30 18 17
E-38 Gerhardt Lake 13.5 32 5 24 19
E-39 Black Hawk Middle School 0.3 24 31 16 11
E-40 Heine Pond 7.4 17 15 18 15
E-41 O'Leary Lake 16 84 40 22 23
E-42 LP-44 2.4 49 30 12 19
F-1 Pine Knoll 35 107.5 10.4 NA 13
F-3 Kral Pond 10 41.8 6.6 14 21
F-4 Lake Julia 10 233 21.2 8 11
F-5 Autumn Glen 2.9 10 NA 20 21
F-6 Vermillion River 6.3 16 30 12 9
F-7 Autumn Glen 2.9 10 4 10 25
F-8 Mystic Meadows 6.19 8.23 NA 12 15
H-4 Stonegate Treated 1 9.5 35 10 17
H-6 Lake Rebecca 19 56 1 22 21
H-30 Sand Coulee 1 107 25 8 13
H-56 180th Street Marsh 20 340 1 28 19
H-57 Cari Park Pond 0.78 29 14 14 15
L-4 Water Treatment Wetland Bank 22.85 99.8 20 14 15
L-7 DNR 387 10 2087 21 18 31
L-8 DNR 393 9.6 4987 17 16 19
L-9 NC 54 13.8 183 12 20 11
L-10 DNR#349W 40 213 NA 12 11
LD-1 Pickerel Lake 14 17
MH-2 Copperfield/Friendly Hills 9.4 865.3 20 18 21
MH-4 Industrial Park 16 17
MH-8 Victoria Pond 0.4 209.2 40 10 9
MH-9 Hagstrom-King 3 20 25 22 27
MH-13 MH Par 3 0.5 36 3 20 21
MH-14 Wagon Wheel 0.9 18.1 10 22 25

Dakota Co. WHEP January 2018
2017 Report Fortin Consulting, Inc. P a g e | 1 0 4
Site ID Site Name
Wetland size
(Acres)
Watershed Size
(Acres) %
Imperv Invert. Score
Veg. Score
MH-15 Upper Bridgeview 4.1 66.4 NA 16 21
MH-16 Field Stone 6.9 577.9 20 24 29
MH-17 Marie Pond 0.6 64.2 20 12 15
NCR-1 Wasner 0.5 160 2.5 20 15
NCR-2 Peterson 2 55 0 20 17
R-1 Kelly Marsh - Derryglen Ct in 2004 1 12.5 80 16 19
R-2 White Lake 333 998 10 18 23
R-4 Schwarz Pond 10.9 144.5 20 18 17
R-6 Keegan Lake/WMP 310 35 1530 30 22 19
R-14 WMP #379 4.8 81 30 22 21
R-18 WMP #279 4.5 33.7 30 26 19
R-20 Unnamed/WMP 332 1 897 30 14 19
R-21 CR-38 Mitigation Site 1 1.7 1530 30 28 23
R-22 Mare Pond, South 8 81 10 24 19
R-23 CR-38 Mitigation Site 2 0.3 81 30 30 27
R-25 WMP #306 1.7 81 30 12 23
R-26 Erickson Pond 1.9 1832 25 16 13
SSP-1 Anderson Pond 2.4 168 15 12 15
SSP-3 LeVander 3.4 37.9 20 16 15
SSP-4 Villaume Pond 1.66 25 30 18 11
WSP-1 Mud Lake 3.1 34.2 NA 20 13
WSP-2 Thompson Lake 48W 9 73920 50 16 17
WSP-3 Duck Pond 2.5 65 NA 20 17
WSP-4 Wehke Pond 1.3 42.4 0 12 17
WSP-5 Lilly Lake 6.4 22 NA 20 19
WSP-6 Marthaler Park 4.5 23 NA 10 15
WSP-7 Humboldt Pond/Vivian Pond 1.2 23 NA 18 19
WSP-8 DNC Prairie Pond 2.9 113 0 16 17
WSP-9 Marie Avenue 4 15 NA 12 11
WSP-10 Emerson Pond South 2.3 23 NA 22 15
WSP-12 Wentworth Pond 6 71.2 NA 8 15
*Scores reflect most recent data
Top Related