


Languages
Pages
Legal


©2004 Burrill & Company. Confidential & Proprietary.
1
Biotech 2006Life Sciences: A Changing
Prescription
BIO 2006
April 10th 2006
G. Steven Burrill, CEOBurrill & Company

©2004 Burrill & Company. Confidential & Proprietary.
2
Burrill & CompanyExclusive focus on life sciences—human healthcare (Rx and
Dx), nutraceuticals/wellness, agbio, industrial, enabling
technologies
Venture Capital Group Venture Capital—investing across the entire spectrum of the life
sciences/biotechnology . . . over $625 million for investment, raising $300-500 million for BLSCF III
Merchant Banking Practice Strategic Partnering including licensing, research and other collaborations Strategic Advisory Services including new company formation Merger & Acquisitions across life sciences Spin-outs ranging from products, to research divisions to disease area
franchises
Media Conferences Publications
Headcount: 50+ professionals and staff Location: San Francisco
©2004 Burrill & Company. Confidential & Proprietary.
3
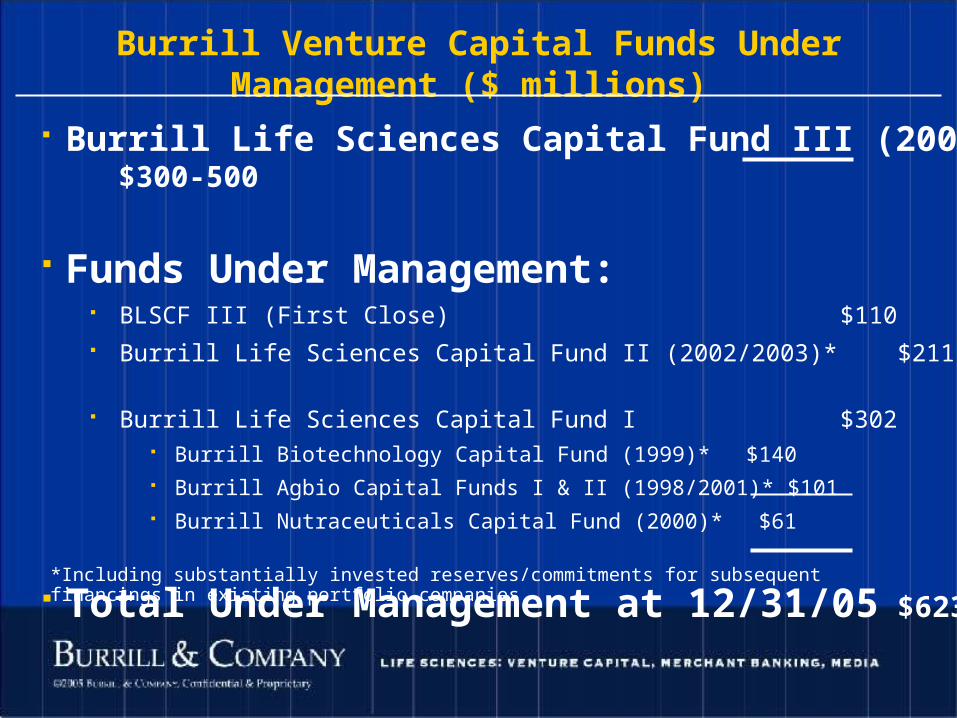
Burrill Venture Capital Funds Under Management ($ millions)
Burrill Life Sciences Capital Fund III (2005) $300-500
Funds Under Management: BLSCF III (First Close) $110 Burrill Life Sciences Capital Fund II (2002/2003)* $211 Burrill Life Sciences Capital Fund I $302
Burrill Biotechnology Capital Fund (1999)* $140 Burrill Agbio Capital Funds I & II (1998/2001)* $101 Burrill Nutraceuticals Capital Fund (2000)* $61
Total Under Management at 12/31/05 $623*Including substantially invested reserves/commitments for subsequent financings in existing portfolio companies

©2004 Burrill & Company. Confidential & Proprietary.
4
Merchant Banking Group Services
Strategic DevelopmentEarly Stage Research to Product Development &
Commercialization•P&G/Taigen•Wyeth•ViroPharma/Schering Plough
M&A TransactionsTransactions across Life
Sciences
•Purdue/Safeguard
•Operon/Quiagen
•ViroPharma/Schering Plough
Spin-Outs & Divestitures
Create a new Company or into an established Entity
•RJR/Targacept
•Baxter/VimRX
•Lilly/Ipsen
•Danisco/GenencorAdvisory Services
Strategic Transaction Advice
•Sugen/Pharmacia
•Acrux/Vivus
Financing
Advisory/Private Placement
•SangStat
•Immune Response
Potential Scope of
Merchant Banking Group
Client Relationship

©2004 Burrill & Company. Confidential & Proprietary.
5
Burrill Created/Hosted Industry Events
For inquires, contact Thea Schwartz at (415) 591-5477 or [email protected]
©2004 Burrill & Company. Confidential & Proprietary.
6
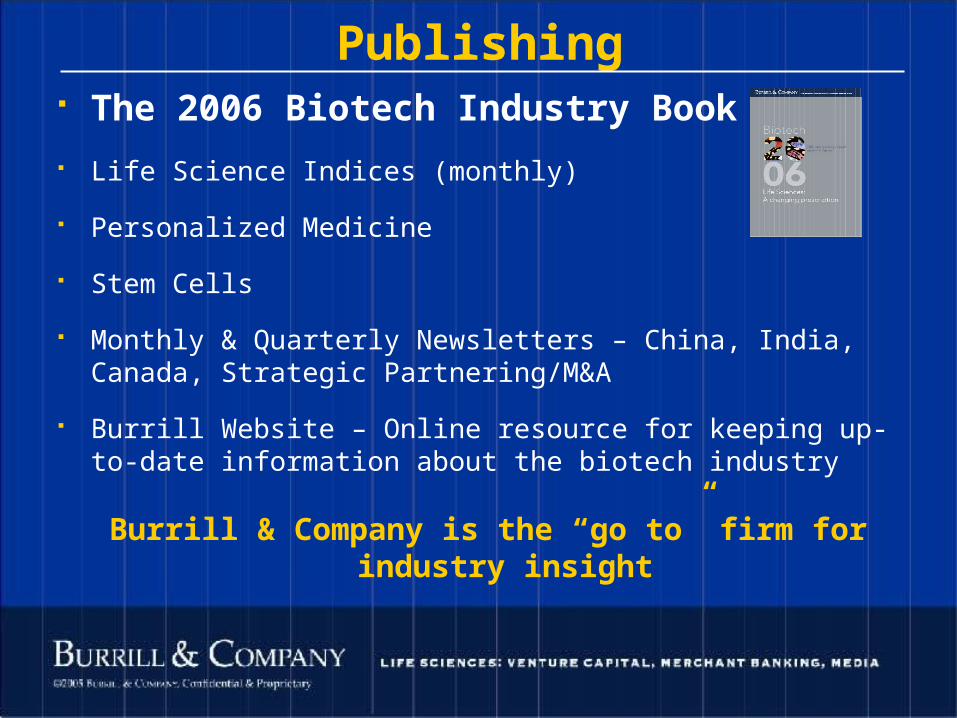
Publishing The 2006 Biotech Industry Book
Life Science Indices (monthly)
Personalized Medicine
Stem Cells
Monthly & Quarterly Newsletters – China, India, Canada, Strategic Partnering/M&A
Burrill Website – Online resource for keeping up-to-date information about the biotech industry
Burrill & Company is the “go to” firm for industry insight

©2004 Burrill & Company. Confidential & Proprietary.
7
Industry ReportsThe seminal industry report for the last 20 years
To order most recent book visit www.burrillandco.com

©2004 Burrill & Company. Confidential & Proprietary.
8
This presentation is available
for download from our website www.burrillandco.com

©2004 Burrill & Company. Confidential & Proprietary.
9
Visit us at BIO
Booth #2300
…and purchase our book!

©2004 Burrill & Company. Confidential & Proprietary.
10
So what’s happened in these 20 years?
(By the way…Biotech started over 10-15 years earlier…late ’60s/early ’70s…
so it’s a 35 year old industry now!)

©2004 Burrill & Company. Confidential & Proprietary.
11
1986/Then
• Title: At the Crossroads
• Industry size: 700 Companies– 150 public
• Market Cap: $15B
• Top 5 Companies– Genentech– Cetus– ALZA– ABI– Centecor
We’re Evolving…2006/Now
• Title: A Changing Prescription
• Industry size: 5000+ companies
– 500 public
• Market Cap: $500B (US only)
• Top 5 US Companies– Genentech– Amgen– Gilead– Genzyme– Biogen

©2004 Burrill & Company. Confidential & Proprietary.
12
Themes in ’86 book
…At The Crossroads
• Science being converted to business• Products coming to market place• Are product liability, regulatory reform,
patent court behavior insurmountable barriers?
• Partner or vertically integrate?• Acquisitions by pharma desirable?• How will the industry evolve?
©2004 Burrill & Company. Confidential & Proprietary.
13
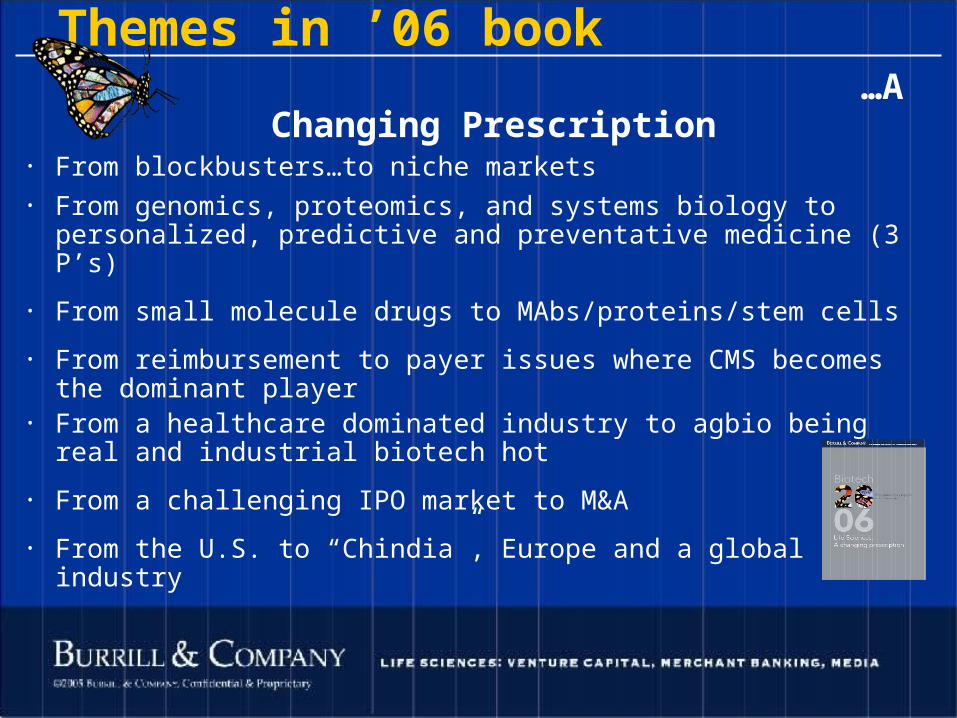
Themes in ’06 book …A Changing
Prescription• From blockbusters…to niche markets• From genomics, proteomics, and systems biology to
personalized, predictive and preventative medicine (3 P’s)
• From small molecule drugs to MAbs/proteins/stem cells
• From reimbursement to payer issues where CMS becomes the dominant player
• From a healthcare dominated industry to agbio being real and industrial biotech hot
• From a challenging IPO market to M&A
• From the U.S. to “Chindia”, Europe and a global industry

©2004 Burrill & Company. Confidential & Proprietary.
14
Conclusions
• 1986/Then
1986/Then
• A time for confidence, not questioning.
• Biotech companies will survive and prosper as a unique group, not just subsumed into the pharma industry.
• Some of the companies leading today (‘86) will remain industry leaders in the decades ahead.
• The industry will become major contributors to the well being and the economy.
2006/Now
• …A Changing Prescription (the future will be real different.)
• 5000+ companies…it’s a worldwide growing “industry”
• Amgen/Genentech will continue as leaders, yet new ones have emerged (Gilead, Serono, Biogen Idec).
• It has happened, even more than anticipated, and is becoming increasingly important.

©2004 Burrill & Company. Confidential & Proprietary.
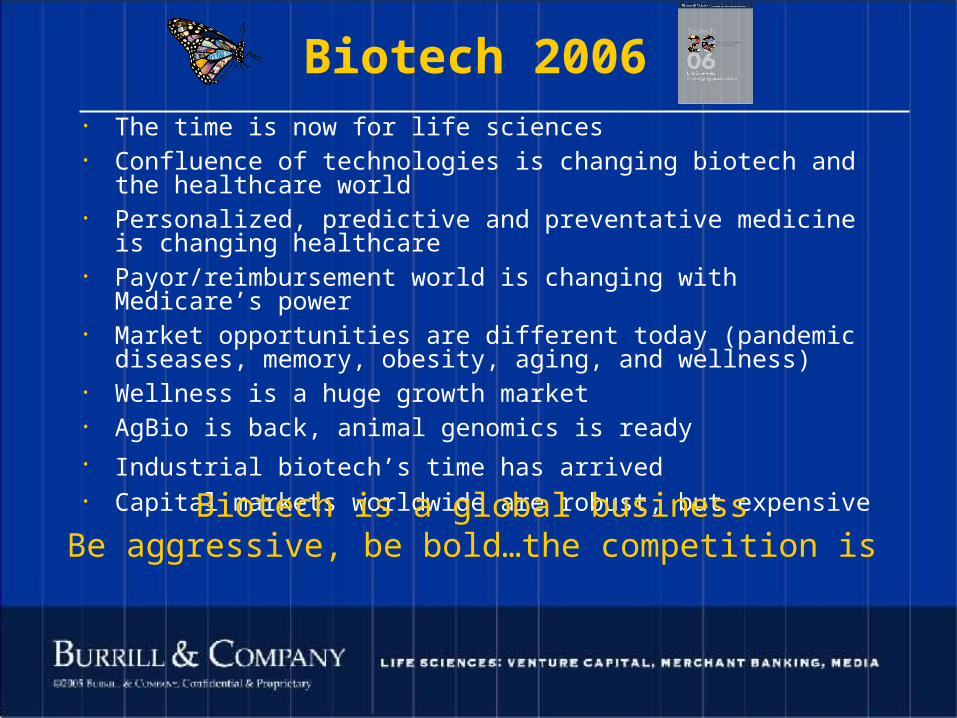
15
• The time is now for life sciences• Confluence of technologies is changing biotech and the healthcare
world• Personalized, predictive and preventative medicine is changing
healthcare• Payor/reimbursement world is changing with Medicare’s power
(single payors dominate)• Market opportunities are different today (pandemic diseases,
memory, obesity, aging, and wellness)• Wellness is a huge growth market• AgBio is back, animal genomics is ready• Industrial biotech’s time has arrived • Chindia is hot• Capital markets worldwide are robust, but expensive
So what are today’s take home messages?

©2004 Burrill & Company. Confidential & Proprietary.
16
Industry Overview• Industry is 30+ years old, generating over $85 billion in
revenues
• 5000 companies worldwide, 600 public companies
• Life sciences has a strong performance record, even in difficult economic and political times; outperformed Dow and NASDAQ
• Over 100 products on the market (many > $1 billion drugs); 350 biotech drugs are in late stage clinical trials (strong pipeline)
• Agbio products are now grown on 200 million acres world wide and growing at 20% per year; over 1 billion acres have been planted
• Patents protect product/technology exclusivity, rewarding innovation and limiting competition
• Broad applications in healthcare (cure & provention), food and agriculture, industrial (chemicals, fuels & materials)

©2004 Burrill & Company. Confidential & Proprietary.
17
Biotech’s Globalness Begins Day 1 Science/technology
Intellectual property/patents/FTO People Communications Competition Capital Markets—diseases know no
borders
Even the smallest biotech is a global player from Day One

©2004 Burrill & Company. Confidential & Proprietary.
18
Key Industry Stats
$15B
140
12,000
700+
.3B
$3B
Asia/Pacific
$14B
81
7,440
470
$0.6B
$2B
Canada
$26B $491B Market Capitalization
120 ≈ 363# of Public Cos.
68,000146,100# of Employees
1,600+1,500+# of Companies
$5B$19BAnnual R&D
$12B $72BSales / Revenue
EuropeUSA
Source: Burrill & Company, Ernst & Young
Biotech 2006

©2004 Burrill & Company. Confidential & Proprietary.
19
Pharma vs. Biotech Industry Market Cap ($B)
186
312
2.0x
491
241
46
65
69
172
12/31/05
1.5x
399
268
47
65
69
184
199
12/31/04
153216133165103Merck
1251451126558BMS
0.9x
342
383
77
154
280
12/31/03
0.6x
213
357
50
112
192
9/30/02 12/31/9912/31/0012/31/01Company
1.1x
277
75
129
124
0.8x1.0xIndustry
425366Total US Biotech
506384Pfizer/Merck
10588Eli Lilly
146181J&J
290251Pfizer
3/31/06
183
174
75
61
48
258
494
1.9x

©2004 Burrill & Company. Confidential & Proprietary.
20
-60%
-40%
-20%
0%
20%
40%
60%
80%
100%
120%
140%
AMGN
DNA
Select
PFE
MRK
Burrill Select, Amgen, Genentech vs. Pfizer, Merck 1/1/04–3/31/05 Performance
Last 12 Months

©2004 Burrill & Company. Confidential & Proprietary.
21
Biotech Industry Market Cap by Month
0
100
200
300
400
500
600
Dec-
99
Feb-
00
Apr-0
0
Jun-
00
Aug-
00
Oct
-00
Dec-
00
Feb-
01
Apr-0
1
Jun-
01
Aug-
01
Oct
-01
Dec-
01
Feb-
02
Apr-0
2
Jun-
02
Aug-
02
Oct
-02
Dec-
02
Feb-
03
Apr-0
3
Jun-
03
Aug-
03
Oct
-03
Dec-
03
Feb-
04
Apr-0
4
Jun-
04
Aug-
04
Oct
-04
Dec-
04
Feb-
05
Apr-0
5
Jun-
05
Aug-
05
Oct
-05
Dec-
05
Feb-
06
$ Bi
llion
sHistorical Biotech Market Cap 2000–2006
BIO ’05 to BIO ‘06
+ 23%
©2004 Burrill & Company. Confidential & Proprietary.
22
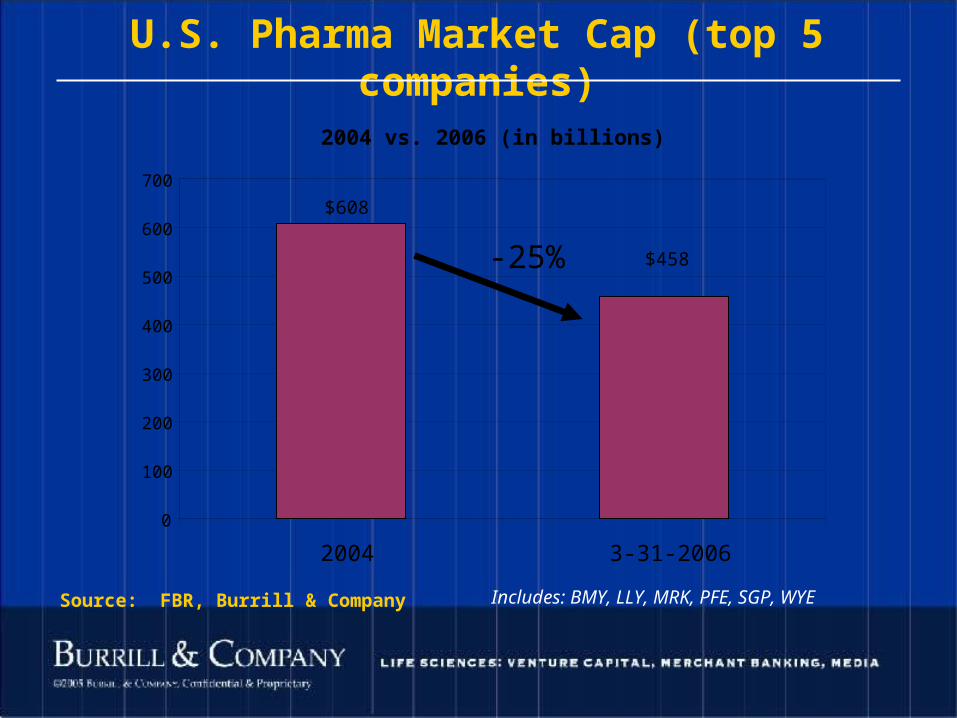
U.S. Pharma Market Cap (top 5 companies)
-25%
Source: FBR, Burrill & Company Includes: BMY, LLY, MRK, PFE, SGP, WYE
2004 vs. 2006 (in billions)
$608
$458
0
100
200
300
400
500
600
700
2004 3-31-2006

©2004 Burrill & Company. Confidential & Proprietary.
23
Top 5 US Pharma vs. Biotech Market Cap
$0
$100
$200
$300
$400
$500
$600
$700
$800
To
tal M
ark
et
Ca
p (
$ b
illi
on
)
Top US Pharma
Total Biotech Market Cap

©2004 Burrill & Company. Confidential & Proprietary.
24
Biotech R&D Spending has Outpaced Pharma
as a Function of Market Cap
Cowen Top 100 Biotech
Top 10 Pharma

©2004 Burrill & Company. Confidential & Proprietary.
25
…so that’s the baseline
Now, what’s really happening…

©2004 Burrill & Company. Confidential & Proprietary.
26
Today’s medicine challenge: One size doesn’t fit all

©2004 Burrill & Company. Confidential & Proprietary.
27
Pharmacogenomics shapes the healthcare business in 2000+

©2004 Burrill & Company. Confidential & Proprietary.
28
140 Years of Drug Discovery Technology
©2004 Burrill & Company. Confidential & Proprietary.
29
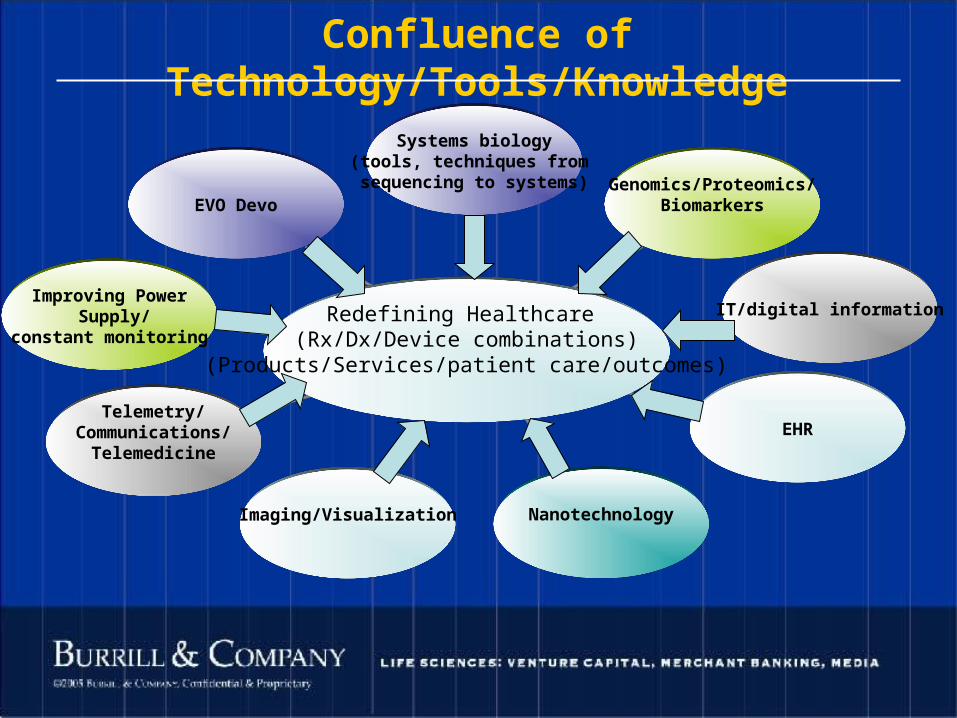
EVO Devo
Improving Power Supply/
constant monitoring
Telemetry/Communications/
Telemedicine
Imaging/Visualization Nanotechnology
EHR
IT/digital information
Genomics/Proteomics/Biomarkers
Systems biology(tools, techniques from sequencing to systems)
Redefining Healthcare (Rx/Dx/Device combinations)
(Products/Services/patient care/outcomes)
Confluence of Technology/Tools/Knowledge

©2004 Burrill & Company. Confidential & Proprietary.
30
Innovation Gap Getting Wider

©2004 Burrill & Company. Confidential & Proprietary.
31
Drug Development Costs Escalate
Source: Windhover’s In Vivo. The Business & Medicine Report. Bain drug economics model, 2003
Costs are becoming prohibitive

©2004 Burrill & Company. Confidential & Proprietary.
32
A systems biology approach- follow the pathways

©2004 Burrill & Company. Confidential & Proprietary.
33
The Molecular Basis of Biological Processes
The Molecular Heterogeneity
of Disease
Individual Genetic Variation
Alterations in Disease Disease Subtypes Pharmaco-genetics
New Targets for Dx, Rx, Vx
Right Rx forDisease
New Targets for Dx, Rx, Vx
DiseasePredisposition
PDxPRx
Analyzing The Molecular Profiles (Biosignatures) of Body Functions in
Health and Disease
©2004 Burrill & Company. Confidential & Proprietary.
34
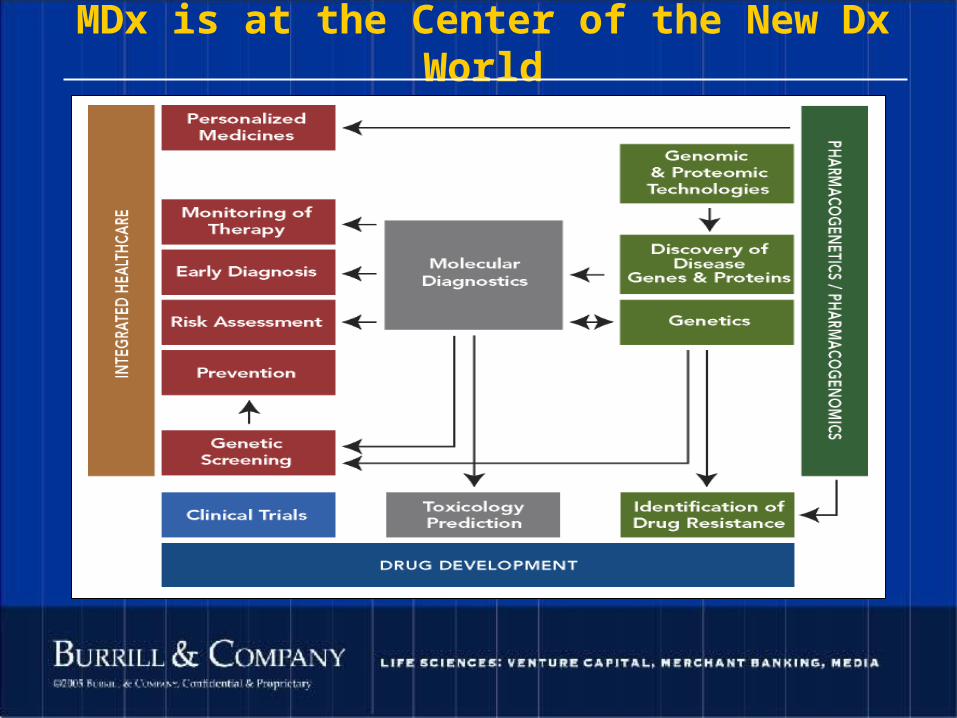
MDx is at the Center of the New Dx World

©2004 Burrill & Company. Confidential & Proprietary.
35
Selected Targeted Treatments Personalized cancer vaccines
Favrille – FavId for non-Hodgkin's lymphoma
Genitope – MyVax for non-Hodgkin's lymphoma
Gleevec (Novartis) - pH+ CML kinase inhibitor
Iressa (AstraZeneca) – EGFR tyrosine kinase inhibitor
Tarceva (Genentech/OSI) – HER1/EGFR inhibitor
Erbitux (ImClone/BMS) – HER1/EGFR inhibitor
Avastin (Genentech) – VEGF/VEGFR inhibitor
Herceptin (Genentech) – HER2 inhibitor
BilDil (NitroMed) - heart failure in African American patients
Other “Semi Targeted” Treatments (approved or late stage trials)
Nexavar (Bayer/Onyx) – multikinase inhibitor
Tykerb (GSK) - ErbB-2/EGFR inhibitor
Enzastaurin (Lilly) - PKC-Beta, AKT/P13 inhibitor
©2004 Burrill & Company. Confidential & Proprietary.
36
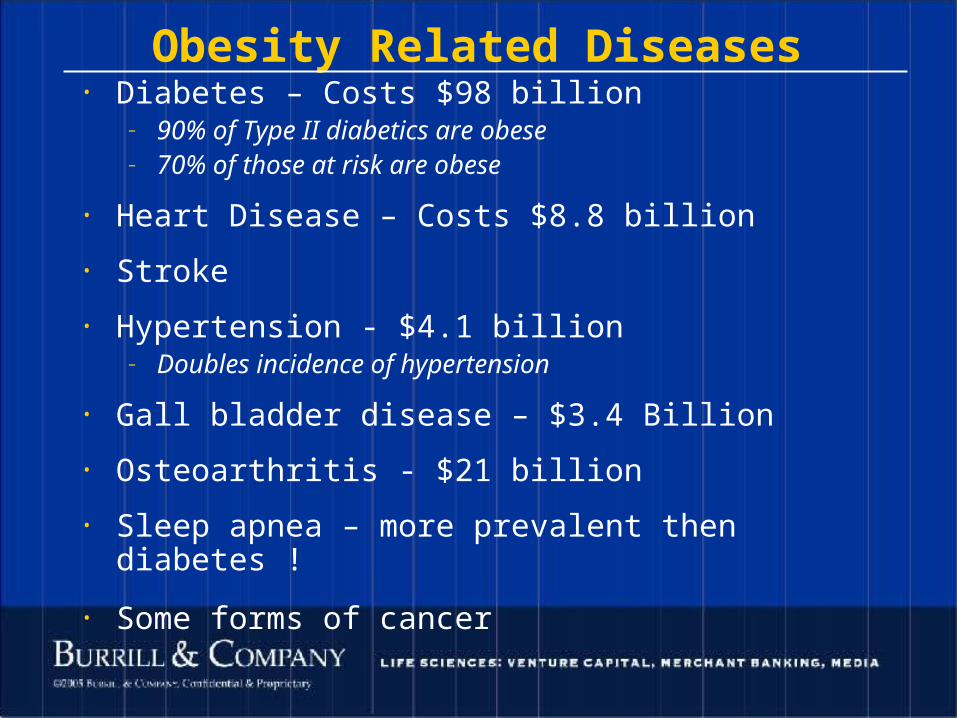
Obesity Related Diseases• Diabetes – Costs $98 billion
– 90% of Type II diabetics are obese– 70% of those at risk are obese
• Heart Disease – Costs $8.8 billion
• Stroke
• Hypertension - $4.1 billion– Doubles incidence of hypertension
• Gall bladder disease – $3.4 Billion
• Osteoarthritis - $21 billion
• Sleep apnea – more prevalent then diabetes !
• Some forms of cancer

©2004 Burrill & Company. Confidential & Proprietary.
37
Aging . . . Is it a disease?
About 1.4 million Americans are in their 90s, and another 64,000 are 100 years old or older
Baby boomers represent 30% of the total US population
Per person, seniors consume about five times the drugs of their working-age counterparts
By 2030, 20% of US population will be over 65 years of age
©2004 Burrill & Company. Confidential & Proprietary.
38
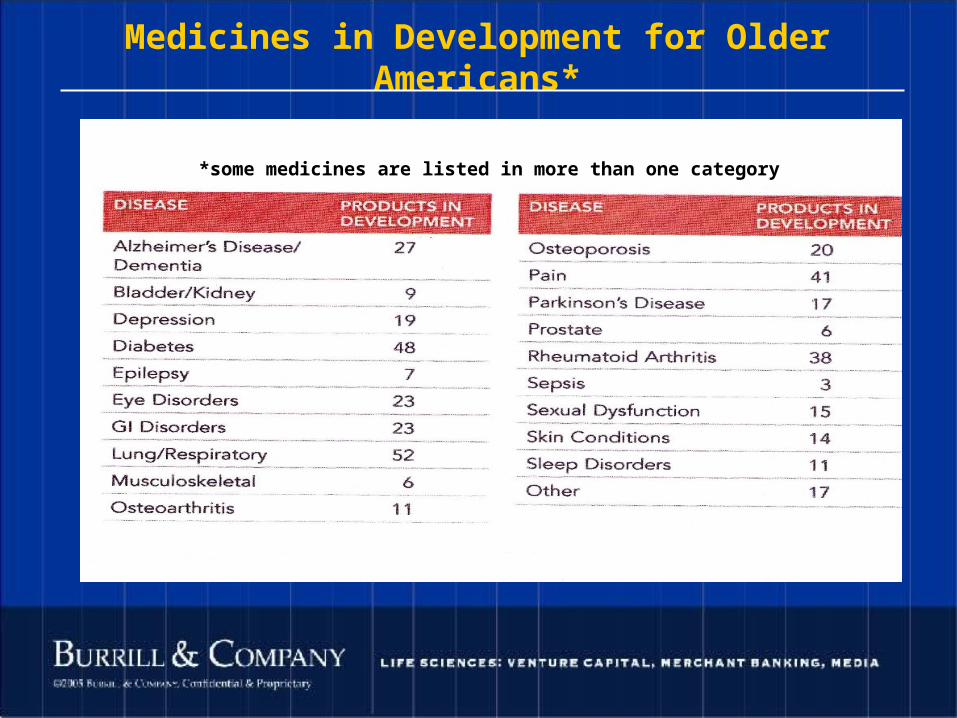
Medicines in Development for Older Americans*
*some medicines are listed in more than one category

©2004 Burrill & Company. Confidential & Proprietary.
39
Chronic Disease
125 million Americans have 1 or more chronic
conditions (e.g. congestive heart failure, diabetes)
Chronic diseases account for 75% of all health care
expenditures
Current costs for chronic diseases is approaching $1
trillion
These expenditures are not delivering what is
possible
©2004 Burrill & Company. Confidential & Proprietary.
40
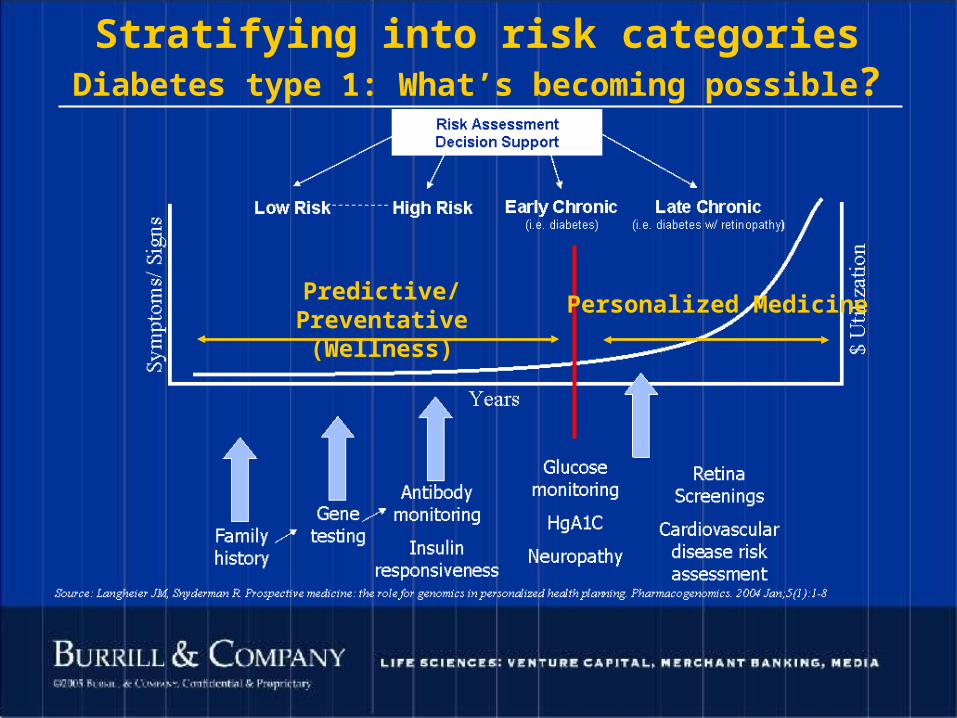
Stratifying into risk categoriesDiabetes type 1: What’s becoming possible?
Predictive/Preventative(Wellness)
Personalized Medicine

©2004 Burrill & Company. Confidential & Proprietary.
41
What is Driving Personalized Medicine?
Convergence in technology…scientific advances and new technology
Patient care and rising consumerism
Payors (of all types) have economic incentive
Government health policy an global spending (e.g.: CMS)

©2004 Burrill & Company. Confidential & Proprietary.
42
This Confluence of Healthcare Technology is bringing us…
• Targeted therapies (mutation specific), personalized medicine
• Drug/device combinations (drug eluding stents)
• Molecular diagnostics/Algorithm based diagnostics
• Non-invasiveness
• Non-hospital based with constant monitoring…• Increased predictions and prevention
©2004 Burrill & Company. Confidential & Proprietary.
43
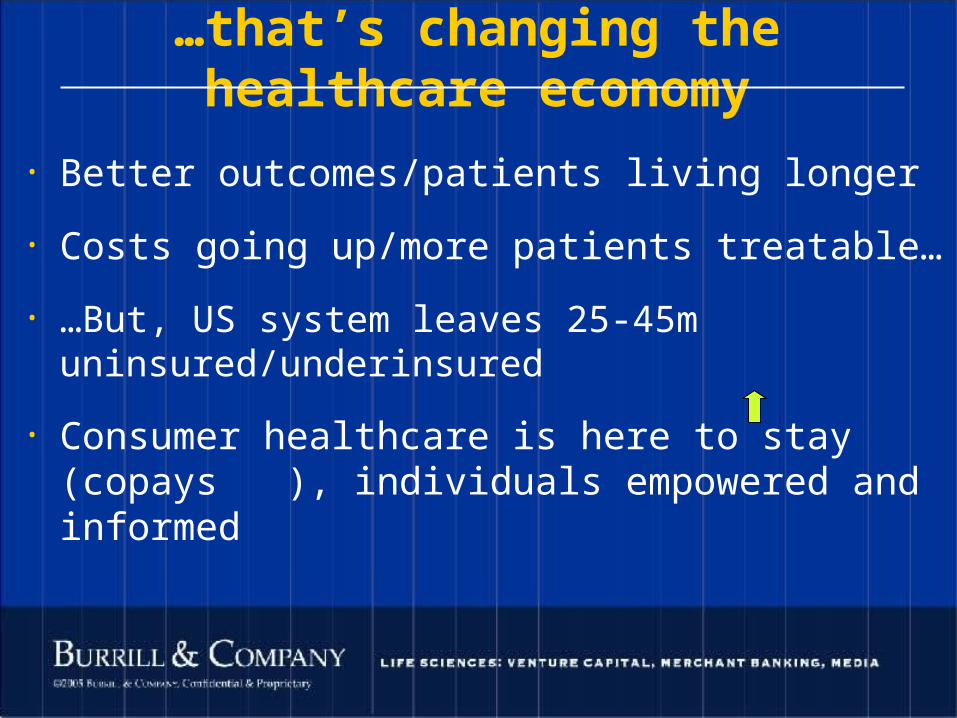
…that’s changing the healthcare economy
• Better outcomes/patients living longer
• Costs going up/more patients treatable…
• …But, US system leaves 25-45m uninsured/underinsured
• Consumer healthcare is here to stay (copays ), individuals empowered and informed

©2004 Burrill & Company. Confidential & Proprietary.
44
Healthcare costs have been raising for a long time
©2004 Burrill & Company. Confidential & Proprietary.
45
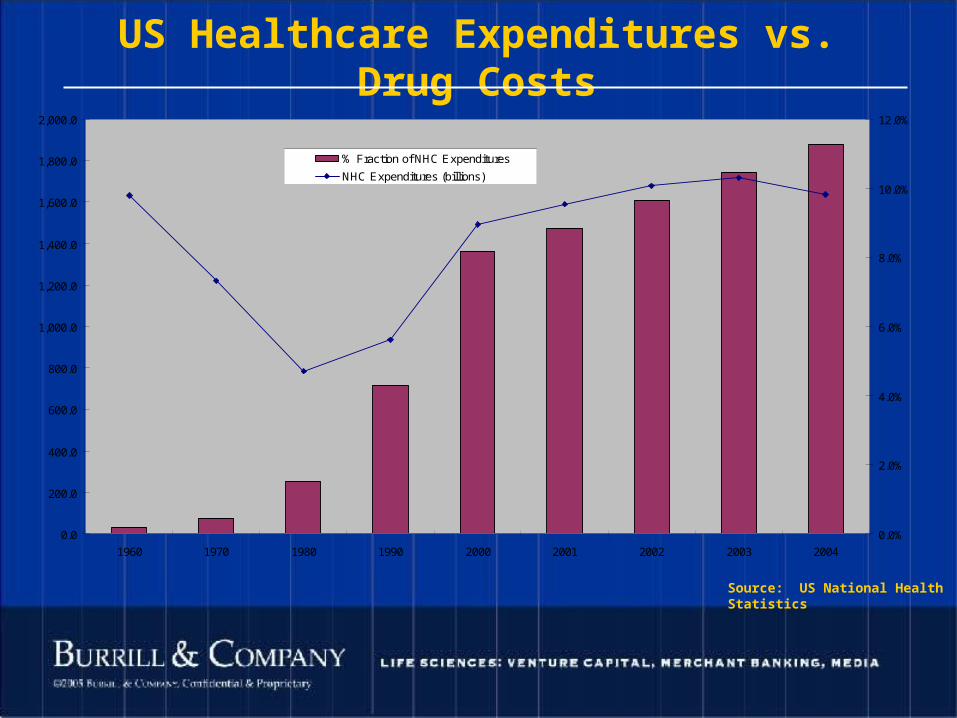
US Healthcare Expenditures vs. Drug Costs
0.0
200.0
400.0
600.0
800.0
1,000.0
1,200.0
1,400.0
1,600.0
1,800.0
2,000.0
1960 1970 1980 1990 2000 2001 2002 2003 2004
0.0%
2.0%
4.0%
6.0%
8.0%
10.0%
12.0%
% Fraction of NHC Expenditures
NHC Expenditures (billions)
Source: US National Health Statistics
©2004 Burrill & Company. Confidential & Proprietary.
46
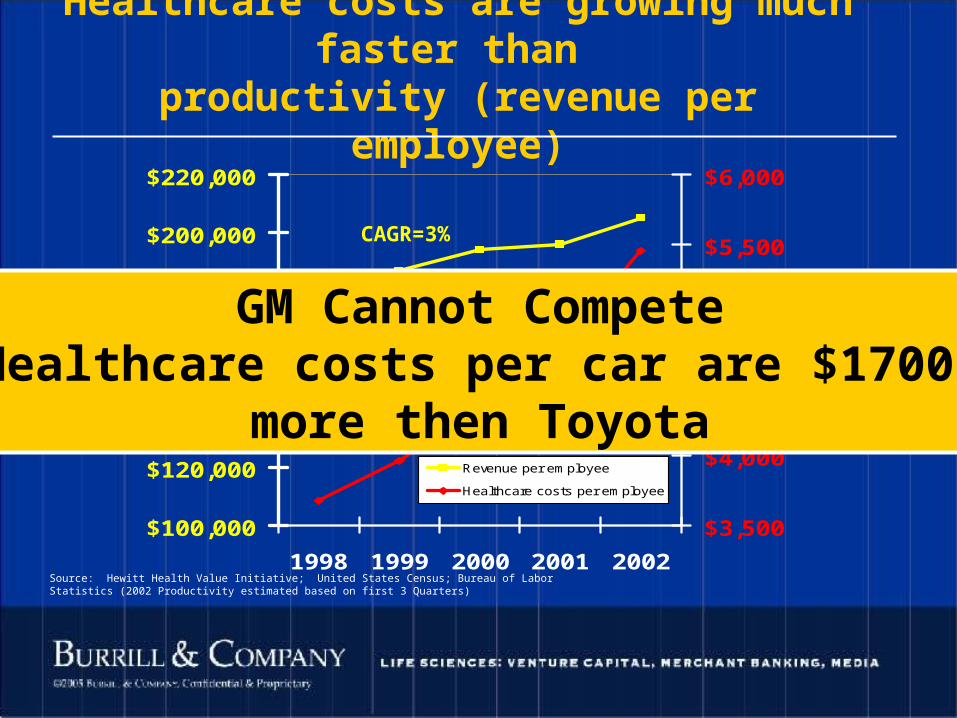
Healthcare costs are growing much faster than
productivity (revenue per employee)
$100,000
$120,000
$140,000
$160,000
$180,000
$200,000
$220,000
1998 1999 2000 2001 2002
$3,500
$4,000
$4,500
$5,000
$5,500
$6,000
Revenue per employee
Healthcare costs per employee
Source: Hewitt Health Value Initiative; United States Census; Bureau of Labor Statistics (2002 Productivity estimated based on first 3 Quarters)
CAGR=3%
CAGR=10%
GM Cannot CompeteHealthcare costs per car are $1700
more then Toyota

©2004 Burrill & Company. Confidential & Proprietary.
47
…So, healthcare cost increases are
on everyone’s agenda-• Politicians/Congress/White House
• Payors/Reimbursors/Insurers
• Physicians/Providers
• Patients/Consumers
…and patients are empowered, have economic costs, and really want to stay well!

©2004 Burrill & Company. Confidential & Proprietary.
48
Medicaid$30
Out of Pocket
$60
Other Public $10
Medicare $65
Private Ins $95
2002 Rx Payment Sources (bil) 2008 Projected (bil)
Medicare $2.6
Out of Pocket $48.6
Medicaid $28.6
Private Ins $77.6
Other Public $5.0
Source: 2002 data: Health Affairs Volume 23, Number 1; January 2004. 2008 data: Tag & Associates estimate.
Total = $162.4 Total = $260
CMS Becomes Dominate Customer(40% of market in 2008)

©2004 Burrill & Company. Confidential & Proprietary.
49
. . . and what’s happeningto big pharma?
Putting Biotech into Context

©2004 Burrill & Company. Confidential & Proprietary.
50
Worldwide Global Pharmaceutical Sales
Global Sales ($USD, B)
$0
$100
$200
$300
$400
$500
$600
1997 1998 1999 2000 2001 2002 2003 2004
To
tal M
arket
Valu
e (
$B
)

©2004 Burrill & Company. Confidential & Proprietary.
51
…by the way, the Global Nutraceuticals Industry is $196 Billion
Functional Food36%
Supplements34%
Natural & Organic Foods21%
Natural Personal
Care9%
Functional Food
Supplements
Natural & Organic Foods
Natural Personal Care
2%2%4%4%
18%
30%
38%
0
10
20
30
40
Pe
rce
nta
ge
s
Source: Nutrition Business Journal/Burrill & Company

©2004 Burrill & Company. Confidential & Proprietary.
52
Despite All Efforts, Total Shareholder Returns Have Fallen by
26 Percentage Points Since 1998
Source: IBM Life Sciences Solutions

©2004 Burrill & Company. Confidential & Proprietary.
53
Looking Forward, Patent Exposure is Set to Increase Significantly

©2004 Burrill & Company. Confidential & Proprietary.
54
Biogeneric Status of Biotech Drugs

©2004 Burrill & Company. Confidential & Proprietary.
55
Manufacturer Reported Serious Adverse Events
Per Fiscal Year

©2004 Burrill & Company. Confidential & Proprietary.
56
Pulled from the MarketDateApproved Drug Name Use Risks
Date Withdrawn
2004
2001
Tysabri
Bextra
Multiple Sclerosis
Pain reliever
Rare, frequently fatal demyleinating disease of CNS
Heart attack/stroke; fatal skin reactions2005
2005
1999 Vioxx Pain reliever Heart attack/stroke 2004
1997 Baycol Cholesterol Severe damage to muscle, that is sometimes fatal
2001
1999 Raplon Anesthesia An inability to breathe normally 2001
1993 Propulsid Heartburn Fatal heart rhythm abnormalities 2000
1997 Rezulin Type 2 diabetes Severe liver toxicity 2000
1988 Hismanal Antihistamine Fatal heart rhythm abnormalities 1999
1997 Raxar Antibiotic Fatal heart rhythm abnormalities 1999
1997 Posicor High blood pressure Dangerous interactions with other drugs 1998
1997 Duract Pain reliever Severe liver damage 1998
1985 Seldane Antihistamine Fatal heart rhythm abnormalities 1998
1973 Pondimin Obesity Heart valve abnormalities 1997
1996 Redux Obesity Heart valve abnormalities 1997
Blockbuster drugs pulled from the
market gave investors concern

©2004 Burrill & Company. Confidential & Proprietary.
57
Number of New Biotech — Big Pharma Collaborations 1993-
2005
Source: BioWorld Financial Watch, American Health Consultants, BioCentury
69
165180
228 224 229
373
425 411384
117
0
50
100
150
200
250
300
350
400
450
1993 1994 1995 1996 1997 1998 1999 2000 2001 2002 2003 2004
502
2005
517

©2004 Burrill & Company. Confidential & Proprietary.
58
Selected Biotech Partnering Last 12 Months
• Biogen/Protein Design Labs $800M• Alnylam/Novartis $700M• Medarex/BMS $530M• Pfizer/Coley $505M• Shire/New River $500M• Plexxikon/Wyeth $372M• Nastech/Merck $341M• Avanir/Astra Zeneca $340M• Cilag/Basilea Pharma $308M• Pharmasset/Roche $300M• CancerVax/Serono $278M• Astex/AstraZeneca $275M• GSK/Theravance $252M• Sirna/Allergan $250M• GenMab/Serono $215M• Sucampo/Takeda $210M• Novartis/Avanir $210M
$17 Billion Deals in
2005!

©2004 Burrill & Company. Confidential & Proprietary.
59
2005 Partnering Highlights
Partnering continues to play an important role in our industry – over $17 B in transaction values in 2005
Significant jump in average total Phase I deal values
From $57M in 2004 to $82M in 2005
Big Pharma continues to partner early to access key technologies, targets and products

©2004 Burrill & Company. Confidential & Proprietary.
60
Selected Biotech M&A Last 12 Months
Medicis/Inamed $2.8B
Solvay/Fourier Pharma $2.1B
Pfizer/Vicuron $1.7B
Shire/TKT $1.6B
GSK/ID Biomedical $1.4B
Meda/Viatris $1.0B
OSI/Eyetech $0.9B
Genzyme/BoneCare $0.6B
Danisco/Genencor $0.6B
Pfizer/Angiosyn $0.5B
Protein Design Labs/ESP Pharma $0.5B
GSK/Corixa $0.4B
M&A a better exit for investors then IPOs

©2004 Burrill & Company. Confidential & Proprietary.
61
2005 M&A Highlights Continued generic consolidation
Sandoz-Hexal/Eon; Teva-Ivax
Japanese big pharma acquisitions Sankyo-Daiichi; Takeda-Syrrx; Sosei-Arakis
With the 2005 IPO window tight, M&A became an increasingly attractive “exit” mechanism
Big Pharma acquired for single products (J&J-Peninsula) and strategic technologies (Roche-GlyCart)
Amgen remained acquisitive with Abgenix transaction

©2004 Burrill & Company. Confidential & Proprietary.
62
Selected Significant Mergers Involving Biotechs- 1990-2006
Companies YearValue ($M)
Novartis/Chiron 2006 $5.4B
Amgen/Abgenix 2005 $2.2UCB/Celltech 2004 $2.7Amgen/Tularik 2004 $1.3Amgen/Immunex 2001 $16.0 Millennium/Cor Therapeutics 2001
$2.0 MedImmune/Aviron 2001 $1.5
Shire Pharma/Biochem Pharma 2000 $4.0Invitrogen/Life Technologies 2000 $1.5Ciba-Geigy/Chiron 1994 $2.1
Roche/Genentech (60%) 1990 $2.1

©2004 Burrill & Company. Confidential & Proprietary.
63
So what does Big Pharma do better than anyone else?
• Discovery?
• Development?
• Manufacturing?
• Distribution?
• Disease Management?
Answer: ???
©2004 Burrill & Company. Confidential & Proprietary.
64
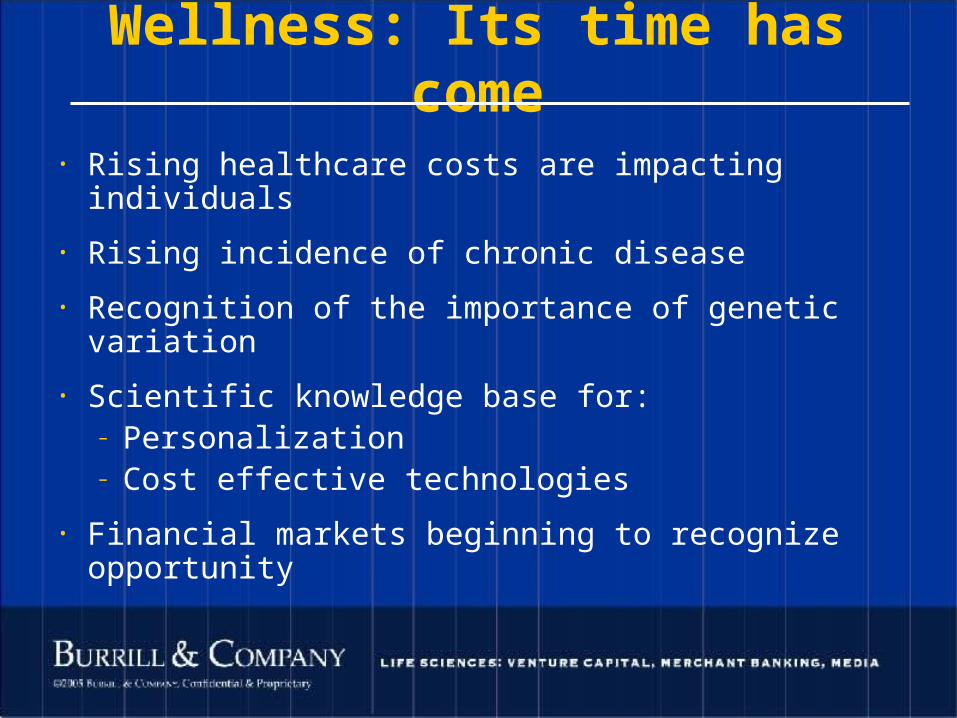
Wellness: Its time has come
• Rising healthcare costs are impacting individuals
• Rising incidence of chronic disease
• Recognition of the importance of genetic variation
• Scientific knowledge base for:– Personalization– Cost effective technologies
• Financial markets beginning to recognize opportunity

©2004 Burrill & Company. Confidential & Proprietary.
65
Food and Lifestyle can Influence our Genes
and How they Work• Diet – Gene Interactions• Exercise – Gene Interactions

©2004 Burrill & Company. Confidential & Proprietary.
66
Genetically identical mice from genetically identical mothers were fed different amounts of
specific nutrients during pregnancy
What you eat – “or what your mother ate”
can determine your health!

©2004 Burrill & Company. Confidential & Proprietary.
67
The Emerging Health & Wellness Market
Genotyping
Diet Functional Foods Medical Foods DrugsPrognosis
of Predisposition
Health & Wellness management against a set of
personalized biomarkers
Biomarker monitoring
Personalized nutritionSc
ienc
e Bas
ed
bioa
ctiv
es
©2004 Burrill & Company. Confidential & Proprietary.
68
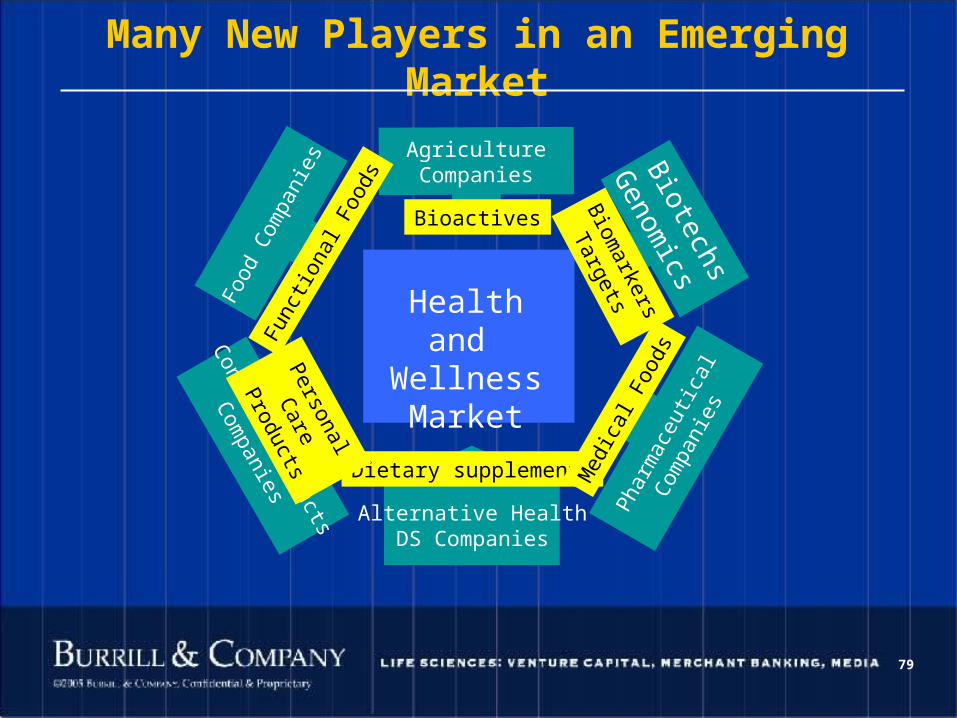
Many New Players in an Emerging Market
Health and WellnessMarket
Food
Com
pani
es
Consum
er Products
Com
panies Pha
rmac
eutic
al
Com
pani
es
Biotechs
Genom
ics
AgricultureCompanies
Alternative HealthDS Companies
79
Dietary supplements Med
ical
Foo
ds
Biom
arkers
Targets
Bioactives
Func
tiona
l Foo
ds
Personal Care
Products

©2004 Burrill & Company. Confidential & Proprietary.
69
Performance of the Healthy Living and Obesity Indicesvs. the S&P 500 & Russell 2000
40
80
120
160
200
240
280
320
360
400
440
480
520
560
600
640D
ec-9
8F
eb-9
9A
pr-9
9Ju
n-99
Aug
-99
Oct
-99
Dec
-99
Feb
-00
Apr
-00
Jun-
00A
ug-0
0O
ct-0
0D
ec-0
0F
eb-0
1A
pr-0
1Ju
n-01
Aug
-01
Oct
-01
Dec
-01
Feb
-02
Apr
-02
Jun-
02A
ug-0
2O
ct-0
2D
ec-0
2F
eb-0
3A
pr-0
3Ju
n-03
Aug
-03
Oct
-03
Dec
-03
Feb
-04
Apr
-04
Jun-
04A
ug-0
4O
ct-0
4D
ec-0
4F
eb-0
5A
pr-0
5Ju
n-05
Aug
-05
Oct
-05
Healthy Living Obesity S&P 500 Russell 2000
Healthy Living
Obesity
©2004 Burrill & Company. Confidential & Proprietary.
70
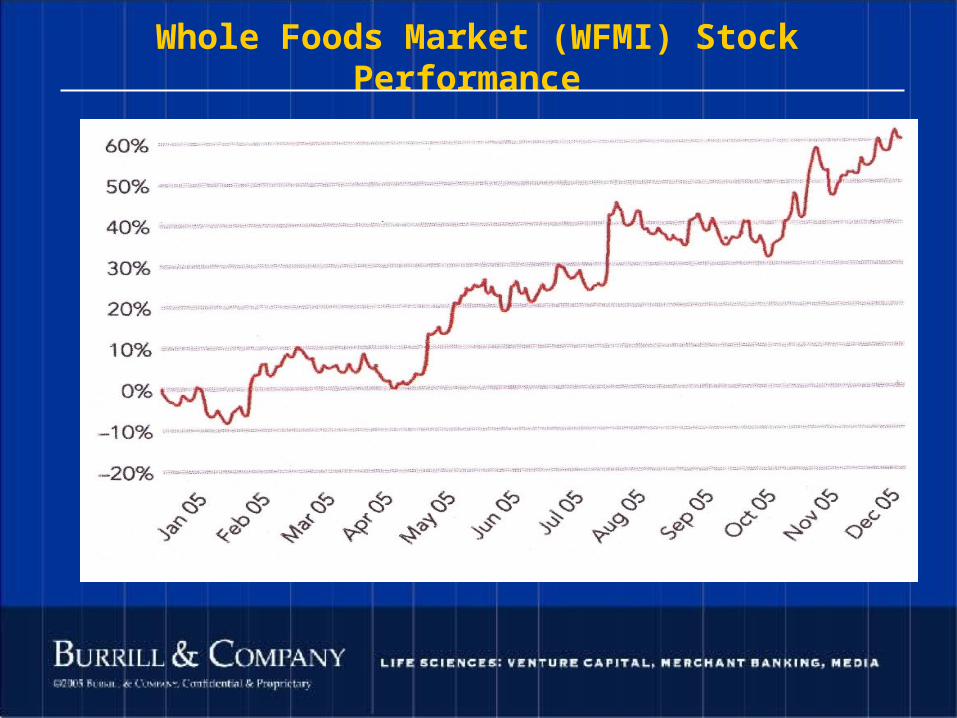
Whole Foods Market (WFMI) Stock Performance

©2004 Burrill & Company. Confidential & Proprietary.
71
…And what about the regulators?
Leadership changes
Phase III/IV (Pharmacovigilance)
Drug Safety Review Board (Vioxx, Tysabri)
GMP—Chiron vaccine problems, others
Generics
Theranostics (Rx/Dx)…critical path initiative

©2004 Burrill & Company. Confidential & Proprietary.
72
Number of Products Approved — 1980–2005
0
5
10
15
20
25
30
35
40
45
1982 1983 1984 1985 1986 1987 1988 1989 1990 1991 1992 1993 1994 1995 1996 1997 1998 1999 2000 2001 2002 2003 2004 2005
New Indications
Biotech Drugs

©2004 Burrill & Company. Confidential & Proprietary.
73
Biotech’s Big DrugsTop 20 Biotech Drugs Ranked by 2004 Revenue*
Drug Company Disease 2004 Sales ($M) 2003 Sales ($M) % ChangeEpogen Amgen Anemia $2,601 $2,435 7%Aranesp Amgen Anemia $2,473 $1,544 60%Rituxan Genentech and Biogen-IDEC Non-Hodgkin lymphoma $2,326 $1,982 17%Enbrel Amgen Arthritis $1,900 $1,300 46%
Neulasta Amgen Neutropenia $1,740 $1,256 39%Avonex Biogen-IDEC Multiple sclerosis $1,417 $1,168 21%
Neupogen Amgen Neutropenia $1,175 $1,267 -7%Rebif Serono Multiple Sclerosis $1,091 $819 33%
Synagis MedImmune Infectious disease $942 $849 11%Cerezyme Genzyme Gaucher disease $839 $739 14%
Viread Gilead HIV $783 $567 38%Gonal-f Serono Infertility $573 $526 9%Avastin Genentech Metastatic Colorectal Cancer $555 NA NA
Herceptin Genentech Breast cancer $483 $425 14%Visudyne QLT Wet AMD $448 $356 26%Provigil Cephalon Excessive Daytime Sleepiness $439 $290 51%Renagel Genzyme End-stage Renal Disease $364 $282 29%
Actiq Cephalon Breakthrough Cancer Pain $344 $237 45%Erbitux ImClone Metastatic Colorectal Cancer $261 NA NA
AmBisome Gilead Infectious disease $212 $198 7%
* Biotechnology revenues only. Pharma partner revenues excluded.

©2004 Burrill & Company. Confidential & Proprietary.
74
Biotechnology Drugs in Clinical Development
©2004 Burrill & Company. Confidential & Proprietary.
75
. . . and the marketplaceis changing too

©2004 Burrill & Company. Confidential & Proprietary.
76
Big “new” markets
Obesity/diabetes/metabolic disease
Alzheimer's/memory
Anti-aging
Anti infectives (antibiotic resistance)
Wellness (preventative/predictive cure)
©2004 Burrill & Company. Confidential & Proprietary.
77
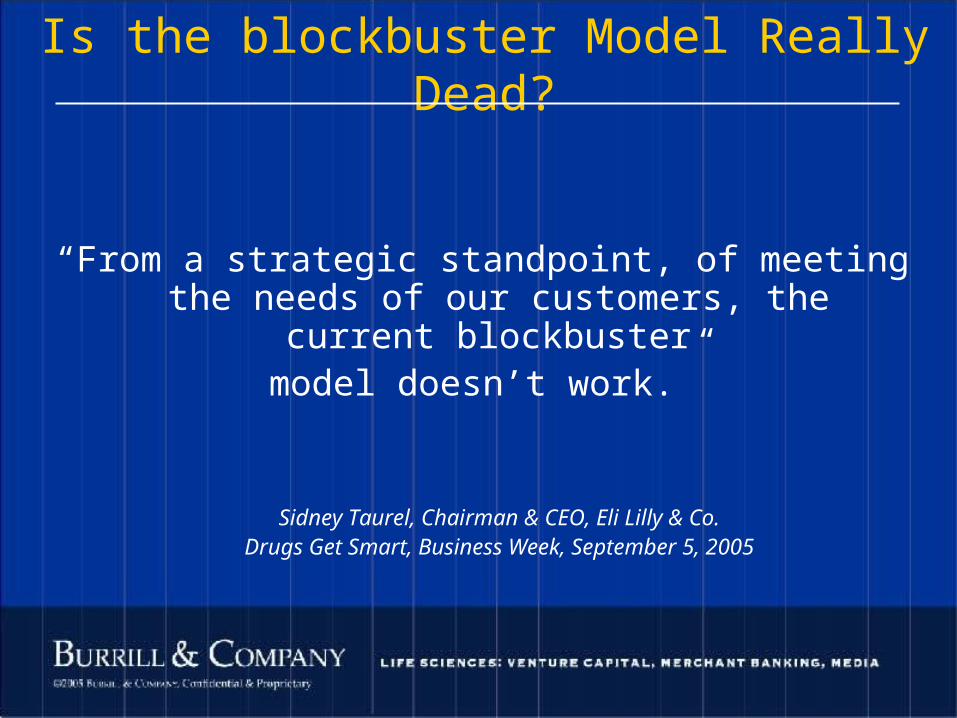
Is the blockbuster Model Really Dead?
“From a strategic standpoint, of meeting the needs of our customers, the current
blockbuster model doesn’t work.”
Sidney Taurel, Chairman & CEO, Eli Lilly & Co.Drugs Get Smart, Business Week, September 5,
2005

©2004 Burrill & Company. Confidential & Proprietary.
78
The Personalized Medicine ModelThe right drug for the right patient at the right
time• Utilizes pharmacogenomics, which benefits from the recent
advances of genomics/proteomics technology
• Reduced development cost; shorter development time from discovery to launch
• Smaller clinical trials required to prove efficacy in target population
• Greater probability of clinical compounds reaching market
• Better safety profile
• Treat specific populations based on biomarkers or molecular diagnostics/imaging results
• Product focus: personalized medicines (nichebusters) that do not require blockbuster-sized sales to generate attractive returns

©2004 Burrill & Company. Confidential & Proprietary.
79
Market Trends and Drivers: Revolutionary Technologies
and Evolutionary Practices

©2004 Burrill & Company. Confidential & Proprietary.
80
Who cares and who will drive change?
• Individuals– Bearing more of the burden– Already spend almost 30% of drug spend– Role of Self Care & consumer-driven health
care
• HMOs• Re-insurers• Corporations• Baby boomers – aging activists!• Governments (CMS in the US)

©2004 Burrill & Company. Confidential & Proprietary.
81
Ag-BiotechnologyOutlook for the Future

©2004 Burrill & Company. Confidential & Proprietary.
82
The Demands for Agriculture Stay the Same
0
1
2
3
4
5
6
7
8
1950 1975 2000 2020
WorldPopulation
Arable Land(billion ha.)
Farmland perperson(ha)
1999-United Nations
More food on less land with half the water.

©2004 Burrill & Company. Confidential & Proprietary.
83
Market Overview – Agriculture

©2004 Burrill & Company. Confidential & Proprietary.
84
Global Area of Biotech Crops 1996 to 2005 by Crop
©2004 Burrill & Company. Confidential & Proprietary.
85
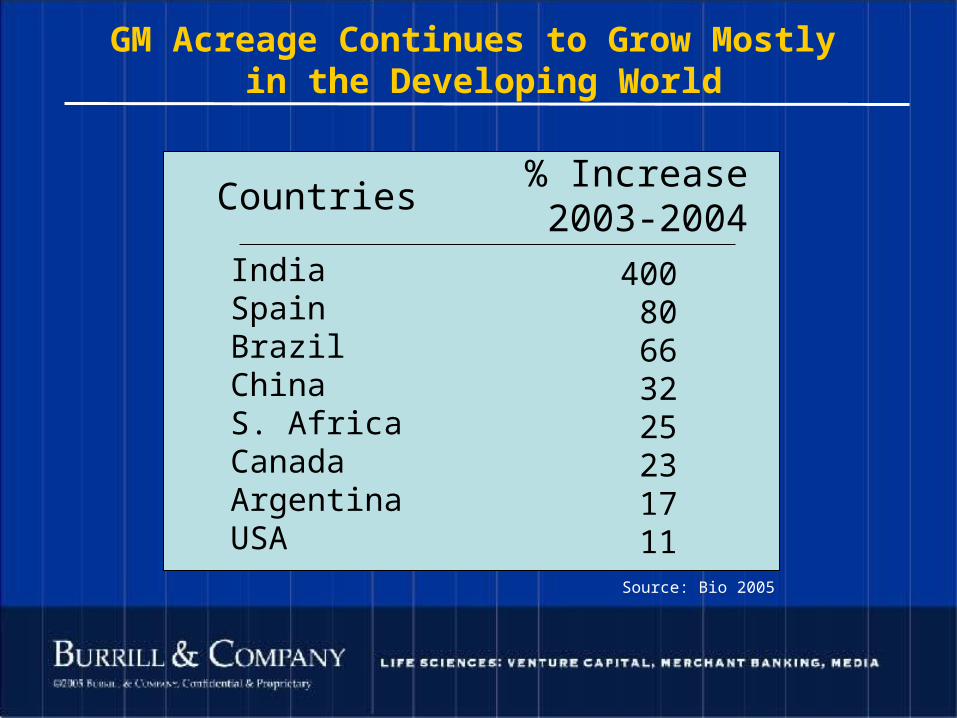
GM Acreage Continues to Grow Mostly in the Developing World
Source: Bio 2005
Countries% Increase 2003-2004
IndiaSpainBrazilChinaS. AfricaCanadaArgentina USA
40080663225231711

©2004 Burrill & Company. Confidential & Proprietary.
86
Monsanto Relative Performance vs. Merck & Pfizer
-100%
-50%
0%
50%
100%
150%
200%
Jan
-02
Ma
r-0
2
Ma
y-0
2
Jul-
02
Se
p-0
2
No
v-0
2
Jan
-03
Ma
r-0
3
Ma
y-0
3
Jul-
03
Se
p-0
3
No
v-0
3
Jan
-04
Ma
r-0
4
Ma
y-0
4
Jul-
04
Se
p-0
4
No
v-0
4
Jan
-05
Ma
r-0
5
Ma
y-0
5
Jul-
05
Se
p-0
5
No
v-0
5
Jan
-06
Monsanto
Pfizer
Merck
©2004 Burrill & Company. Confidential & Proprietary.
87
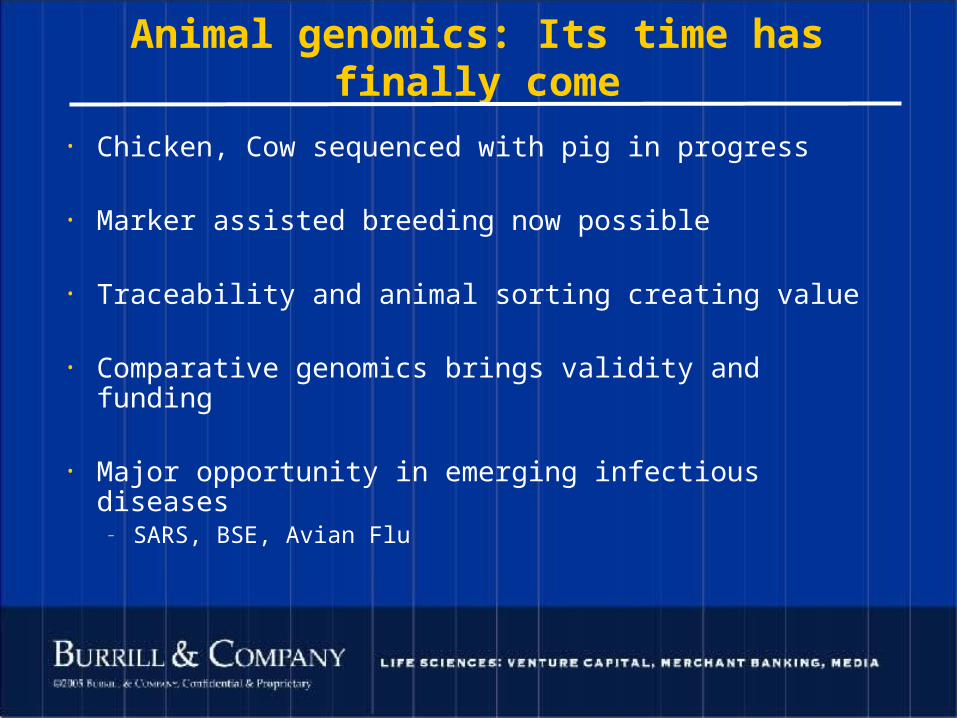
Animal genomics: Its time has finally come
• Chicken, Cow sequenced with pig in progress
• Marker assisted breeding now possible
• Traceability and animal sorting creating value
• Comparative genomics brings validity and funding
• Major opportunity in emerging infectious diseases– SARS, BSE, Avian Flu

©2004 Burrill & Company. Confidential & Proprietary.
88
Industrial Bio is here, finally… 2005 was the Year of the Tipping
Point• Robust technology
• Broad applications
• EU has led ‘White Biotech’
• Waiting for market pull
• Concerns over energy “addiction”

©2004 Burrill & Company. Confidential & Proprietary.
89
In 2005 Many of the Drivers Aligned
Cost of crude oil escalated dramatically !
©2004 Burrill & Company. Confidential & Proprietary.
90
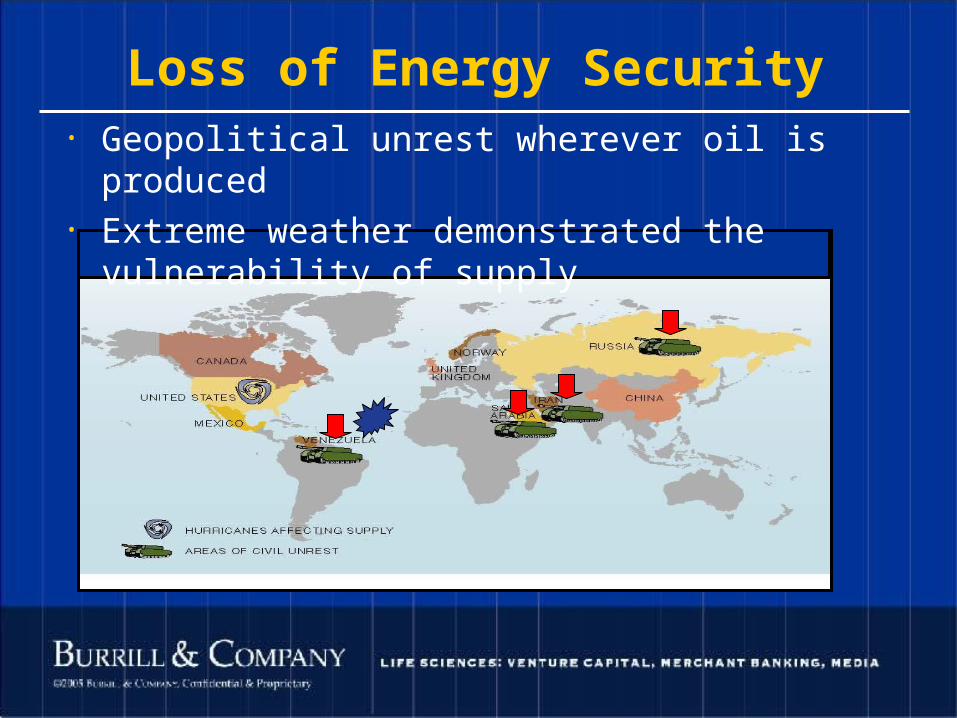
Loss of Energy Security• Geopolitical unrest wherever oil is produced• Extreme weather demonstrated the
vulnerability of supply

©2004 Burrill & Company. Confidential & Proprietary.
91
Growing Worldwide Demand for Energy
• Finite reserves will cost more to extract
• Demand is growing rapidly, much in Pac Rim countries, especially China & India
• 420 x 1015 currently going to 650 x 1015
btu by 2030
©2004 Burrill & Company. Confidential & Proprietary.
92
All This Accelerated Policy Changes Worldwide
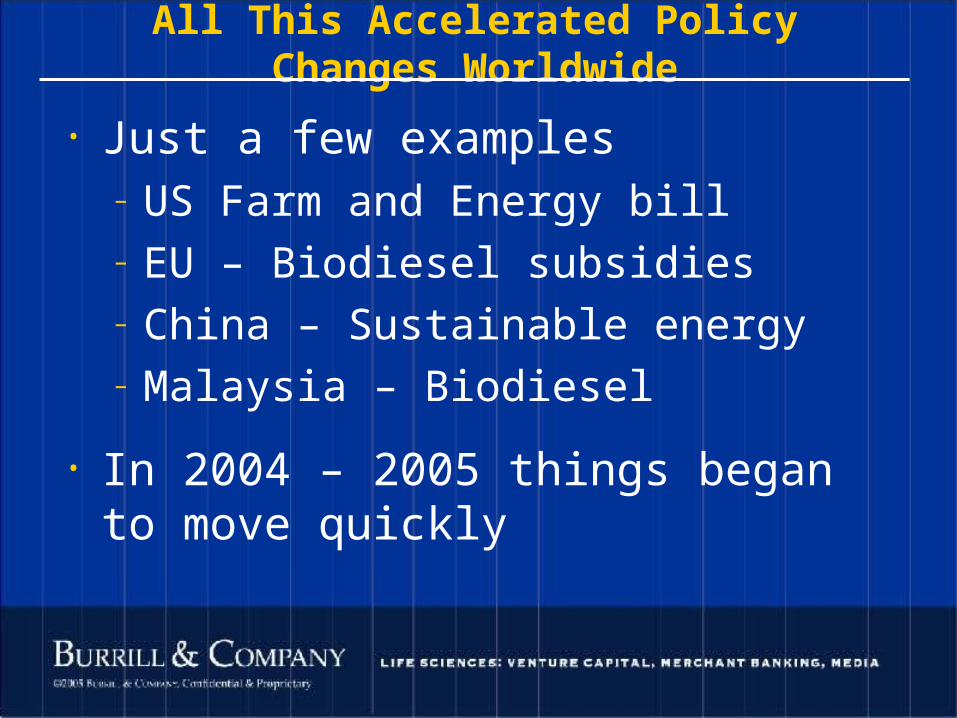
• Just a few examples– US Farm and Energy bill– EU – Biodiesel subsidies– China – Sustainable energy– Malaysia – Biodiesel
• In 2004 – 2005 things began to move quickly

©2004 Burrill & Company. Confidential & Proprietary.
93
The Biorefinery Platform Using Agricultural Feed Stocks
©2004 Burrill & Company. Confidential & Proprietary.
94
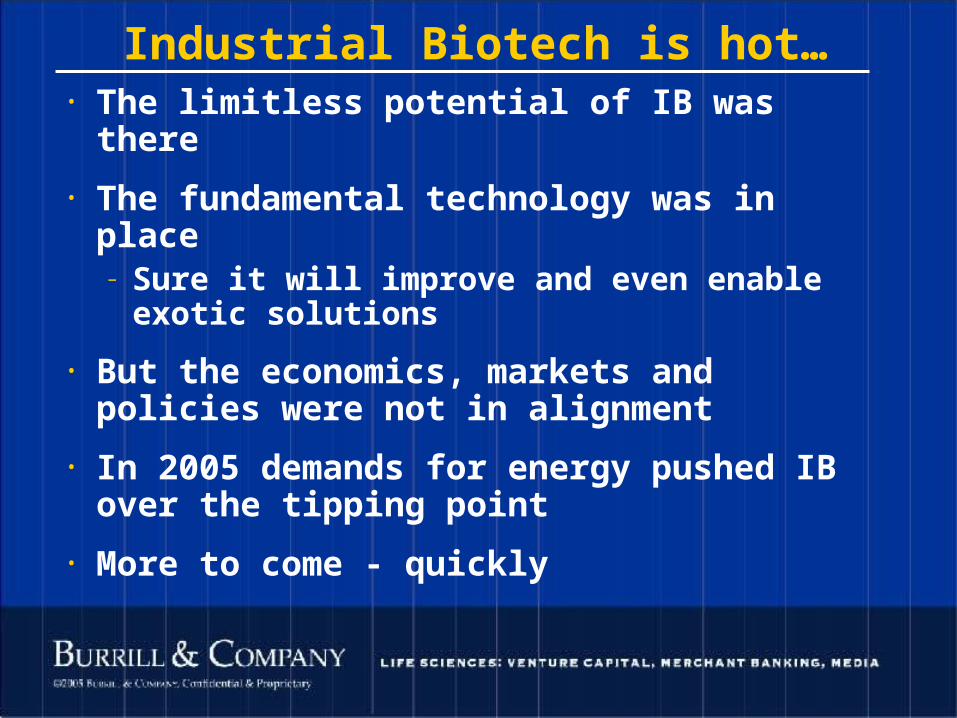
Industrial Biotech is hot…• The limitless potential of IB was there
• The fundamental technology was in place– Sure it will improve and even enable
exotic solutions
• But the economics, markets and policies were not in alignment
• In 2005 demands for energy pushed IB over the tipping point
• More to come - quickly

©2004 Burrill & Company. Confidential & Proprietary.
95
(China/India)» What’s happening?» Impact

©2004 Burrill & Company. Confidential & Proprietary.
96
10,529
4,509
2,719
1,984
1,980
1,869
1,821
1,721
13,783
2,790
7,334
3,291
2,392
1,736
1,725
1,620
1,462
1,449
10,332
2,274
44
37
15
25
15
14
10
14
19
19
China Has A Large And Rapidly Growing Economy
Projected Accumulative GDP Growth (2004-2010) %
Average 17%
Real GDP in US$ billions (Based on Purchasing Power Parity)2004
U.S.
Japan
Germany
France
China
Italy
U.K.
Brazil
Russia
India
2010
Source:CIA world Fact book
U.S.
Japan
Germany
France
U.K.
Italy
China
Brazil
India
Russia

©2004 Burrill & Company. Confidential & Proprietary.
97
Unprecedented Growth in China Life Sciences Markets
2000 2005 2010
2000 2005 2010
Total Health Care Spending(US Billion Dollars)
Total Pharmaceutical Market(US Billion Dollars)
CAGR 16%
CAGR 17%
2000 2005 2010
2000 2005 2010
Total Biotechnology Market(US Billion Dollars)
Total Medical Devices Market(US Billion Dollars)
CAGR 19%
CAGR 19%
Source: IMS; Frost & Sullivan; E&Y; literatures search, World Bank; Burrill Analysis, Goldman Sachs, BCG
•5th largest pharmaceutical market by 2010 (Boston Consulting Group)
•3rd largest medical devices market by 2010 (Goldman Sachs)
•Excellent investment and merchant banking opportunities
34
150
70
1832
70
2.2
8.8
4.5
3.26.3
14.8

©2004 Burrill & Company. Confidential & Proprietary.
98
China Life Sciences Strengths
Low costs in drug R&D and manufacturing
High growth potential in domestic market driven by aging population and improved personal income
Large researcher talent pool with technology and industry knowledge and skills
Strong central and local government support, with favorable tax policies and grants
Special strengths: Gene therapy, stem cell research, Traditional Chinese Medicine (TCM), chemistry services
Sources: *IMS Global Health

©2004 Burrill & Company. Confidential & Proprietary.
99
China’s market size for ethical & OTC drugs in USD$Billion
346Total6China8Mexico8Canada9Spain
13Italy14UK19France20Germany53Japan
196USA2002 Top 10
447Total10Spain10Canada10Brazil14China15Italy16UK21France24Germany65Japan
262USA2005 Top 10
731Total15Brazil16Spain17Canada23Italy24UK24China28France37Germany81Japan
466USA2010 Top 10
Source: Boston Consulting Group
China’s Pharma Market To Become #5 World Wide by 2010

©2004 Burrill & Company. Confidential & Proprietary.
100
China Biopharmaceutical Roadmap
Time
Commodity/
“Copies”
Proprietary/
Innovation
Low Margin
High Margin
We are here
Technology TransferCo-development
Proprietary Pipeline
Services and
Commodity based
businesses

©2004 Burrill & Company. Confidential & Proprietary.
101
• State of Innovation:– Innovation historically has been in process
improvement – However, there are a growing number of
patents and publications from government and academic labs
India – Innovation is Increasing
Indian Patents & Publications
0
50
100
150
200
250
300
1991
1992
1993
1994
1995
1996
1997
1998
1999
2000
2001
2002
Year
Publications
Patents
-Nature Magazine

©2004 Burrill & Company. Confidential & Proprietary.
102
Findings – Innovation stems from both
Govt. Labs and Industry
– The Government of India (GOI) has doubled biotech research spending from $175 million from 1997-2002 to $350 million from 2002 -2007
– R&D investments of the top 5 pharma companies had crossed $270 million mark in 2004
©2004 Burrill & Company. Confidential & Proprietary.
103
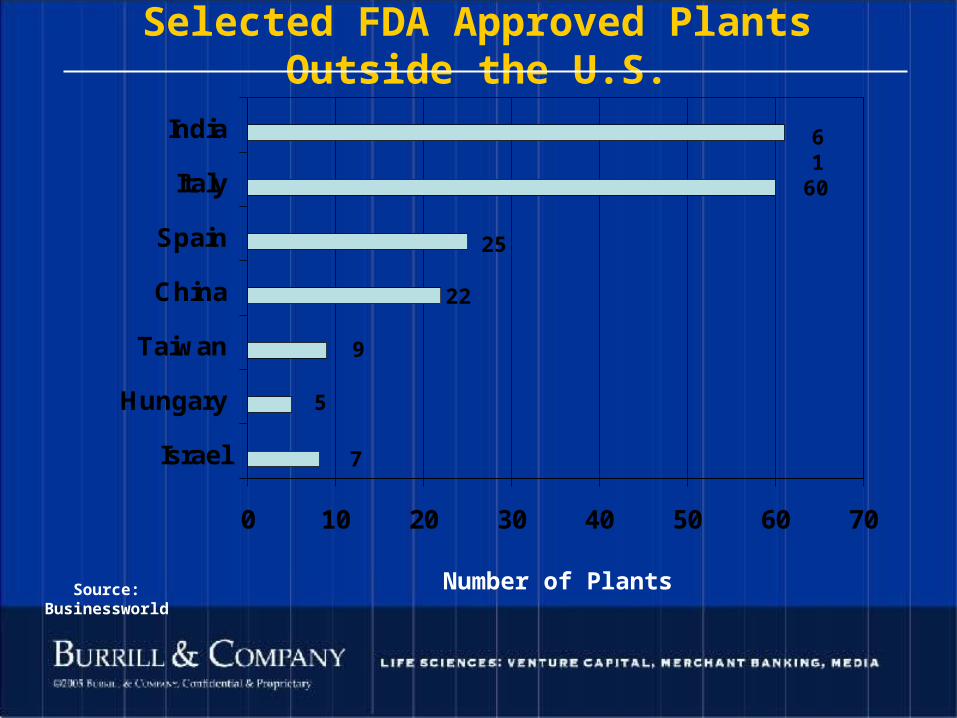
0 10 20 30 40 50 60 70
Israel
Hungary
Taiwan
China
Spain
Italy
India
Selected FDA Approved Plants Outside the U.S.
Source: Businessworld Number of Plants
61
60
25
22
9
5
7

©2004 Burrill & Company. Confidential & Proprietary.
104
Capital Markets
©2004 Burrill & Company. Confidential & Proprietary.
105
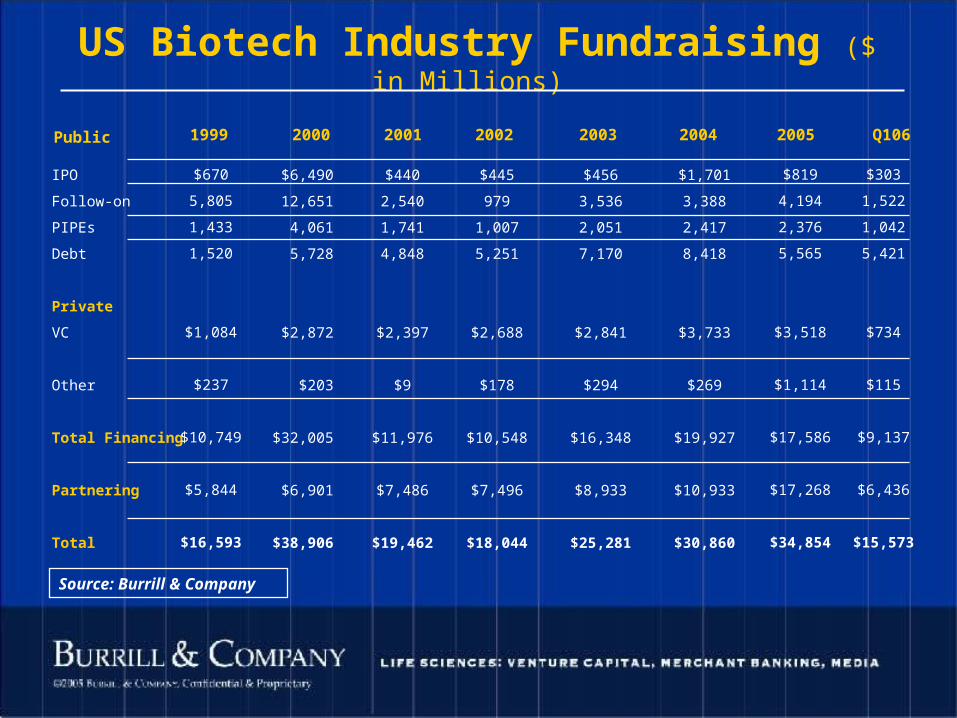
US Biotech Industry Fundraising ($ in Millions)
IPO
Follow-on
PIPEs
Debt
Private
VC
Other
Total Financing
Partnering
Total
$670
5,805
1,433
1,520
$1,084
$237
$10,749
$5,844
$16,593
$6,490
12,651
4,061
5,728
$2,872
$203
$32,005
$6,901
$38,906
Public 1999 2000
$440
2,540
1,741
4,848
$2,397
$9
$11,976
$7,486
$19,462
2001
$445
979
1,007
5,251
$2,688
$178
$10,548
$7,496
$18,044
2002
$456
3,536
2,051
7,170
$2,841
$294
$16,348
$8,933
$25,281
2003
$1,701
3,388
2,417
8,418
$3,733
$269
$19,927
$10,933
$30,860
2004
$819
4,194
2,376
5,565
$3,518
$1,114
$17,586
$17,268
$34,854
2005
Source: Burrill & Company
$303
1,522
1,042
5,421
$734
$115
$9,137
$6,436
$15,573
Q106

©2004 Burrill & Company. Confidential & Proprietary.
106
US Biotech Industry Fundraising ($ in Millions)
Bio ’05 to Bio ‘06
$286
$1,337
$858
$2,508
$845
$176
$6,010
$3,279
$9,289
Source: Burrill & Company
IPO
Follow-on
PIPEs
Debt
Private
VC
Other
Total Financing
Partnering
Total
$168
$1,217
$533
$247
$955
$524
$3,644
$7,745
$11,389
Public$303
1,522
1,042
5,421
$734
$115
$9,137
$6,436
$15,573
Q106Q305 Q405 Total$757
4,076
2,433
7,726
$2,534
$815
$18,791
$17,460
$36,251

©2004 Burrill & Company. Confidential & Proprietary.
107
Capital Raised 1980-2005
$0
$5,000
$10,000
$15,000
$20,000
$25,000
$30,000
$35,000
$40,000
1980 1981 1982 1983 1984 1985 1986 1987 1988 1989 1990 1991 1992 1993 1994 1995 1996 1997 1998 1999 2000 2001 2002 2003 2004 2005
Financings Partnering

©2004 Burrill & Company. Confidential & Proprietary.
108
Biotech’s Five Cycles Length of Rallies/Droughts in Months
0
10
20
30
40
50
60
1983 1986 1991 1995 2000 2003
Droughts
Rallies

©2004 Burrill & Company. Confidential & Proprietary.
109
2005 US Biotech IPOsCompany Ticker Pricing Date Issue Price Current Price (3/24/05) % Change to date
MCap 3/24/05 ($M)
Approx.$ Raised
ViaCell VIAC 1/20/2005 $7.00 $5.50 -21% $211 $53Favrille FVRL 2/2/2005 $7.00 $7.05 1% $143 $42Icagen ICGN 2/2/2005 $8.00 $8.35 4% $184 $40Threshold THLD 2/3/2005 $7.00 $14.58 108% $543 $37Aspreva ASPV 3/3/2005 $11.00 $26.97 145% $921 $79Cardiovascular Bio CVBT.OB 3/14/2005 $10.00 $7.40 -26% $911 $17Xenoport XNPT 6/1/2005 $10.50 $25.77 145% $509 $53Gentium S.p.A GNT 6/15/2005 $9.00 $10.10 12% $81 $22Advanced Life Sciences ADLS 8/5/2005 $5.00 $3.33 -33% $94 $35Coley Pharma COLY 8/9/2005 $16.00 $16.00 0% $414 $96Sunesis Pharma SNSS 9/27/2005 $7.00 $6.93 -1% $149 $42Genomic Health GHDX 9/28/2005 $12.00 $11.47 -4% $281 $60Avalon Pharma AVRX 9/29/2005 $10.50 $5.08 -52% $43 $29Accentia Biopharma ABPI 10/27/2005 $8.00 $6.35 -21% $185 $19CombinatoRx CRXX 11/9/2005 $7.00 $10.98 57% $220 $42Somaxon Pharma SOMX 12/14/2005 $11.00 $16.15 47% $291 $55NUCRYST Pharma NCST 12/21/2005 $10.00 $9.88 -1% $163 $45
$9.18 $11.29 23.0% $314 $4517 Companies

©2004 Burrill & Company. Confidential & Proprietary.
110
2006 US Biotech IPOs
Company Ticker Pricing Date Issue Price Current Price (3/24/05) % Change to dateMCap 3/24/05
($M)Approx.$ Raised
Altus Pharmaceuticals ALTU 1/24/2006 $15.00 $23.30 55% $489 $121SGX Pharmaceuticals SGXP 1/31/2006 $6.00 $7.86 31% $112 $25Valera Pharmaceuticals VLRX 2/1/2006 $9.00 $10.38 15% $153 $35Iomai Corp. IOMI 2/1/2006 $7.00 $6.03 -14% $102 $35Acorda Therapeutics ACOR 2/10/2006 $6.00 $5.90 -2% $112 $36Alexza Pharmaceuticals ALXA 3/8/2006 $8.00 $9.84 23% $221 $44
$8.50 $10.55 18.2% $198 $496 Companies

©2004 Burrill & Company. Confidential & Proprietary.
111
# of IPOs Amount Raised * Perf. since IPO Ups / Downs
2003 7 $438 M -6% 2 / 5
2004 29 $1,628 M +30% 14 / 14/ 1acq.
2005 17 $819 M +21% 10 / 7
2006 6 $303 M +18% 4 / 2
TOTAL 60 $2,892 M +16% 30 / 29 / 1acq.
IPO Window Summary 2003-2006 (as of 3/31/06)
* Includes over-allotments
©2004 Burrill & Company. Confidential & Proprietary.
112
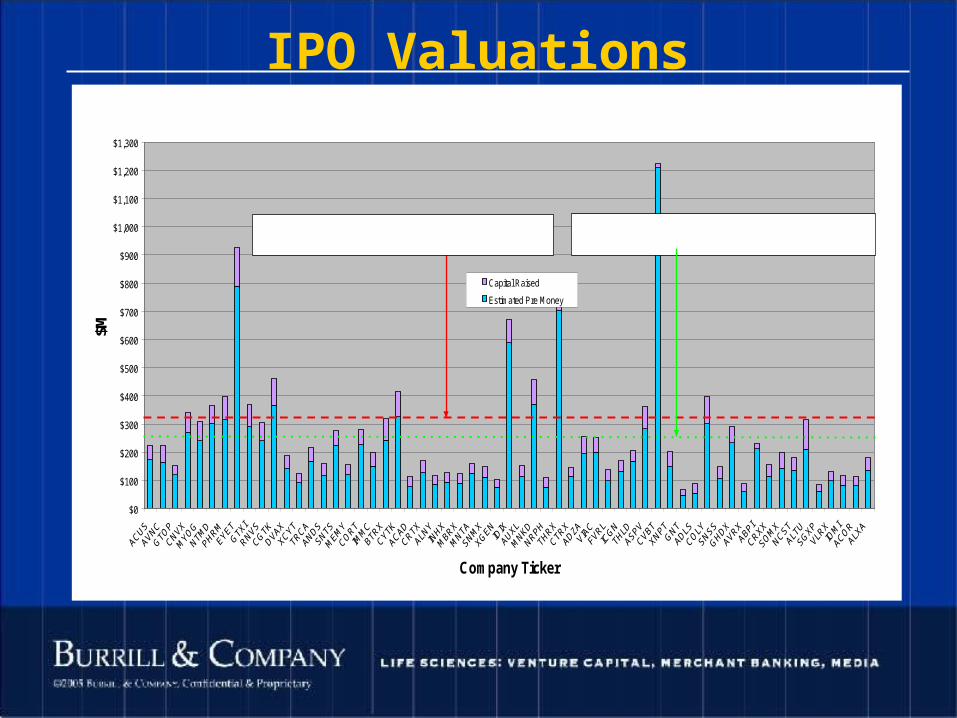
IPO Valuations
$0
$100
$200
$300
$400
$500
$600
$700
$800
$900
$1,000
$1,100
$1,200
$1,300
Company Ticker
$M
Capital Raised
Estimated Pre Money
Mean Pre-Money INCLUDING EYET, IDIX & THRX, CVBT.OB
$209MMean Pre-Money EXCLUDING EYET, IDIX & THRX, CVBT.OB
$165M

©2004 Burrill & Company. Confidential & Proprietary.
113
IPO Market Capitalization History 2003-2006
$0
$200
$400
$600
$800
$1,000
$1,200
$1,400
$1,600
$1,800
$2,000
Biotech IPOs 2003-6
Ma
rke
t C
ap
ita
liza
tio
n (
$M
)
Market Cap. Appreciation Since IPO
Market Cap. Loss Since IPO
©2004 Burrill & Company. Confidential & Proprietary.
114
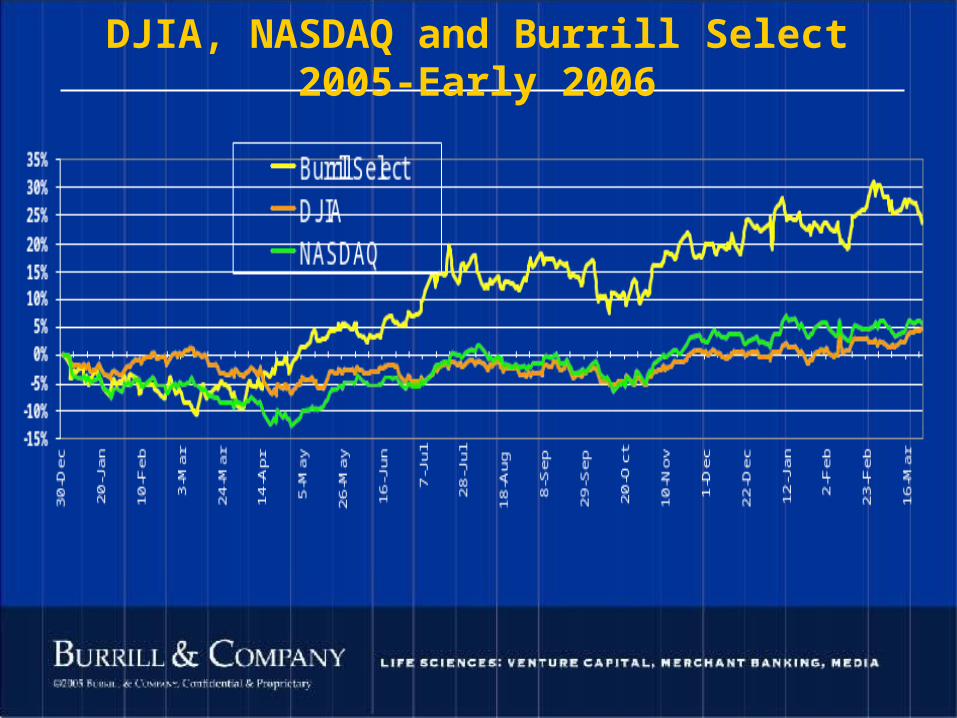
DJIA, NASDAQ and Burrill Select 2005-Early 2006

©2004 Burrill & Company. Confidential & Proprietary.
115
Burrill Large-, Mid- and Small-Cap 2005-Early 2006
©2004 Burrill & Company. Confidential & Proprietary.
116
• The time is now for life sciences• Confluence of technologies is changing biotech and the
healthcare world• Personalized, predictive and preventative medicine is
changing healthcare• Payor/reimbursement world is changing with Medicare’s
power• Market opportunities are different today (pandemic
diseases, memory, obesity, aging, and wellness)• Wellness is a huge growth market• AgBio is back, animal genomics is ready• Industrial biotech’s time has arrived • Capital markets worldwide are robust, but expensive
Biotech 2006
Biotech is a global businessBe aggressive, be bold…the competition is

©2004 Burrill & Company. Confidential & Proprietary.
117
the next 12 months will be the industry’s best!
Biotech’s on a roll…

©2004 Burrill & Company. Confidential & Proprietary.
118
Biotech 2006Life Sciences: A Changing
Prescription
BIO 2006
April 10th 2006
G. Steven Burrill, CEOBurrill & Company
Top Related