


Languages
Pages
Legal

MONGOLIAN COAL INDUSTRYOvercoming challenges in volatile market conditions
February 20, 2014
We have included in this presentation forward-looking statements. All statements that are not historical facts, includingstatements about our intentions, beliefs, expectations or predictions for the future, are forward-looking statements.
The reliance on any forward-looking statement involves risks and uncertainties, and although we believe theassumptions on which the forward-looking statements are based are reasonable, any or all of those assumptions couldprove to be inaccurate and as a result, the forward-looking statements based on those assumptions could also beincorrect.
We undertake no obligation to publicly update or revise any forward-looking statements contained in this presentation,whether as a result of new information, future events or otherwise, except as required by applicable laws, rules andregulations.
In light of these and other risks and uncertainties, the inclusion of forward-looking statements should not be regardedas representations by us that our plans and objectives will be achieved.
2
Disclaimer
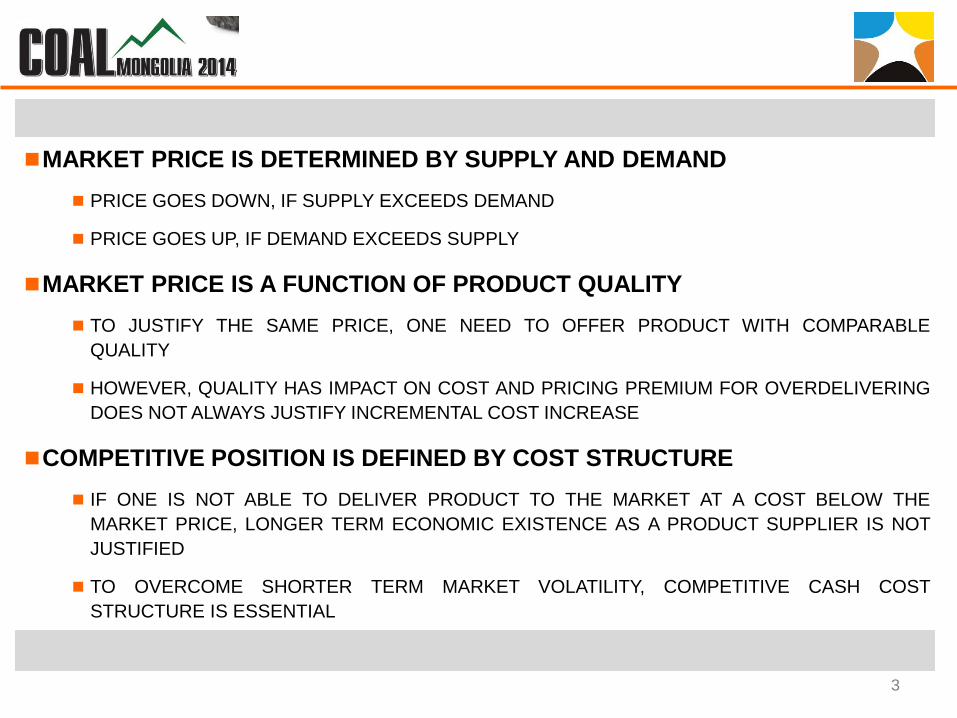
MARKET PRICE IS DETERMINED BY SUPPLY AND DEMAND PRICE GOES DOWN, IF SUPPLY EXCEEDS DEMAND
PRICE GOES UP, IF DEMAND EXCEEDS SUPPLY
MARKET PRICE IS A FUNCTION OF PRODUCT QUALITY TO JUSTIFY THE SAME PRICE, ONE NEED TO OFFER PRODUCT WITH COMPARABLE
QUALITY
HOWEVER, QUALITY HAS IMPACT ON COST AND PRICING PREMIUM FOR OVERDELIVERINGDOES NOT ALWAYS JUSTIFY INCREMENTAL COST INCREASE
COMPETITIVE POSITION IS DEFINED BY COST STRUCTURE IF ONE IS NOT ABLE TO DELIVER PRODUCT TO THE MARKET AT A COST BELOW THE
MARKET PRICE, LONGER TERM ECONOMIC EXISTENCE AS A PRODUCT SUPPLIER IS NOTJUSTIFIED
TO OVERCOME SHORTER TERM MARKET VOLATILITY, COMPETITIVE CASH COSTSTRUCTURE IS ESSENTIAL
3
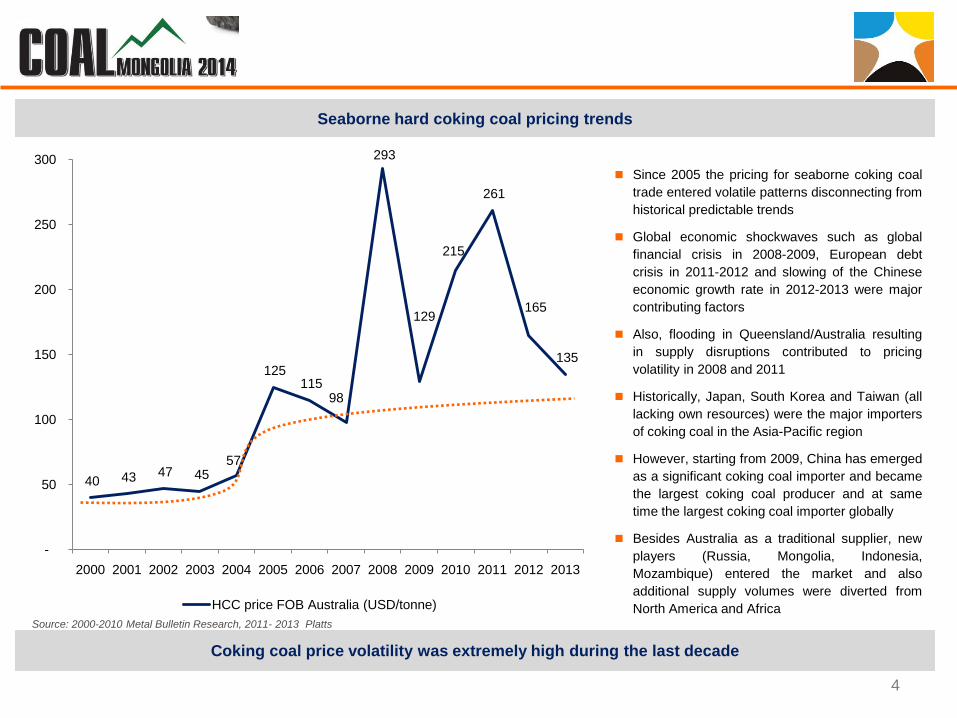
40 43 47 45 57
125 115
98
293
129
215
261
165
135
-
50
100
150
200
250
300
2000 2001 2002 2003 2004 2005 2006 2007 2008 2009 2010 2011 2012 2013
HCC price FOB Australia (USD/tonne)
Coking coal price volatility was extremely high during the last decade
Since 2005 the pricing for seaborne coking coaltrade entered volatile patterns disconnecting fromhistorical predictable trends
Global economic shockwaves such as globalfinancial crisis in 2008-2009, European debtcrisis in 2011-2012 and slowing of the Chineseeconomic growth rate in 2012-2013 were majorcontributing factors
Also, flooding in Queensland/Australia resultingin supply disruptions contributed to pricingvolatility in 2008 and 2011
Historically, Japan, South Korea and Taiwan (alllacking own resources) were the major importersof coking coal in the Asia-Pacific region
However, starting from 2009, China has emergedas a significant coking coal importer and becamethe largest coking coal producer and at sametime the largest coking coal importer globally
Besides Australia as a traditional supplier, newplayers (Russia, Mongolia, Indonesia,Mozambique) entered the market and alsoadditional supply volumes were diverted fromNorth America and Africa
4
Seaborne hard coking coal pricing trends
Source: 2000-2010 Metal Bulletin Research, 2011- 2013 Platts
348,1
421,5
487,6 497,9
566,4
626,5
684,3 716,5
779,0
-
100,0
200,0
300,0
400,0
500,0
600,0
700,0
800,0
2005 2006 2007 2008 2009 2010 2011 2012 2013
Crude Steel Output (Mt)
Chinese crude steel production continues to increase despite decelerating economic growth rate
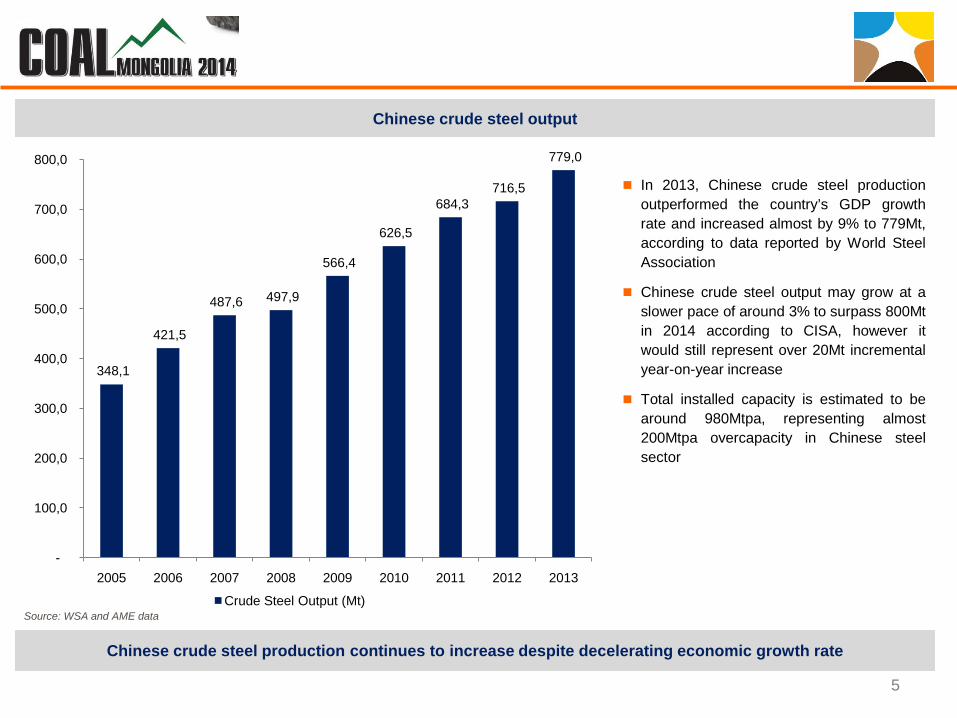
In 2013, Chinese crude steel productionoutperformed the country’s GDP growthrate and increased almost by 9% to 779Mt,according to data reported by World SteelAssociation
Chinese crude steel output may grow at aslower pace of around 3% to surpass 800Mtin 2014 according to CISA, however itwould still represent over 20Mt incrementalyear-on-year increase
Total installed capacity is estimated to bearound 980Mtpa, representing almost200Mtpa overcapacity in Chinese steelsector
5
Chinese crude steel output
Source: WSA and AME data
Chinese demand leads to increasing supply from sea-borne sources targeting this market
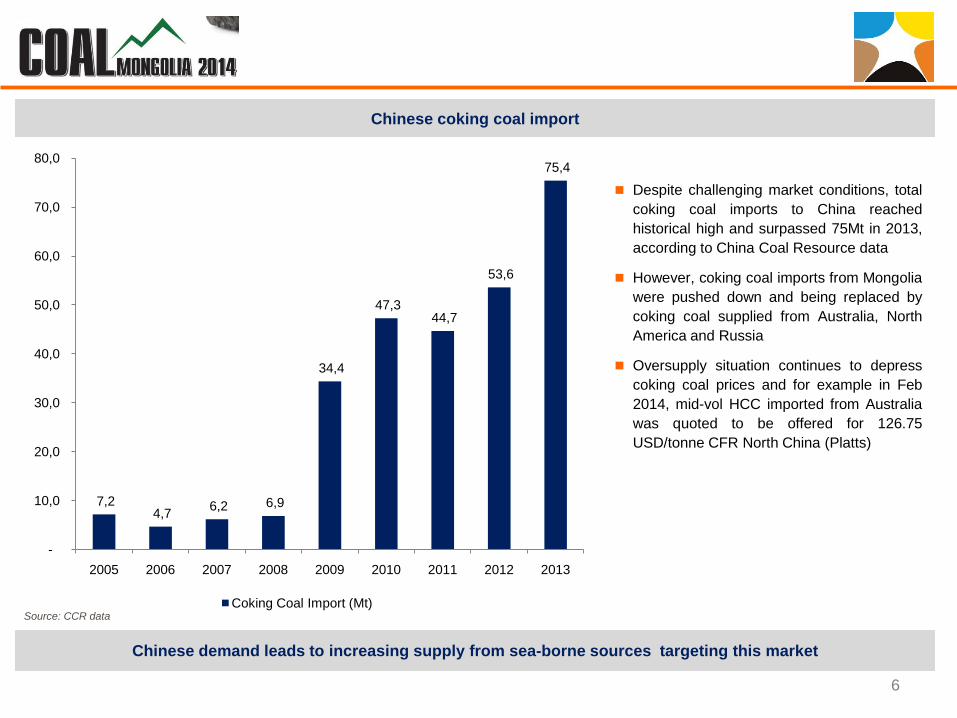
Despite challenging market conditions, totalcoking coal imports to China reachedhistorical high and surpassed 75Mt in 2013,according to China Coal Resource data
However, coking coal imports from Mongoliawere pushed down and being replaced bycoking coal supplied from Australia, NorthAmerica and Russia
Oversupply situation continues to depresscoking coal prices and for example in Feb2014, mid-vol HCC imported from Australiawas quoted to be offered for 126.75USD/tonne CFR North China (Platts)
6
Chinese coking coal import
7,2 4,7 6,2 6,9
34,4
47,3 44,7
53,6
75,4
-
10,0
20,0
30,0
40,0
50,0
60,0
70,0
80,0
2005 2006 2007 2008 2009 2010 2011 2012 2013
Coking Coal Import (Mt)Source: CCR data
Chinese steel production is concentrated in North China coastal area with easy access to sea-borne commodity sources
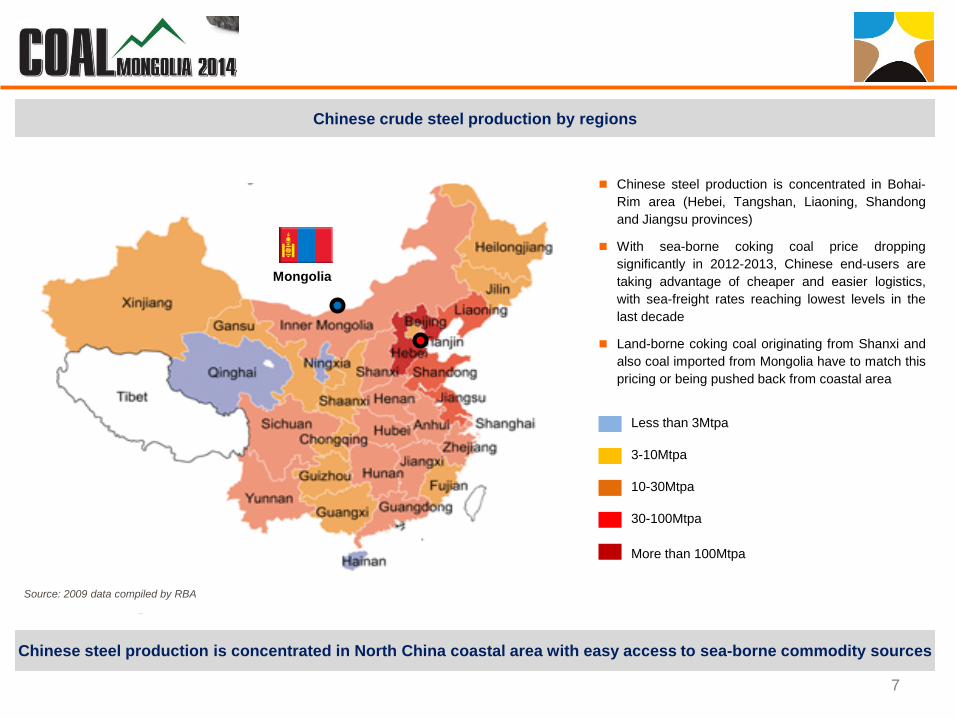
Chinese steel production is concentrated in Bohai-Rim area (Hebei, Tangshan, Liaoning, Shandongand Jiangsu provinces)
With sea-borne coking coal price droppingsignificantly in 2012-2013, Chinese end-users aretaking advantage of cheaper and easier logistics,with sea-freight rates reaching lowest levels in thelast decade
Land-borne coking coal originating from Shanxi andalso coal imported from Mongolia have to match thispricing or being pushed back from coastal area
7
Source: 2009 data compiled by RBA
Less than 3Mtpa
3-10Mtpa
10-30Mtpa
30-100Mtpa
More than 100Mtpa
Mongolia
Chinese crude steel production by regions
Global coking coal supply and demand situation leads to the competition impacting product pricing
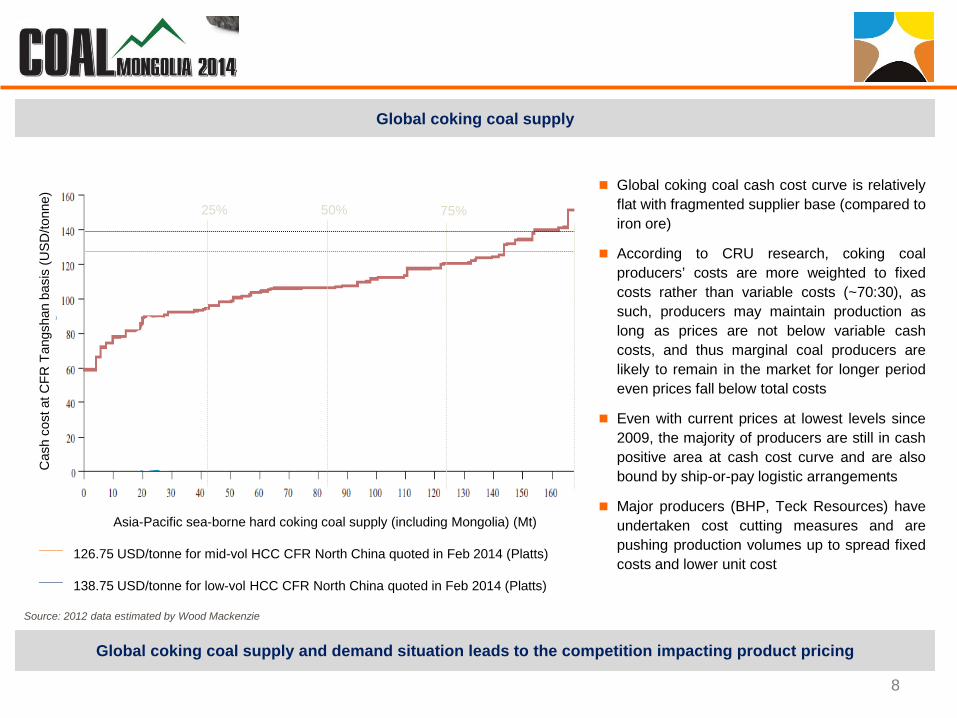
Global coking coal cash cost curve is relativelyflat with fragmented supplier base (compared toiron ore)
According to CRU research, coking coalproducers’ costs are more weighted to fixedcosts rather than variable costs (~70:30), assuch, producers may maintain production aslong as prices are not below variable cashcosts, and thus marginal coal producers arelikely to remain in the market for longer periodeven prices fall below total costs
Even with current prices at lowest levels since2009, the majority of producers are still in cashpositive area at cash cost curve and are alsobound by ship-or-pay logistic arrangements
Major producers (BHP, Teck Resources) haveundertaken cost cutting measures and arepushing production volumes up to spread fixedcosts and lower unit cost
8
Source: 2012 data estimated by Wood Mackenzie
Global coking coal supply
Cas
h co
st a
t CFR
Tan
gsha
n ba
sis
(USD
/tonn
e)
Asia-Pacific sea-borne hard coking coal supply (including Mongolia) (Mt)
25% 50% 75%
138.75 USD/tonne for low-vol HCC CFR North China quoted in Feb 2014 (Platts)
126.75 USD/tonne for mid-vol HCC CFR North China quoted in Feb 2014 (Platts)

Coking coal pricing is determined by coal rank and quality requirements
Coking coal relative value (e.g. product price) isdetermined by its quality parameters which areimportant for coke manufacturing process and arenot directly linked simply to calorific value (CV)
There are two major classification parameters usedglobally; British classification used mostly byWestern and Japanese steelmakers while Germanclassification taken by Russian and later by Chinesesteelmakers
Besides usual parameters like ash, sulphur andphosphorous % content, coal rank/ petrographicsand other specific quality parameters weredeveloped to measure coking properties
Under British (ASTM) classification. the parameterslike VM, CSR, CSN are the main criteria to assesscoking properties and coal rank
Under Russian or Chinese (GOST or GB)classification, the parameters like VM, G and Y arethe main criteria to judge coking properties(see next slide)
9
Source: BHP presentation May 2013
Australian globally recognized coking coal brands
Cok
e st
reng
th a
fter r
eact
ion
(CSR
)
Coal volatile matter (VM % air dried basis)USD/t
250
200
150
100
Platts LV HCC FOBArgus HCC FOBPlatts 64 MV HCC FOBPlatts LV PCI FOBPlatts SSCC FOB
Apr 12 Apr 13Oct 12
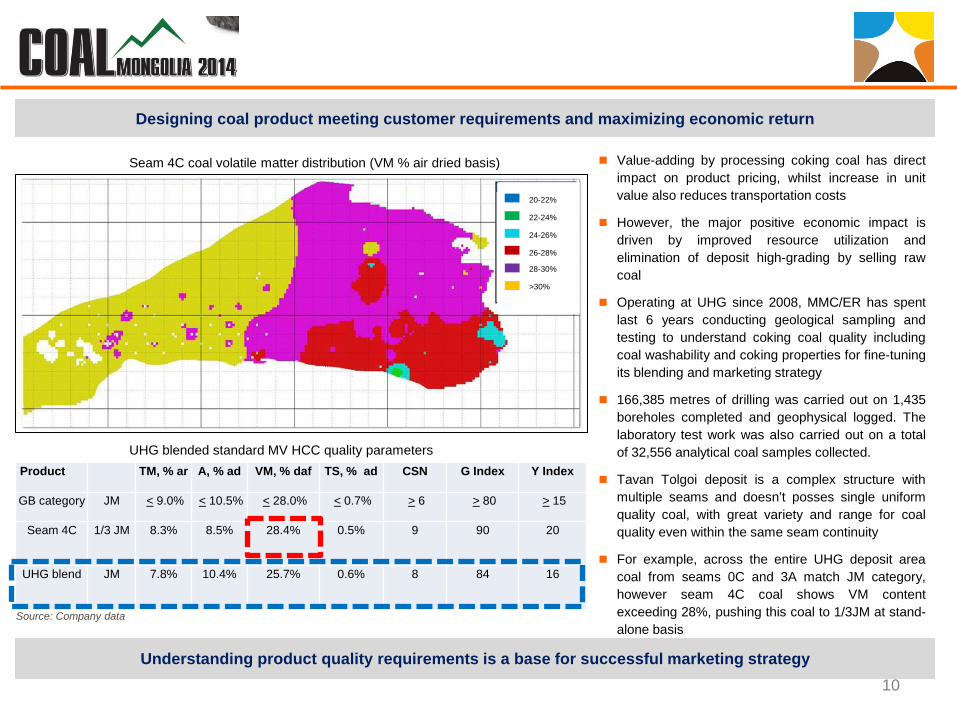
Value-adding by processing coking coal has directimpact on product pricing, whilst increase in unitvalue also reduces transportation costs
However, the major positive economic impact isdriven by improved resource utilization andelimination of deposit high-grading by selling rawcoal
Operating at UHG since 2008, MMC/ER has spentlast 6 years conducting geological sampling andtesting to understand coking coal quality includingcoal washability and coking properties for fine-tuningits blending and marketing strategy
166,385 metres of drilling was carried out on 1,435boreholes completed and geophysical logged. Thelaboratory test work was also carried out on a totalof 32,556 analytical coal samples collected.
Tavan Tolgoi deposit is a complex structure withmultiple seams and doesn’t posses single uniformquality coal, with great variety and range for coalquality even within the same seam continuity
For example, across the entire UHG deposit areacoal from seams 0C and 3A match JM category,however seam 4C coal shows VM contentexceeding 28%, pushing this coal to 1/3JM at stand-alone basis
Understanding product quality requirements is a base for successful marketing strategy10
Source: Company data
Designing coal product meeting customer requirements and maximizing economic return
Seam 4C coal volatile matter distribution (VM % air dried basis)
20-22%
22-24%
24-26%
26-28%
28-30%
>30%
Product TM, % ar A, % ad VM, % daf TS, % ad CSN G Index Y Index
GB category JM < 9.0% < 10.5% < 28.0% < 0.7% > 6 > 80 > 15
Seam 4C 1/3 JM 8.3% 8.5% 28.4% 0.5% 9 90 20
UHG blend JM 7.8% 10.4% 25.7% 0.6% 8 84 16
UHG blended standard MV HCC quality parameters
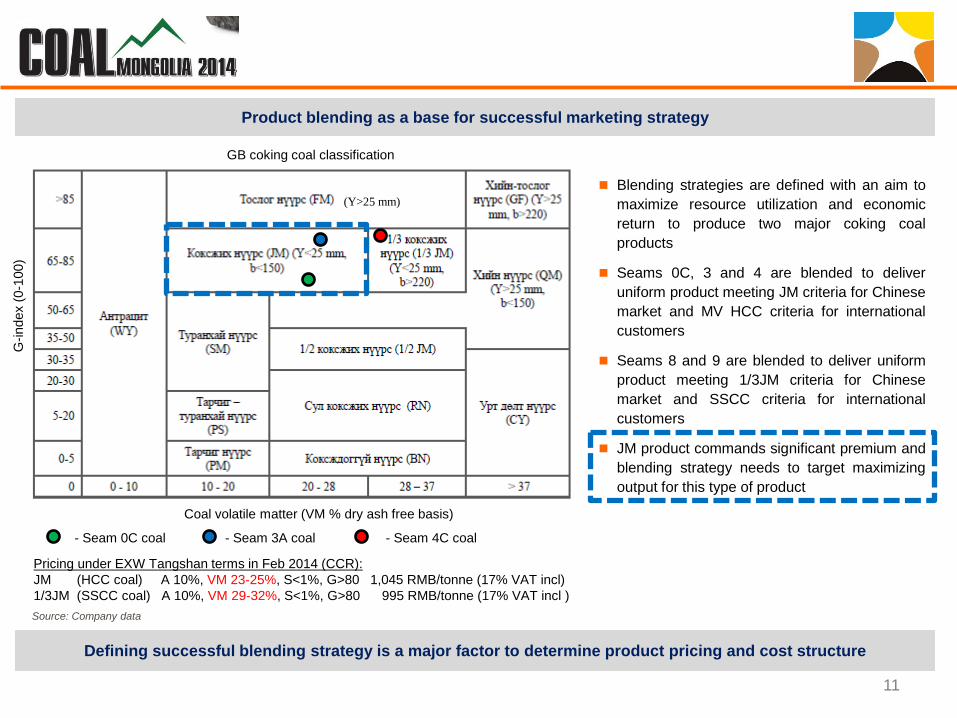
Defining successful blending strategy is a major factor to determine product pricing and cost structure
Blending strategies are defined with an aim tomaximize resource utilization and economicreturn to produce two major coking coalproducts
Seams 0C, 3 and 4 are blended to deliveruniform product meeting JM criteria for Chinesemarket and MV HCC criteria for internationalcustomers
Seams 8 and 9 are blended to deliver uniformproduct meeting 1/3JM criteria for Chinesemarket and SSCC criteria for internationalcustomers
JM product commands significant premium andblending strategy needs to target maximizingoutput for this type of product
11
Source: Company data
Product blending as a base for successful marketing strategy
Pricing under EXW Tangshan terms in Feb 2014 (CCR):JM (HCC coal) A 10%, VM 23‐25%, S<1%, G>80 1,045 RMB/tonne (17% VAT incl)1/3JM (SSCC coal) A 10%, VM 29‐32%, S<1%, G>80 995 RMB/tonne (17% VAT incl )
G-in
dex
(0-1
00)
Coal volatile matter (VM % dry ash free basis)
(Y>25 mm)
- Seam 3A coal- Seam 0C coal - Seam 4C coal
GB coking coal classification
Operational excellence backed by efficient regulatory and policy support
12
Key drivers to improve the competitiveness of Mongolian coking coal
TRANSPORTATION INFRASTRUCTURE SHORT-TERM TARGET FOCUS ON CROSS-BORDER RAILWAY INCLUDING GAINING
ACCESS TO CHINESE RAILWAY NETWORK
MID-TERM TARGET FOCUS ON COMPLETING TT-GS RAILWAY INCLUDING RESOLVINGGAUGE RELATED DECISIONS
NEGOTIATING AND AGREEING TRANSIT ARRANGEMENTS TO ACCESS SEA-PORTS ATBOHAI-RIM INCLUDING UPGRADING OF GASHUUN SUKHAIT TO INTERNATIONAL LAND-PORT
VALUE-ADDED PRODUCTION INCREASE PRICING BY OFFERING PRODUCT WITH CONSISTENT QUALITY MATCHING
INTERNATIONAL BENCHMARK AND CUSTOMERS’ REQUIREMENTS
MAXIMIZE RESOURCE UTILIZATION BY BLENDING DIFFERENT COAL SEAMS TO PRODUCEUNIFORM PRODUCT WITHOUT HIGH-GRADING DEPOSIT
REDUCE TRANSPORTATION COSTS BY INCREASING PRODUCT VALUE
Thank youCentral Tower 16F Sukhbaatar DistrictUlaanbaatar 14200 Mongoliawww.mmc.mn
Top Related