


Languages
Pages
Legal

1
20 October 2015
ASOS plc
Global Online Fashion Destination
Final Results for the year to 31 August 2015
Summary results
£’000
Year to 31 August 2015
Year to 31 August 2014
Change
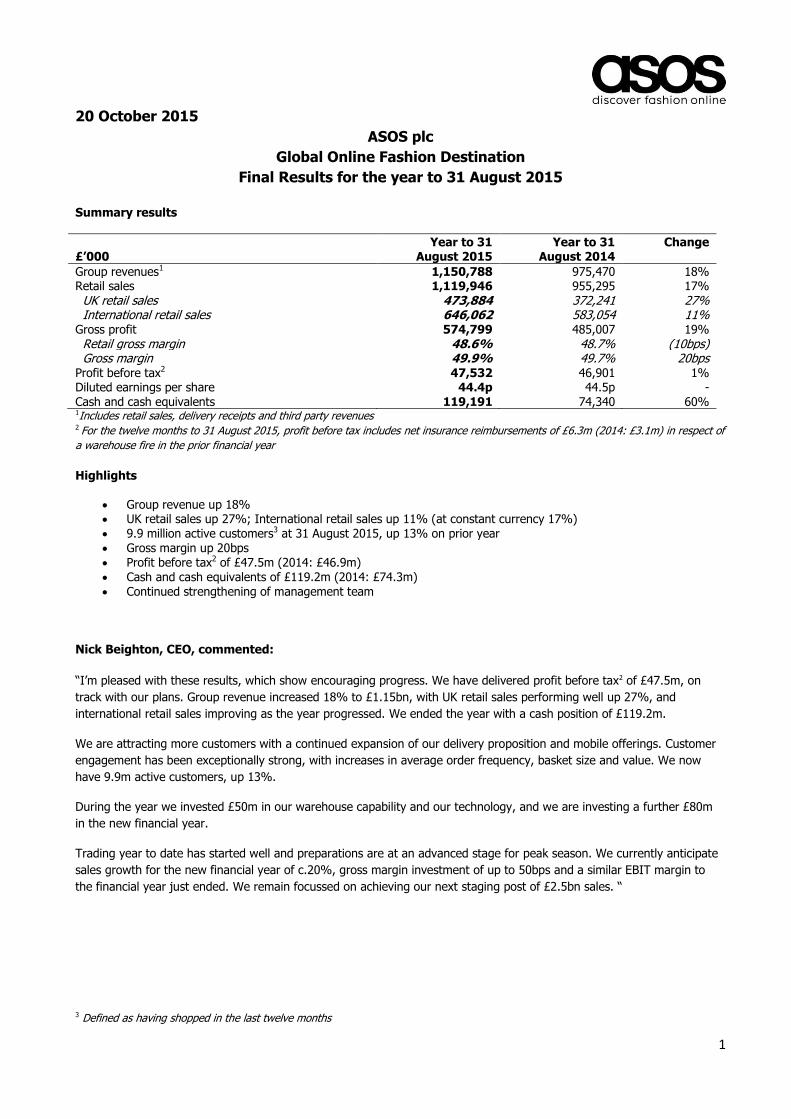
Group revenues1 1,150,788 975,470 18% Retail sales 1,119,946 955,295 17% UK retail sales 473,884 372,241 27% International retail sales 646,062 583,054 11% Gross profit 574,799 485,007 19% Retail gross margin 48.6% 48.7% (10bps) Gross margin 49.9% 49.7% 20bps Profit before tax2 47,532 46,901 1% Diluted earnings per share 44.4p 44.5p - Cash and cash equivalents 119,191 74,340 60% 1Includes retail sales, delivery receipts and third party revenues 2 For the twelve months to 31 August 2015, profit before tax includes net insurance reimbursements of £6.3m (2014: £3.1m) in respect of
a warehouse fire in the prior financial year
Highlights
Group revenue up 18% UK retail sales up 27%; International retail sales up 11% (at constant currency 17%) 9.9 million active customers3 at 31 August 2015, up 13% on prior year Gross margin up 20bps Profit before tax2 of £47.5m (2014: £46.9m) Cash and cash equivalents of £119.2m (2014: £74.3m) Continued strengthening of management team
Nick Beighton, CEO, commented:
“I’m pleased with these results, which show encouraging progress. We have delivered profit before tax2 of £47.5m, on
track with our plans. Group revenue increased 18% to £1.15bn, with UK retail sales performing well up 27%, and
international retail sales improving as the year progressed. We ended the year with a cash position of £119.2m.
We are attracting more customers with a continued expansion of our delivery proposition and mobile offerings. Customer
engagement has been exceptionally strong, with increases in average order frequency, basket size and value. We now
have 9.9m active customers, up 13%.
During the year we invested £50m in our warehouse capability and our technology, and we are investing a further £80m
in the new financial year.
Trading year to date has started well and preparations are at an advanced stage for peak season. We currently anticipate
sales growth for the new financial year of c.20%, gross margin investment of up to 50bps and a similar EBIT margin to
the financial year just ended. We remain focussed on achieving our next staging post of £2.5bn sales. “
3 Defined as having shopped in the last twelve months

2
Investor and Analyst Meeting There will be a meeting for analysts that will take place at 9.30am today, 20 October 2015, at Greater London House,
Hampstead Road, London, NW1 7FB. A webcast of the meeting will be available both live and following the meeting at
www.asosplc.com. Please register your attendance in advance with Instinctif Partners using the details below.
For further information: ASOS plc Nick Beighton, Chief Executive Officer Tel: 020 7756 1000 Helen Ashton, Chief Financial Officer Greg Feehely, Director of Investor Relations Website: www.asosplc.com/investors Instinctif Partners Matthew Smallwood / Justine Warren / Guy Scarborough Tel: 020 7457 2020 JPMorgan Cazenove Michael Wentworth-Stanley / Caroline Thomlinson Tel: 020 7742 4000 Numis Securities
Alex Ham / Luke Bordewich Tel: 020 7260 1000 Background note ASOS is a global fashion destination for 20-somethings. We sell cutting-edge fashion and offer a wide variety of fashion-
related content, making ASOS.com the hub of a thriving fashion community. We sell over 80,000 branded and own-brand
products through localised mobile and web experiences, delivering from our fulfilment centres in the UK, US, Europe and
China to almost every country in the world.
We tailor the mix of own-label, global and local brands sold through each of our nine local language websites: UK, US,
France, Germany, Spain, Italy, Australia, Russia and China.
ASOS’s websites attract 89.8 million visits per month (August 2014: 71.2 million) and as at 31 August 2015 had 9.9 million
active customers1 (31 August 2014: 8.8 million), of which 3.9 million were located in the UK and 6.0 million were located
in our international territories (31 August 2014: 3.4 million in the UK and 5.4 million internationally).
1 Defined as having shopped in the last twelve months
www.asos.com
www.us.asos.com
www.asos.fr
www.asos.de
www.asos.es
www.asos.it
www.asos.com/au
www.asos.com/ru
www.asos.com/cn
m.asos.com
marketplace.asos.com
www.likes.asos.com

3
ASOS plc (“the Company”)
Global Online Fashion Destination
Final Results for the year to 31 August 2015
Business Review
During the year to 31 August 2015 the Group delivered total revenue growth of 18%, comprising retail sales, delivery
receipts and third party revenue. Retail sales grew to £1,119.9m (2014: £955.3m), accelerating as the year progressed,
driven by strong product, delivery proposition enhancements, the successful launch of our zonal pricing capability and
implementation of planned price investments to increase our price competitiveness outside the UK.
Despite these investments, the retail gross profit margin only declined by 10bps driven by a much stronger full price sales
mix reflecting improved customer confidence in our product and prices. This resulted in reduced reliance on promotional
activity. The Group gross margin increased by 20bps following strong growth in delivery receipts of 61% and third party
revenues of 23%.
Profit before tax of £47.5m (2014: £46.9m) remained in line with last year, as we invested further in our customer
proposition, warehousing and people capabilities, offset by the net insurance proceeds of £6.3m (2014: £3.1m) from the
fire at our Barnsley warehouse last year, and a reduced loss in our China operation. The 2015 profit before tax is also
stated after providing for a staff bonus. We enter the new financial year with a cash position of £119.2m (2014: £74.3m)
and an inventory balance of £193.8m (2014: £161.5m).
Our mission remains unchanged: to be the world’s no. 1 fashion destination for 20-somethings. We strive towards this
mission under four strategic pillars: Great fashion, great price - Awesome on mobile - Engaging content and experience -
Best-in-class service, all delivered across the globe.
Great fashion, great price
Our approach to fashion remains consistent: an extensive offer of appropriate product at great value for money for our
global fashion-conscious 20-something customer.
The size of our range continues to grow; we now stock over 80,000 lines at any point in time offering customers a choice
that remains second to none. During the year we have rebalanced our product and buy plan, focussing on tighter
inventory control and improving full price sales.
Where we have grown our range it has been concentrated into new or under-potentialised product categories, as well as
new brands that offer true additional choice to our customers. We carry over 800 brands and during the year have added
some important names to our portfolio, including Abercrombie & Fitch, Hollister, Boohoo, Missguided, Adidas and Reebok.
A key aspect of ASOS is to differentiate ourselves from other market players. We do this by supporting new or little known
brands into the market, such as Rat & Boa, Jen’s Pirate Booty and Hiptico, as well as collaborating on exclusive lines with
those brands that are more widely distributed.
In terms of category expansion, we have continued to extend our offer of ASOS own-brand specialist ranges; Petite, Tall,
Plus and Maternity. As well as broadening our own-brand range, we have added to our third party brands in this area;
many of which are exclusive to ASOS.
Within our own-brand, we aim to cater for all occasions and have added a wider range of smart going out and workwear
in menswear, as well as the successful launch of exclusive ASOS Red Carpet and ASOS Bridesmaid dress ranges in
womenswear. We have offered specific own-brand ranges for increasingly important seasonal events such as Halloween
and Valentine’s, and broadened our selection in beauty, men’s grooming, novelty gifts and loungewear during the year.
Offering great value for money is a critical aspect of our proposition. The launch of our zonal pricing capability early in the
financial year enabled us to price brands in line with local markets. To date we have implemented this on 113 brands
across Australia, the US, France, Germany, Italy and Spain, and have seen an encouraging response from customers and
volume uplifts as a result. We will continue to release more brands using this functionality to further enhance our global
price positioning during the new financial year.

4
Awesome on mobile
Mobile is now a huge part of our business; we have seen 5.4m downloads of our mobile apps in the last twelve months. In
August 2015, nearly 60% of our traffic came from mobile devices and 44% of orders were placed on our mobile platforms.
We launched localised versions of our Android and iOS apps in France, Germany, Italy, Spain and Russia early in the year,
and in September 2015 launched a localised app in China to support our current website offer in this territory. We also
launched a ‘New In’ app in the UK and Denmark, an Apple Watch app and a new mobile news website, ‘ASOS Likes’, which
provides customers with daily inspiration, pop culture and lifestyle news. In addition, we ran our first ever mobile-only
promotions with encouraging customer take-up.
We undertook a review of our new checkout function during the second half of the year, refocusing this project on key
mobile requirements and expect to roll out this functionality on mobile apps during the next six months. We also expect to
launch updated versions of our iOS apps during the new financial year.
All of these combined keep us at the forefront of where our customers are, how they consume media and how they shop.
Engaging content and experience
Our customer engagement remains strong, with growth in average order frequency and average basket size. We finished
the year with 9.9m active customers, an increase of 13% over last year.
We now have over 12m followers across all our social channels and we publish over 2,000 pieces of inspiring fashion and
entertaining lifestyle content every month to maintain awareness and build brand engagement. In the last six months we
have launched local language French and German YouTube and Instagram accounts. We have also introduced ‘ASOS
stylists’ in these markets to inspire and help our customers via individual social accounts. The collective following of our
stylists globally now exceeds 850,000 of our customers.
During the year we also introduced our ‘social sign-in’ functionality; simplifying our customer’s journey from browsing to
buying product, as well as personalised product recommendations on apps and extended our upgraded search facility to
all our international websites.
Following a successful trial, we will launch our new ASOS Rewards loyalty scheme during the next six months, initially for
our UK customers. This rewards programme allows customers to build up points on purchases, which become convertible
into vouchers for use on our platforms. In addition to this, customers will unlock a wide variety of other rewards such as
birthday discounts, free next day deliveries and exclusive content.
Uptake of our Premier Delivery membership in the UK, US, France, Germany and Australia continues to grow, with total
members up 63% compared to last year.
Best-in-class service
Delivery and returns
Improving and expanding our delivery and returns solutions remain central to our business and we continue working
towards our goal of providing a best-in-class customer proposition.
In the UK we extended next-day delivery and Saturday evening next-day delivery cut-offs to midnight and our Sunday
next-day delivery cut-off from 2pm to 5pm. Our standard delivery also now operates seven days a week. Internationally,
we now operate next-day delivery services in France, Germany, Spain, Italy, Denmark, Sweden, the Netherlands, Belgium,
Ireland and Northern Ireland. We have also introduced express delivery options in more than 20 smaller territories and
offer mid-tier services in Korea, Singapore and Hong Kong, with further territories to follow.
We have also further extended customer return options during the year. In the UK we launched returns via Doddle stores
and Hermes Parcel shops, home collection returns and InPost LockerBoxes, as well as introducing one-hour next-day
collection slots in large cities. Internationally, we introduced labelless returns in France, the Netherlands, Belgium and
Luxembourg and launched free returns trials in both the Netherlands and Italy.
5
We continue to focus on developing our Pick-Up-Drop-Off (‘PUDO’) network, which allows customers to collect and return
orders from a variety of convenient locations. In the UK, customers have over 5,500 deliver-to-store locations and we
recently extended our click-and-collect trial with Boots into more than 30 stores, with plans to enter an additional 70
stores over the next year. Customers in France, Spain, Belgium and Luxembourg now benefit from a delivery-to-store
option at over 12,500 locations and we will launch this service in Germany during the new financial year. We continue to
seek further PUDO solutions in all our key strategic territories, and expect to offer this service in Italy and the US during
the next 12-18 months.
Customer Care
We believe offering the most personal experience possible to customers is paramount for building brand loyalty, and with
this in mind, we extended our local language customer care capabilities to provide 24/7 operations to our French, German,
Spanish, Italian and Russian customers. We now have customer care sites in the UK (Hemel Hempstead, Gateshead,
Glasgow and Camden), Lisbon and Vladimir. In addition to our existing channels of email, social and telephony, we added
live chat to all our websites. We also improved our email response times to one hour, as well as responding to all social
media communications made by our customers within 15 minutes, and all live chat or telephony within 30 seconds. We
will continue working to improve these going forward.
Logistics
Investment in our international warehouse infrastructure has continued during the year as we build capacity ahead of our
next staging post of £2.5bn sales.
UK
Our Barnsley warehouse efficiency improved as the year progressed following the successful launch of our mechanised
picking solution at the start of the year. We also exited our off-site storage facility at Lister Hills in February following
completion of our two high bay mini-loads. These now store all our bulk stock at Barnsley and, with our new warehouse
control system, automatically retrieve and maintain stock levels in the main pick-face area of the warehouse, increasing
our stock management capabilities. We also increased capacity at our returns processing centre in Selby during the year.
During the second half of the year we commenced work on building an additional mezzanine level in our Barnsley
warehouse to extend storage capacity by a further 1m units. In addition, we are adding another sorter to our mechanised
picking solution as well as extending our despatch sorter chutes; both of which will further increase our warehouse
throughput. These projects, along with installing air cooling throughout the warehouse, are expected to be completed by
the end of the new financial year.
International
We have also continued the ramp up of our German Eurohub operation and exited the year holding over 2m units of stock
and despatching 38% of total EU orders, ahead of where we expected to be at this stage. This has allowed us to make
improvements to our Eurozone delivery proposition and we will seek further opportunities to improve this during the next
twelve months. Our returns processing centre in Swiebodzin now processes nearly all returns from the Eurozone,
improving refund processing times and costs to return.
We will now commence work on building our new Eurohub warehouse, close to our existing site. This new warehouse,
along with automation technology, will eventually provide us with total capacity of 20m units and represents an extensive
project for us over the next four years, with expected total capital expenditure of c.£60m over this period. Over the next
twelve months we intend to invest £20m fitting out the warehouse infrastructure for a manual picking operation, and by
early 2017 expect to accommodate 10m units. We will then be able to move out of our existing Eurohub operation into
this new warehouse. Over subsequent years we will further extend, in a modular fashion, to accommodate automated
picking and despatch, as well as automated mini-loads.
Our warehouse in the US consistently fulfils over 25% of US orders and we will turn focus back to US fulfilment once we
have unlocked the potential of our Eurohub warehouse, in order to further drive local fulfilment in this territory.
6
Where we operate We are investing in our UK customer, continuously offering new, relevant product and working to ensure shopping with
ASOS is an easy, seamless process. Following a period of adverse exchange rate movements, our principal international
objective during the year has been to restore our price competitiveness.
Early on in the financial year, we implemented planned price investments for our Australian and Eurozone customers to
begin to restore the competitiveness of our international offer and we remain committed to further investments as
necessary during the new financial year. We are focussing our efforts on key European countries, particularly France and
Germany, as these represent substantial opportunities to us as we unlock the full potential of our Eurohub warehouse.
We rolled out our zonal pricing capability across all our local platforms, except Russia. This allows us to sell brands which
were previously restricted in certain territories and enabled us to start offering more competitive local pricing and country-
specific promotions. We used this tool to reduce the price of our own-label products in Spain late in the financial year to
align more closely to local competition and we will continue to improve and enhance our international product offering
using this tool over the coming years.
We have also extended the duration and depth of our foreign currency hedging activities. In addition to this, we
commenced the process of increasing our direct sourcing settled in Euros and US Dollars this financial year with an
ultimate long term aim of maximising the natural foreign exchange hedge available to us. As part of our global fulfilment
programme, we are working to restructure our supply chain to allow for direct sourcing into our international warehouses.
We incurred a loss of £5.2m (2014: £8.6m) in our China operation. During the year we invested in our local website to
extend its capabilities with upgraded search functionality and added the ability to run complex promotions. Over the next
twelve months we will double the number of product lines available on our website and mobile app in this territory.
People
During the year, Group headcount increased by 12% to 2,038 employees at 31 August 2015 (2014: 1,813) following
planned investments, predominantly within our IT and Retail teams. In addition, the Board has made a number of
appointments, strengthening the senior management team of the Group.
At the start of September the founder of the Company, Nick Robertson, stood down as Chief Executive Officer after 15
years in the role and Nick Beighton was appointed as successor. Nick Beighton joined ASOS in April of 2009 as Chief
Financial Officer and has since worked closely with Nick Robertson. In October last year, Nick Beighton was appointed
Chief Operating Officer, widening his management responsibilities beyond finance. Nick Robertson will remain with ASOS
as a Non-Executive Director.
We also welcomed Helen Ashton to the main Board of the Company as Chief Financial Officer in September. Helen has
held a wide variety of senior management positions at Barclaycard, Lloyds Banking Group and most recently, debt
management business Capquest. She has also held roles at ASDA Group and at GUS, amongst other companies, bringing
strong financial experience and a proven track record in consumer-facing and retail businesses.
To further strengthen the Executive team, we were joined by our new People Director, Peter Collyer, in March and our
new Chief Information Officer, Clifford Cohen, in May.
Technology
During the year, we continued with our modular approach to the re-platforming of our legacy systems, enabling us to
provide the necessary flexibility and scalability for the future. A particular focus of our IT investment remains enhancing
our customer experience.
We have also scoped out our medium term key global fulfilment programme requirements, focussing initially on a new
end-to-end retail merchandising system, which will optimise our global stock management capabilities alongside our
European and US warehouse expansions over the coming years.

7
Financial review
Revenue
Year to 31 August 2015
Group International £’000 total UK US EU RoW total
Retail sales 1,119,946 473,884 119,530 293,983 232,549 646,062 Growth 17% 27% 29% 15% (1%) 11% Growth at constant exchange rate 21% 27% 22% 26% 6% 17% Delivery receipts 25,667 11,496 3,660 5,085 5,426 14,171 Growth 61% 55% 106% 61% 51% 66% Third party revenues 5,175 4,403 755 17 - 772 Growth 23% 4% 100% 100% - 100% Total revenues 1,150,788 489,783 123,945 299,085 237,975 661,005 Growth 18% 28% 32% 15% - 12%
The Group generated retail sales growth of 17% during the year, driven by continued strong growth in the UK of 27%.
Our international sales growth of 11% (constant currency growth 17%) accelerated as the year progressed, as our price
investments started to restore our competitiveness overseas. International retail sales accounted for 58% of total retail
sales (2014: 61%).
In the UK, retail sales growth of 27% was driven by great product, introduction of new relevant brands, continuous
improvements to our market-leading proposition and further engagement with customers via social media channels. We
retained our first place position for unique visitors to apparel retailers in the 15-34 age range (Comscore, August 2015).
US retail sales have grown by 29% (constant currency growth 22%) following further expansion of our range of locally
relevant brands and continued strong full price sales mix.
EU retail sales, despite being impacted by adverse currency movements and economic uncertainties during the year, have
grown by 15% (constant currency growth 26%). This growth was underpinned by our price investments early on in the
year, which have been further supported by improvements to our delivery proposition in key European countries as we
have built out our Eurohub capabilities.
Our Rest of World segment continued to be affected by adverse currency movements with reported retail sales down 1%
compared to last year, but sales were up 6% on a constant currency basis. We invested in prices in Australia at the start
of the year and this was initially well received but further weakening of the Australian dollar eroded some of the progress
made; we comfortably retained our first place Comscore position in Australia. Sales in Russia have continued to suffer due
to macro-economic factors and adverse exchange rates. In China, we continue to focus on increasing our brand awareness
and market share.
Delivery receipts increased by 61% driven by the introduction of global minimum free-delivery spend thresholds in late
2014 and a wider range of paid delivery options being made available to customers.
Third party revenues, which mainly comprise advertising revenues from the website and the ASOS magazine, increased by
23% as we introduced campaigns on some of our international websites for the first time.
8
Customer engagement
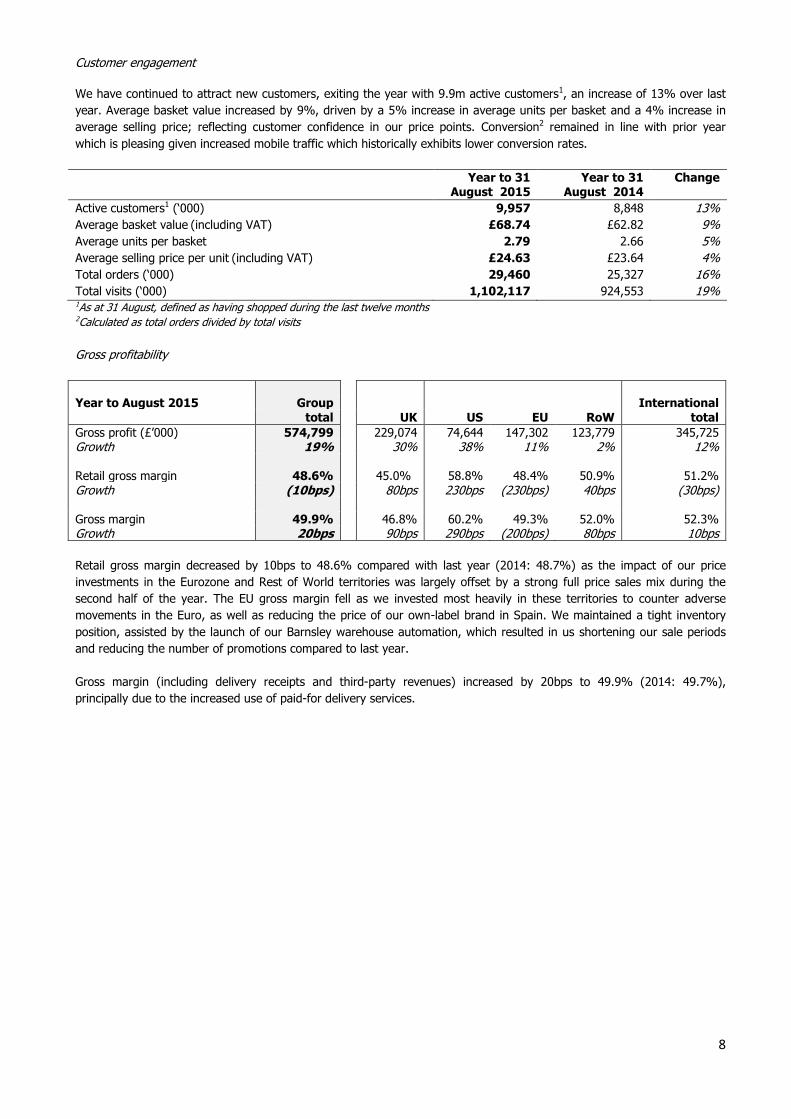
We have continued to attract new customers, exiting the year with 9.9m active customers1, an increase of 13% over last
year. Average basket value increased by 9%, driven by a 5% increase in average units per basket and a 4% increase in
average selling price; reflecting customer confidence in our price points. Conversion2 remained in line with prior year
which is pleasing given increased mobile traffic which historically exhibits lower conversion rates.
Year to 31 August 2015
Year to 31 August 2014
Change
Active customers1 (‘000) 9,957 8,848 13%
Average basket value (including VAT) £68.74 £62.82 9%
Average units per basket 2.79 2.66 5%
Average selling price per unit (including VAT) £24.63 £23.64 4%
Total orders (‘000) 29,460 25,327 16%
Total visits (‘000) 1,102,117 924,553 19% 1As at 31 August, defined as having shopped during the last twelve months 2Calculated as total orders divided by total visits
Gross profitability
Year to August 2015
Group International total UK US EU RoW total
Gross profit (£’000) 574,799 229,074 74,644 147,302 123,779 345,725 Growth 19% 30% 38% 11% 2% 12% Retail gross margin 48.6% 45.0% 58.8% 48.4% 50.9% 51.2% Growth (10bps) 80bps 230bps (230bps) 40bps (30bps) Gross margin 49.9% 46.8% 60.2% 49.3% 52.0% 52.3% Growth 20bps 90bps 290bps (200bps) 80bps 10bps
Retail gross margin decreased by 10bps to 48.6% compared with last year (2014: 48.7%) as the impact of our price
investments in the Eurozone and Rest of World territories was largely offset by a strong full price sales mix during the
second half of the year. The EU gross margin fell as we invested most heavily in these territories to counter adverse
movements in the Euro, as well as reducing the price of our own-label brand in Spain. We maintained a tight inventory
position, assisted by the launch of our Barnsley warehouse automation, which resulted in us shortening our sale periods
and reducing the number of promotions compared to last year.
Gross margin (including delivery receipts and third-party revenues) increased by 20bps to 49.9% (2014: 49.7%),
principally due to the increased use of paid-for delivery services.

9
Operating expenses
The Group increased its investment in operating resources by 21% to £533.8m during the year, with increased spend in
our distribution, warehousing and people costs. Total operating costs to sales ratio increased by 110bps over the same
period.
£’000 Year to 31
August 2015 Year to 31
August 20141 Change Distribution costs (168,681) (147,303) (15%) Payroll and staff costs (107,351) (82,074) (31%) Warehousing (97,820) (75,756) (29%) Marketing (57,074) (56,007) (2%) Production (4,935) (4,723) (4%) Technology costs (19,708) (15,136) (30%) Other operating costs (55,215) (45,051) (23%) Depreciation and amortisation (23,054) (15,361) (50%) Total operating costs (533,838) (441,411) (21%) Operating cost ratio (% of sales) 46.4% 45.3% (110bps) 1Costs for the year to 31 August 2014 exclude incremental costs incurred as a result of the Barnsley fire; these have been netted against
the related insurance reimbursements in a separate line item titled ‘net other income’.
Distribution costs increased by 15% during the year but decreased as a percentage of sales by 40bps to 14.7% as
proposition improvement costs, such as free returns for both the Netherlands and Italy, were offset by negotiation of more
favourable rates with a number of carriers.
Staff costs increased by 90bps to 9.3% of sales due to headcount increases and achievement of the Company bonus,
which was not paid in the previous financial year.
Warehousing costs increased by 70bps to 8.5% of sales across the full year. During the first half of the year, warehousing
costs represented 9.1% of sales due to dual running costs from Lister Hills and one-off short-term additional running costs
at our Barnsley warehouse following the launch of our automation technology. However, during the second half of the
year, warehousing costs fell to 8.0% of sales, despite increased investment in our European warehousing infrastructure.
We expect to see further leveraging of these costs during the new financial year to 31 August 2016 as efficiencies from
our Barnsley automation annualise.
Marketing costs have decreased by 70bps to 5.0% of sales as spend on international marketing campaigns was reduced
during the year whilst we focused on restoring the price competitiveness of our products. We did run a local campaign in
France, where our price investments have been particularly well received and delivery proposition improvements are
driving sales.
IT costs increased by 10bps to 1.7% of sales as a result of increased traffic across our expanded range of global platforms
and increased spend on maintenance to support these.
Other operating costs have increased by 20bps to 4.8% of sales following a one-off £4.9m write-off of some IT projects
following the refocus of our checkout project towards mobile optimisation.
Depreciation has increased by 40bps to 2.0% of sales following last year’s accelerated investment in our warehouse and
IT infrastructure, particularly in our mechanised picking solution.
Costs incurred by our China operation, related largely to warehousing and staff costs, are included in the above.

10
Net other income We received final business interruption insurance reimbursements during the first half of the year of £6.3m as a result of a
fire in our Barnsley warehouse in June 2014. This amount is included within a separate line item titled ‘net other income’
in the Income Statement.
Year to 31 Year to 31
£’000 August 2015 August 2014
Stock loss and other incremental costs - (8,486)
Insurance reimbursements 6,299 11,536
Total 6,299 3,050
Income statement
The Group generated profit before tax of £47.5m, marginally ahead of prior year (2014: £46.9m), due to maintaining our
gross profit margin despite international price investments, offset by additional operating expenses related to our
warehousing infrastructure, delivery proposition and people costs.
£’000 Year to 31
August 2015 Year to 31
August 2014 Change Revenue 1,150,788 975,470 18% Cost of sales (575,989) (490,463) Gross profit 574,799 485,007 19% Distribution expenses (168,681) (147,303) (15%) Administrative expenses (365,157) (294,108) (24%) Net other income 6,299 3,050 Operating profit 47,260 46,646 1% Net finance income 272 255 Profit before tax 47,532 46,901 1% Income tax expense (10,680) (10,313) Profit after tax 36,852 36,588 1%
Taxation
The effective tax rate increased by 50bps to 22.5% (2014: 22.0%). Last year’s effective tax rate was reduced by the one-
off reversal of permanently disallowable charges in respect of the ASOS Long-Term Incentive Plan which has not been
repeated. The current year increase as a result of this was offset in part by a reduction in the prevailing rate of UK
corporation tax rate in 2015. Going forward, we expect the effective tax rate to be approximately 100bps higher than the
prevailing rate of UK corporation tax due to permanently disallowable items.
Earnings per share
Basic earnings per share of 44.4p (2014: 44.6p) and diluted earnings per share of 44.4p (2014: 44.5p) remained in line
with last year.

11
Statement of financial position
The Group continues to enjoy a robust financial position including a cash balance of £119.2m (2014: £74.3m). Net assets
increased by £44.3m to £237.3m during the year (2014: £193.0m), driven principally by the Group’s profit after tax.
The Group’s inventory balance increased by £32.3m to £193.8m (2014: £161.5m), partly due to the increased size of our
operations but also as a result of a number of our suppliers changing to ‘free on board’ terms. This reduces our supplier
costs and allows us to manage our shipping costs and associated foreign exchange risk internally. This resulted in £14.8m
inventory-in-transit over the year end being recognised within Group inventory at 31 August 2015 (2014: nil). The
summary statement of financial position is shown below.
£’000
At 31 August
2015
At 31 August
2014
Goodwill and other intangible assets 76,164 63,901
Property, plant and equipment 64,379 55,400
Derivative financial assets 256 -
Non-current assets 140,799 119,301
Stock 193,769 161,480
Net current payables (214,487) (165,154)
Cash and cash equivalents 119,191 74,340
Derivative financial assets 6,083 2,240
Current tax (liability)/asset (3,600) 2,217
Deferred tax liability (4,440) (1,393)
Net assets 237,315 193,031
Statement of cash flows The Group’s cash balance increased by £44.9m to £119.2m (2014: £74.3m) as working capital improvements, particularly
timing in creditor’s payments, ensured capital expenditure of £50.4m on our warehousing and technology infrastructure
was exceeded by the cash inflow from operating activities. The summary statement of cash flows is shown below.
£’000 Year to 31
August 2015 Year to 31
August 2014
Operating profit 47,260 46,646
Depreciation and amortisation 23,054 15,361
Losses on disposal of assets 4,893 150
Working capital 17,804 13,326
Share-based payments charge/(credit) 2,245 (2,813)
Other non-cash items 637 (297)
Tax paid (2,837) (3,714)
Cash inflow from operating activities 93,056 68,659
Capital expenditure (50,396) (62,377)
Proceeds from issue of ordinary shares - 563
Net cash inflow/(outflow) relating to Employee Benefit Trust 912 (3,914)
Acquisition of subsidiary - 182
Net finance income received 252 231
Total cash inflow 43,824 3,344
Opening cash and cash equivalents 74,340 71,139
Effect of exchange rates on cash and cash equivalents 1,027 (143)
Closing cash and cash equivalents 119,191 74,340
Cash generated from operating activities increased by £24.4m, due principally to EBITDA improvements of £8.3m, working
capital improvements of £4.5m and a £5.1m movement in share-based payments charge, as the one-off ALTIP credit was
not repeated in the current year.
We renewed our credit facility for a further three years to October 2018, although the Group had no bank borrowings at
any point during the current or prior financial year.

12
Fixed asset additions
£’000 Year to August
2015 Year to August
2014
IT 33,665 31,317
Office fixtures and fit-out 1,146 1,218
Warehouse 14,649 32,066
Total 49,460 64,601
We continue to invest in our warehousing and IT infrastructure to support our next staging post of £2.5bn sales. The
majority of our warehousing spend related to our automation technology at Barnsley while our IT spend continued to
focus on our modular approach to re-platforming our legacy systems and IT enhancements for our customer experience.
We plan to invest £80m during the new financial year, increasing our previous guidance by an additional £20m. This
acceleration is principally due to the commencement of building our new Eurohub site.
Outlook
We have started the new financial year well and preparations are at an advanced stage for peak season. We intend to
make further investments in our prices where required during the year, as well as continuing to invest in our global
logistics infrastructure and technology.
We currently anticipate sales growth for the new financial year of c.20%, gross margin investment of up to 50bps and a
similar EBIT margin to the financial year just ended.
Nick Beighton Helen Ashton
Chief Executive Officer Chief Financial Officer

13
CONSOLIDATED STATEMENT OF TOTAL COMPREHENSIVE INCOME For the year to 31 August 2015
Year to 31 August 2015
Year to 31 August 2014
£’000 £’000 Revenue 1,150,788 975,470 Cost of sales (575,989) (490,463)
Gross profit 574,799 485,007 Distribution expenses (168,681) (147,303) Administrative expenses (365,157) (294,108)
Warehouse fire: stock loss and other incremental costs - (8,486) Warehouse fire: insurance reimbursements 6,299 11,536 Net other income 6,299 3,050
Operating profit 47,260 46,646 Finance income 353 312 Finance expense (81) (57)
Profit before tax 47,532 46,901 Income tax expense (10,680) (10,313)
Profit for the period 36,852 36,588
Net translation movements offset in reserves (83) (176)
Net fair value gain on derivative financial assets 4,099 2,015
Other comprehensive income for the period1 4,016 1,839
Total comprehensive income 40,868 38,427
Profit/(loss) attributable to: Owners of the parent company 36,866 36,950
Non-controlling interest (14) (362)
36,852 36,588
Total comprehensive income/(loss) attributable to:
Owners of the parent 40,882 38,789
Non-controlling interest (14) (362)
40,868 38,427
Earnings per share
Basic 44.4p 44.6p
Diluted 44.4p 44.5p
1 All items of other comprehensive income may subsequently be reclassified to profit or loss.

14
CONSOLIDATED STATEMENT OF CHANGES IN EQUITY For the year to 31 August 2015
Called up share capital
Share premium
Retained earnings1
Employee Benefit
Trust reserve
Hedging reserve
Translation reserve
Equity attributable
to owners of the parent
Non-
controlling interest
Total equity
£’000 £’000 £’000 £’000 £’000 £’000 £’000 £’000 £’000
At 1 September 2013 2,890 6,368 152,133 (1,770) 225 (45) 159,801 (2) 159,799
Profit/(loss) for the period - - 36,950 - - - 36,950 (362) 36,588
Other comprehensive income/(loss) for the period - - - - 2,015 (176) 1,839 - 1,839
Total comprehensive
income/(loss) for the period - - 36,950 - 2,015 (176) 38,789 (362) 38,427
Shares allotted in the year 30 533 - - - - 563 - 563
Net purchase of shares
by Employee Benefit Trust - - - (3,914) - - (3,914) - (3,914) Transfer of shares from Employee Benefit Trust on
exercise - - (354) 354 - - - - -
Share-based payments credit - - (2,813) - - - (2,813) - (2,813)
Acquisition of subsidiary - - - - - - - (42) (42)
Deferred tax on share options - - (8,730) - - - (8,730) - (8,730)
Current tax on items taken
directly to equity - - 9,741 - - - 9,741 - 9,741
Balance as at 31 August 2014 2,920 6,901 186,927 (5,330) 2,240 (221) 193,437 (406) 193,031
Called up
share capital
Share
premium
Retained
earnings1
Employee Benefit
Trust
reserve
Hedging
reserve
Translation
reserve
Equity attributable
to owners of
the parent
Non-controlling
interest
Total
equity
£’000 £’000 £’000 £’000 £’000 £’000 £’000 £’000 £’000
At 1 September 2014 2,920 6,901 186,927 (5,330) 2,240 (221) 193,437 (406) 193,031
Profit/(loss) for the period - - 36,866 - - - 36,866 (14) 36,852 Other comprehensive income/(loss) for the period - - - - 4,099 (83) 4,016 - 4,016
Total comprehensive
income/(loss) for the period - - 36,866 - 4,099 (83) 40,882 (14) 40,868
Net cash received on exercise of shares from Employee
Benefit Trust - - - 912 - - 912 - 912
Transfer of shares from
Employee Benefit Trust on exercise - - (780) 780 - - - - -
Share-based payments charge - - 3,530 - - - 3,530 - 3,530
Acquisition of non-controlling interest in Covetique Ltd - - (394) - - - (394) 394 -
Deferred tax on share options - - (1,323) - - - (1,323) - (1,323)
Current tax on items taken
directly to equity - - 297 - - - 297 - 297
Balance as at 31 August 2015 2,920 6,901 225,123 (3,638) 6,339 (304) 237,341 (26) 237,315
1Retained earnings includes the share-based payments reserve
15
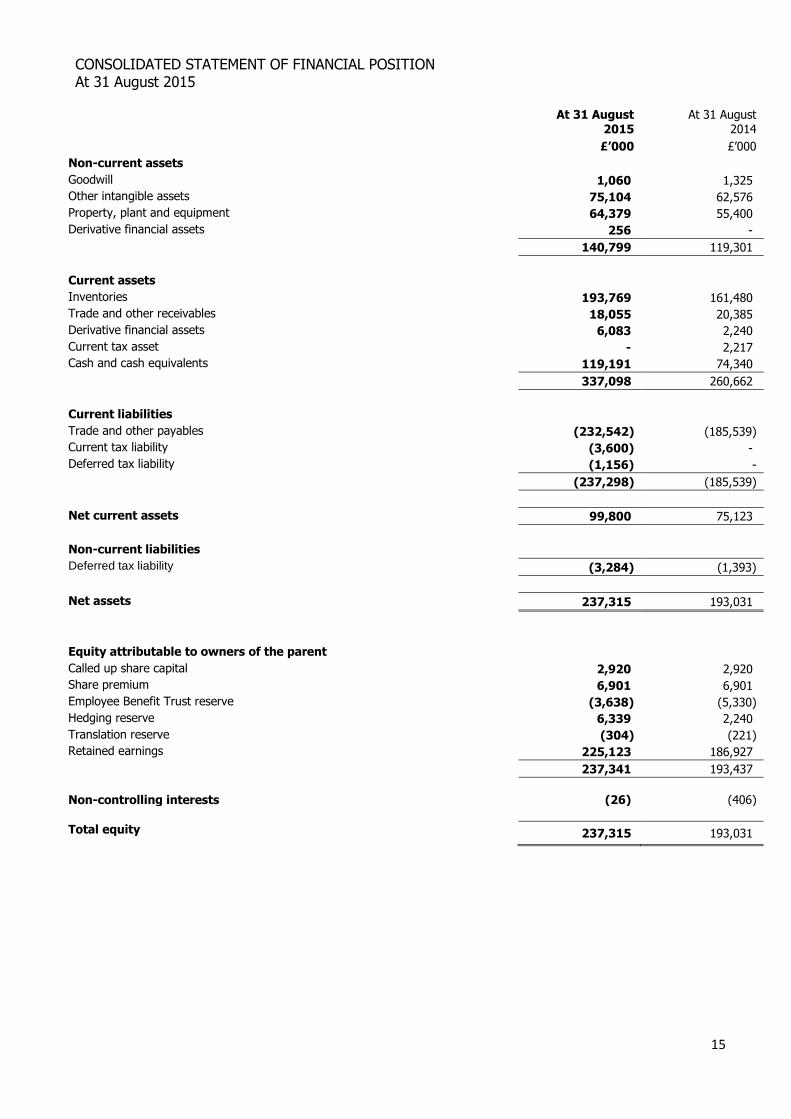
CONSOLIDATED STATEMENT OF FINANCIAL POSITION At 31 August 2015
At 31 August
2015
At 31 August
2014
£’000 £’000
Non-current assets
Goodwill 1,060 1,325
Other intangible assets 75,104 62,576
Property, plant and equipment 64,379 55,400
Derivative financial assets 256 -
140,799 119,301
Current assets
Inventories 193,769 161,480
Trade and other receivables 18,055 20,385
Derivative financial assets 6,083 2,240
Current tax asset - 2,217
Cash and cash equivalents 119,191 74,340
337,098 260,662
Current liabilities
Trade and other payables (232,542) (185,539)
Current tax liability (3,600) -
Deferred tax liability (1,156) -
(237,298) (185,539)
Net current assets 99,800 75,123
Non-current liabilities
Deferred tax liability (3,284) (1,393)
Net assets 237,315 193,031
Equity attributable to owners of the parent
Called up share capital 2,920 2,920
Share premium 6,901 6,901
Employee Benefit Trust reserve (3,638) (5,330)
Hedging reserve 6,339 2,240
Translation reserve (304) (221)
Retained earnings 225,123 186,927
237,341 193,437
Non-controlling interests (26) (406)
Total equity 237,315 193,031

16
CONSOLIDATED STATEMENT OF CASH FLOWS For the year to 31 August 2015
Year to 31 August 2015
Year to 31 August 2014
£’000 £’000
Operating profit 47,260 46,646
Adjusted for:
Depreciation of property, plant and equipment 8,294 5,860 Amortisation of other intangible assets 14,760 9,501 Loss on disposal of non-current assets 4,893 150 Increase in inventories (32,111) (18,352) Decrease/(increase) in trade and other receivables 2,300 (1,844) Increase in trade and other payables 47,615 33,522 Share-based payments charge/(credit) 2,245 (2,813) Other non-cash items 637 (297) Income tax paid (2,837) (3,714)
Net cash generated from operating activities 93,056 68,659 Investing activities Payments to acquire other intangible assets (32,470) (32,627) Payments to acquire property, plant and equipment (17,926) (29,750) Finance income 339 296 Acquisition of subsidiary, net of cash acquired - 182
Net cash used in investing activities (50,057) (61,899) Financing activities
Proceeds from issue of ordinary shares - 563
Net cash inflow/(outflow) relating to Employee Benefit Trust 912 (3,914)
Finance expense (87) (65)
Net cash generated/(used in) from financing activities 825 (3,416)
Net increase in cash and cash equivalents 43,824 3,344
Opening cash and cash equivalents 74,340 71,139
Effect of exchange rates on cash and cash equivalents 1,027 (143)
Closing cash and cash equivalents 119,191 74,340
17
NOTES TO THE FINANCIAL INFORMATION For the year to 31 August 2015 1. Preparation of the audited condensed consolidated financial information
a) Basis of preparation
The condensed consolidated financial information for the year to 31 August 2015 has been prepared in accordance with
the recognition and measurement criteria of International Financial Reporting Standards (“IFRS”) as adopted for use in the
European Union and with those parts of the Companies Act 2006 applicable to companies reporting under IFRS. The
accounting policies applied are consistent with those set out in the ASOS Plc Annual Report and Accounts for the year
ended 31 August 2014.
The financial information contained within this preliminary announcement for the years to 31 August 2015 and 31 August
2014 does not comprise statutory financial statements within the meaning of section 434 of the Companies Act 2006.
Statutory accounts for the year to 31 August 2014 have been filed with the Registrar of Companies and those for the year
to 31 August 2015 will be filed following the Company’s annual general meeting. The auditors’ report on the statutory
accounts for each of the years to 31 August 2015 and 31 August 2014 is unqualified, does not draw attention to any
matters by way of emphasis, and does not contain any statement under section 498 of the Companies Act 2006.
Going concern
The Directors have reviewed current performance and forecasts, combined with expenditure commitments, including
capital expenditure. After making enquiries, the Directors have a reasonable expectation that the Group has adequate
financial resources to continue its current operations, including contractual and commercial commitments for the
foreseeable future. For this reason, they have continued to adopt the going concern basis in preparing the financial
statements.
In preparing the preliminary announcement, the Directors have also made reasonable and prudent judgements and
estimates and prepared the preliminary announcement on the going concern basis. The preliminary announcement and
management report contained herein give a true and fair view of the assets, liabilities, financial position and profit and loss
of the Group.
Changes to accounting standards
There have been no changes to accounting standards during the year which have had or are expected to have any
significant impact on the Group.
18
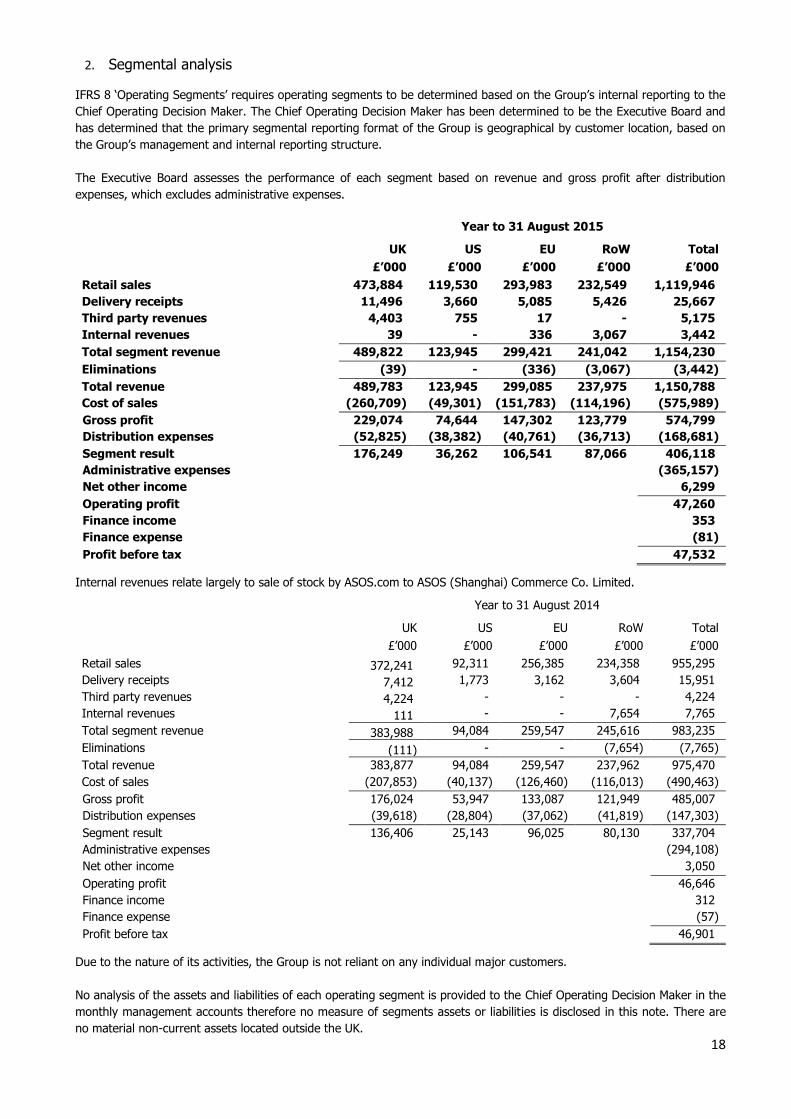
2. Segmental analysis
IFRS 8 ‘Operating Segments’ requires operating segments to be determined based on the Group’s internal reporting to the
Chief Operating Decision Maker. The Chief Operating Decision Maker has been determined to be the Executive Board and
has determined that the primary segmental reporting format of the Group is geographical by customer location, based on
the Group’s management and internal reporting structure.
The Executive Board assesses the performance of each segment based on revenue and gross profit after distribution
expenses, which excludes administrative expenses.
Year to 31 August 2015
UK US EU RoW Total
£’000 £’000 £’000 £’000 £’000
Retail sales 473,884 119,530 293,983 232,549 1,119,946 Delivery receipts 11,496 3,660 5,085 5,426 25,667
Third party revenues 4,403 755 17 - 5,175
Internal revenues 39 - 336 3,067 3,442
Total segment revenue 489,822 123,945 299,421 241,042 1,154,230
Eliminations (39) - (336) (3,067) (3,442)
Total revenue 489,783 123,945 299,085 237,975 1,150,788
Cost of sales (260,709) (49,301) (151,783) (114,196) (575,989)
Gross profit 229,074 74,644 147,302 123,779 574,799
Distribution expenses (52,825) (38,382) (40,761) (36,713) (168,681)
Segment result 176,249 36,262 106,541 87,066 406,118
Administrative expenses (365,157)
Net other income 6,299
Operating profit 47,260
Finance income 353
Finance expense (81)
Profit before tax 47,532
Internal revenues relate largely to sale of stock by ASOS.com to ASOS (Shanghai) Commerce Co. Limited.
Year to 31 August 2014
UK US EU RoW Total
£’000 £’000 £’000 £’000 £’000
Retail sales 372,241 92,311 256,385 234,358 955,295 Delivery receipts 7,412 1,773 3,162 3,604 15,951 Third party revenues 4,224 - - - 4,224 Internal revenues 111 - - 7,654 7,765
Total segment revenue 383,988 94,084 259,547 245,616 983,235
Eliminations (111) - - (7,654) (7,765)
Total revenue 383,877 94,084 259,547 237,962 975,470 Cost of sales (207,853) (40,137) (126,460) (116,013) (490,463) Gross profit 176,024 53,947 133,087 121,949 485,007 Distribution expenses (39,618) (28,804) (37,062) (41,819) (147,303) Segment result 136,406 25,143 96,025 80,130 337,704 Administrative expenses (294,108) Net other income 3,050
Operating profit 46,646 Finance income 312 Finance expense (57) Profit before tax 46,901
Due to the nature of its activities, the Group is not reliant on any individual major customers.
No analysis of the assets and liabilities of each operating segment is provided to the Chief Operating Decision Maker in the
monthly management accounts therefore no measure of segments assets or liabilities is disclosed in this note. There are
no material non-current assets located outside the UK.
19
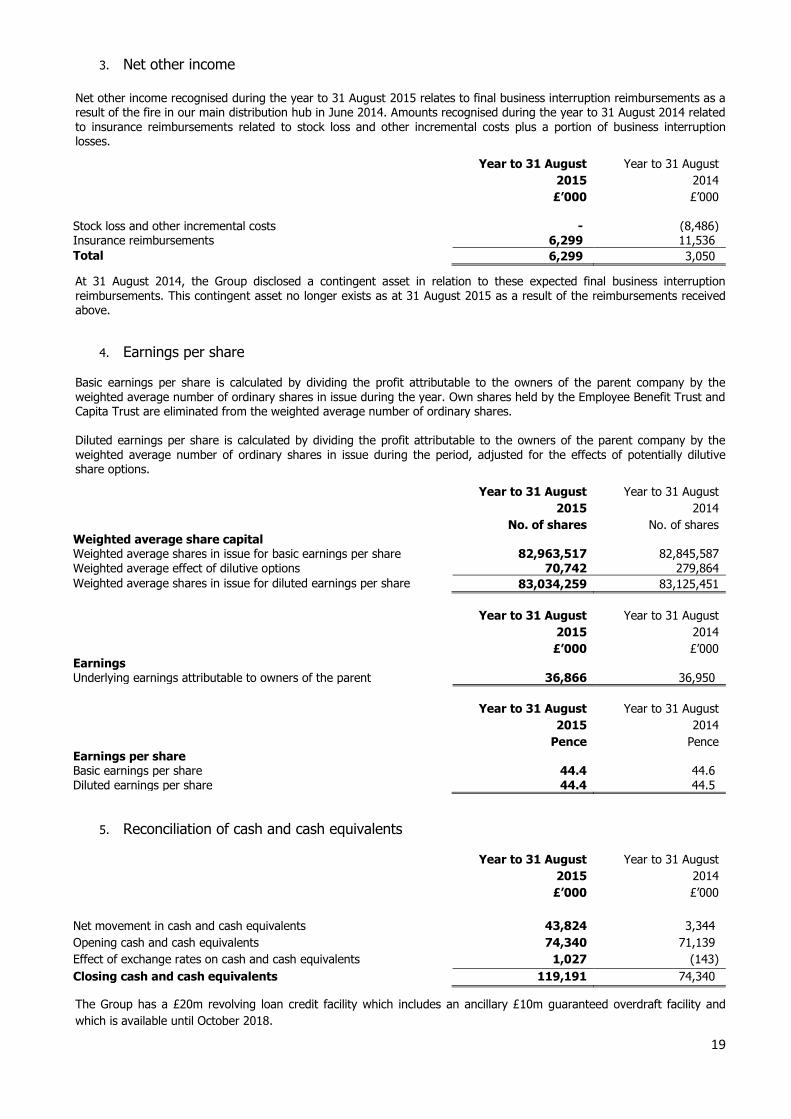
3. Net other income
Net other income recognised during the year to 31 August 2015 relates to final business interruption reimbursements as a result of the fire in our main distribution hub in June 2014. Amounts recognised during the year to 31 August 2014 related
to insurance reimbursements related to stock loss and other incremental costs plus a portion of business interruption losses.
Year to 31 August
2015
Year to 31 August
2014
£’000 £’000 Stock loss and other incremental costs - (8,486) Insurance reimbursements 6,299 11,536
Total 6,299 3,050
At 31 August 2014, the Group disclosed a contingent asset in relation to these expected final business interruption reimbursements. This contingent asset no longer exists as at 31 August 2015 as a result of the reimbursements received above.
4. Earnings per share
Basic earnings per share is calculated by dividing the profit attributable to the owners of the parent company by the weighted average number of ordinary shares in issue during the year. Own shares held by the Employee Benefit Trust and Capita Trust are eliminated from the weighted average number of ordinary shares. Diluted earnings per share is calculated by dividing the profit attributable to the owners of the parent company by the weighted average number of ordinary shares in issue during the period, adjusted for the effects of potentially dilutive share options.
Year to 31 August
2015
Year to 31 August
2014
No. of shares No. of shares Weighted average share capital Weighted average shares in issue for basic earnings per share 82,963,517 82,845,587 Weighted average effect of dilutive options 70,742 279,864
Weighted average shares in issue for diluted earnings per share 83,034,259 83,125,451
Year to 31 August
2015
Year to 31 August
2014
£’000 £’000 Earnings Underlying earnings attributable to owners of the parent 36,866 36,950
Year to 31 August
2015
Year to 31 August
2014
Pence Pence Earnings per share Basic earnings per share 44.4 44.6 Diluted earnings per share 44.4 44.5
5. Reconciliation of cash and cash equivalents
Year to 31 August
2015
Year to 31 August
2014
£’000 £’000
Net movement in cash and cash equivalents 43,824 3,344
Opening cash and cash equivalents 74,340 71,139
Effect of exchange rates on cash and cash equivalents 1,027 (143)
Closing cash and cash equivalents 119,191 74,340
The Group has a £20m revolving loan credit facility which includes an ancillary £10m guaranteed overdraft facility and
which is available until October 2018.
Top Related