


Languages
Pages
Legal

20
FIR
13 FIN
RSTO
NANC
NTAR
IAL R
RIO CR
EPOR
REDIT
RTS O
UNIO
F
ON LIMMITED

CONTENTS
Report on Management Responsibility 1
Loan Statistics 2
Report of the Audit Committee 3
Consolidated Financial Statements
Independent Auditors’ Report 4
Consolidated Statement of Financial Position 5
Consolidated Statement of Income 6
Consolidated Statement of Income and Other Comprehensive Income 7
Consolidated Statement of Changes in Members’ Equity 7
Consolidated Statement of Cash Flows 8
Notes to Consolidated Financial Statements 9
REP
The a
Repo
respo
opinio
accor
Popul
effect
To m
Mana
believ
are re
prope
The B
Statem
The B
review
audito
with t
relatin
The
condit
with th
KPMG
Statem
shown
Kelly
Presid
Octob
PORT ON
accompanying
rt are the re
onsible for the
on of Manag
rdance with I
laires Act, 19
ts of current e
meet its resp
agement has
ves that this s
eliable and f
erly accounted
Board of Dir
ments and fo
Board of Dire
w of financial
ors have full a
he Board of
ng to financia
Deposit Insu
tions and affa
he provisions
G LLP, Mem
ments in acc
n as part of th
McGiffin
dent and Chie
ber 30, 2013
N MANAG
g Consolidate
esponsibility o
e integrity and
gement, have
nternational
994 (Ontario)
events and tra
ponsibility for
developed a
system of inte
form a prope
d for and are
rectors is re
or overseeing
ectors carried
results and
and free acce
Directors, wit
l statement p
urance Corpo
airs of FirstO
s of the Act.
mber–appoint
cordance with
he Consolidat
ef Executive O
GEMENT R
ed Financial
of the Mana
d fairness of th
e been prepa
Financial Re
and are base
ansactions.
r the integrity
nd maintains
ernal controls
er basis for p
safeguarded.
sponsible for
Managemen
d out its resp
operations an
ess to, and m
th or without
resentation, i
oration of O
Ontario. The e
ted external
h Canadian g
ted Financial
Officer
RESPONS
Statements a
agement of F
he information
ared using a
eporting Stan
ed on informe
y and objec
s a system of
provides rea
preparation o
.
r reviewing a
nt’s performan
onsibility for
nd through its
meet periodica
Management
nternal contro
Ontario condu
examination i
auditors, h
generally acce
Statements.
Barry Do
Executiv
Officer
SIBILITY
and all inform
FirstOntario C
n presented.
appropriate a
ndards and th
ed judgments
ctivity of data
f internal acc
sonable assu
of financial st
and approvin
nce of its fina
the financial
s Audit Comm
ally with, the A
t present, to
ols and audit
ucts periodic
ncludes revie
as examined
epted auditin
oan, CPA, CA
ve Vice–Pre
mation contai
Credit Union
The financial
accounting po
he Credit Un
s and estimate
a in the fina
counting cont
urance that th
tatements an
ng the Cons
ancial reporti
statements t
mittee. The M
Audit Commit
discuss their
procedures.
c examination
ew of FirstOn
d the Cons
g standards
A, MAcc
esident and
ned in this A
Limited, wh
l statements,
olicies that a
nions and Ca
es of the exp
ancial statem
trols. Manage
he financial re
nd that asset
solidated Fin
ng responsib
through its re
Member–appo
ttee and may
r audit and m
n of the fin
ntario’s comp
olidated Fin
and their rep
Chief Fin
1
Annual
ich is
in the
are in
aisses
pected
ments,
ement
ecords
ts are
ancial
bilities.
egular
ointed
y meet
matters
ancial
liance
ancial
port is
ancial
2
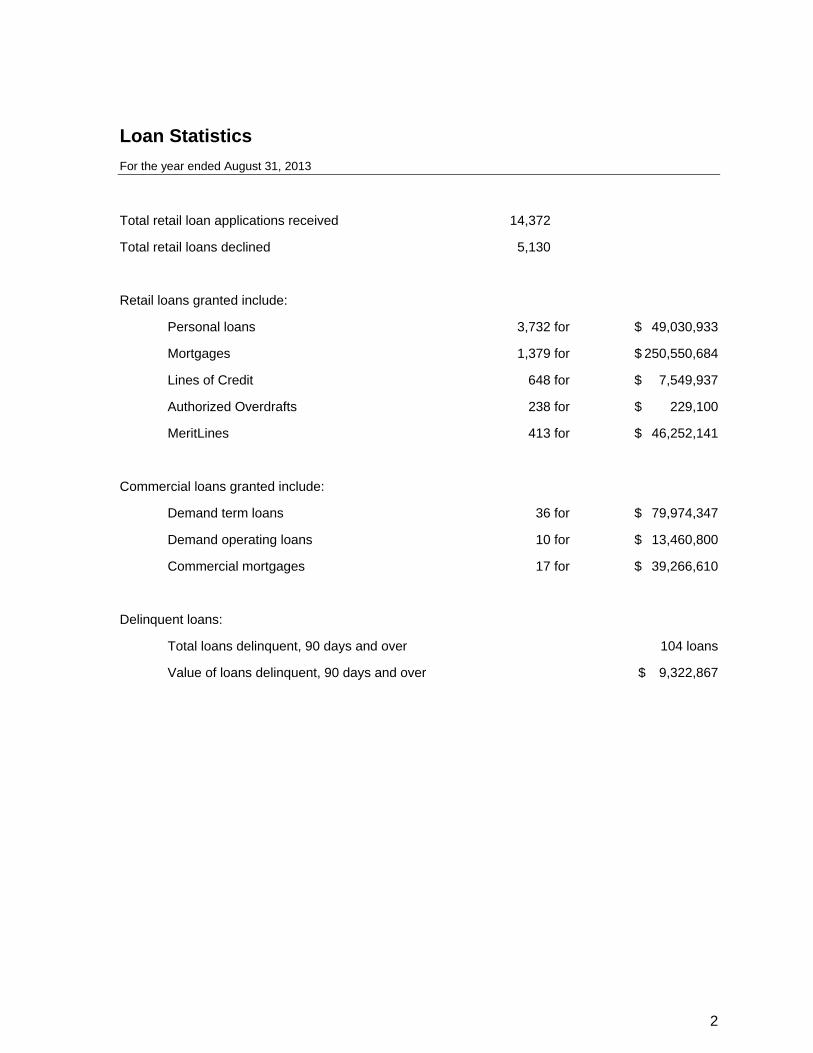
Loan Statistics
For the year ended August 31, 2013
Total retail loan applications received 14,372
Total retail loans declined 5,130
Retail loans granted include:
Personal loans 3,732 for $ 49,030,933
Mortgages 1,379 for $ 250,550,684
Lines of Credit 648 for $ 7,549,937
Authorized Overdrafts 238 for $ 229,100
MeritLines 413 for $ 46,252,141
Commercial loans granted include:
Demand term loans 36 for $ 79,974,347
Demand operating loans 10 for $ 13,460,800
Commercial mortgages 17 for $ 39,266,610
Delinquent loans:
Total loans delinquent, 90 days and over 104 loans
Value of loans delinquent, 90 days and over $ 9,322,867

REP
FirstO
to Se
Ontar
all of
Act.
The A
mand
activit
S
D
th
fin
O
im
an
S
w
R
pa
There
imple
Audit
there
theret
Based
of Dir
follow
Comm
role in
struct
Diann
Chair
Octob
PORT OF
Ontario Credit
ction 125 of
rio Regulation
the duties, w
Audit Committ
ate. During t
ties:
erved as the
Directors and,
he conversion
nancial statem
Obtained a re
mportant to s
nd ensuring c
erved as the
work plan and
Reviewed the
articular focus
e are no sign
mented or ar
Committee b
any further m
to.
d on its findin
rectors or sen
ws up to ensur
mittee receive
n maintaining
ture of the Cre
ne MacLean
, Audit Comm
ber 30, 2013
THE AUD
t Union Limite
the Credit U
n 237/09. The
which are spe
tee is pleased
he year the C
e principal co
in particular,
n to Internatio
ments prior to
easonable un
afeguarding t
compliance w
Board’s liais
reports.
policies, pro
s on requirem
ificant recom
re in the proce
believes shoul
matters that
ngs, the Audit
nior managem
re that the rec
ed full co–ope
the quality o
edit Union.
mittee
DIT COM
ed’s Audit Com
nions and Ca
e Committee,
ecified to be p
d to report to
Committee he
ommunication
, reviewed the
onal Financial
o Board appro
nderstanding
the assets of
with policies an
son with the i
ocedures and
ments for liqui
mendations m
ess of being
ld be reported
are required
t Committee i
ment, as app
commendatio
eration and su
of financial rep
MITTEE
mmittee is a c
aisses Popula
which consis
performed by
the Members
eld four meet
n link betwee
e terms of en
Reporting St
oval for issuan
of the impor
f FirstOntario
nd procedure
nternal audito
controls, wh
dity, capital a
made by the
implemented
d to the Mem
to be disclos
ssues reports
propriate, with
ons are consid
upport from m
porting to the
committee of
aires Act, 19
sts of four dir
y audit comm
s of FirstOnta
tings and com
en the extern
ngagement a
tandards and
nce to the Me
rtant element
o, ensuring th
s.
or and review
hich relate to
adequacy and
Audit Comm
. In addition,
bers, other th
sed pursuant
s and makes
h respect to t
dered and im
management
Members an
the Board of
94 (Ontario)
rectors, has a
mittees in the
ario that it has
mpleted the fo
nal auditors
nd scope of
d reviewed Fir
embers.
ts of internal
he accuracy o
wed the intern
o legislative c
d interest rate
mittee that hav
there are no
han as describ
t to the Act o
recommenda
the matters o
plemented. D
to enable it t
nd enhancing
Directors pur
and Section
a mandate to
Regulations
s fulfilled its a
ollowing sign
and the Boa
the audit, ove
rstOntario’s a
l controls tha
of financial re
nal audit man
compliance, w
managemen
ve not been
matters whic
bed above, no
or the Regula
ations to the B
outlined above
During the yea
to play an eff
the overall c
3
rsuant
27 of
cover
of the
annual
ificant
ard of
ersaw
annual
at are
eports
ndate,
with a
nt.
either
ch the
or are
ations
Board
e and
ar, the
fective
control

To the
We hLimiteconsoand cpolicie
Mana
Manastatemcontrostatem
Audit
Our reaudit.Thoseobtainmater
An auin thethe awhethto thedesigexpreevaluestimfinanc
We bfor ou
Opini
In ouconsoconsoaccor
Chart
HamilOctob
KPMCharBox 21 KHam
e Members of
ave audited ed, which comolidated statecash flows fores and other
agement’s Re
agement is rements in accol as managements that are
tor’s Respon
esponsibility We conducte standards rn reasonablerial misstatem
udit involves p consolidated
assessment oher due to frae entity’s prepn audit proc
essing an opiating the appates made bycial statement
elieve that thur audit opinio
ion
r opinion, tholidated finanolidated finanrdance with In
tered Account
lton, Canada ber 30, 2013
MG LLP rtered Accountants 976
King Street West Sumilton ON L8N 3R1
KPMG LLP is network of ind(“KPMG InternKPMG Canad KPMG Conf
INDEP
f FirstOntario
the accompamprise the coments of incr the year theexplanatory in
esponsibility
esponsible forcordance withement determe free from m
nsibility
is to expressted our audit require that we assurance ment.
performing prd financial staof the risks ud or error. Inparation and
cedures that inion on the propriatenessy managemets.
e audit evideon.
he consolidatcial position
ncial performnternational F
tants, License
uite 700
a Canadian limited liabilityependent member firms a
national”), a Swiss entity. a provides services to KPM
idential
PENDENT
Credit Union
anying consoonsolidated stome and oth
en ended, annformation.
y for the Con
r the preparah Internationamines is nece
aterial missta
s an opinion oin accordanc
we comply witabout wheth
rocedures to oatements. Theof material m
n making thosfair presentaare appropreffectiveness
s of accountinent, as well a
ence we have
ed financial of FirstOntarance and itsinancial Repo
ed Public Acc
y partnership and a membeffiliated with KPMG Interna
MG LLP.
T AUDITO
n Limited
lidated financtatement of fi
her comprehed notes, com
solidated Fin
tion and fair al Financial Rssary to enab
atement, whet
on these conce with Canath ethical requer the conso
obtain audit ee procedures misstatementse risk assessation of the ciate in the cs of the entitng policies us evaluating
e obtained is s
statements prio Credit Uns consolidateorting Standa
countants
er firm of the KPMG ational Cooperative
ORS’ REP
cial statemeninancial posit
ensive incomemprising a sum
nancial State
presentation Reporting Stable the prepather due to fra
solidated finadian generalluirements anolidated finan
evidence aboselected dep
t of the consments, we c
consolidated fcircumstancesty’s internal csed and the the overall p
sufficient and
present fairlynion Limited aed cash flowards.
TelephTelefawww.k
PORT
nts of FirstOntion as at Aue, changes inmmary of sig
ements
of these conandards, andaration of conaud or error.
ancial statemly accepted ad plan and p
ncial stateme
ut the amounpend on our jusolidated fina
consider internfinancial states, but not focontrol. An areasonablen
presentation o
d appropriate
y, in all mateas at August
ws for the ye
hone (905) 523-820ax (905) 523-2222kpmg.ca
ntario Credit gust 31, 201n members’ enificant accou
nsolidated find for such innsolidated fin
ents based oauditing standerform the au
ents are free
nts and discloudgment, inclancial statemnal control relements in ordor the purpoaudit also incness of accouof the consoli
to provide a
erial respects31, 2013, a
ear then end
00
4
Union 3, the equity unting
ancial nternal ancial
on our dards. udit to
e from
osures luding
ments, levant der to
ose of cludes unting idated
basis
s, the nd its
ded in
FIRSCons As at
(In tho
AsseLoaResPerComAcc
OthCasInveFixeDerOth
LiabiMemDepMemInveAcc
OthLoaAccDer
Mem Inve Con Ret Acc
Comm
See a
On be
Direct
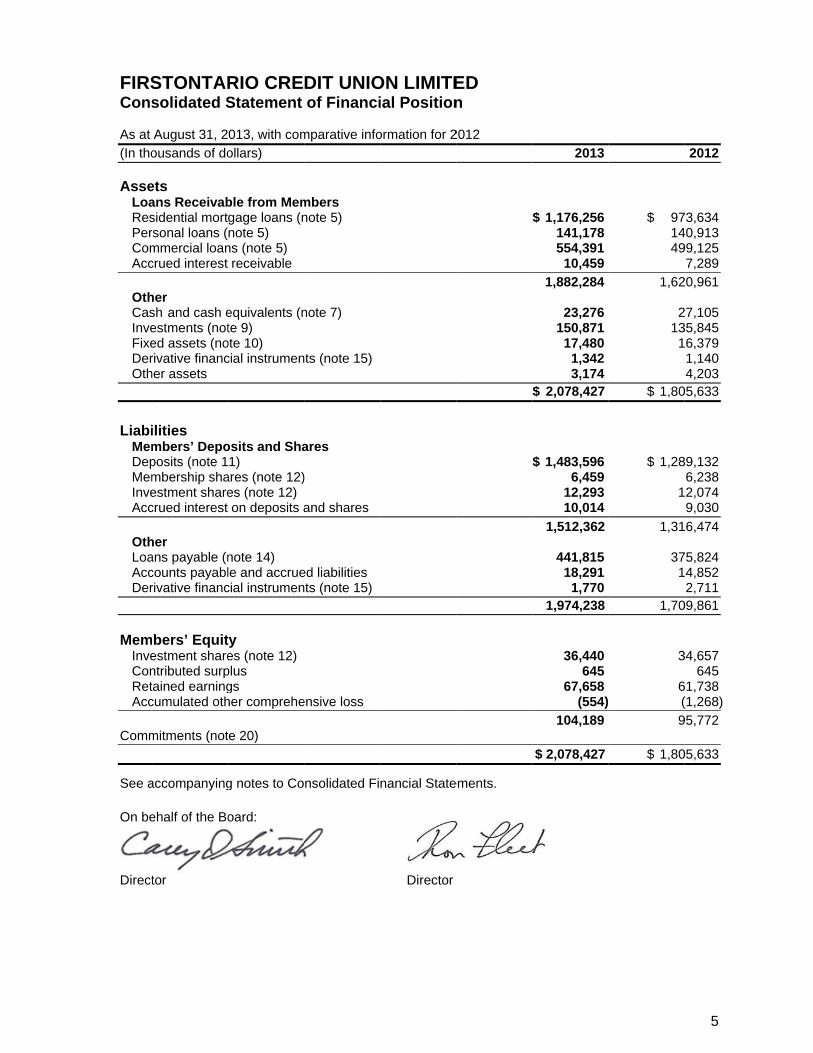
STONTARsolidated S
August 31, 2
ousands of do
ets ans Receivabsidential mortrsonal loans (mmercial loancrued interest
her sh and cash eestments (noted assets (norivative financher assets
ilities mbers’ Depoposits (note 1mbership shaestment sharecrued interest
her ans payable (ncounts payablrivative financ
bers’ Equitestment sharentributed surptained earningcumulated oth
mitments (not
accompanying
ehalf of the Bo
tor
RIO CREStatement
013, with com
ollars)
ble from Memgage loans (nnote 5)
ns (note 5) receivable
equivalents (nte 9)
ote 10) cial instrumen
osits and Sha1)
ares (note 12)es (note 12) on deposits a
note 14) le and accruecial instrumen
ty es (note 12)
plus gs her comprehe
te 20)
g notes to Co
oard:
DIT UNIOof Financi
mparative info
mbers note 5)
note 7)
nts (note 15)
ares
)
and shares
ed liabilitiesnts (note 15)
ensive loss
nsolidated Fi
ON LIMITEial Position
ormation for 2
nancial State
Director
ED n
2012
ements.
2013
$ 1,176,256 141,178
554,391 10,459
1,882,284
23,276 150,871 17,480
1,342 3,174
$ 2,078,427
$ 1,483,596 6,459
12,293 10,014
1,512,362
441,815 18,291
1,770 1,974,238
36,440 645
67,658 (554)
104,189
$ 2,078,427
$ 971449
1,62
2131
$ 1,80
$ 1,28
1
1,31
371
1,70
3
6 (
9
$ 1,80
5
2012
73,634 40,913 99,125 7,289
20,961
27,105 35,845 6,379 1,140 4,203
05,633
89,132 6,238 2,074 9,030
6,474
75,824 4,852 2,711
09,861
34,657 645
61,738 (1,268)
95,772
05,633
6
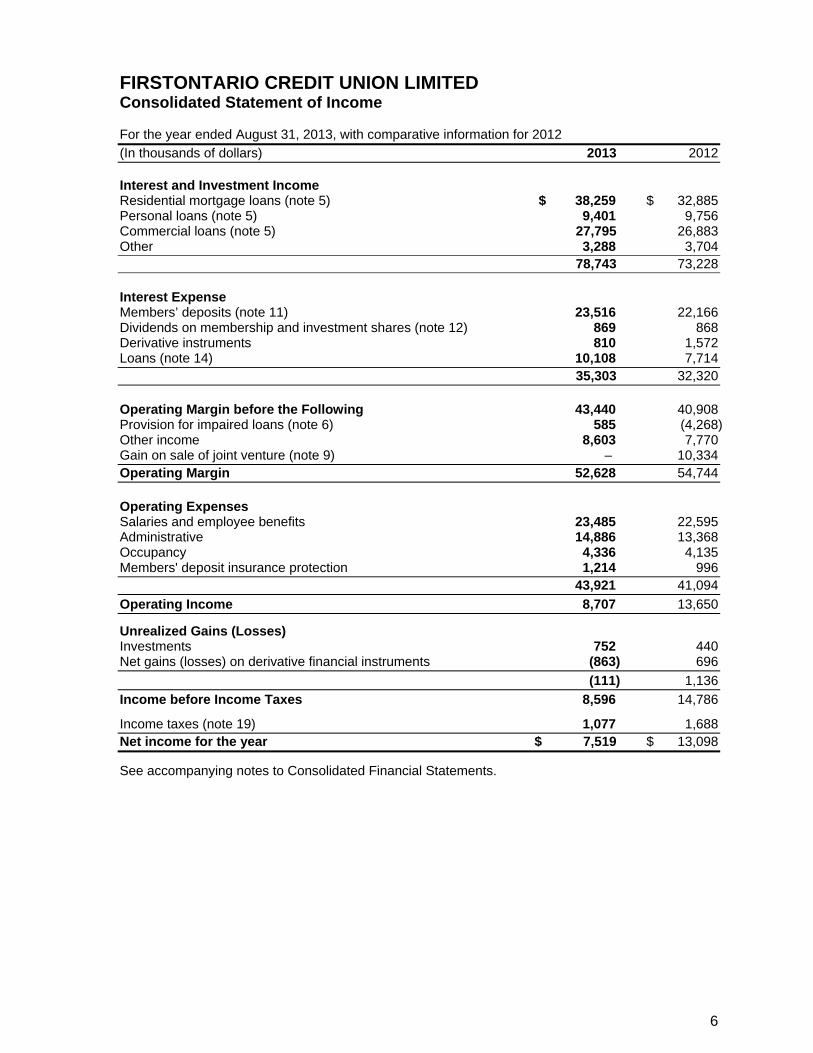
FIRSTONTARIO CREDIT UNION LIMITED Consolidated Statement of Income For the year ended August 31, 2013, with comparative information for 2012
(In thousands of dollars) 2013 2012
Interest and Investment Income Residential mortgage loans (note 5) $ 38,259 $ 32,885 Personal loans (note 5) 9,401 9,756 Commercial loans (note 5) 27,795 26,883 Other 3,288 3,704 78,743 73,228
Interest Expense Members’ deposits (note 11) 23,516 22,166 Dividends on membership and investment shares (note 12) 869 868 Derivative instruments 810 1,572 Loans (note 14) 10,108 7,714 35,303 32,320
Operating Margin before the Following 43,440 40,908 Provision for impaired loans (note 6) 585 (4,268) Other income 8,603 7,770 Gain on sale of joint venture (note 9) – 10,334 Operating Margin 52,628 54,744
Operating Expenses Salaries and employee benefits 23,485 22,595 Administrative 14,886 13,368 Occupancy 4,336 4,135 Members' deposit insurance protection 1,214 996 43,921 41,094
Operating Income 8,707 13,650
Unrealized Gains (Losses) Investments 752 440 Net gains (losses) on derivative financial instruments (863) 696
(111) 1,136
Income before Income Taxes 8,596 14,786
Income taxes (note 19) 1,077 1,688 Net income for the year $ 7,519 $ 13,098
See accompanying notes to Consolidated Financial Statements.

7
FIRSTONTARIO CREDIT UNION LIMITED Consolidated Statement of Income and Other Comprehensive Income For the year ended August 31, 2013, with comparative information for 2012
(In thousands of dollars) 2013 2012
Net income for the year $ 7,519 $ 13,098 Other Comprehensive Income (Loss) Items that are or may be reclassified subsequently to net income: Net gain (loss) on cash flow hedges (93) 594 Net gain (loss) on cash flow hedges transferred to earnings 863 (529) Net change in fair value of available–for–sale investments 37 (398) Net fair value amount of available–for–sale investments transferred to net income – 594 Related income taxes (note 19) (93) (40)
Total Income and Other Comprehensive Income for the year $ 8,233 $ 13,319
Consolidated Statement of Changes in Members’ Equity For the year ended August 31, 2013, with comparative information for 2012
(In thousands of dollars) 2013 2012
Investment Shares (Note 12) Balance at beginning of year $ 34,657 $ 32,824 Shares issued during year 1,920 1,833 Shares redeemed during year (137) –
Balance at end of year 36,440 34,657 Contributed Surplus Balance at beginning of year 645 645
Balance at end of year 645 645 Retained Earnings Balance at beginning of year 61,738 50,175 Net income for the year 7,519 13,098 Dividends paid (net of income tax recovery of $321 (2012– $281)) (1,599) (1,535)
Balance at end of year 67,658 61,738 Accumulated Other Comprehensive Income (Loss), net of tax Cash flow hedging reserve: Balance at beginning of year (1,303) (1,358) Other comprehensive income for the year 683 55
Balance at end of year (620) (1,303) Fair value reserve on available for sale investments: Balance at beginning of year 35 (131) Other comprehensive income for the year 31 166
Balance at end of year 66 35 Balance at end of year (554) (1,268)
Total Members’ Equity $ 104,189 $ 95,772
See accompanying notes to Consolidated Financial Statements.
8
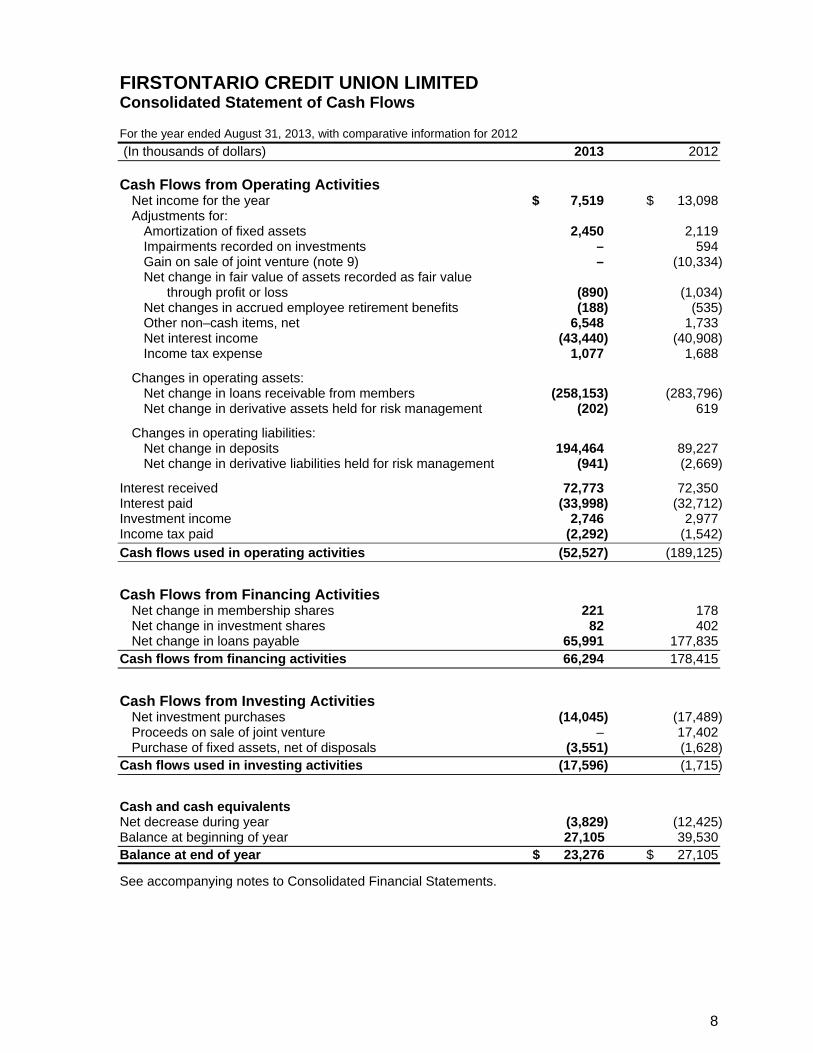
FIRSTONTARIO CREDIT UNION LIMITED Consolidated Statement of Cash Flows For the year ended August 31, 2013, with comparative information for 2012
(In thousands of dollars) 2013 2012
Cash Flows from Operating Activities Net income for the year $ 7,519 $ 13,098 Adjustments for: Amortization of fixed assets 2,450 2,119 Impairments recorded on investments – 594 Gain on sale of joint venture (note 9) – (10,334) Net change in fair value of assets recorded as fair value through profit or loss (890) (1,034) Net changes in accrued employee retirement benefits (188) (535) Other non–cash items, net 6,548 1,733 Net interest income (43,440) (40,908) Income tax expense 1,077 1,688
Changes in operating assets: Net change in loans receivable from members (258,153) (283,796) Net change in derivative assets held for risk management (202) 619
Changes in operating liabilities: Net change in deposits 194,464 89,227 Net change in derivative liabilities held for risk management (941) (2,669)
Interest received 72,773 72,350 Interest paid (33,998) (32,712) Investment income 2,746 2,977 Income tax paid (2,292) (1,542)
Cash flows used in operating activities (52,527) (189,125)
Cash Flows from Financing Activities Net change in membership shares 221 178 Net change in investment shares 82 402 Net change in loans payable 65,991 177,835 Cash flows from financing activities 66,294 178,415
Cash Flows from Investing Activities Net investment purchases (14,045) (17,489) Proceeds on sale of joint venture – 17,402 Purchase of fixed assets, net of disposals (3,551) (1,628) Cash flows used in investing activities (17,596) (1,715)
Cash and cash equivalents Net decrease during year (3,829) (12,425) Balance at beginning of year 27,105 39,530 Balance at end of year $ 23,276 $ 27,105
See accompanying notes to Consolidated Financial Statements.

FIRSTONTARIO CREDIT UNION LIMITED Notes to Consolidated Financial Statements For the year ended August 31, 2013, with comparative information for 2012
9
1. Corporate Information
FirstOntario Credit Union Limited (“FirstOntario”) is a financial institution incorporated in Ontario
which operates in compliance with the Credit Unions and Caisses Populaires Act of Ontario (the
“Act”) and is a member of Central 1 Credit Union (“Central 1”). The location of the head office and
principal place of business of FirstOntario is 688 Queensdale Avenue East, Hamilton, Ontario,
L8V 1M1.
FirstOntario exists to help Members meet their financial needs in their local communities.
FirstOntario’s principal activities are the provision of deposit–taking, lending and other financial
services.
FirstOntario’s Member deposits are insured by the Deposit Insurance Corporation of Ontario
(“DICO”) under a mandatory program, the expense for which amounted to $1,214,000 in 2013
and $996,000 in 2012. At August 31, 2013 there were 90,167 Members (2012 – 87,822).
2. Basis of Preparation:
Statement of compliance
The Consolidated Financial Statements of FirstOntario have been prepared in accordance with
International Financial Reporting Standards (“IFRS”). IFRS comprise of accounting standards
issued by the International Accounting Standards Board (“IASB”) as well as interpretations issued
by the IFRS Interpretations Committee.
These financial statements were approved by FirstOntario’s Board of Directors on October 30,
2013. The significant accounting policies used in the preparation of these Consolidated Financial
Statements are summarized below and have been applied consistently to all years presented in
the financial statements.
Use of estimates and judgments
The preparation of Consolidated Financial Statements in conformity with IFRS requires
management to make estimates and assumptions that affect the reported amounts of assets and
liabilities and the reported amounts in revenue and expenses during the reporting year. Actual
future results could differ from those estimates.
Items which result in the most significant areas of application of judgment and estimates include
the following:
(a) Fair value of financial instruments:
Where fair value of financial assets and liabilities cannot be derived from active markets,
FirstOntario uses valuation techniques that include inputs derived from either observable market
data or utilizing management judgment. Refer to Note 17 for information relating to these
estimates.
FIRSTONTARIO CREDIT UNION LIMITED Notes to Consolidated Financial Statements For the year ended August 31, 2013, with comparative information for 2012
10
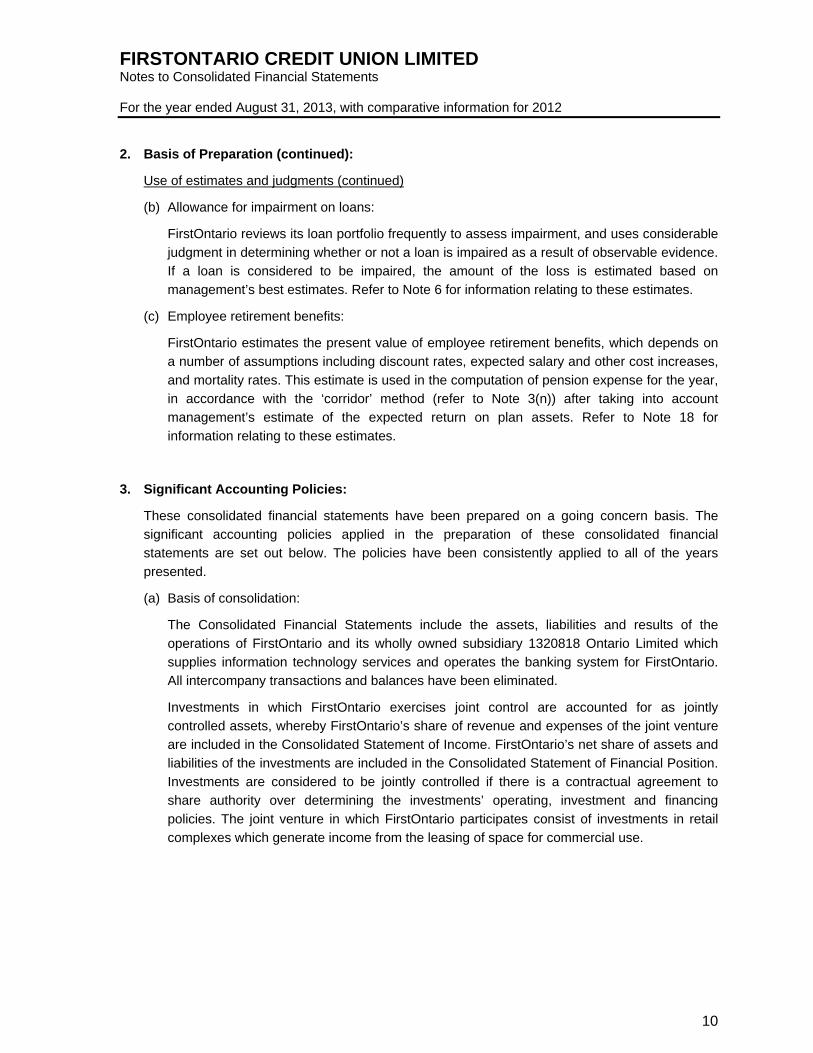
2. Basis of Preparation (continued):
Use of estimates and judgments (continued)
(b) Allowance for impairment on loans:
FirstOntario reviews its loan portfolio frequently to assess impairment, and uses considerable
judgment in determining whether or not a loan is impaired as a result of observable evidence.
If a loan is considered to be impaired, the amount of the loss is estimated based on
management’s best estimates. Refer to Note 6 for information relating to these estimates.
(c) Employee retirement benefits:
FirstOntario estimates the present value of employee retirement benefits, which depends on
a number of assumptions including discount rates, expected salary and other cost increases,
and mortality rates. This estimate is used in the computation of pension expense for the year,
in accordance with the ‘corridor’ method (refer to Note 3(n)) after taking into account
management’s estimate of the expected return on plan assets. Refer to Note 18 for
information relating to these estimates.
3. Significant Accounting Policies:
These consolidated financial statements have been prepared on a going concern basis. The
significant accounting policies applied in the preparation of these consolidated financial
statements are set out below. The policies have been consistently applied to all of the years
presented.
(a) Basis of consolidation:
The Consolidated Financial Statements include the assets, liabilities and results of the
operations of FirstOntario and its wholly owned subsidiary 1320818 Ontario Limited which
supplies information technology services and operates the banking system for FirstOntario.
All intercompany transactions and balances have been eliminated.
Investments in which FirstOntario exercises joint control are accounted for as jointly
controlled assets, whereby FirstOntario’s share of revenue and expenses of the joint venture
are included in the Consolidated Statement of Income. FirstOntario’s net share of assets and
liabilities of the investments are included in the Consolidated Statement of Financial Position.
Investments are considered to be jointly controlled if there is a contractual agreement to
share authority over determining the investments’ operating, investment and financing
policies. The joint venture in which FirstOntario participates consist of investments in retail
complexes which generate income from the leasing of space for commercial use.

FIRSTONTARIO CREDIT UNION LIMITED Notes to Consolidated Financial Statements For the year ended August 31, 2013, with comparative information for 2012
11
3. Significant Accounting Policies (continued):
(b) Financial instruments – recognition and measurement:
Financial assets and liabilities, including derivatives, are recognized on the Consolidated
Statement of Financial Position of FirstOntario at the time that FirstOntario becomes party to
the contractual provisions of the instrument. FirstOntario recognizes financial instruments at
the trade date.
All financial assets and liabilities are measured at fair value upon initial recognition.
Subsequent measurement is dependent upon the financial instrument’s classification.
Financial assets and liabilities comprise cash and cash equivalents, derivatives, investments,
loans receivable from Members, Member’s deposits and shares, loans payable and accounts
payable and accrued liabilities.
Classification of financial instruments
Financial assets and liabilities designated as fair value through profit and loss (“FVTPL”) are
financial instruments either classified as held for trading (“HFT”) or are managed and
evaluated on a fair value basis in accordance with a documented risk management strategy.
HFT financial assets and liabilities are acquired or incurred principally for resale, generally
within a short period of time.
FVTPL financial assets and liabilities are subsequently measured at fair value at each
reporting date. Gains and losses realized on disposal together with dividends and interest
earned on these instruments are reported in interest and investment income. Unrealized
gains and losses from changes in fair value are reported separately in the Consolidated
Statement of Income. There are regulatory restrictions imposed by the Deposit Insurance
Corporation of Ontario on the use of this designation including that loans receivable from
members are precluded from being designated FVTPL and that the fair value designated
financial instruments are managed on a fair value basis.
Held–to–maturity (“HTM”) financial assets are non–derivative financial assets with fixed or
determinable payments and fixed maturity, other than Loans and Receivables, that
FirstOntario has the positive intention and ability to hold to maturity. These financial assets
are subsequently measured at amortized cost using the effective interest method.
Available–for–sale (“AFS”) financial assets are those non–derivative financial assets that are
not classified as FVTPL, HTM or Loans and Receivables. AFS instruments are subsequently
measured at fair value whereby the unrealized gains and losses are recognized in other
comprehensive income and included in accumulated other comprehensive income (“AOCI”),
as discussed below, until sale or significant and prolonged impairment when the cumulative
gain or loss is transferred to the Consolidated Statement of Income. AFS financial assets
whose fair value is not reliably measurable are carried at cost. Realized gains and losses on
sale are recorded in other income. Write downs to reflect impairment in value are recorded in
unrealized gains (losses).

FIRSTONTARIO CREDIT UNION LIMITED Notes to Consolidated Financial Statements For the year ended August 31, 2013, with comparative information for 2012
12
3. Significant Accounting Policies (continued):
(b) Financial instruments – recognition and measurement (continued):
Loans and Receivables are non–derivative financial assets with fixed or determinable
payments that are not quoted in an active market. Financial assets classified as Loans and
Receivables are initially accounted for net of transaction costs and are subsequently
measured at amortized cost by applying the effective interest method.
Financial liabilities classified as Other Liabilities are subsequently measured at amortized
cost. Financial liabilities are initially recognized on the trade date FirstOntario becomes party
to the contractual provision of the instrument. FirstOntario derecognizes a financial liability
when its contractual obligations are discharged, cancelled or expire.
Classification of investment instruments is outlined in Note 9. Classification of all financial
instruments is outlined in Note 17.
Effective interest method
Interest income and expense are recognized in the Consolidated Statement of Income using
the effective interest method. The effective interest rate is the rate that discounts the
estimated future cash payments and receipts through the expected life of the financial asset
or liability to its net carrying amount upon initial recognition. The effective interest rate is
established on initial recognition of the financial asset or liability and is not revised
subsequently. The calculation of the effective interest rate includes transaction costs, fees
and discounts or premiums that are an integral part of the effective yield on the financial
asset or liability.
Transaction costs
Transaction costs are incremental costs that are directly attributable to the acquisition,
issuance or disposal of a financial asset or liability. Transaction costs related to FVTPL
financial assets and liabilities are expensed as incurred. Transaction costs relating to AFS
and HTM financial assets and loans and receivables are capitalized and amortized over the
expected life of the instrument using the effective interest method.
Offsetting
Financial assets and liabilities are offset and the net amount presented in the statement of
financial position when, and only when, FirstOntario has a legal right to set off the recognized
amounts and it intends either to settle on a net basis or to realize the asset and settle the
liability simultaneously.
Income and expenses are presented on a net basis only when permitted under IFRSs, or for
gains and losses arising from a group of similar transactions.

FIRSTONTARIO CREDIT UNION LIMITED Notes to Consolidated Financial Statements For the year ended August 31, 2013, with comparative information for 2012
13
3. Significant Accounting Policies (continued):
(b) Financial instruments – recognition and measurement (continued):
Identification and measurement of impairment losses
At each reporting date FirstOntario assesses whether there is objective evidence that
financial assets not carried at fair value through profit or loss are impaired. A financial asset
or group of financial assets is (are) impaired when objective evidence demonstrates that a
loss event has occurred after the initial recognition of the asset(s), and that the loss event has
an impact on the future cash flows of the asset(s) that can be estimated reliably.
For available–for–sale investments in equity securities, objective evidence includes a
significant or prolonged decline in its fair value below its cost.
For loans and receivables and held to maturity assets, impairment is assessed at the
individual and collective levels. Objective evidence can include, but is not limited to,
reasonable doubt as to the collectability of principal and interest, or when loan payments are
90 days past due. Collective allowances are established on a portfolio basis to absorb
probable loan losses for which a loss event has occurred but has not yet been identified by
management. The collectively assessed allowance is based on portfolio quality, past
experience, current economic conditions and management’s judgment.
Derivative financial instruments
Derivative financial instruments are financial contracts whose value is derived from interest
rates or other financial indices in the equity markets. In the ordinary course of business,
FirstOntario enters into various derivative contracts, including interest rate swaps, equity–
linked options, foreign exchange forwards and bond forwards. FirstOntario enters into such
contracts to manage interest rate fluctuations and foreign exchange risk as part of
FirstOntario’s asset/liability management program.
Interest rate swaps involve the periodic exchange of payments without the exchange of the
notional principal amount upon which the payments are based. Equity–linked options are
purchased to hedge deposit products whose interest is linked to various equity indices or a
specific bundle of equities. These contracts pay returns based on the change in value of
equity indices or a specific bundle of equities.
Foreign exchange contracts are used to hedge FirstOntario’s net US dollar liability position.
Derivatives are measured at fair value and are reported as assets where they have a positive
fair value and as liabilities where they have a negative fair value. In both cases they are
reported as derivative financial instruments in the financial statements.

FIRSTONTARIO CREDIT UNION LIMITED Notes to Consolidated Financial Statements For the year ended August 31, 2013, with comparative information for 2012
14
3. Significant Accounting Policies (continued):
(b) Financial instruments – recognition and measurement (continued):
Derivatives embedded in other financial instruments are separated from the host contract and
accounted for separately if their economic characteristics and risks are not closely related to
those of the host contract; the terms of the embedded derivatives would meet the definition of
a derivative if it was a free standing instrument, and the combined contract is not designated
as FVTPL and recorded at fair value. These embedded derivatives are classified as part of
the host instrument and measured at fair value with changes therein recognized on the
Consolidated Statement of Income.
Accrued interest receivable is recorded in other assets and accrued interest payable is
recorded in accounts payable and accrued liabilities. Interest income or expense is recorded
in interest income or interest expense, as applicable.
Hedge accounting
FirstOntario formally documents all relationships between hedging instruments and hedged
items; as well as risk management objectives and strategies for undertaking various hedge
transactions. This process includes linking all derivatives to specific assets and liabilities
recognized on the Consolidated Statement of Financial Position or specific firm commitments
or forecasted transactions that are highly probable to occur and prevent exposure to
variations in cash flows that could ultimately affect reported net income. FirstOntario also
formally assesses, both at the hedge’s inception and on an ongoing basis, whether the
derivatives that are used in hedging transactions are highly effective in offsetting changes in
fair values or cash flows of hedged items attributable to the hedged risk. FirstOntario
designates its interest rate hedge agreements as hedges of the underlying financial
instrument.
IFRS specifies the criteria that must be satisfied in order for hedge accounting to be applied
and prescribes the accounting treatment for those permitted hedging strategies applicable to
FirstOntario – fair value hedges and cash flow hedges.
In a fair value hedge, the change in fair value of the hedging derivative is offset on the
Consolidated Statement of Income by the change in fair value of the hedged item relating to
the hedged risk. FirstOntario utilizes fair value hedges primarily to convert fixed rate financial
assets and liabilities to floating rate. The main financial instruments designated in fair value
hedging relationships are loans. If the derivative expires or is sold, terminated or exercised,
no longer meets the criteria for fair value hedge accounting, or the designation is revoked,
hedge accounting is discontinued prospectively. The fair value of the hedged item related to
the hedged risk is reported as other assets. The fair value of the hedging instrument is
recorded as a derivative asset or liability.

FIRSTONTARIO CREDIT UNION LIMITED Notes to Consolidated Financial Statements For the year ended August 31, 2013, with comparative information for 2012
15
3. Significant Accounting Policies (continued):
(b) Financial instruments – recognition and measurement (continued):
In a cash flow hedge, the effective portion of changes in fair value of the derivative is
recognized in other comprehensive income (“OCI”) and presented in the cash flow hedging
reserve in equity. The amount recognized in OCI is reclassified and included on the
Consolidated Statement of Income in the same year that the hedged cash flows affect
income. This will be offset by increased net interest income on assets and liabilities that are
hedged. FirstOntario utilizes cash flow hedges primarily to convert floating rate assets and
liabilities to fixed rate. Any hedge ineffectiveness is measured and is immediately recognized
in the Consolidated Statement of Income.
When either a fair value or cash flow hedge is discontinued, any cumulative adjustment to
either the hedged item or other comprehensive income (loss) is recognized in income over
the remaining term of the original hedge (fair value hedge) and as the hedged item impacts
earnings (cash flow hedge) or immediately if the forecast transaction is no longer expected to
occur.
(c) Loan securitizations:
FirstOntario periodically securitizes residential mortgages and commercial loans by legally
selling them to funding partners. Securitized assets are assessed for derecognition under IAS
39 Financial Instruments: Recognition and Measurement. When the derecognition criteria are
met, the assets are de–recognized from the Consolidated Statement of Financial Position.
Under the transition to IFRS, the derecognition criteria is applied prospectively from the date
of transition and transactions entered into prior to the transition date (September 1, 2010) are
assessed under previous Canadian GAAP.
Securitized residential mortgages that are assessed under IAS 39 do not meet derecognition
requirements as substantially all of the risks and rewards of the loans are held with
FirstOntario. As a result, these loans are reported on the Statement of Financial Position.
Securitized residential mortgages that are not reported on the Statement of Financial Position
met the derecognition requirements of previous Canadian GAAP.
Commercial loans sold met the derecognition requirements and are not reported on the
Statement of Financial Position as substantially all of the risks and rewards of the loan is
transferred to the funding partner and FirstOntario has received consideration in exchange.
For those commercial loans sold, no gain is recorded as the consideration received is
equivalent to the carrying value of the asset.
Revenue from servicing loans and mortgages is recorded as the services are provided.
(d) Cash and cash equivalents:
Cash and cash equivalents includes cash on hand, current accounts, short term deposits with
other financial institutions, cheques and other items in transit. Given their short term nature,
the carrying value of cash and cash equivalents equals fair value.
FIRSTONTARIO CREDIT UNION LIMITED Notes to Consolidated Financial Statements For the year ended August 31, 2013, with comparative information for 2012
16
3. Significant Accounting Policies (continued):
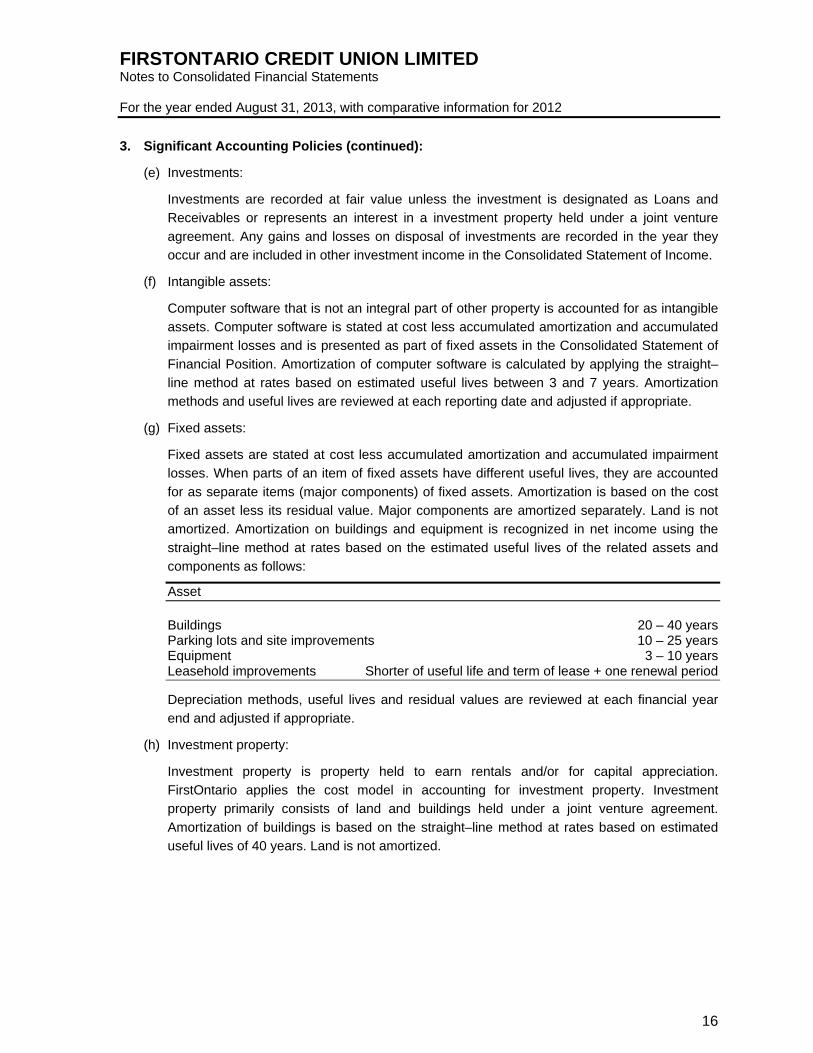
(e) Investments:
Investments are recorded at fair value unless the investment is designated as Loans and
Receivables or represents an interest in a investment property held under a joint venture
agreement. Any gains and losses on disposal of investments are recorded in the year they
occur and are included in other investment income in the Consolidated Statement of Income.
(f) Intangible assets:
Computer software that is not an integral part of other property is accounted for as intangible
assets. Computer software is stated at cost less accumulated amortization and accumulated
impairment losses and is presented as part of fixed assets in the Consolidated Statement of
Financial Position. Amortization of computer software is calculated by applying the straight–
line method at rates based on estimated useful lives between 3 and 7 years. Amortization
methods and useful lives are reviewed at each reporting date and adjusted if appropriate.
(g) Fixed assets:
Fixed assets are stated at cost less accumulated amortization and accumulated impairment
losses. When parts of an item of fixed assets have different useful lives, they are accounted
for as separate items (major components) of fixed assets. Amortization is based on the cost
of an asset less its residual value. Major components are amortized separately. Land is not
amortized. Amortization on buildings and equipment is recognized in net income using the
straight–line method at rates based on the estimated useful lives of the related assets and
components as follows:
Asset
Buildings 20 – 40 years Parking lots and site improvements 10 – 25 years Equipment 3 – 10 years Leasehold improvements Shorter of useful life and term of lease + one renewal period
Depreciation methods, useful lives and residual values are reviewed at each financial year
end and adjusted if appropriate.
(h) Investment property:
Investment property is property held to earn rentals and/or for capital appreciation.
FirstOntario applies the cost model in accounting for investment property. Investment
property primarily consists of land and buildings held under a joint venture agreement.
Amortization of buildings is based on the straight–line method at rates based on estimated
useful lives of 40 years. Land is not amortized.
FIRSTONTARIO CREDIT UNION LIMITED Notes to Consolidated Financial Statements For the year ended August 31, 2013, with comparative information for 2012
17
3. Significant Accounting Policies (continued):
(i) Shares:
Membership and investment shares are classified either as liabilities or member’s equity.
Where shares are redeemable at the option of the Member, either on demand or on
withdrawal from membership, the shares are classified as other liabilities and carried at
amortized cost. Shares that are redeemable at the discretion of FirstOntario’s Board of
Directors are classified as equity.
(j) Dividends on shares classified as other liabilities are reported as interest expense. Dividends
on shares classified as equity are charged to retained earnings on the date at which
distributions are declared payable by the Board of Directors. All dividends on shares are
deductible for income tax purposes.Impairment of non–financial assets:
Non–financial assets other than deferred tax assets are reviewed for impairment whenever
events or changes in circumstances indicate that the carrying value may not be recoverable
and at each reporting date. An impairment loss is recognized for the amount by which the
asset’s carrying value exceeds its recoverable amount. The recoverable amount is the higher
of an asset’s fair value less costs to sell and value in use. Impairment losses are recognized
in net income.
Non–financial assets that have incurred impairment losses in prior years are reviewed for
possible reversal of the impairment loss at each reporting date. A reversal of impairment is
limited to the original impaired amount.
(k) Revenue recognition:
Loan interest and revenue is recognized on the effective yield basis.
(l) Foreign exchange:
The Consolidated Financial Statements are presented in Canadian dollars, which is
FirstOntario’s functional currency. Monetary assets and liabilities denominated in foreign
currencies, primarily US dollars, are translated into Canadian dollars at exchange rates
prevailing at the year–end. Fixed assets, intangible assets and investment property are
carried at the historical Canadian dollar cost. Income and expenses are translated at the
exchange rates in effect on the date of the transactions. Exchange gains and losses arising
on the translation of monetary assets and liabilities are included in other income. Foreign
currency differences arising on translation of available–for–sale equity investments and cash
flow hedges are recognized in other comprehensive income.
(m) Provisions:
A provision is recognised if, as a result of a past event, FirstOntario has a present legal or
constructive obligation that can be estimated reliably, and it is probable that an outflow of
economic benefits will be required to settle the obligation. Provisions are determined by
discounting the expected future cash flows at a pre–tax rate that reflects current market
assessments of the time value of money and the risks specific to the liability.

FIRSTONTARIO CREDIT UNION LIMITED Notes to Consolidated Financial Statements For the year ended August 31, 2013, with comparative information for 2012
18
3. Significant Accounting Policies (continued):
(n) Employee retirement benefits:
FirstOntario provides retirement benefits to certain employees. These benefits include
registered pension plans, medical benefits, dental care and life insurance.
A defined contribution plan is a pension plan under which FirstOntario pays contributions to a
separate entity. FirstOntario has no legal or constructive obligation to pay further
contributions after its payment of a contribution in accordance with the pension plan. Defined
contribution pension plan contributions are expensed in the year during which services are
rendered by employees.
A defined benefit plan is a pension plan that defines the amount of the pension benefit that an
employee will receive upon retirement, usually dependent on one or more factors, such as
age, years of service and compensation. Employment retirement benefits include both
pension and other post–retirement benefits.
The costs of defined benefit post–employment benefits (including medical benefits, dental
care, life insurance, and defined benefit pension plans) related to the employees' current
service is charged to income annually. The cost is computed on an actuarial basis using the
projected unit credit method estimating the usage frequency and cost of services covered
and management's best estimates of investment yields, salary escalation, and other factors.
Benefits are discounted to determine their present value based on the market yield, at the
reporting date, of high quality corporate bonds that have maturity dates approximating the
terms of the obligations. The fair value of plan assets is deducted in determining the net
obligation. FirstOntario recognizes all actuarial gains or losses by using the corridor method
to amortize actuarial gains or losses (such as changes in actuarial assumptions and
experience gains or losses) over the average remaining service life of active employees.
Under the corridor method, amortization is recorded only if the accumulated net actuarial
gains or losses exceed 10% of the greater of the accrued benefit obligation and the value of
the plan assets. The average remaining working lives of the active employees participating in
the defined benefit pension plans is 17 years. The average remaining service period of the
active employees covered by the other post–employment benefit plan is 7 years. Past service
costs are deferred and amortized on a straight line basis over the average period until the
benefits come vested. To the extent that the benefits vest immediately, the expense is
recognized immediately in net income.
When the restructuring of a benefit plan gives rise to a curtailment, the curtailment is
accounted for at the time of restructuring.
(o) Income taxes:
FirstOntario follows the asset and liability method of accounting for income taxes, whereby
FirstOntario recognizes both the current and future income tax consequences of all
transactions that have been recorded in the financial statements.
Current income taxes are the expected taxes refundable or payable on the taxable income for
the year, using tax rates enacted or substantively enacted at the balance sheet date, and any
adjustment to taxes payable in respect of previous years.
FIRSTONTARIO CREDIT UNION LIMITED Notes to Consolidated Financial Statements For the year ended August 31, 2013, with comparative information for 2012
19
3. Significant Accounting Policies (continued):
(o) Income taxes (continued):
Deferred income taxes provide for temporary differences between the carrying values of
assets and liabilities and the amounts used for taxation purposes. The amount of deferred
income tax provided is based on the expected timing of realization or settlement of the
carrying value of assets and liabilities, using tax rates enacted or substantively enacted at the
balance sheet date. A deferred income tax asset is recognized only to the extent that it is
probable that future taxable income will be available to utilize taxable benefits associated with
the temporary difference in carrying value.
Deferred tax assets and liabilities are included either in other assets or accounts payable and
accrued liabilities, as applicable, in the Consolidated Statement of Financial Position.
4. New Standards and Interpretations not yet effective:
Future changes in accounting policy
(a) Amendments to IAS 32 and IFRS 7, Offsetting Financial Assets and Liabilities
The amendments to IAS 32 clarify the allowable circumstances for an entity to present a
financial asset and liability as a net balance (‘offsetting’). The amendments also describe
when a settlement mechanism provides for net settlement or gross settlement that is
equivalent to net settlement.
The amendments to IFRS 7 contain new disclosure requirements for financial assets and
liabilities that are offset in the statement of financial position or subject to master netting
arrangements or similar arrangements.
FirstOntario intends to adopt the amendments to IFRS 7 in its financial statements for the
fiscal year beginning on September 1, 2013, and the amendments to IAS 32 in its financial
statements for the fiscal year beginning September 1, 2014 with the amendments applied
retrospectively. FirstOntario does not expect the amendments to have a material impact on
the financial statements.
(b) IFRS 10 Consolidated Financial Statements replaces the guidance in IAS 27 Consolidated
and Separate Financial Statements and SIC–12 Consolidation – Special Purpose Entities.
IAS 27 (2008) survives as IAS 27 (2011) Separate Financial Statements, only to carry
forward the existing accounting requirements for separate financial statements.
IFRS 10 provides a single model to be applied in the control analysis for all investees,
including entities that currently are special purpose entities (“SPE’s”) in the scope of SIC–12.
In addition, the consolidation procedures are carried forward substantially unmodified from
IAS 27 (2008). The changes are effective for fiscal years beginning on or after
January 1, 2013 and FirstOntario intends to adopt IFRS 10 in its financial statements for the
fiscal year beginning September 1, 2013. FirstOntario does not expect IFRS 10 to have a
material impact on the financial statements.
FIRSTONTARIO CREDIT UNION LIMITED Notes to Consolidated Financial Statements For the year ended August 31, 2013, with comparative information for 2012
20
4. New Standards and Interpretations not yet effective (continued):
(c) IFRS 11 Joint Arrangements replaces the guidance in IAS 31 Interests in Joint Ventures.
Under IFRS 11, joint arrangements are classified as either joint operations or joint ventures.
IFRS 11 adjusts the requirements for joint ventures structured through a separate vehicle and
requires that all joint ventures (as defined in the new standard) must use the equity method
(as opposed to either the equity method or proportionate consolidation). The changes are
effective for fiscal years beginning on or after January 1, 2013 and FirstOntario intends to
adopt the requirements of IFRS 11 in its financial statements for the fiscal year beginning
September 1, 2013. FirstOntario does not expect IFRS 11 to have a material impact on the
financial statements.
(d) IFRS 12 Disclosure of Interests in Other Entities contains disclosure requirements for entities
that have interests in subsidiaries, joint arrangements, associates and (or) unconsolidated
structured entities. Interests are widely defined as contractual and non–contractual
involvement that exposes an entity to variability of returns from the performance of the other
entity. The required disclosures aim to provide information in order to enable users to
evaluate the nature of, and the risks associated with, an entity’s interest in other entities, and
the effects of those interests on the entity’s financial position, financial performance and cash
flows.
The changes are effective for fiscal year beginning on or after January 1, 2013 and
FirstOntario intends to adopt IFRS 12 in its financial statements for the fiscal year beginning
on September 1, 2013. FirstOntario does not expect the amendments in disclosure
requirements to have a material impact on the financial statements, due to the nature of
FirstOntario’s interests in other entities.
(e) IFRS 13 Fair Value Measurement replaces the fair value measurement guidance contained in
individual IFRS’s with a single source of fair value measurement guidance. It defines fair
value as the price that would be received to sell an asset or paid to transfer a liability in an
orderly transaction between market participants at the measurement date. The standard also
establishes a framework for measuring fair value and outlines disclosure requirements for fair
value measurements to provide information that enables financial statement users to assess
the methods and inputs used to develop fair value measurements and, for recurring fair value
measurements that use significant unobservable inputs, the effect of the measurements on
comprehensive income. IFRS 13 explains ‘how’ to measure fair value when it is required or
permitted by other IFRS’s. IFRS 13 does not introduce new requirements to measure assets
or liabilities at fair value.
The changes are effective for fiscal years beginning on or after January 1, 2013 and
FirstOntario intends to adopt IFRS 13 prospectively in its financial statements for the fiscal
year beginning on September 1, 2013. The extent of the impact of adoption of IFRS 13 has
not yet been determined.
FIRSTONTARIO CREDIT UNION LIMITED Notes to Consolidated Financial Statements For the year ended August 31, 2013, with comparative information for 2012
21
4. New Standards and Interpretations not yet effective (continued):
(f) Amendments to IAS 28 Investments in Associates and Joint Ventures include the following:
New requirements relating to the method of recording associates and joint ventures that
are held for sale; and,
Disclosures relating to changes in interests held in associates and joint ventures.
The changes are effective for fiscal years beginning on or after January 1, 2013 and
FirstOntario intends to adopt IAS 28 prospectively in its financial statements for the fiscal year
beginning on September 1, 2013. The extent of the impact of adoption of IAS 28 has not yet
been determined.
(g) Amendments to IAS 19 Employee Benefits require the following:
Recognition of actuarial gains and losses immediately in other comprehensive income.
The corridor method will be eliminated and actuarial gains and losses are not transferred
to net income
Full recognition of past service costs immediately in net income
Recognition of expected return on plan assets in profit or loss to be calculated based on
the rate used to discount the defined benefit obligation
Additional disclosures that explain the characteristics of the entity’s defined benefit plans
and risks associated with the plans, as well as disclosures that describe how defined
benefit plans may affect the amount, timing and uncertainty of future cash flows, and
details of any asset–liability matching strategies used to manage risks.
The amendments also impact termination benefits, which would now be recognized at the
earlier of when the entity recognizes costs for a restructuring within the scope of IAS 37
Provisions, and when the entity can no longer withdraw the offer of the termination benefits.
The changes are effective for fiscal year beginning on or after January 1, 2013 and
FirstOntario intends to adopt the amendments in its financial statements for the fiscal year
beginning on September 1, 2013. The extent of the impact of adoption of these amendments
to the accrued benefit liability is estimated to increase the defined benefit pensions liability by
$1,351,000 and decrease other defined benefit pensions liability by $132,000. The net
actuarial gains and losses will be recorded through OCI as incurred. Management is
reviewing disclosure requirements related to these amendments.
(h) Novation of Derivatives and Continuation of Hedge Accounting (Amendments to IAS 39):
The amendments add a limited exception to IAS 39, to provide relief from discontinuing an
existing hedging relationship when a substitution of a derivative contract that was not
contemplated in the original hedging documentation meets specific criteria.
FirstOntario intends to adopt the amendments in its financial statements for the annual period
beginning September 1, 2014. The extent of the impact of adoption of the amendments has
not yet been determined.
FIRSTONTARIO CREDIT UNION LIMITED Notes to Consolidated Financial Statements For the year ended August 31, 2013, with comparative information for 2012
22
4. New Standards and Interpretations not yet effective (continued):
(i) IFRS 9 Financial Instruments (“IFRS 9”) replaces the guidance in IAS 39 Financial
Instruments: Recognition and Measurement, on the classification and measurement of
financial assets. The Standard eliminates the existing IAS 39 categories of held to maturity,
available–for–sale and loans and receivable.
Financial assets will be classified into one of two categories on initial recognition:
financial assets measured at amortized cost; or
financial assets measured at fair value.
Gains and losses on remeasurement of financial assets measured at fair value will be
recognized in net income, except that for an investment in an equity instrument which is not
held–for–trading, IFRS 9 provides, on initial recognition, an irrevocable election to present all
fair value changes from the investment in OCI. The election is available on an individual
share–by–share basis. Amounts presented in OCI will not be reclassified to net income at a
later date.
Under IFRS 9, for financial liabilities measured at fair value under the fair value option,
changes in fair value attributable to changes in credit risk will be recognized in OCI, with the
remainder of the change recognized in profit or loss. However, if this requirement creates or
enlarges an accounting mismatch in net income, the entire change in fair value will be
recognized in net income. Amounts presented in OCI will not be reclassified to net income at
a later date.
IFRS 9 also requires derivative liabilities that are linked to and must be settled by delivery of
an unquoted equity instrument to be measured at fair value, whereas such derivative
liabilities are measured at cost under IAS 39.
IFRS 9 also includes the requirements of IAS 39 for the derecognition of financial assets and
liabilities without change.The IASB has deferred the mandatory effective date of the existing
chapters of IFRS 9 to fiscal years beginning on or after January 1, 2015. The early adoption
of the standard is permitted.
FirstOntario intends to adopt IFRS 9 in its financial statements for its fiscal year beginning on
September 1, 2015. It is expected that IFRS 9, when initially applied, will have a significant
impact on FirstOntario’s financial statements. As well, the implementation and ability to elect
options provided by the new standards may be influenced by the regulators (DICO).

FIRSTONTARIO CREDIT UNION LIMITED Notes to Consolidated Financial Statements For the year ended August 31, 2013, with comparative information for 2012
23
5. Loans Receivable from Members:
Loans receivable from Members, which have been designated as loans and receivables, are as
follows:
(In thousands of dollars) 2013 2012
Residential Mortgage Loans $ 1,176,519 $ 973,833 Allowance for impaired loans (263) (199)
1,176,256 973,634
Personal Loans 143,658 143,252 Allowance for impaired loans (2,480) (2,339)
141,178 140,913
Commercial Loans 557,905 504,412 Allowance for impaired loans (3,514) (5,287)
554,391 499,125
$ 1,871,825 $ 1,613,672
Certain Residential Mortgage Loans are securitized and have been legally transferred to other
entities for funding purposes. These loans are administered by FirstOntario and recognized on
the Consolidated Statement of Financial Position to the extent of FirstOntario’s continuing
involvement. A summary of the carrying values of Residential Mortgage Loans is as follows:
(In thousands of dollars) 2013 2012
Loans held by FirstOntario $ 812,761 $ 651,669 Loans held by Securitization Trusts 363,758 322,164
$ 1,176,519 $ 973,833
Certain loans transferred to a funding partner transacted prior to the transition to IFRS are not
recorded on the Statement of Financial Position and are not included in the above figures. Further
details are provided in Note 8.
Interest income for the year is as follows:
(In thousands of dollars) 2013 2012
Residential Mortgage Loans $ 38,259 $ 32,885 Personal Loans 9,401 9,756 Commercial Loans 27,795 26,883
$ 75,455 $ 69,524

FIRSTONTARIO CREDIT UNION LIMITED Notes to Consolidated Financial Statements For the year ended August 31, 2013, with comparative information for 2012
24
5. Loans Receivable from Members (continued):
Total fees paid to third parties associated with lending activities capitalized in other assets were
$5,921,000 as at August 31, 2013 (2012 – $4,607,000). Charges amortized into interest expense
in respect of these fees was $1,910,000 during 2013 (2012 – $1,602,000).
The following summarizes FirstOntario’s loan portfolio by the contractual repricing or maturity
date, whichever is earlier: 2013 2012 Principal Average Principal Average (In thousands of dollars) Balance Yield Balance Yield
Floating $ 487,199 4.32% $ 433,241 4.29% Within 1 year 154,079 5.11% 190,989 5.56% Over 1 year 1,236,804 4.30% 997,267 4.66% 1,878,082 4.37% 1,621,497 4.67% Provision for loan losses (6,257) (7,825)
$ 1,871,825 $ 1,613,672
6. Allowance for Impaired Loans:
A summary of the allowance for impaired loans is as follows:
2013 2012
Residential
Mortgage Personal Commercial Collective
(In thousands of dollars) Loans Loans Loans Allowance Total Total
Balance at beginning of year $ 25 $ 845 $ 2,978 $ 3,977 $ 7,825 $ 5,603
Loans written off (20) (1,097) – – (1,117) (2,151)
Recoveries – 134 – – 134 105
Net provision for impaired loans 56 1,076 (2,060) 343 (585) 4,268
Balance at end of year $ 61 $ 958 $ 918 $ 4,320 $ 6,257 $ 7,825
A summary of impaired loans are as follows:
2013 2012
Residential
Mortgage Personal Commercial
(In thousands of dollars) Loans Loans Loans Total Total
Gross amount of loans identified as impaired $ 17,007 $ 2,075 $ 5,578 $ 24,660 $ 21,351
Related security less expected costs 16,946 1,117 4,660 22,723 17,503
Balance at end of year $ 61 $ 958 $ 918 $ 1,937 $ 3,848
FIRSTONTARIO CREDIT UNION LIMITED Notes to Consolidated Financial Statements For the year ended August 31, 2013, with comparative information for 2012
25
6. Allowance for Impaired Loans (continued):
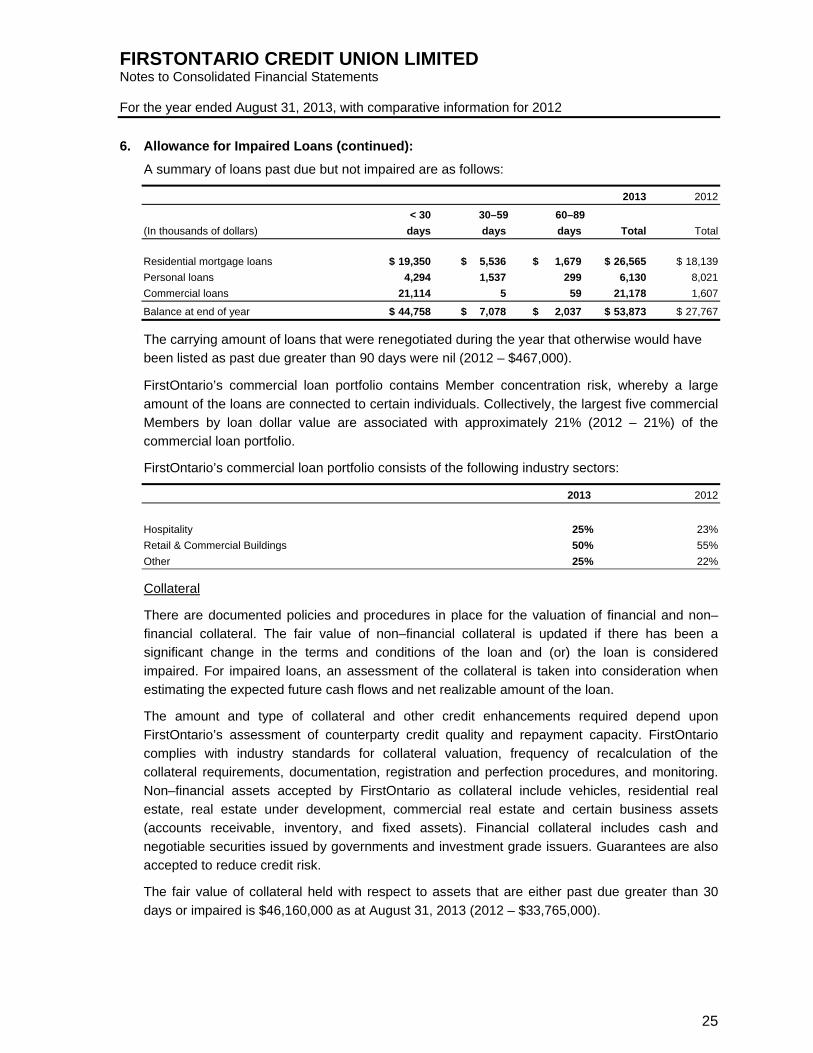
A summary of loans past due but not impaired are as follows:
2013 2012
< 30 30–59 60–89
(In thousands of dollars) days days days Total Total
Residential mortgage loans $ 19,350 $ 5,536 $ 1,679 $ 26,565 $ 18,139
Personal loans 4,294 1,537 299 6,130 8,021
Commercial loans 21,114 5 59 21,178 1,607
Balance at end of year $ 44,758 $ 7,078 $ 2,037 $ 53,873 $ 27,767
The carrying amount of loans that were renegotiated during the year that otherwise would have
been listed as past due greater than 90 days were nil (2012 – $467,000).
FirstOntario’s commercial loan portfolio contains Member concentration risk, whereby a large
amount of the loans are connected to certain individuals. Collectively, the largest five commercial
Members by loan dollar value are associated with approximately 21% (2012 – 21%) of the
commercial loan portfolio.
FirstOntario’s commercial loan portfolio consists of the following industry sectors:
2013 2012
Hospitality 25% 23%
Retail & Commercial Buildings 50% 55%
Other 25% 22%
Collateral
There are documented policies and procedures in place for the valuation of financial and non–
financial collateral. The fair value of non–financial collateral is updated if there has been a
significant change in the terms and conditions of the loan and (or) the loan is considered
impaired. For impaired loans, an assessment of the collateral is taken into consideration when
estimating the expected future cash flows and net realizable amount of the loan.
The amount and type of collateral and other credit enhancements required depend upon
FirstOntario’s assessment of counterparty credit quality and repayment capacity. FirstOntario
complies with industry standards for collateral valuation, frequency of recalculation of the
collateral requirements, documentation, registration and perfection procedures, and monitoring.
Non–financial assets accepted by FirstOntario as collateral include vehicles, residential real
estate, real estate under development, commercial real estate and certain business assets
(accounts receivable, inventory, and fixed assets). Financial collateral includes cash and
negotiable securities issued by governments and investment grade issuers. Guarantees are also
accepted to reduce credit risk.
The fair value of collateral held with respect to assets that are either past due greater than 30
days or impaired is $46,160,000 as at August 31, 2013 (2012 – $33,765,000).

FIRSTONTARIO CREDIT UNION LIMITED Notes to Consolidated Financial Statements For the year ended August 31, 2013, with comparative information for 2012
26
6. Allowance for Impaired Loans (continued):
The following tables illustrate the credit quality of loans that are neither past due nor impaired:
Credit quality of loans – August 31. 2013 Retail Mortgage and Personal Loans Commercial Loans
Rating % of Portfolio Rating % of Portfolio
Unscored 3% Undoubted 0% A+ 2% Superior 8% A 53% Satisfactory 81% B 22% Watch List 11% C 11% D 5% E 4%
Credit quality of loans – August 31, 2012 Retail Mortgage and Personal Loans Commercial Loans
Rating % of Portfolio Rating % of Portfolio
Unscored 4% Undoubted 0% A+ 2% Superior 6% A 52% Satisfactory 78% B 20% Watch List 16% C 11% D 6% E 5%
Refer to Note 16 – Financial Risk Management for a detailed explanation of the credit risk rating
process of both portfolios.
7. Cash and Cash Equivalents:
(In thousands of dollars) 2013 2012
Cash on hand $ 7,348 $ 6,995 Cash at Central 1 13,957 17,988 Restricted cash 1,784 1,980 Other cash and cash equivalents 187 142 Total cash and cash equivalents $ 23,276 $ 27,105
FIRSTONTARIO CREDIT UNION LIMITED Notes to Consolidated Financial Statements For the year ended August 31, 2013, with comparative information for 2012
27
8. Loan Securitizations:
FirstOntario enters into transactions in the normal course of business by which it transfers
recognized financial assets directly to third parties or SPE’s. FirstOntario securitizes mortgage
backed securities through programs sponsored by the Canada Mortgage and Housing
Corporation and other third party programs.
Full derecognition occurs when FirstOntario transfers its contractual right to receive cash flows
from the financial assets, or retains the right but assumes an obligation to pass on the cash flows
from the asset, and transfers substantially all the risks and rewards of ownership. The risks
include credit, interest rate, prepayment and other price risks.
The financial assets that do not qualify for derecognition are mortgages converted into mortgage
backed securities and then subsequently sold. Residential and commercial mortgages that have
been derecognized are those that meet the qualifications required to be derecognized under
IFRS.
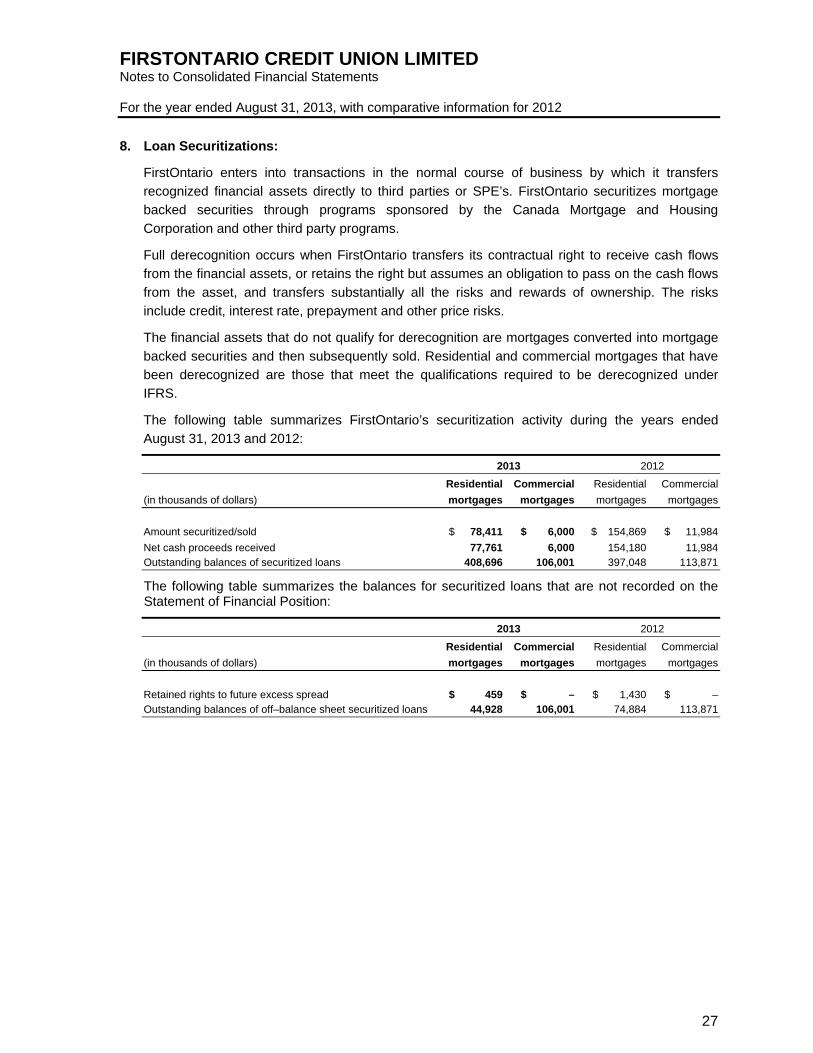
The following table summarizes FirstOntario’s securitization activity during the years ended
August 31, 2013 and 2012:
2013 2012
Residential Commercial Residential Commercial
(in thousands of dollars) mortgages mortgages mortgages mortgages
Amount securitized/sold $ 78,411 $ 6,000 $ 154,869 $ 11,984
Net cash proceeds received 77,761 6,000 154,180 11,984 Outstanding balances of securitized loans 408,696 106,001 397,048 113,871
The following table summarizes the balances for securitized loans that are not recorded on the Statement of Financial Position:
2013 2012
Residential Commercial Residential Commercial
(in thousands of dollars) mortgages mortgages mortgages mortgages
Retained rights to future excess spread $ 459 $ – $ 1,430 $ – Outstanding balances of off–balance sheet securitized loans 44,928 106,001 74,884 113,871

FIRSTONTARIO CREDIT UNION LIMITED Notes to Consolidated Financial Statements For the year ended August 31, 2013, with comparative information for 2012
28
8. Loan Securitizations (continued):
Retained rights are reported as investments on the Consolidated Statement of Financial Position
(Note 9). The following table summarizes the weighted average key assumptions at the date of
off–balance sheet securitization for retained rights related to mortgage pools sold prior to
September 1, 2010:
2013 2012
Residential Commercial Residential Commercial
mortgages mortgages mortgages mortgages
Average life 0.7 years na 1.6 years na
Prepayment rate 39.96% na 39.96% na
Excess spread 2.90% na 2.66% na
Discount rate 1.83% na 2.29% na
Expected credit losses 0.00% na 0.00% na
9. Investments:
Investments are as follows:
(In thousands of dollars) 2013 2012
Investments held to maturity Liquidity reserve deposits – Central 1 (c) $ 121,088 $ 106,255
Accrued interest 1,030 926 Investments available for sale, fair value
Preferred shares (a) 9 9 Common shares (a) 317 359 Income trusts and limited partnerships (a) 239 245
Total liquid investments 122,683 107,794
Investment held as fair value through profit and loss CUCO Cooperative Association (b) 5,972 6,003
Investments available for sale
Cost Shares – Central 1 (c) 11,177 9,865
Fair value Retained rights – loan securitizations 459 1,430
Real Estate Joint Ventures (d) 10,296 10,504 Other investments 284 249
$ 150,871 $ 135,845

FIRSTONTARIO CREDIT UNION LIMITED Notes to Consolidated Financial Statements For the year ended August 31, 2013, with comparative information for 2012
29
9. Investments (continued):
The following summarizes FirstOntario’s investments by the contractual repricing or maturity date,
whichever is earlier:
2013 2012 Carrying Average Carrying Average (In thousands of dollars) Amount Yield Amount Yield Within 1 year $ 21,453 2.29% $ 24,721 2.17% Over 1 year 99,635 1.91% 81,534 2.05% 121,088 1.98% 106,255 2.08% Non–rate sensitive 28,753 28,664 Accrued interest 1,030 926
$150,871 $135,845
(a) Financial instruments classified as AFS
The table below presents the income and losses of the financial assets classified as AFS.
(In thousands of dollars) 2013 2012
Interest and investment income $ 126 $ 19
Impairment loss recorded on common shares – (594)
Unrealized pre–tax income recognized in OCI 37 196
(b) CUCO Cooperative Association:
As a result of the merger between Credit Union Central of Ontario Limited (“CUCO”) and
Credit Union Central of British Columbia (“CUCBC”) to form Central 1 in 2008, member credit
unions were required to invest in a limited partnership (“ABCP LP”) in order to acquire third–
party asset–backed commercial paper (“ABCP”). Members of CUCO were required to
purchase units in the ABCP LP based on their proportionate asset size. FirstOntario was
required to purchase 6,667,059 units in the ABCP LP.
On August 31, 2011, the ABCP LP sold its assets to CUCO Cooperative Association (“CUCO
Co–op”) in consideration for CUCO Co–op Class B Investment shares. On the date of the
transfer, FirstOntario was issued 5.4% of the outstanding CUCO Co–op Class B investment
shares, equivalent to FirstOntario’s share of the fair value of the assets transferred by ABCP
LP. As a result, FirstOntario holds the same relative holdings under the current capital
structure of the CUCO Co–op as it did under the ABCP LP.
The CUCO Co–op is governed by a Board of Directors that was elected by Ontario member
credit unions and each member records its proportionate share of net income or loss in the
CUCO Co–op as determined in accordance with IFRS.

FIRSTONTARIO CREDIT UNION LIMITED Notes to Consolidated Financial Statements For the year ended August 31, 2013, with comparative information for 2012
30
9. Investments (continued):
(b) CUCO Cooperative Association (continued):
The fair value of these units is directly related to the ABCP investments held by the CUCO
Co–op. As there is no separately quoted market value for the underlying ABCP investments,
fair value of the underlying ABCP investments are determined by CUCO Co–op’s
independent valuator, Edenbrook Hill Capital Ltd. In determining fair value of these notes, the
CUCO Co–op used all available information, including interest rate, maturity dates and credit
ratings of the borrowers. Estimated yields that a hypothetical investor would require in order
to purchase the ABCP investments were developed and the net present value of the notes
were then calculated using this information. The recorded amount is the best estimate by the
valuator and could change significantly in the future. During the year a gain of $758,000
(2012 – $1,034,000) was recorded as a result of changes in fair value of the investment and
was included in unrealized gain (loss) on investments in the Consolidated Statement of
Income.
(c) Central 1 Shares:
As a member of Central 1, FirstOntario is required to maintain an investment in Central 1
shares equal to its share of the level of capital required by Central 1. FirstOntario’s share of
Central 1 capital requirements is based on asset size relative to other Class “A” members.
Central 1 rebalances their shares annually. During 2013, FirstOntario was required to
purchase 1,312,108 (2012 – 1,809,214) Central 1 Class A shares and received $97,000
(2012 – $110,000) in dividends. The following table summarizes the investment in Central 1
Shares as at August 31, 2013:
(In thousands of dollars) 2013 2012
6,018,810 Central 1 Class “A” Shares (2012 – 4,706,702) $ 6,019 $ 4,707
5,158,200 Central 1 Class “E” Shares (2012 – 5,158,200) 5,158 5,158 $ 11,177 $ 9,865
As there is no active market for these shares, the fair market value is not reliably
determinable as future cash flows cannot be adequately predicted with a standard valuation
technique. As a result, these shares are carried at cost. FirstOntario does not intend to
dispose of the shares in the near future.
Central 1 requires that member credit unions maintain with them liquidity and secondary
liquidity reserve deposits equal to 6% of the member credit union's assets. These reserve
deposits are determined on a quarterly basis and are classified as held to maturity.

FIRSTONTARIO CREDIT UNION LIMITED Notes to Consolidated Financial Statements For the year ended August 31, 2013, with comparative information for 2012
31
9. Investments (continued):
(d) Real Estate Joint Ventures:
FirstOntario periodically enters into agreements with third parties to jointly control retail
complexes. FirstOntario’s portion of the revenue and expenses from participation in the
ventures has been included in investment income as follows:
(In thousands of dollars) 2013 2012
Revenues $ 682 $ 1,572 Expenses 602 (1,021) Earnings from joint ventures $ 80 $ 551
The expenses of the joint ventures included amortization in the amount of $181,000 (2012 –
$272,000). Operating cash flow generated by the ventures was $241,000 (2012 –
$1,205,000). During the year, FirstOntario received $288,000 (2012 – $785,000) in
distributions from the ventures.
On April 9, 2012, FirstOntario sold its interest in certain joint ventures for the amount of
$17,402,000 to third parties. The carrying value of the ventures sold was $7,068,000,
resulting in a net gain of $10,334,000. The carrying value of the ventures sold included the
net book value of the investment properties of $6,473,000 as well as other net assets of
$595,000.
FirstOntario applies the cost model in accounting for investments in real estate. Costs include
initial acquisition costs and other costs incurred prior to the real estate being ready for its
intended use. Investment properties held under the ventures is as follows:
(In thousands of dollars) 2013 2012
Real estate held for investment purposes $ 10,505 $ 10,505 Accumulated amortization (438) (257) Net book value, August 31 $ 10,067 $ 10,248
Reconciliations of the net book value for investment properties are summarized below:
(In thousands of dollars) 2013 2012
Net book value at the beginning of the year $ 10,248 $ 16,993 Disposals – (6,473) Amortization (181) (272) Net book value at the end of the year $ 10,067 $ 10,248

FIRSTONTARIO CREDIT UNION LIMITED Notes to Consolidated Financial Statements For the year ended August 31, 2013, with comparative information for 2012
32
9. Investments (continued):
(d) Real Estate Joint Ventures (continued):
The net book value of investment properties is included as part of the real estate joint venture
investment of $10,296,000 (2012 – $10,504,000).
Fair value of the investment properties held through these investments was $14,150,000 as
at August 31, 2013 (2012 – $14,150,000). Fair value was determined by an experienced
registered independent appraiser having an appropriate recognized professional qualification.
Fair values were determined considering recent market transactions for similar properties in
the same location as FirstOntario’s investment property.
10. Fixed Assets:
(In thousands of dollars) 2013
Accumulated Net book Cost amortization value Land $ 1,281 $ – $ 1,281 Parking lots/Site improvements 662 479 183 Buildings 10,269 6,533 3,736 Equipment 18,099 13,473 4,626 Leasehold improvements 10,758 3,782 6,976 Tangible assets 41,069 24,267 16,802 Intangible assets (software) 12,447 11,769 678 Total fixed assets $ 53,516 $ 36,036 $ 17,480
(In thousands of dollars) 2012
Accumulated Net book Cost amortization value Land $ 1,510 $ – $ 1,510 Parking lots/Site improvements 703 473 230 Buildings 10,940 6,774 4,166 Equipment 16,459 12,486 3,973 Leasehold improvements 8,932 3,180 5,752 Tangible assets 38,544 22,913 15,631 Intangible assets (software) 12,176 11,428 748 Total fixed assets $ 50,720 $ 34,341 $ 16,379
Amortization in respect of the above assets for the year amounts to $2,450,000 (2012 –
$2,119,000).

FIRSTONTARIO CREDIT UNION LIMITED Notes to Consolidated Financial Statements For the year ended August 31, 2013, with comparative information for 2012
33
10. Fixed assets (continued):
Reconciliations of the net book value for each class of fixed asset are summarized below.
(In thousands of dollars) 2013 2012 Land Net book value at the beginning of the year $ 1,510 $ 1,939 Additions 22 – Disposals (251) (429) Net book value at the end of the year 1,281 1,510 Parking lots/Site improvements Net book value at the beginning of the year 230 193 Additions – 69 Disposals (15) – Amortization (32) (32) Net book value at the end of the year 183 230 Buildings Net book value at the beginning of the year 4,166 4,533 Additions 197 100 Disposals (344) (162) Amortization (283) (305) Net book value at the end of the year 3,736 4,166 Equipment Net book value at the beginning of the year 3,973 4,136 Additions 1,849 763 Disposals (5) – Amortization (1,191) (926) Net book value at the end of the year 4,626 3,973 Leasehold improvements Net book value at the beginning of the year 5,752 5,571 Additions 1,826 794 Amortization (602) (613) Net book value at the end of the year 6,976 5,752 Intangible assets (software) Net book value at the beginning of the year 748 498 Additions 272 493 Amortization (342) (243)
Net book value at the end of the year 678 748 Total net book value $ 17,480 $ 16,379
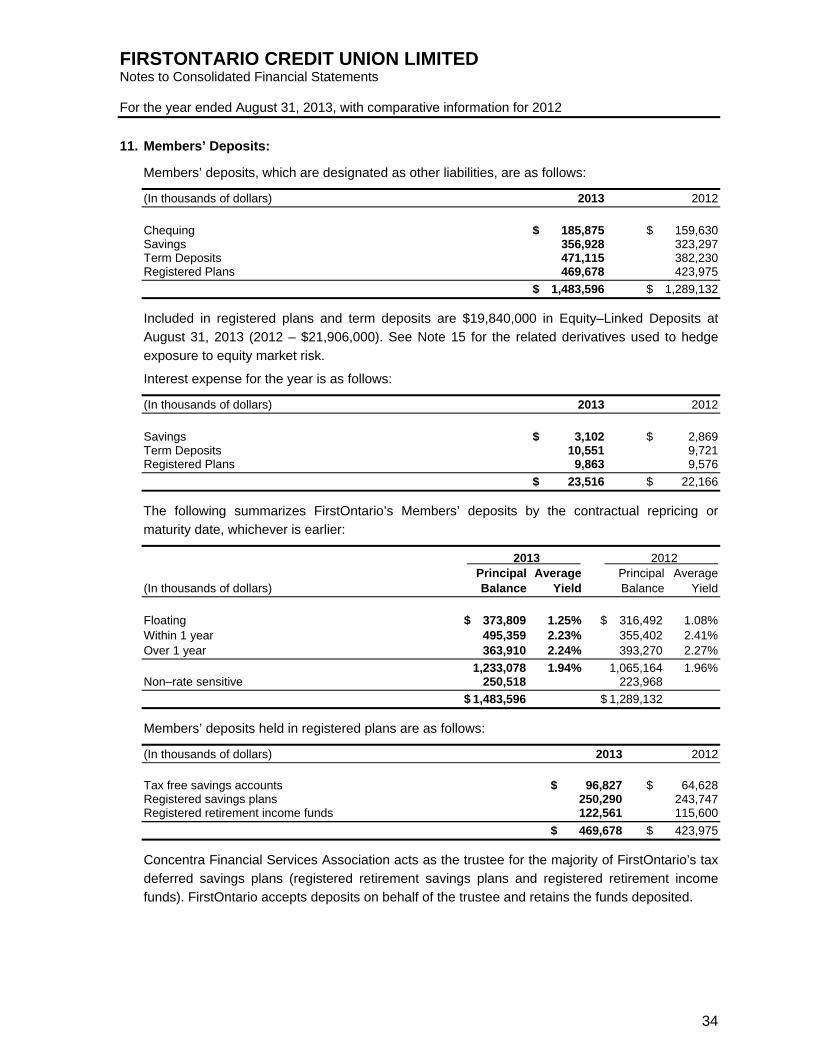
FIRSTONTARIO CREDIT UNION LIMITED Notes to Consolidated Financial Statements For the year ended August 31, 2013, with comparative information for 2012
34
11. Members’ Deposits:
Members’ deposits, which are designated as other liabilities, are as follows:
(In thousands of dollars) 2013 2012
Chequing $ 185,875 $ 159,630 Savings 356,928 323,297 Term Deposits 471,115 382,230 Registered Plans 469,678 423,975
$ 1,483,596 $ 1,289,132
Included in registered plans and term deposits are $19,840,000 in Equity–Linked Deposits at
August 31, 2013 (2012 – $21,906,000). See Note 15 for the related derivatives used to hedge
exposure to equity market risk.
Interest expense for the year is as follows:
(In thousands of dollars) 2013 2012
Savings $ 3,102 $ 2,869 Term Deposits 10,551 9,721 Registered Plans 9,863 9,576
$ 23,516 $ 22,166
The following summarizes FirstOntario’s Members’ deposits by the contractual repricing or
maturity date, whichever is earlier:
2013 2012 Principal Average Principal Average (In thousands of dollars) Balance Yield Balance Yield
Floating $ 373,809 1.25% $ 316,492 1.08% Within 1 year 495,359 2.23% 355,402 2.41% Over 1 year 363,910 2.24% 393,270 2.27%
1,233,078 1.94% 1,065,164 1.96% Non–rate sensitive 250,518 223,968
$ 1,483,596 $ 1,289,132
Members’ deposits held in registered plans are as follows:
(In thousands of dollars) 2013 2012
Tax free savings accounts $ 96,827 $ 64,628 Registered savings plans 250,290 243,747 Registered retirement income funds 122,561 115,600
$ 469,678 $ 423,975
Concentra Financial Services Association acts as the trustee for the majority of FirstOntario’s tax
deferred savings plans (registered retirement savings plans and registered retirement income
funds). FirstOntario accepts deposits on behalf of the trustee and retains the funds deposited.

FIRSTONTARIO CREDIT UNION LIMITED Notes to Consolidated Financial Statements For the year ended August 31, 2013, with comparative information for 2012
35
12. Membership and Investment Shares:
Authorized Share Capital
An unlimited number of membership shares. Such shares are issued for $5 each and Members
under the age of twenty–one must hold one membership share while those twenty–one and over
are required to hold at least five shares and increase their holdings of membership shares to
thirty shares over a twenty–five year period. Membership shares are redeemable, on withdrawal
from membership, at the amount paid thereon provided the credit union is meeting the “capital
adequacy” requirements (see Note 13) and they rank junior to Class A and Class B special
shares for priority in the payment of dividends.
An unlimited number of Class A and Class B special shares. Such shares are generally non–
voting and non–participating with non–cumulative dividend entitlements. In respect of dividends,
both classes rank senior to the membership shares and the Class B special shares rank ahead of
the Class A special shares.
The Board of Directors has authorized a Series 1, Series 2, and Series 2010 for Class B special
shares (“investment shares”). The investment shares have an issue price of $1 each and are
entitled to receive dividends if, as and when declared by the Board of Directors. Series 1 and
Series 2 investment shares are redeemable at the holder’s request. Series 2010 investment
shares are redeemable at the sole and absolute discretion of the Board of Directors starting in
2015. In any year, redemptions are restricted to 10% of the respective series of the outstanding
investment shares.
Issued and Outstanding
Membership shares and Series 1 and 2 investment shares are designated as other liabilities and
dividends are recorded using the effective interest rate method. Series 2010 investment shares
are classified as equity as these shares are redeemable at the sole and absolute discretion of the
Board of Directors.
(In thousands of dollars) 2013 2012
Membership shares:
1,291,702 (2012 – 1,247,560) Membership Shares $ 6,459 $ 6,238
Investment shares:
5,473,779 (2012 – 5,407,473) Class B, Series 1,Special Shares 5,474 $ 5,407
6,818,892 (2012 – 6,667,052) Class B, Series 2, Special Shares 6,819 6,667
Investment shares classified as liabilities 12,293 12,074 36,686,639 (2012 – 34,903,759)
Class B, Series 2010, Special Shares 36,440 34,657
$ 48,733 $ 46,731

FIRSTONTARIO CREDIT UNION LIMITED Notes to Consolidated Financial Statements For the year ended August 31, 2013, with comparative information for 2012
36
12. Membership and Investment Shares (continued):
Dividends
Dividends earned by membership and investment shares classified as liabilities and expensed on
the Consolidated Statement of Income were as follows:
(In thousands of dollars) 2013 2012
Membership shares $ 456 $ 448 Series 1 and 2 investment shares 413 420
Dividends on membership and investment shares $ 869 $ 868 Dividends on Series 2010 shares (classified as equity) $ 1,920 $ 1,816
On January 23, 2013, the Board of Directors approved the issue of 361,625 Series 1 and 2
investment shares in payment of a dividend for the year from December 1, 2011 to November 30,
2012.
On October 29, 2012, the Board of Directors approved the issue of 1,919,766 Series 2010
investment shares in payment of a dividend for the year from September 1, 2011 to August 31,
2012.
On January 25, 2012, the Board of Directors approved the issue of 394,823 Series 1 and 2
investment shares in payment of a dividend for the year from December 1, 2010 to November 30,
2011.
On October 26, 2011, the Board of Directors approved the issue of 1,815,595 Series 2010
investment shares in payment of a dividend for the year from September 1, 2010 to August 31,
2011.
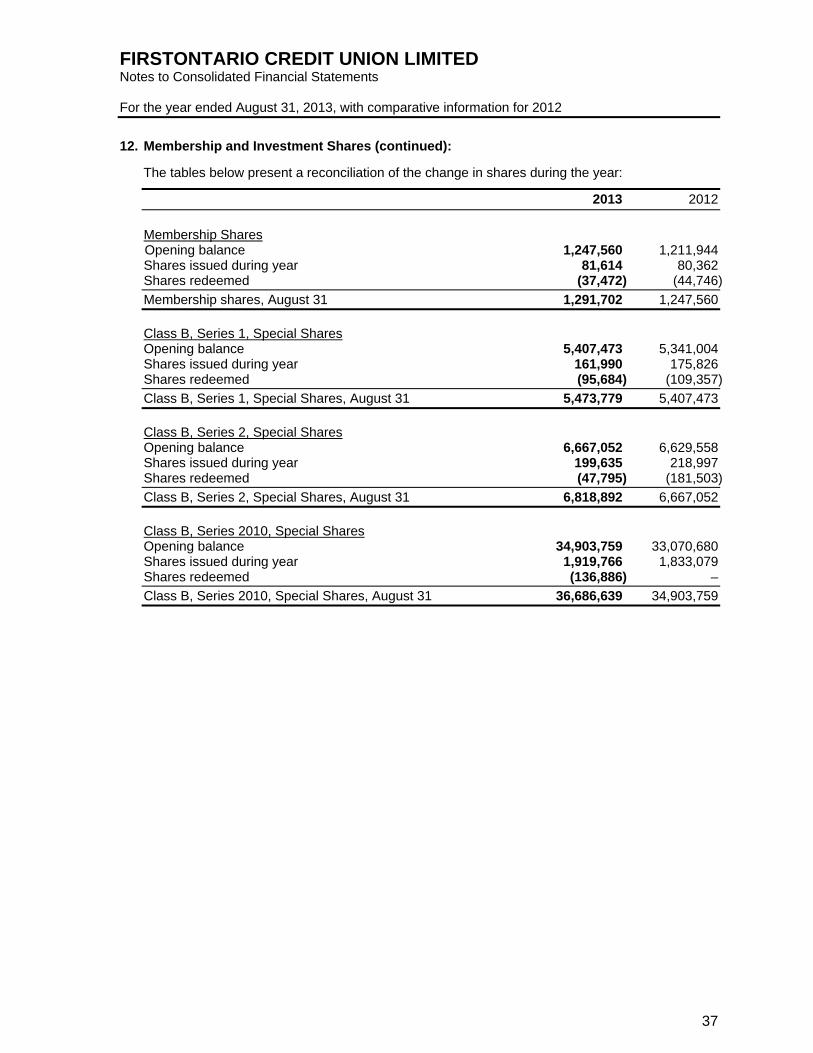
FIRSTONTARIO CREDIT UNION LIMITED Notes to Consolidated Financial Statements For the year ended August 31, 2013, with comparative information for 2012
37
12. Membership and Investment Shares (continued):
The tables below present a reconciliation of the change in shares during the year:
2013 2012
Membership Shares Opening balance 1,247,560 1,211,944 Shares issued during year 81,614 80,362 Shares redeemed (37,472) (44,746)
Membership shares, August 31 1,291,702 1,247,560 Class B, Series 1, Special Shares Opening balance 5,407,473 5,341,004 Shares issued during year 161,990 175,826 Shares redeemed (95,684) (109,357)
Class B, Series 1, Special Shares, August 31 5,473,779 5,407,473
Class B, Series 2, Special Shares Opening balance 6,667,052 6,629,558 Shares issued during year 199,635 218,997 Shares redeemed (47,795) (181,503)
Class B, Series 2, Special Shares, August 31 6,818,892 6,667,052 Class B, Series 2010, Special Shares Opening balance 34,903,759 33,070,680 Shares issued during year 1,919,766 1,833,079 Shares redeemed (136,886) –
Class B, Series 2010, Special Shares, August 31 36,686,639 34,903,759

FIRSTONTARIO CREDIT UNION LIMITED Notes to Consolidated Financial Statements For the year ended August 31, 2013, with comparative information for 2012
38
13. Regulatory Reporting and Disclosure:
(a) Capital Management:
FirstOntario maintains policies and procedures relative to capital management so as to
ensure that capital levels are sufficient to cover risks inherent in the business.
FirstOntario’s objectives when managing capital are:
(i) To ensure that the quantity, quality and composition of capital required reflects the
inherent risks of FirstOntario and to support the current and planned operations and
portfolio growth.
(ii) To provide a basis for confidence among Members, depositors, creditors and
regulatory agencies.
(iii) To ensure that FirstOntario maintains a level of capital that sufficiently protects
against unanticipated losses and to comply with the minimum regulatory capital
requirements set out in the Act.
Regulatory capital is calculated as a percentage of total assets and of risk–weighted assets.
Risk–weighted assets are calculated by applying risk weight percentages, as prescribed by
the Act, to various asset categories, operational and interest rate risk criteria. The prescribed
risk weights are dependent upon the degree of risk associated with the asset.
FirstOntario manages its Tier 1 and Tier 2 capital in accordance with internal policies and
regulatory requirements. Tier 1 capital is the highest quality and consists of retained earnings,
accumulated other comprehensive losses, membership shares and the portion of the value of
Class B investment shares that are not redeemable within 12 months. Tier 2 capital is
comprised of the value of Class B investment shares ineligible as Tier 1 capital and the
eligible portion of the allowance for impaired loans.

FIRSTONTARIO CREDIT UNION LIMITED Notes to Consolidated Financial Statements For the year ended August 31, 2013, with comparative information for 2012
39
13. Regulatory Reporting and Disclosure (continued):
(a) Capital Management (continued):
The amount and composition of Tier 1 and Tier 2 capital were as follows, adjusted for the
implementation of IFRS:
(In thousands of dollars) 2013 2012
Tier 1 Capital Retained earnings $ 67,658 $ 61,738 Contributed surplus 645 645 Membership shares 6,459 6,238 Class B Investment Shares,
Series 1 (90%) 4,927 4,866 Class B Investment Shares,
Series 2 (90%) 6,137 6,000 Class B Investment Shares,
Series 2010 (100%) 36,440 34,658 Total Tier 1 Capital 122,266 114,145 Tier 2 Capital Class B Investment Shares, Series 1 (10%) 547 541 Class B Investment Shares, Series 2 (10%) 682 667 Accumulated other comprehensive gains on AFS investments 66 35 Collective allowance for impaired loans 4,320 3,977 Total Tier 2 Capital 5,615 5,220 Total Regulatory Capital $ 127,881 $ 119,365
Under the Regulations of the Act, FirstOntario must maintain minimum levels of regulatory
capital. The leverage ratio calculates regulatory capital as a percentage of assets. The risk–
weighted capital ratio calculates regulatory capital as a percentage of risk–weighted assets.
FirstOntario complied with these requirements as follows:
Regulatory Leverage Ratio Risk–Weighted Capital Ratio Capital Minimum Actual (IFRS) Minimum Actual (IFRS)
2013 $127,881,000 4.00% 6.16% 8.00% 11.61%
2012 $119,365,000 4.00% 6.61% 8.00% 12.21%

FIRSTONTARIO CREDIT UNION LIMITED Notes to Consolidated Financial Statements For the year ended August 31, 2013, with comparative information for 2012
40
13. Regulatory Reporting and Disclosure (continued):
(b) Remuneration of officers and employees:
The Act requires disclosure of the five highest paid officers and employees of FirstOntario
where total remuneration exceeds $150,000. The names, positions and remuneration paid
during 2013 of those officers and employees are as follows:
Salary Bonuses* Benefits Total Kelly McGiffin, Chief Executive Officer $ 463,000 $ – $ 40,000 $ 503,000 Barry Doan, Chief Financial Officer 255,000 55,000 36,000 346,000 David Schurman, Chief Operating Officer 258,000 47,000 33,000 338,000 Lloyd Smith, Chief Risk Officer 226,000 44,000 35,000 305,000 James Olson, Chief Administration Officer 227,000 41,000 31,000 299,000
*Bonuses paid during 2013 were earned during 2012
Remuneration is fair and competitive and is targeted to be in the 50th percentile of similar
positions in credit unions of equal asset size. FirstOntario actively participates in
compensation surveys to ensure alignment with the market and employs third party
compensation consultants to provide more independence to the process.
Executive compensation is reviewed and approved by the Board on an annual basis. As part
of this review, the Board considers market expectations and projections of changes for
comparable positions using, where available, independent, competent and relevant sources.
During the year the Board reviewed the compensation arrangements of the Chief Financial
Officer (CFO), Chief Operating Officer (COO), Chief Risk Officer (CRO), Chief Administration
Officer (CAO) and Chief Information Officer (CIO). As a result of this formal review, taking
into consideration the long term goals of FirstOntario and the compensation arrangement of
the President and Chief Executive Officer since September 1, 2010, the Board amended the
compensation arrangement effective September 1, 2012. A greater proportion of Executive
compensation was allocated to salary rather than a short term bonus program to ensure the
Executive considers the long term health of FirstOntario. This allows for the Board through
the President and Chief Executive Officer to measure the performance of the Executive team
across a broader set of criteria, with equal accountability for all areas of the Credit Union’s
health and growth.

FIRSTONTARIO CREDIT UNION LIMITED Notes to Consolidated Financial Statements For the year ended August 31, 2013, with comparative information for 2012
41
13. Regulatory Reporting and Disclosure (continued):
(c) Related party transactions:
FirstOntario’s related parties include:
(i) All members of the Board, Officers and Executives of FirstOntario.
(ii) FirstOntario’s subsidiary (1320828 Ontario Limited) and joint ventures noted in
Note 9. As at August 31, 2013, no balances (2012 – nil) existed between FirstOntario
and these related parties.
(iii) Defined benefit plans that are referred to in Note 18. FirstOntario’s transactions with
the plans include contributions paid in to the plans. FirstOntario also pays for the
expenses of the employee defined contribution plan. FirstOntario has not entered into
other transactions with the defined benefit plans.
The following table outlines remuneration of members of the Board, Officers and Executives:
(In thousands of dollars) 2013 2012
Salaries, bonuses, and other short–term employee benefits $ 1,953 $ 1,550 Post–employment benefits 110 94 Directors’ remuneration 207 191 Total Compensation $ 2,270 $ 1,835
Related party balances as at August 31 are outlined in the following table:
(In thousands of dollars) 2013 2012
Loans Residential Mortgages $ 2,130 $ 2,670 Personal Loans 80 196 Commercial Loans – 41 Accrued interest 2 2 Deposits and Shares Deposits 1,902 1,786 Membership Shares 3 3 Investment Shares 100 114 Accrued interest 151 9
Total interest revenue derived from lending activity relating to key management personnel was $62,000 (2012 – $113,000) during the year. Total interest expense from deposit–taking activity from related parties was $168,000 (2012 – $66,661) during the year. During 2013 and 2012, no loans held by related parties were impaired.

FIRSTONTARIO CREDIT UNION LIMITED Notes to Consolidated Financial Statements For the year ended August 31, 2013, with comparative information for 2012
42
14. Loans Payable:
The following table details loans payable to Central 1 and our funding partners. Security pledged
is set out in Note 20(c). All loans payable are classified as other liabilities.
(In thousands of dollars) 2013 2012
Central 1 Credit Facilities Term loan facilities, bearing a variable weighted average interest rate of 1.79% (2012 – 1.75%)
due within one year $ 74,000 $ 56,000 Overdraft facility, bearing a variable interest rate
of 1.75%, payable on demand 2,443 – Securitization Debt Canada Mortgage Bond bullet bonds, secured
by residential mortgages, bearing a weighted average fixed interest rate of 2.82% (2012 – 2.82%), weighted average maturity date of 2016 (2012 – 2016) 94,140 94,092
Mortgage Backed Securities secured by
residential mortgage loans, bearing a weighted average fixed interest rate of 2.34%
(2012 – 2.50%), expected weighted average maturity date of 2018 (2012 – 2016) 249,549 201,658 Mortgage Backed Securities secured by
residential mortgage loans, bearing a weighted average variable interest rate of 1.79%
(2012 – 1.78%), expected weighted average maturity date of 2017 (2012 – 2016) 21,683 24,074
$ 441,815 $ 375,824
Interest expense associated with loans payable during the year consisted of the following:
(In thousands of dollars) 2013 2012
Term loans $ 374 $ 378 Securitization of residential mortgages 9,734 7,336
$ 10,108 $ 7,714
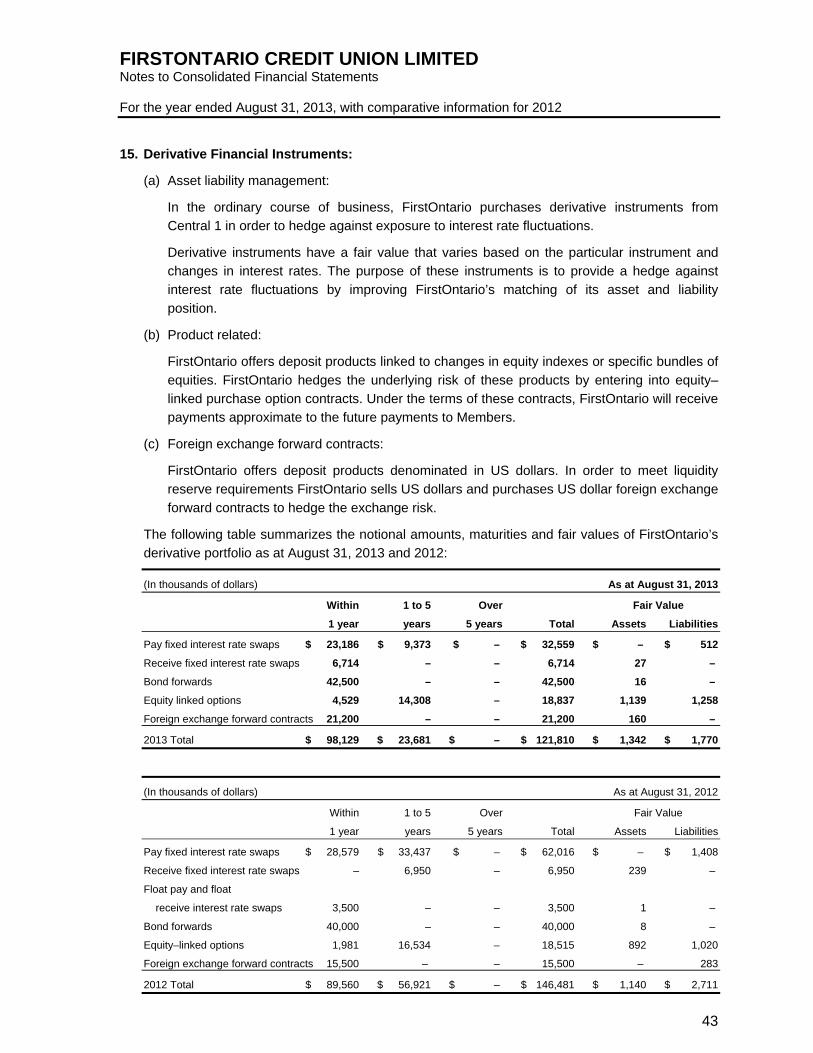
FIRSTONTARIO CREDIT UNION LIMITED Notes to Consolidated Financial Statements For the year ended August 31, 2013, with comparative information for 2012
43
15. Derivative Financial Instruments:
(a) Asset liability management:
In the ordinary course of business, FirstOntario purchases derivative instruments from
Central 1 in order to hedge against exposure to interest rate fluctuations.
Derivative instruments have a fair value that varies based on the particular instrument and
changes in interest rates. The purpose of these instruments is to provide a hedge against
interest rate fluctuations by improving FirstOntario’s matching of its asset and liability
position.
(b) Product related:
FirstOntario offers deposit products linked to changes in equity indexes or specific bundles of
equities. FirstOntario hedges the underlying risk of these products by entering into equity–
linked purchase option contracts. Under the terms of these contracts, FirstOntario will receive
payments approximate to the future payments to Members.
(c) Foreign exchange forward contracts:
FirstOntario offers deposit products denominated in US dollars. In order to meet liquidity
reserve requirements FirstOntario sells US dollars and purchases US dollar foreign exchange
forward contracts to hedge the exchange risk.
The following table summarizes the notional amounts, maturities and fair values of FirstOntario’s
derivative portfolio as at August 31, 2013 and 2012:
(In thousands of dollars) As at August 31, 2013
Within 1 to 5 Over Fair Value
1 year years 5 years Total Assets Liabilities
Pay fixed interest rate swaps $ 23,186 $ 9,373 $ – $ 32,559 $ – $ 512
Receive fixed interest rate swaps 6,714 – – 6,714 27 –
Bond forwards 42,500 – – 42,500 16 –
Equity linked options 4,529 14,308 – 18,837 1,139 1,258
Foreign exchange forward contracts 21,200 – – 21,200 160 –
2013 Total $ 98,129 $ 23,681 $ – $ 121,810 $ 1,342 $ 1,770
(In thousands of dollars) As at August 31, 2012
Within 1 to 5 Over Fair Value
1 year years 5 years Total Assets Liabilities
Pay fixed interest rate swaps $ 28,579 $ 33,437 $ – $ 62,016 $ – $ 1,408
Receive fixed interest rate swaps – 6,950 – 6,950 239 –
Float pay and float
receive interest rate swaps 3,500 – – 3,500 1 –
Bond forwards 40,000 – – 40,000 8 –
Equity–linked options 1,981 16,534 – 18,515 892 1,020
Foreign exchange forward contracts 15,500 – – 15,500 – 283
2012 Total $ 89,560 $ 56,921 $ – $ 146,481 $ 1,140 $ 2,711

FIRSTONTARIO CREDIT UNION LIMITED Notes to Consolidated Financial Statements For the year ended August 31, 2013, with comparative information for 2012
44
15. Derivative Financial Instruments (continued):
Notional amounts are the contract amounts used to calculate the cash flows to be exchanged.
They are a common measure of the volume of outstanding transactions, but do not represent
credit or market risk exposure. Notional amounts, other than foreign exchange forward contracts,
are not exchanged.
FirstOntario is exposed to credit risk which arises from the possibility that a counterparty to a
derivative contract could default on their obligation to FirstOntario. However, credit risk
associated with derivative contracts is normally a small fraction of the notional principal amount of
the contract. Derivative contracts expose FirstOntario to loss only if changes in market rates
cause a material unfavourable affect on a counterparty’s position, which could then lead to the
counterparty defaulting on its payment. FirstOntario only enters into derivative contracts with
counterparties that FirstOntario has determined to be creditworthy.
16. Financial Risk Management:
The Board of Directors (the "Board”) has overall responsibility for the establishment and oversight
of FirstOntario’s risk management framework. The Board has delegated to the Audit Committee
the responsibility for the development and monitoring of risk management policies. The Audit
Committee reports regularly to the Board on its activities.
All risk management policies and established limits ensure that FirstOntario is in full adherence to
the regulatory requirements prescribed in the Act as well as DICO’s standards of Sound Business
and Financial Practices. The Board receives reports from management on FirstOntario’s
exposure to credit, interest rate, liquidity, foreign currency and other price risk regularly in order to
monitor financial risks.
(a) Credit Risk:
Credit risk is the potential for financial loss to FirstOntario if a borrower or guarantor fails to
meet payment obligations in accordance with agreed terms. FirstOntario’s financial assets
that are affected by credit risk include loans receivable from Members, investments, and
derivative financial instruments. Credit risk is one of the most significant financial risks to
FirstOntario.
FirstOntario’s primary objective when managing credit risk is to ensure a portfolio of high
quality financial assets properly diversified so as to balance the risk associated with the
portfolio and return on assets.
Credit risk is managed in accordance with the Credit Risk Management Policy for loans
receivable from Members and the Market Risk Management Policy for investments and
derivative financial instruments.

FIRSTONTARIO CREDIT UNION LIMITED Notes to Consolidated Financial Statements For the year ended August 31, 2013, with comparative information for 2012
45
16. Financial Risk Management (continued):
(a) Credit Risk (continued):
For loans receivable from Members, credit risk is managed through an infrastructure based
upon:
(i) Approval by the Board of all credit risk management policies;
(ii) Approval by the Vice President Credit of the discretionary limits of lending officers
throughout FirstOntario;
(iii) Credit adjudication subject to compliance with established policies, exposure
guidelines and discretionary limits, as well as adherence to established standards of
credit assessment. Credit approvals are escalated to the Management Credit
Committee and ultimately to the Board dependent upon credit exposure level and
restricted party transactions;
(iv) The Credit Department is charged with oversight of the following:
a. The establishment of guidelines to monitor and limit concentrations in the
portfolios in accordance with Board approved policies governing regulatory
requirements, industry risk and group exposures;
b. The development and implementation of credit risk models and policies for
establishing borrower risk ratings to quantify and monitor the level of risk and
facilitate management of retail and commercial credit;
c. Implementation of an ongoing monitoring process of the key risk factors used in
FirstOntario credit risk models.
Management has designed and implemented an effective system to measure, monitor and
report credit risk exposure. Management reports credit risk exposure to the Board regularly.
In conducting lending activities, FirstOntario diversifies its portfolio of loans receivable from
Members in order to reduce overall credit risk. Residential mortgage and personal loans are
diversified between authorized loan types, forms of security and certain sectoral groupings.
Commercial loans are diversified through the establishment of credit exposure limits for
specific industry sectors, groups of related borrowers and geographic location.
Credit exposure is assessed through the following:
(i) Probability of default, which is an estimate of probability that a Member with a certain
borrower risk rating, will default within a one year time horizon.
(ii) Loss given default, which represents the unsecured portion expected to be lost when
a borrower defaults.

FIRSTONTARIO CREDIT UNION LIMITED Notes to Consolidated Financial Statements For the year ended August 31, 2013, with comparative information for 2012
46
16. Financial Risk Management (continued):
(a) Credit Risk (continued):
Credit risk rating systems are designed to assess and quantify the risk inherent in credit
activities in an accurate and consistent manner as follows:
(i) Commercial loans are principally assessed based on the Member’s ability to service
debt (debt service coverage ratio) and the secured amount (loan to value ratio).
Management regularly reviews the commercial loan portfolio and assesses the credit
risk associated with each loan.
(ii) Automated credit scoring systems are used in assessing credit risk associated with
residential mortgage and personal loans. These loans are managed as pools of
homogeneous risk exposures using internal benchmarks based upon Equifax
Beacon Score’s. These global standard credit scores track each individual’s past
credit history and, using a mathematical model, predicts how likely a person is to
repay a loan.
For investments and derivative financial instruments, risk is measured by reviewing exposure
to individual counterparties to ensure the assets are within the policy limit by issuer
weightings and by dollar amount. The quality of the counterparties is assessed through
published credit rating agencies.
Except as noted, the carrying amount of financial assets recorded in the financial statements
represents FirstOntario’s maximum exposure to credit risk without taking into account the
value of any collateral obtained. FirstOntario is also exposed to credit risk through
transactions which are not recognized in the Consolidated Statement of Financial Position,
such as granting financial guarantees and extending loan commitments. Refer to Note 20 for
further details. The risk of losses from loans undertaken is reduced by the nature and quality
of collateral obtained. Refer to Note 6 for a description of the nature of the security held
against loans as at the date of the Consolidated Statement of Financial Position.
(b) Interest Rate Risk:
Interest rate risk is the risk that the future cash flows of a financial instrument will fluctuate
because of changes in market interest rates. FirstOntario is exposed to interest rate risk
when entering into banking transactions with Members, primarily deposit and lending
activities.
FirstOntario’s exposure to interest rate risk depends on the size and direction of interest rate
changes, and on the size and maturity of mismatched positions. An interest–sensitive asset
or liability is repriced when market interest rates change, when there is cash flow from final
maturity, normal amortization, or when Members exercise prepayment, conversion or
redemption options are offered for the specific product.
Interest rate risk is managed in accordance with the Structural Risk Management Policy. The
Board delegates the responsibility to manage interest rate risk on a day–to–day basis to
management.

FIRSTONTARIO CREDIT UNION LIMITED Notes to Consolidated Financial Statements For the year ended August 31, 2013, with comparative information for 2012
47
16. Financial Risk Management (continued):
(b) Interest Rate Risk (continued):
FirstOntario’s Structural Risk Management Policy includes:
(i) Guidelines and limits on the structuring of the maturities, price and mix of deposits,
loans, mortgages and investments and the management of cash flows derived from
financial assets in relation to liabilities.
(ii) Guidelines and limits on the use of derivative products to hedge against changes in
cash flows as a result of changes in interest rates.
The following table summarizes carrying amounts of Consolidated Statement of Financial
Position assets, liabilities and equity, and derivative instruments to arrive at FirstOntario’s
interest rate gap based on the earlier of contractual re–pricing and maturity dates:
(In thousands of dollars) As at August 31, 2013
Within 3 Months 1 to 5 Over Non Interest
3 Months to 1 Year Years 5 years Sensitive Total
Assets
Loans receivable $ 564,603 $ 70,418 $ 1,231,670 $ 5,134 $ – $ 1,871,825
Cash – – – – 23,276 23,276
Investments 7,742 13,711 99,635 – 29,783 150,871
Other – 285 187 870 31,113 32,455
572,345 84,414 1,331,492 6,004 84,172 2,078,427
Liabilities and equity
Deposits 536,787 332,381 363,910 – 250,518 1,483,596
Loans 102,477 26,768 312,570 – – 441,815
Other 122 237 1,411 – 151,246 153,016
639,386 359,386 677,891 – 401,764 2,078,427
Gap – Financial Position (67,041) (274,972) 653,601 6,004 (317,592) –
Gap – Derivatives and
net securitization gap (15,946) 22,671 (6,725) – – –
Interest rate gap 2013 $ (82,987) $ (252,301) $ 646,876 $ 6,004 $ (317,592) $ –

FIRSTONTARIO CREDIT UNION LIMITED Notes to Consolidated Financial Statements For the year ended August 31, 2013, with comparative information for 2012
48
16. Financial Risk Management (continued):
(b) Interest Rate Risk (continued):
(In thousands of dollars) As at August 31, 2012
Within 3 Months 1 to 5 Over Non Interest
3 Months to 1 Year Years 5 years Sensitive Total
Assets
Loans receivable $ 484,196 $ 132,209 $ 991,580 $ 5,687 $ – $ 1,613,672
Cash – – – – 27,105 27,105
Investments 6,370 18,351 81,534 – 29,590 135,845
Other – 23 246 871 27,871 29,011
490,566 150,583 1,073,360 6,558 84,566 1,805,633
Liabilities and equity
Deposits 417,277 254,617 393,234 36 223,968 1,289,132
Loans 86,307 22,775 266,742 – – 375,824
Other 309 273 2,129 – 137,966 140,677
503,893 277,665 662,105 36 361,934 1,805,633
Gap – Financial Position (13,327) (127,082) 411,255 6,522 (277,368) –
Gap – Derivatives and
net securitization gap (17,918) 7,588 10,330 – – –
Interest rate gap 2012 $ (31,245) $ (119,494) $ 421,585 $ 6,522 $ (277,368) $ –
Key metrics involved in management of interest rate risk include the use of Earnings at Risk
(“EaR”) and Economic Value of Equity at Risk (“EVEaR”). EaR is defined as the change in
the net interest income from a 100 basis point (“bps”) shock to interest rates. This exposure is
measured over a 12 month period. EVEaR is defined as the difference in the change in the
present value of the asset portfolio and the change in the present value of the liability
portfolio, including off–Statement of Financial Position instruments, resulting from a 100 bps
interest rate shock.
The following table summarizes the EaR and EVEaR as follows:
(In thousands of dollars) 2013 2012
EaR $ – $ 595
EVEaR 2.87% 0.0%
Fair Value Hedges
FirstOntario has designated certain hedging relationships involving amortizing interest rate
swaps that convert fixed rate commercial loans to floating rates as fair value hedges in
accordance with IAS 39 Financial Instruments: Recognition and Measurement. Losses for the
year relating to fair value hedging relationships from hedging instruments was $727,000
(2012 – $1,372,000) and $1,323,000 (2012 – $1,027,000) for the hedged items. Fair values
of the interest rate swaps involved in these hedges at the end of the year was a liability of
$494,000 (2012 – $1,221,000).
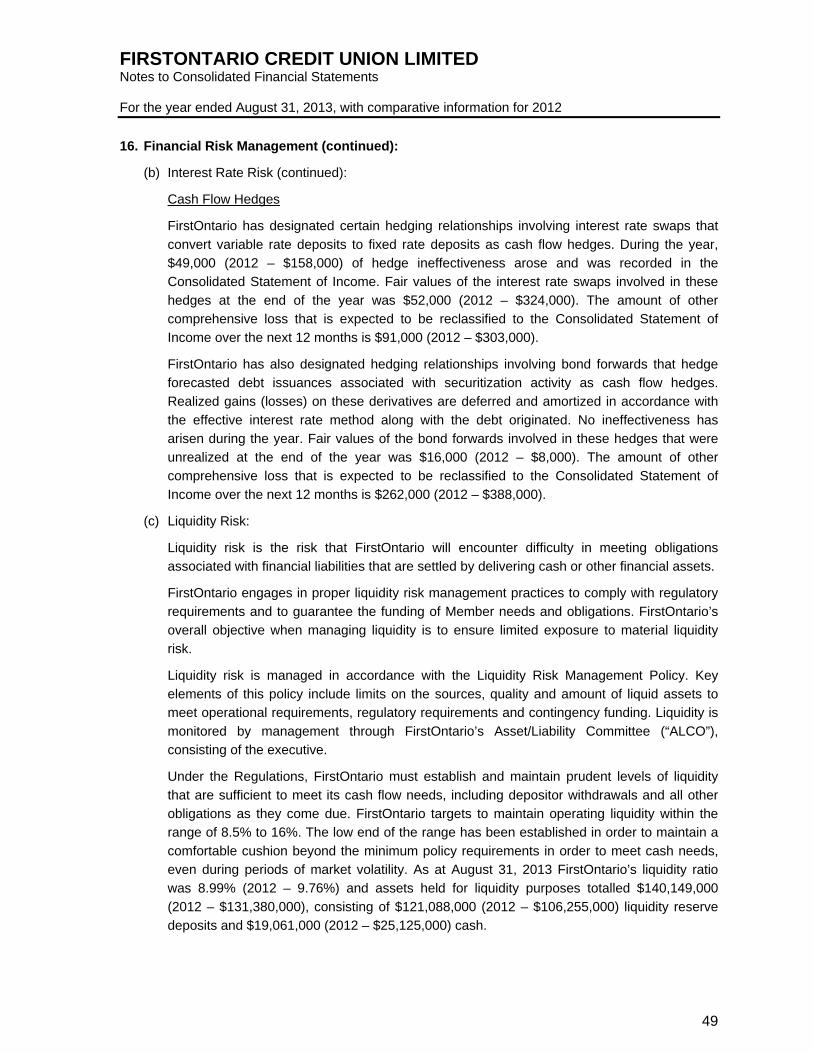
FIRSTONTARIO CREDIT UNION LIMITED Notes to Consolidated Financial Statements For the year ended August 31, 2013, with comparative information for 2012
49
16. Financial Risk Management (continued):
(b) Interest Rate Risk (continued):
Cash Flow Hedges
FirstOntario has designated certain hedging relationships involving interest rate swaps that
convert variable rate deposits to fixed rate deposits as cash flow hedges. During the year,
$49,000 (2012 – $158,000) of hedge ineffectiveness arose and was recorded in the
Consolidated Statement of Income. Fair values of the interest rate swaps involved in these
hedges at the end of the year was $52,000 (2012 – $324,000). The amount of other
comprehensive loss that is expected to be reclassified to the Consolidated Statement of
Income over the next 12 months is $91,000 (2012 – $303,000).
FirstOntario has also designated hedging relationships involving bond forwards that hedge
forecasted debt issuances associated with securitization activity as cash flow hedges.
Realized gains (losses) on these derivatives are deferred and amortized in accordance with
the effective interest rate method along with the debt originated. No ineffectiveness has
arisen during the year. Fair values of the bond forwards involved in these hedges that were
unrealized at the end of the year was $16,000 (2012 – $8,000). The amount of other
comprehensive loss that is expected to be reclassified to the Consolidated Statement of
Income over the next 12 months is $262,000 (2012 – $388,000).
(c) Liquidity Risk:
Liquidity risk is the risk that FirstOntario will encounter difficulty in meeting obligations
associated with financial liabilities that are settled by delivering cash or other financial assets.
FirstOntario engages in proper liquidity risk management practices to comply with regulatory
requirements and to guarantee the funding of Member needs and obligations. FirstOntario’s
overall objective when managing liquidity is to ensure limited exposure to material liquidity
risk.
Liquidity risk is managed in accordance with the Liquidity Risk Management Policy. Key
elements of this policy include limits on the sources, quality and amount of liquid assets to
meet operational requirements, regulatory requirements and contingency funding. Liquidity is
monitored by management through FirstOntario’s Asset/Liability Committee (“ALCO”),
consisting of the executive.
Under the Regulations, FirstOntario must establish and maintain prudent levels of liquidity
that are sufficient to meet its cash flow needs, including depositor withdrawals and all other
obligations as they come due. FirstOntario targets to maintain operating liquidity within the
range of 8.5% to 16%. The low end of the range has been established in order to maintain a
comfortable cushion beyond the minimum policy requirements in order to meet cash needs,
even during periods of market volatility. As at August 31, 2013 FirstOntario’s liquidity ratio
was 8.99% (2012 – 9.76%) and assets held for liquidity purposes totalled $140,149,000
(2012 – $131,380,000), consisting of $121,088,000 (2012 – $106,255,000) liquidity reserve
deposits and $19,061,000 (2012 – $25,125,000) cash.

FIRSTONTARIO CREDIT UNION LIMITED Notes to Consolidated Financial Statements For the year ended August 31, 2013, with comparative information for 2012
50
16. Financial Risk Management (continued):
(c) Liquidity Risk (continued):
The tables below demonstrate FirstOntario’s ability to pay future obligations as financial
assets and liabilities mature as at August 31, 2013 and 2012. These cash flows include both
the contractual cash flows currently exposed on the Statement of Financial Position and the
cash flows that will be generated in the future. In the case of loans, the cash flows include
estimated prepayments and credit losses based on experience and current economic
conditions.
(In thousands of dollars) As at August 31, 2013
Within 2 to 12 1 to 3 3 to 5 Over 5 Not
1 month months years years years Specified Total
Assets
Loans receivable
from members $ 524,561 $ 308,378 $ 587,656 $ 584,401 $ 5,134 $ – $ 2,010,130
Cash 23,276 – – – – – 23,276
Investments 3,289 21,321 29,427 74,935 – 28,753 157,725
Derivative financial
instruments 205 271 704 162 – – 1,342
Total Cash Inflow $ 551,331 $ 329,970 $ 617,787 $ 659,498 $ 5,134 $ 28,753 $ 2,192,473
Liabilities
Members’ deposits
and shares $ 704,590 $ 428,055 $ 309,106 $ 64,773 $ – $ – $ 1,506,524
Loans payable 79,581 42,526 207,741 138,304 – – 468,152
Other liabilities 18,291 – – – – – 18,291
Derivative financial
instruments 6 376 1,210 178 – – 1,770
Total Cash Outflow $ 802,468 $ 470,957 $ 518,057 $ 203,255 $ – $ – $ 1,994,737
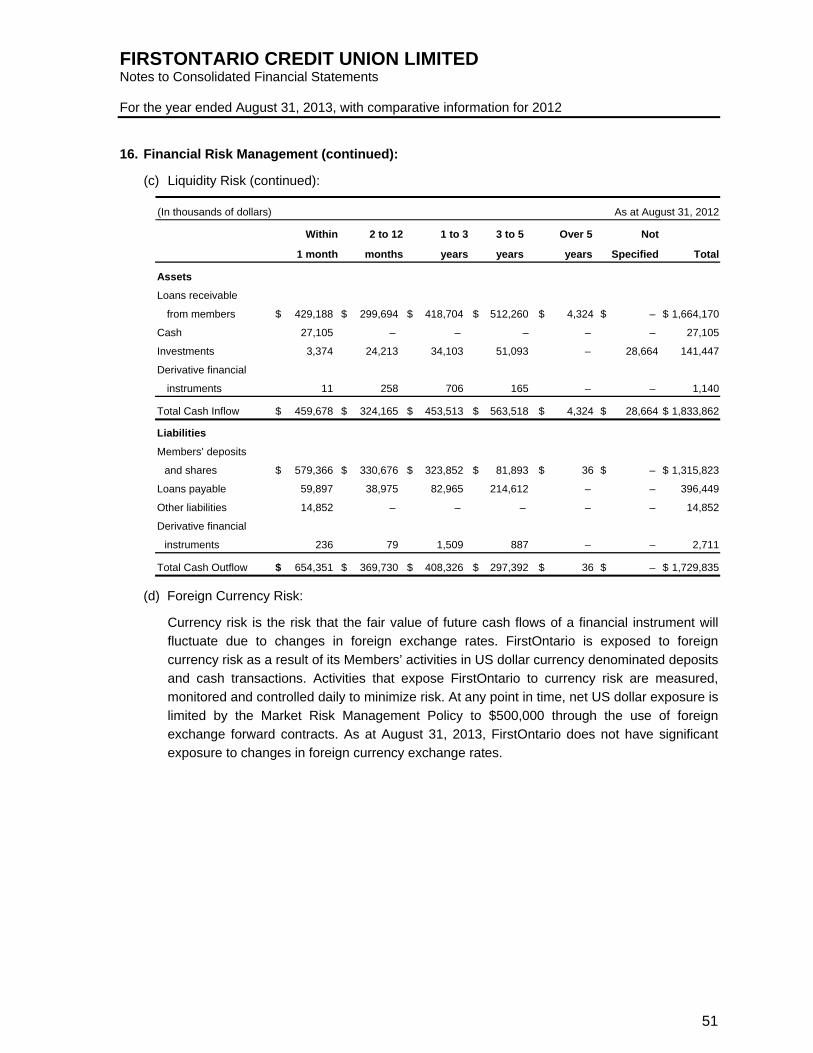
FIRSTONTARIO CREDIT UNION LIMITED Notes to Consolidated Financial Statements For the year ended August 31, 2013, with comparative information for 2012
51
16. Financial Risk Management (continued):
(c) Liquidity Risk (continued):
(In thousands of dollars) As at August 31, 2012
Within 2 to 12 1 to 3 3 to 5 Over 5 Not
1 month months years years years Specified Total
Assets
Loans receivable
from members $ 429,188 $ 299,694 $ 418,704 $ 512,260 $ 4,324 $ – $ 1,664,170
Cash 27,105 – – – – – 27,105
Investments 3,374 24,213 34,103 51,093 – 28,664 141,447
Derivative financial
instruments 11 258 706 165 – – 1,140
Total Cash Inflow $ 459,678 $ 324,165 $ 453,513 $ 563,518 $ 4,324 $ 28,664 $ 1,833,862
Liabilities
Members’ deposits
and shares $ 579,366 $ 330,676 $ 323,852 $ 81,893 $ 36 $ – $ 1,315,823
Loans payable 59,897 38,975 82,965 214,612 – – 396,449
Other liabilities 14,852 – – – – – 14,852
Derivative financial
instruments 236 79 1,509 887 – – 2,711
Total Cash Outflow $ 654,351 $ 369,730 $ 408,326 $ 297,392 $ 36 $ – $ 1,729,835
(d) Foreign Currency Risk:
Currency risk is the risk that the fair value of future cash flows of a financial instrument will
fluctuate due to changes in foreign exchange rates. FirstOntario is exposed to foreign
currency risk as a result of its Members’ activities in US dollar currency denominated deposits
and cash transactions. Activities that expose FirstOntario to currency risk are measured,
monitored and controlled daily to minimize risk. At any point in time, net US dollar exposure is
limited by the Market Risk Management Policy to $500,000 through the use of foreign
exchange forward contracts. As at August 31, 2013, FirstOntario does not have significant
exposure to changes in foreign currency exchange rates.
FIRSTONTARIO CREDIT UNION LIMITED Notes to Consolidated Financial Statements For the year ended August 31, 2013, with comparative information for 2012
52
16. Financial Risk Management (continued):
(e) Equity and Other Price Risk:
Other price risk is the risk that the fair value or future cash flows of a financial instrument will
fluctuate because of changes in market prices other than those arising from interest rate risk
or currency risk. FirstOntario is primarily exposed to other price risk through investments.
However, these investments are limited by policy to ensure diversification and quality of
financial assets. As at August 31, 2013, had the value of FirstOntario’s equity investments
portfolio increased or decreased by 10% with all other variables remaining unchanged, the
portfolio’s asset value would have increased or decreased respectively by $32,000 (2012 –
$36,000) or 0.0% (2012 – 0.0%) of total Member’s Equity.
17. Fair Values of Financial Instruments:
The following table represents the fair values of FirstOntario’s financial instruments. The fair
values disclosed do not include the value of assets that are not considered financial instruments,
such as fixed assets. The value of intangibles such as long–term Member relationships are also
not included in the fair value amounts, although FirstOntario considers the value of intangibles to
be significant.
While the fair value amounts are intended to represent estimates of the amounts at which these
instruments could be exchanged in a current transaction between willing parties, some of
FirstOntario’s financial instruments lack an available trading market. Consequently, the fair values
presented are estimates derived using present value and other valuations techniques and may
not be indicative of the net realizable values.
Due to the judgment used in applying a wide range of acceptable valuation techniques and
estimates in calculating fair value amounts, fair values are not necessarily comparable among
financial institutions. The calculation of estimated fair values is based on market conditions at a
specific point in time and may not be reflective of future fair values.

FIRSTONTARIO CREDIT UNION LIMITED Notes to Consolidated Financial Statements For the year ended August 31, 2013, with comparative information for 2012
53
17. Fair Values of Financial Instruments (continued):
2013 2012
Carrying Carrying
(In thousands of dollars) Value Fair Value Difference Value Fair Value Difference
Loans and Receivables
Loans receivable $1,882,284 $1,898,130 $ 15,846 $ 1,620,961 $ 1,633,327 $ 12,366
Held to Maturity
Investments 122,118 122,339 221 107,181 108,575 1,394
Fair Value through Profit and Loss
Cash and cash equivalents 23,276 23,276 – 27,105 27,105 –
Investments 5,972 5,972 – 6,003 6,003 –
Derivative financial
Instruments 1,342 1,342 – 1,140 1,140 –
Available for Sale
Investments 12,201 12,201 – 11,908 11,908 –
Total financial assets $ 2,047,193 $ 2,063,260 $ 16,067 $ 1,774,298 $ 1,788,058 $ 13,760
Other Liabilities
Deposits and shares $ 1,512,362 $ 1,514,305 $ (1,943) $ 1,316,474 $ 1,321,470 $ (4,996)
Loan s payable 441,815 445,223 (3,408) 375,824 380,114 (4,290)
Accounts payable and
accrued liabilities 18,291 18,291 – 14,852 14,852 –
Fair Value through Profit and Loss
Derivative financial
instruments 1,770 1,770 – 2,711 2,711 –
Total financial liabilities $ 1,974,238 $ 1,979,589 $ (5,351) $ 1,709,861 $ 1,719,147 $ (9,286)
Interest rate sensitivity is the main cause of change in fair values of FirstOntario’s financial
instruments.
The following methods and assumptions were used to estimate the fair value of financial
instruments:
(a) The fair values of cash and accounts payable and accrued liabilities are assumed to
approximate their book values, due to their short–term nature.
(b) The estimated fair value of floating rate loans, demand deposits and floating rate deposits are
assumed to be equal to book value as the interest rates on these loans and deposits reprice
to market on a periodic basis.
(c) The estimated fair values of fixed rate investments, fixed rate loans and fixed rate deposits
are determined by discounting the expected future cash flows of these investments, loans,
deposits and borrowings at current market rates for products with similar terms and credit
risks.
(d) The estimated fair values of derivative instruments are determined through valuation models
on the derivative notional amounts, maturity dates and rates.
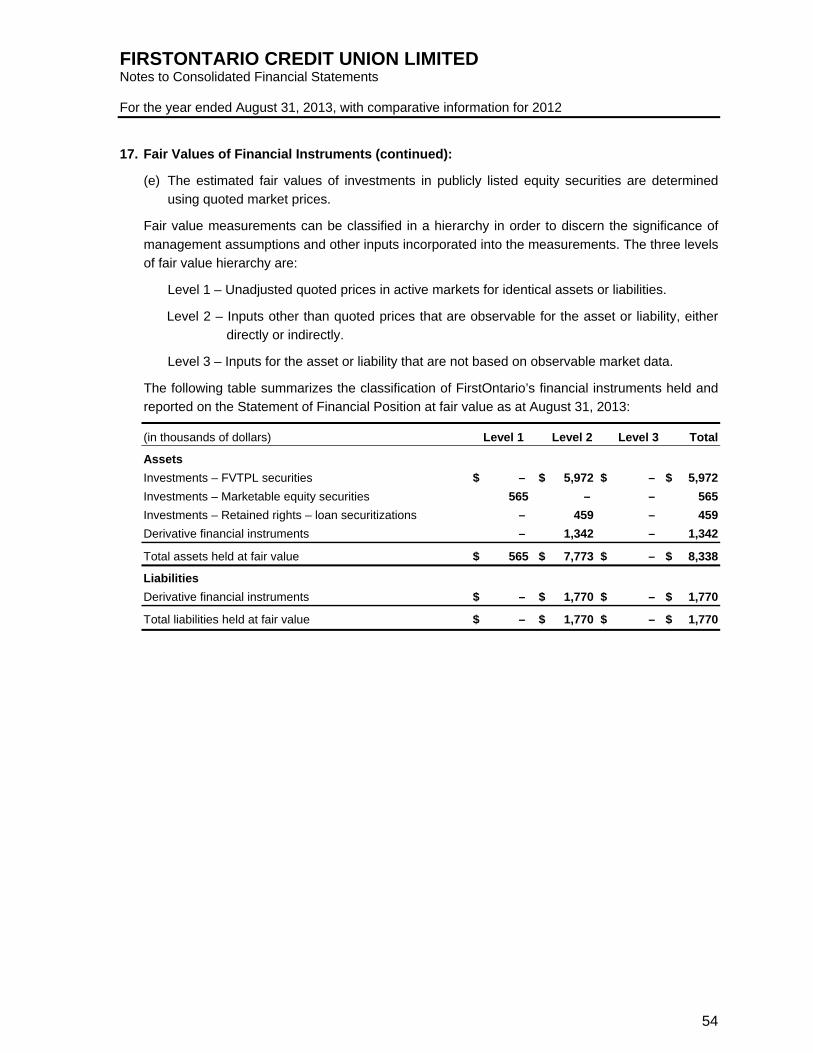
FIRSTONTARIO CREDIT UNION LIMITED Notes to Consolidated Financial Statements For the year ended August 31, 2013, with comparative information for 2012
54
17. Fair Values of Financial Instruments (continued):
(e) The estimated fair values of investments in publicly listed equity securities are determined
using quoted market prices.
Fair value measurements can be classified in a hierarchy in order to discern the significance of
management assumptions and other inputs incorporated into the measurements. The three levels
of fair value hierarchy are:
Level 1 – Unadjusted quoted prices in active markets for identical assets or liabilities.
Level 2 – Inputs other than quoted prices that are observable for the asset or liability, either
directly or indirectly.
Level 3 – Inputs for the asset or liability that are not based on observable market data.
The following table summarizes the classification of FirstOntario’s financial instruments held and
reported on the Statement of Financial Position at fair value as at August 31, 2013:
(in thousands of dollars) Level 1 Level 2 Level 3 Total
Assets
Investments – FVTPL securities $ – $ 5,972 $ – $ 5,972
Investments – Marketable equity securities 565 – – 565
Investments – Retained rights – loan securitizations – 459 – 459
Derivative financial instruments – 1,342 – 1,342
Total assets held at fair value $ 565 $ 7,773 $ – $ 8,338
Liabilities
Derivative financial instruments $ – $ 1,770 $ – $ 1,770
Total liabilities held at fair value $ – $ 1,770 $ – $ 1,770

FIRSTONTARIO CREDIT UNION LIMITED Notes to Consolidated Financial Statements For the year ended August 31, 2013, with comparative information for 2012
55
18. Employee Retirement Benefits:
FirstOntario provides retirement benefits to certain employees. These benefits include registered
pension plans, medical benefits, dental care and life insurance.
The fair value of accrued benefit obligations were determined by independent actuaries as at
August 31, 2013.
Defined Benefit Pensions Other Defined Benefit Plans (In thousands of dollars) 2013 2012 2013 2012
Accrued benefit obligation Balance at the beginning of year $ 12,506 $ 10,462 $ 5,330 $ 4,658 Current service cost 468 358 4 5 Interest cost 535 530 218 225 Benefits paid (402) (380) (144) (161) Settlements (167) (118) – – Actuarial loss (gain) (1,123) 1,654 (304) 603
Balance at end of year 11,817 12,506 5,104 5,330 Plan assets Fair value at beginning of year 9,282 8,686 – – Annual return on plan assets 921 176 – – Employer contributions 738 777 144 161 Employee contributions 19 23 – – Benefits paid (402) (380) (144) (161) Settlements (167) – – –
Fair value at end of year 10,391 9,282 – – Funded status – deficit (1,426) (3,224) (5,104) (5,330) Unamortized net actuarial loss (gain) 1,351 2,883 (132) 172
Accrued benefit liability $ (75) $ (341) $ (5,236) $ (5,158)
Experience adjustments are the effects of differences between the previous actuarial
assumptions and what has actually occurred. Experience adjustments incurred were as follows:
Defined Benefit Plans (In thousands of dollars) 2013 2012 2011
Accrued benefit obligation $ 1,123 $ 7 $ (75) Plan assets 308 (402) (407) Total experience gain (loss) for the year $ 1,431 $ (395) $ (482)
Other Defined Benefit Plans (In thousands of dollars) 2013 2012 2011
Accrued benefit obligation $ 303 $ (40) $ (172) Plan assets – – – Total experience gain (loss) for the year $ 303 $ (40) $ (172)

FIRSTONTARIO CREDIT UNION LIMITED Notes to Consolidated Financial Statements For the year ended August 31, 2013, with comparative information for 2012
56
18. Employee Retirement Benefits (continued):
The following table provides the amounts recognized in the Consolidated Statement of Financial
Position as follows:
Defined Benefit Pensions Other Defined Benefit Plans (In thousands of dollars) 2013 2012 2013 2012
Prepaid benefit costs recorded in other assets $ 568 $ 383 $ – $ – Accrued benefit liability recorded in other liabilities (643) (724) (5,236) (5,158)
Net amount recognized $ (75) $ (341) $ (5,236) $ (5,158)
The significant actuarial assumptions adopted by are as follows (weighted–average
assumptions):
Defined Benefit Pensions Other Defined Benefit Plans 2013 2012 2013 2012
Discount rate 4.7% 4.20% 4.7% 4.20% Expected long–term rate of return on plan assets 6.50% 6.50% – – Rate of compensation increase 3.00% 3.00% – –
The expected rate of return on plan assets is based on the risks and associated returns expected
of the underlying plan assets. Plan assets are held in balanced funds which includes equities and
long–term bonds.
For measurement purposes, 5.0% and 3.0% rates of increase in the per capita cost of covered
health care and dental care benefits respectively were assumed for 2013. The rate of increase for
health care benefits was assumed to remain unchanged at 5.0%. The rate of increase for dental
care benefits was assumed to remain unchanged at 3.0%.
A one percentage–point change in assumed health–care cost trend rates would have the
following impact on other defined benefit plans:
2013 2012 (In thousands of dollars) Obligation Expense Obligation Expense
1% increase $ 531 $ 23 $ 556 $ 24 1% decrease (451) (20) (470) (20)
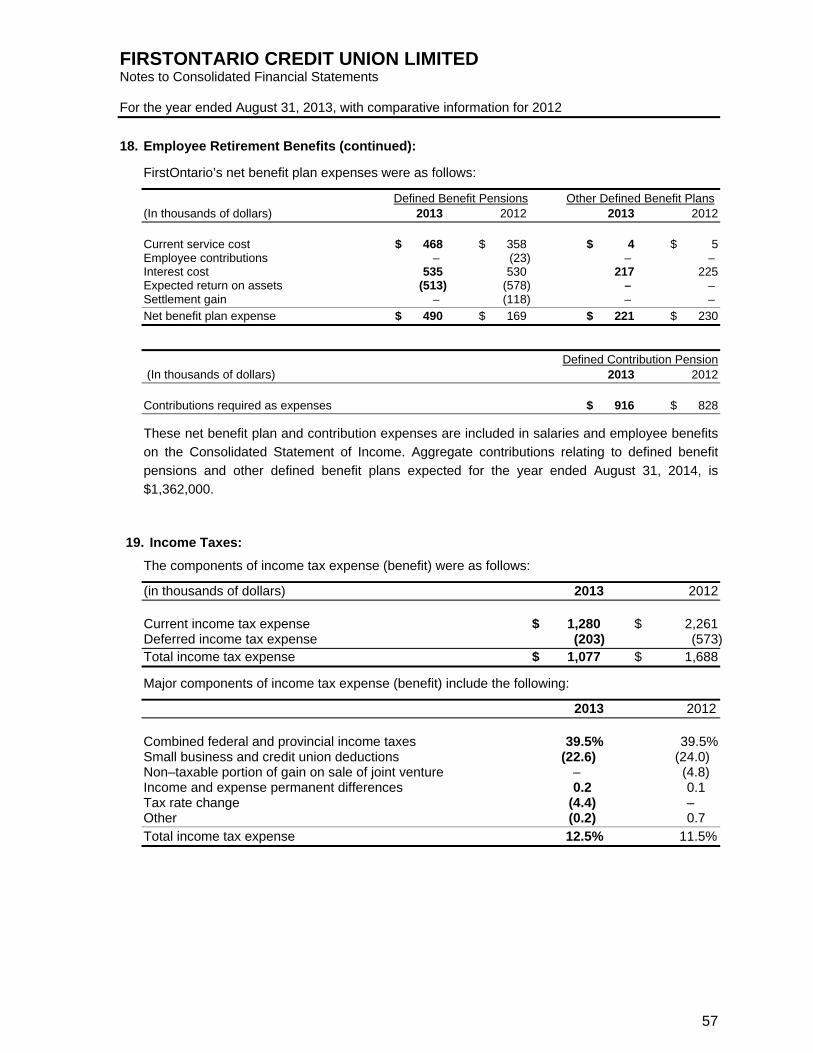
FIRSTONTARIO CREDIT UNION LIMITED Notes to Consolidated Financial Statements For the year ended August 31, 2013, with comparative information for 2012
57
18. Employee Retirement Benefits (continued):
FirstOntario’s net benefit plan expenses were as follows:
Defined Benefit Pensions Other Defined Benefit Plans (In thousands of dollars) 2013 2012 2013 2012
Current service cost $ 468 $ 358 $ 4 $ 5 Employee contributions – (23) – – Interest cost 535 530 217 225 Expected return on assets (513) (578) – – Settlement gain – (118) – – Net benefit plan expense $ 490 $ 169 $ 221 $ 230
Defined Contribution Pension (In thousands of dollars) 2013 2012
Contributions required as expenses $ 916 $ 828
These net benefit plan and contribution expenses are included in salaries and employee benefits
on the Consolidated Statement of Income. Aggregate contributions relating to defined benefit
pensions and other defined benefit plans expected for the year ended August 31, 2014, is
$1,362,000.
19. Income Taxes:
The components of income tax expense (benefit) were as follows:
(in thousands of dollars) 2013 2012 Current income tax expense $ 1,280 $ 2,261 Deferred income tax expense (203) (573) Total income tax expense $ 1,077 $ 1,688
Major components of income tax expense (benefit) include the following:
2013 2012 Combined federal and provincial income taxes 39.5% 39.5% Small business and credit union deductions (22.6) (24.0) Non–taxable portion of gain on sale of joint venture – (4.8) Income and expense permanent differences 0.2 0.1 Tax rate change (4.4) – Other (0.2) 0.7 Total income tax expense 12.5% 11.5%
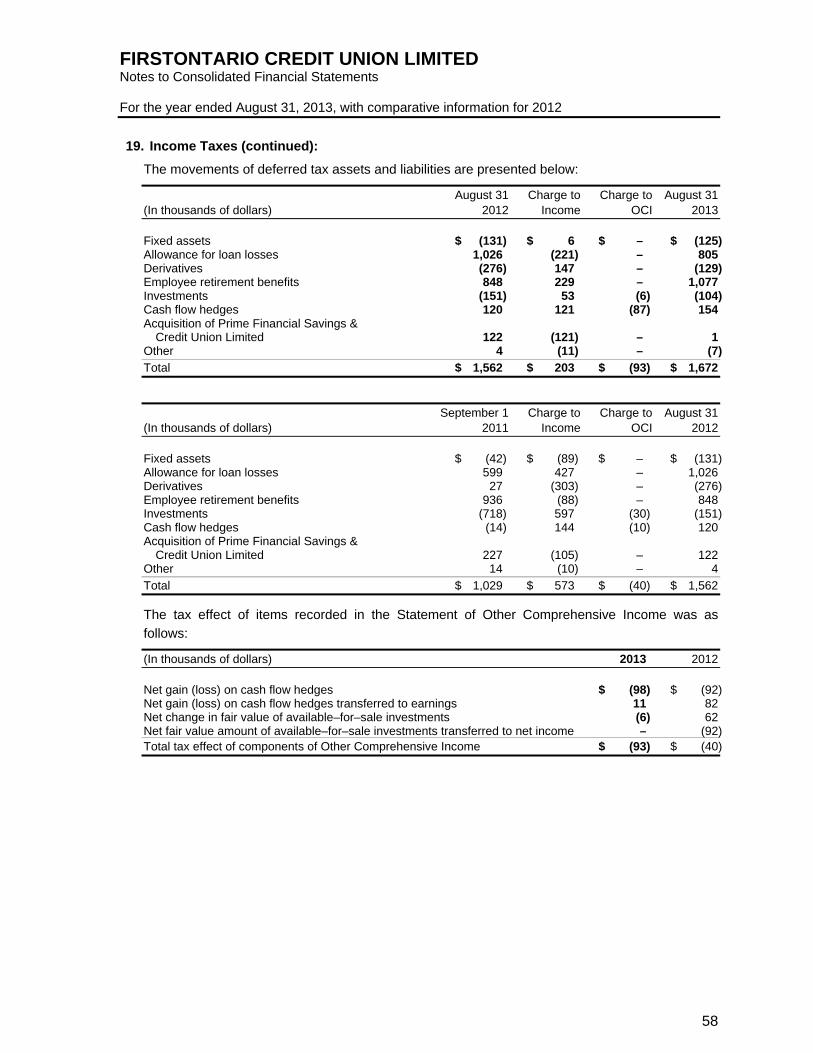
FIRSTONTARIO CREDIT UNION LIMITED Notes to Consolidated Financial Statements For the year ended August 31, 2013, with comparative information for 2012
58
19. Income Taxes (continued):
The movements of deferred tax assets and liabilities are presented below:
August 31 Charge to Charge to August 31 (In thousands of dollars) 2012 Income OCI 2013
Fixed assets $ (131) $ 6 $ – $ (125) Allowance for loan losses 1,026 (221) – 805 Derivatives (276) 147 – (129) Employee retirement benefits 848 229 – 1,077 Investments (151) 53 (6) (104) Cash flow hedges 120 121 (87) 154 Acquisition of Prime Financial Savings & Credit Union Limited 122 (121) – 1 Other 4 (11) – (7)
Total $ 1,562 $ 203 $ (93) $ 1,672
September 1 Charge to Charge to August 31 (In thousands of dollars) 2011 Income OCI 2012
Fixed assets $ (42) $ (89) $ – $ (131) Allowance for loan losses 599 427 – 1,026 Derivatives 27 (303) – (276) Employee retirement benefits 936 (88) – 848 Investments (718) 597 (30) (151) Cash flow hedges (14) 144 (10) 120 Acquisition of Prime Financial Savings & Credit Union Limited 227 (105) – 122 Other 14 (10) – 4
Total $ 1,029 $ 573 $ (40) $ 1,562
The tax effect of items recorded in the Statement of Other Comprehensive Income was as
follows:
(In thousands of dollars) 2013 2012
Net gain (loss) on cash flow hedges $ (98) $ (92) Net gain (loss) on cash flow hedges transferred to earnings 11 82 Net change in fair value of available–for–sale investments (6) 62 Net fair value amount of available–for–sale investments transferred to net income – (92) Total tax effect of components of Other Comprehensive Income $ (93) $ (40)

FIRSTONTARIO CREDIT UNION LIMITED Notes to Consolidated Financial Statements For the year ended August 31, 2013, with comparative information for 2012
59
20. Commitments:
(a) Leases:
FirstOntario leases space for most of its branches and some computer equipment. The
leases have varying terms, escalation clauses and renewal rights. Lease payments made as
a result of operating leases during the year were $2,249,000 (2012 – $1,902,000). Total
future minimum lease payments under non–cancellable operating leases are as follows:
(In thousands of dollars) 2013 2012 Within 1 year $ 2,245 $ 2,220 1 to 5 years 7,857 6,642 Over 5 years 5,859 4,708
(b) Mortgage commitments and lines of credit:
At August 31, 2013, FirstOntario has issued commitments to provide residential mortgage
and commercial loans totaling $25,200,000 (2012 – $32,800,000). FirstOntario has also
provided lines of credit to Members totaling $417,500,000 at August 31, 2013 (2012 –
$453,500,000), against which Members have drawn $262,300,000 (2012 – $255,300,000).
(c) Credit facilities:
Central 1 has provided an operating loan facility to FirstOntario of $108,000,000 (2012 –
$100,000,000). Subsequent to yearend, Central 1 increased the operating loan facility to
$115,500,000. Loans to Members have been pledged as security for this facility and the term
loan by an assignment of book debts and a general security agreement. See the
Consolidated Statement of Financial Position and Note 14 for the outstanding amount on this
facility.
(d) Contracts:
Interac ATM and point of sale switching servicing totaling $1.6 million over the next 2 years at
present service levels (2012 – $2,200,000 over the next 3 years).
Banking system support services and software maintenance totaling $1,000,000 over the
next 2 years (2012 – $1,400,000 over the next 3 years).
Telephone network and voice services totaling $3,900,000 over the next 6 years (2012 –
$4,600,000 over the next 7 years).
21. Merger with Rochdale Credit Union
On October 22, 2013, the Members of Rochdale Credit Union voted in favour to merge operations
with FirstOntario. Founded in 1942, Rochdale Credit Union has approximately $89,000,000 in
loans, $91,000,000 in deposits, and serves 6,500 Members through its four branches in
Woodstock, Ingersoll, Norwich and Brantford.
The acquisition date has been set for November 30, 2013 where all of the assets and liabilities
will be transferred to FirstOntario.
Top Related