


Languages
Pages
Legal


Flagship Investments Limited ABN 99 080 135 913 Level 12 Corporate Centre One 2 Corporate Court BUNDALL QLD 4217
PO Box 7536 G C M C BUNDALL QLD 9726 Telephone 1800 352 474 Facsimile 07 5574 1457 www.flagshipinvestments.com.au
4 June 2020 The Manager Company Announcements Office ASX Ltd Exchange Centre Level 6, 20 Bridge Street SYDNEY NSW 2000 Dear Sir, Flagship Investments Limited - Retail Presentation as at 3 June 2020 For the benefit of our Shareholders and interested parties, attached is a retail presentation to be delivered on Thursday 4 June 2020 to various Brokers by the Investment Manager of Flagship Investments Limited. Yours sincerely FLAGSHIP INVESTMENTS LIMITED
Authorised by Scott Barrett Company Secretary
For
per
sona
l use
onl
y

Presentation | ECP Asset Management Redefining Active Investing
FSI AND ECP UPDATEVideo Conference: 4 June 2020
1
At ECP, we think the only
way to grow wealth that is
resilient and sustainable, is
to invest money in a careful,
considered and committed
way.
For
per
sona
l use
onl
y

Redefining Active Investing
We are associated with three Listed Investment Companies
Emerging Growth Limited
For
per
sona
l use
onl
y
Redefining Active Investing
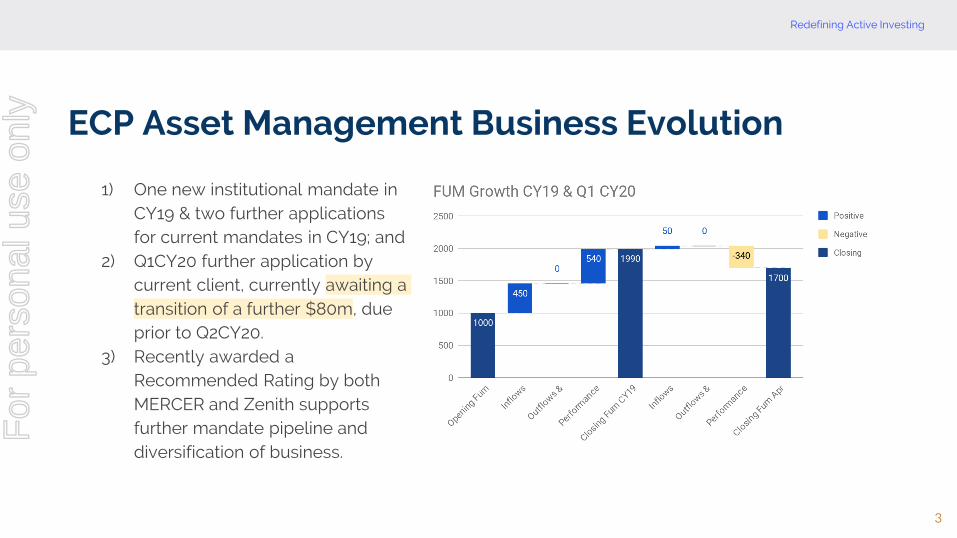
1) One new institutional mandate in CY19 & two further applications for current mandates in CY19; and
2) Q1CY20 further application by current client, currently awaiting a transition of a further $80m, due prior to Q2CY20.
3) Recently awarded a Recommended Rating by both MERCER and Zenith supports further mandate pipeline and diversification of business.
3
ECP Asset Management Business Evolution
For
per
sona
l use
onl
y

Redefining Active Investing
Performance of market cap segments since 2001
• Small and mid caps:
• Outperformed in 68% of
years
• have significantly greater
variance of returns
(tendency for higher highs
and lower lows) –timing
entry is very important
• ECPAM objective - to identify
well managed, high growth,
small cap companies that will
become mid and large caps
over time
Year-end All Ords Small cap Mid cap Large cap
Size Range $0-$133bn $0-$1bn $1bn-$8bn $8bn-$133bn
Dec-01 10% 2% 16% 11%
Dec-02 -8% -9% 5% -10%
Dec-03 16% 32% 23% 13%
Dec-04 28% 27% 43% 26%
Dec-05 21% 20% 23% 23%
Dec-06 25% 34% 26% 23%
Dec-07 18% 17% 17% 16%
Dec-08 -40% -53% -46% -36%
Dec-09 40% 57% 36% 36%
Dec-10 3% 13% 4% 0%
Dec-11 -11% -21% -16% -9%
Dec-12 19% 7% 13% 22%
Dec-13 20% -1% 17% 22%
Dec-14 5% 4% 13% 5%
Dec-15 4% 10% 11% 1%
Dec-16 12% 13% 18% 11%
Dec-17 13% 20% 22% 10%
Dec-18 -4% -9% -7% -2%
Dec-19 24% 21% 22% 24%
Years the best 3 10 6
Maximum 40% 57% 43% 36%
Minimum -40% -53% -46% -36%
For
per
sona
l use
onl
y

Redefining Active Investing
Successful active management requires liquidity but an information advantage is a necessity
• The information advantage obtained by conducting forensicresearch of high quality growth businesses can producesuperior investment performance over the long-term.
• Great investment opportunities occur when excellentcompanies are surrounded by unusual circumstances whichreduces the entropy (lack of order or predictability) of thesystem and causes the equity to be mispriced.F
or p
erso
nal u
se o
nly

Redefining Active Investing
Fundamental Research
There’s no substitute for due diligence.
Through in-depth, detailed analysis, we come to aconclusion as to whether a business is a quality franchise,has a sustainable competitive advantage, is operating in afavourable industry and has the appropriate management inplace to execute on an appropriate strategy.
66
THE SIX PILLARS OF A QUALITY FRANCHISE ARE INTERDEPENDENT & INTERRELATED
For
per
sona
l use
onl
y

Redefining Active Investing
7
Investment Team
Dr Manny Pohl AM
Co-Founded ECP in 2012Joined Industry in 1989
Jared Pohl MBA
Co-Founded ECP in 2012Joined Industry in 2006
Andrew Dale CA
Joined ECP in 2014Joined Industry in 2001
Damon Callaghan CFA
Joined ECP in 2017Joined Industry in 2011
Sam Byrnes CFA
Joined ECP in 2016Joined Industry in 2008
Jason Pohl MBA
Joined ECP in 2013Joined Industry in 2013
For
per
sona
l use
onl
y

Redefining Active Investing
Our Investment Philosophy
The economics of a business drives long-term investment returns.
Investing in high quality, growth businesses, that have the ability to generate predictable, above average economic returns will produce superior investment performance over the long-term.
8
Valuing potential, not just performance
1
2
3
Choosing high quality growing businesses
Ignoring temporary market turbulence
8
For
per
sona
l use
onl
y

Redefining Active Investing
Market Inefficiencies We Exploit
SUSTAINABLEOPPORTUNITY
QUALITYGROWTH
LONGTERM
Growth Anomaly
On average the market undervalues extremely high-quality, capital efficient, organic growth businesses.
Time Arbitrage
The market tends to overemphasizetemporary themes and short-term factors.
99
For
per
sona
l use
onl
y

Redefining Active Investing
We have continued to apply our investment process diligently. Key points to note:
1) We did not decide to reposition the portfolio to Covid unaffected companies. Our investment process was naturally overweight companies that were better able to handle this ‘demand’ shock.
2) Coming into the year we had higher cash weights due to lower forecast IRR. As the IRR has climbed, our cash weights have reduced. We will deploy capital sensibly.
3) Covid-19 has flowed through to changes in our terminal PE’s and our forecast earnings.
The portfolio has performed well considering the large drawdown.
1) Strong Alpha Generation through this period.2) Exhibited a degree of capital protection from a growth manager.3) Portfolio companies are arguably in better competitive positions now than they have ever been.
10
How are we handling Covid-19?
For
per
sona
l use
onl
y

Redefining Active Investing
Portfolio Performance
Historical Performance to 31 May 2020
Past Performance is not a reliable indicator of future performance. The total return figures quoted are historical, calculated using end-of-month prices and do not allow the effects of tax or inflation. Total returns for the benchmark do not incur costs. Returns assume the reinvestment of all dividends. ^Inception of the FSI portfolio is 1 May 1998., ^Inception for ECP portfolio is 21 August 2014.
11
Product 3 Month 6 Month 1 Years 3 Years 5 Years ^ Inception
FSI 0.22 -3.66 8.21 14.96 11.44 12.32
All Ords Accumulation Index
-9.04 -14.12 -6.21 4.72 4.56 7.85
Alpha 9.26 10.46 14.42 10.24 6.88 4.47
ECP 10.63 5.63 22.34 21.23 15.72 15.31
Small Ords Accumulation Index
-1.91 -7.66 -2.91 7.51 6.59 6.05
Alpha 12,54 13.29 25.25 13.72 9.13 9.26
For
per
sona
l use
onl
y

Redefining Active Investing
Talking Stocks: Top Five Holdings
12
FLAGSHIP Weight %
Rio Tinto 6.69
CBA 6.32
Macquarie Group 5.93
Domino’s 5.85
Carsales.Com 4.82
Emerging Growth Limited
ECP Weight %
Seek 5.73
Domino’s 5.70
Altium 5.68
Afterpay 5.59
HUB24 4.41
(31 May 2020)
For
per
sona
l use
onl
y

Redefining Active Investing
Name Changes to Portfolio (YTD)
FSI (Allcap) ECP (Ex50)
Sold
Fisher & Paykel (FPH) Fisher & Paykel (FPH)
Pushpay (PPH)
Additions
IDP Education (IEL) IDP Education (IEL)
Lifestyle Communities (LIC)
Audinate Group (AD8)
For
per
sona
l use
onl
y

Redefining Active Investing
COVID
How has COVID impacted the investment thesis?● COVID has had a positive impact given the increased
demand for ventilators and other breathing apparatuses. FPH is a leading manufacturer of these products and demand has been very strong and lead to 100% utilisation of their manufacturing facilities
● The Company has upgraded twice since the start outbreak of the virus in January 2020
What changes have we made to our forecasts or positioning?
● Our forecasts are above the market and reflect our positive view on the outlook. However, FPH has performed very well and this has meant the IRR has fallen below threshold for the Portfolio (~-10% irr).
● Accordingly, the stock has been sold down to 0% weight in the portfolio and will re-include it when the IRR is big enough to warrant re-inclusion.
FPH AU
Thesis - FPH will maintain and grow market share in theircore products (ventilators and masks) and will increasepenetration in hospitals for their Optiflow products.
● R&D investment into new designs and products● Education of the market into better treatments● Continued market share dominance
The SCA for FPH is driven by the following factors;● Technological advancement● Product innovation● Brand awareness
Research● Research Report● Company Notes
Portfolio Decision Sell - IRR below threshold
1414
For
per
sona
l use
onl
y

Redefining Active Investing
What changed about our thesis?● Acquisition of John Guest Holdings● Takeover was greater than 25% EV - material
acquisition resulting in substantial changes in resource-base, strategy, management, and overall organisational complexity.
● Thesis is now about cross selling as opposed to market share gains within core Sharebite products.
End Result● Sold RWC post the merger announcement at an
average price of $5.42● Slowing growth in ANZ and weakness in Europe.● US weather events did not materialise, impacting
expectations for products (downside).○ Lower sales volumes given growth not
related to increasing penetration. ● Chairman (Founder) sold entire stake in RWC.
RWC AU
Thesis - Market leading position in ‘Behind the Wall’ plumbing supplies, particularly their SharkBite products in the Push to Connect (PTC) segment.
● Increasing penetration of Sharkbite and PTC fittings;● Continued geographical expansion of product range
(US);● Expansion into new geographies.
SCA - What is the SCA basis?● Organisational Resource
○ IP & Production processes, customer relationships and distribution.
● Reputational Resource○ Brand of Quality and Reliability
Research● Research Report● Company Notes● Sell Motivation
Portfolio Decision Sell - Thesis Break
1515
For
per
sona
l use
onl
y
Redefining Active Investing
16
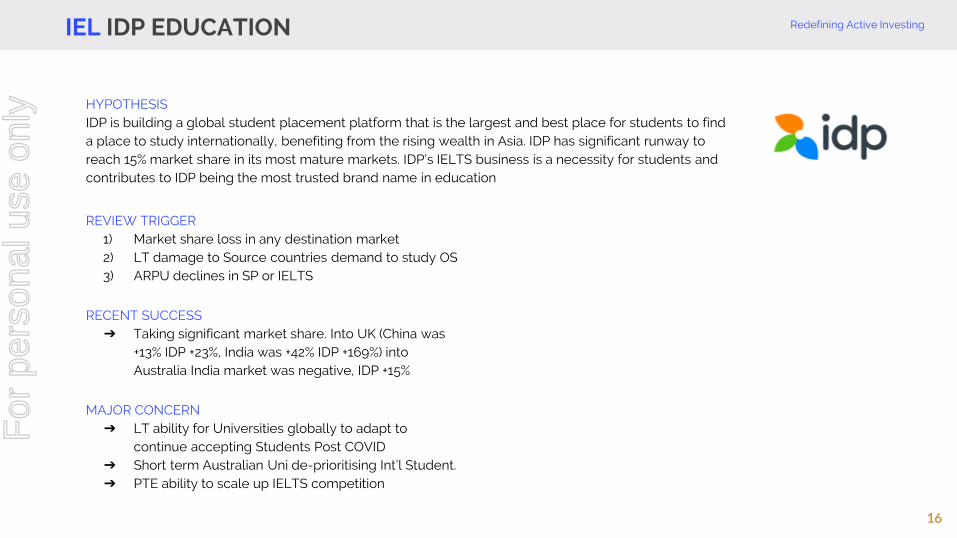
REVIEW TRIGGER1) Market share loss in any destination market2) LT damage to Source countries demand to study OS3) ARPU declines in SP or IELTS
RECENT SUCCESS➔ Taking significant market share. Into UK (China was
+13% IDP +23%, India was +42% IDP +169%) into Australia India market was negative, IDP +15%
MAJOR CONCERN➔ LT ability for Universities globally to adapt to
continue accepting Students Post COVID➔ Short term Australian Uni de-prioritising Int’l Student.➔ PTE ability to scale up IELTS competition
IEL IDP EDUCATION
16
HYPOTHESISIDP is building a global student placement platform that is the largest and best place for students to find a place to study internationally, benefiting from the rising wealth in Asia. IDP has significant runway to reach 15% market share in its most mature markets. IDP’s IELTS business is a necessity for students and contributes to IDP being the most trusted brand name in education
For
per
sona
l use
onl
y
Redefining Active Investing
17
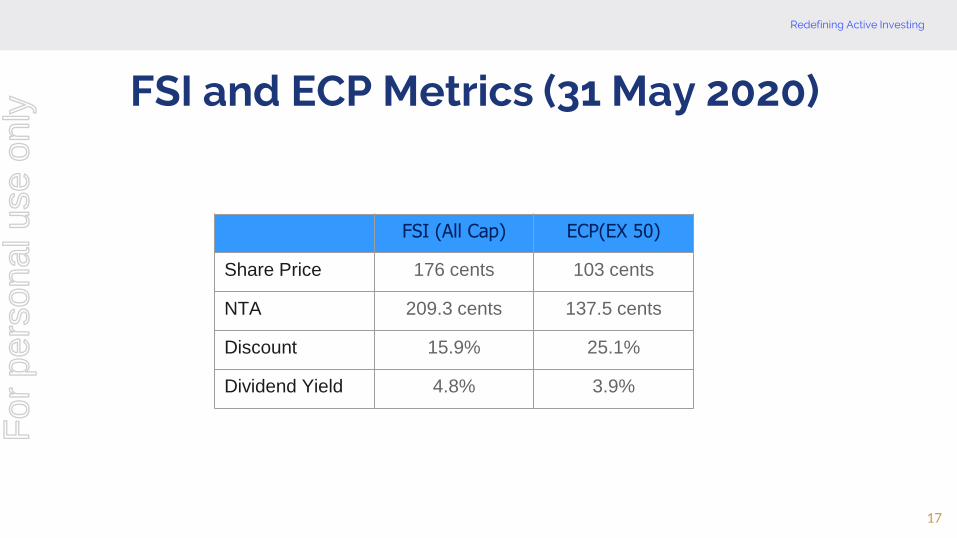
FSI and ECP Metrics (31 May 2020)
FSI (All Cap) ECP(EX 50)
Share Price 176 cents 103 cents
NTA 209.3 cents 137.5 cents
Discount 15.9% 25.1%
Dividend Yield 4.8% 3.9%
For
per
sona
l use
onl
y
Redefining Active Investing
18
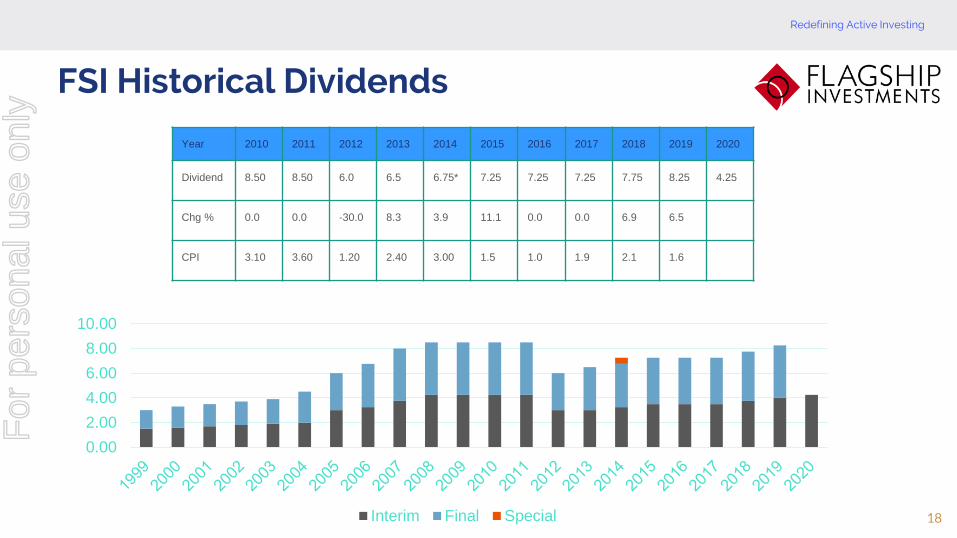
FSI Historical Dividends
Year 2010 2011 2012 2013 2014 2015 2016 2017 2018 2019 2020
Dividend 8.50 8.50 6.0 6.5 6.75* 7.25 7.25 7.25 7.75 8.25 4.25
Chg % 0.0 0.0 -30.0 8.3 3.9 11.1 0.0 0.0 6.9 6.5
CPI 3.10 3.60 1.20 2.40 3.00 1.5 1.0 1.9 2.1 1.6
0.00
2.00
4.00
6.00
8.00
10.00
Interim Final Special
For
per
sona
l use
onl
y

Redefining Active Investing
19
ECP Historical Dividends
Year 2015 2016 2017 2018 2019 2020
Dividend 1.00 2.5 2.5 3.25 3.75 1.75
Chg % 150.0 0.0 30.0 15.4
CPI 1.5 1.0 1.9 2.1 1.6
0
1
2
3
4
2015 2016 2017 2018 2019 2020
Interim Final Special
Emerging Growth Limited
For
per
sona
l use
onl
y

Redefining Active Investing
Bottom Up Total Return Expectations
Our bottom up fundamental drivers for the portfolio as at 31 April 2020 is as follows:
Forecast IRR
(% pa)
EPS Growth1
(% pa)
Income3
(% pa)
PE Expansion2
(% pa)
FSI (Allcap) 13.0% 13.6% 2.8% -3.5%
ECP (ex50) 13.0% 16.1% 1.7% -4.7%
20
1. Forecast weighted average EPS growth for companies in the portfolio.
2. Compound weight average annual PE expansion for Portfolio companies.
3. Estimated Dividend Yield of the portfolio.
For
per
sona
l use
onl
y

DisclaimerThis presentation is for general information purposes only and does not take into account the specific investmentobjectives, financial situation or particular needs of any specific reader. As such, before acting on any informationcontained in this presentation, readers should consider the appropriateness of the information to their needs. Thismay involve seeking advice from a qualified financial adviser.
Past performance is not a reliable indicator of future performance. The total return performance figures quoted arehistorical, calculated using end-of-month mid prices and do not allow for the effects of income tax or inflation. Theperformance is quoted net of all fees and expenses. The indices do not incur these costs. This information isprovided for general comparative purposes.
21
For
per
sona
l use
onl
y
Top Related