


Languages
Pages
Legal


Copyright Autoliv Inc., All Rights Reserved
Copyright Autoliv Inc., All Rights ReservedJuly 27, 20181
1st
Earnings Conference Call and Webcast2nd Quarter 2018 Financial Results
July 27, 2018
ALV – Q2-2018 Earnings Call and Webcast
Copyright Autoliv Inc., All Rights Reserved
Safe Harbor Statement*
This presentation contains statements that are not historical facts but rather forward-looking statements within the meaning of the Private Securities Litigation Reform Act of 1995. Such forward-looking statements include those that address activities, events or developments that Autoliv, Inc. or its management believes or anticipates may occur in the future. All forward-looking statements, including without limitation, management’s examination of historical operating trends and data, as well as estimates of future sales, operating margin, cash flow, effective tax rate or financial results, and the anticipated impact of the completion of the spin-off of our Electronics business and the outlook for Autoliv following the spin-off are based upon our current expectations, various assumptions and/or data available from third parties. Our expectations and assumptions are expressed in good faith and we believe there is a reasonable basis for them. However, there can be no assurance that such forward-looking statements will materialize or prove to be correct as forward-looking statements are inherently subject to known and unknown risks, uncertainties and other factors which may cause actual future results, performance or achievements to differ materially from the future results, performance or achievements expressed in or implied by such forward-looking statements. In some cases, you can identify these statements by forward-looking words such as “estimates”, “expects”, “anticipates”, “projects”, “plans”, “intends”, “believes”, “may”, “likely”, “might”, “would”, “should”, “could”, or the negative of these terms and other comparable terminology, although not all forward-looking statements contain such words. Because these forward-looking statements involve risks and uncertainties, the outcome could differ materially from those set out in the forward-looking statements for a variety of reasons, including without limitation, changes in light vehicle production; fluctuation in vehicle production schedules for which the Company is a supplier, changes in general industry and market conditions or regional growth or decline; changes in and the successful execution of our capacity alignment, restructuring and cost reduction initiatives and the market reaction thereto; loss of business from increased competition; higher raw material, fuel and energy costs; changes in consumer and customer preferences for end products; customer losses; changes in regulatory conditions; customer bankruptcies, consolidations, or restructurings; divestiture of customer brands; unfavorable fluctuations in currencies or interest rates among the various jurisdictions in which we operate; component shortages; market acceptance of our new products; costs or difficulties related to the integration of any new or acquired businesses and technologies; continued uncertainty in pricing negotiations with customers; successful integration of acquisitions and operations of joint ventures; successful implementation of strategic partnerships and collaborations; our ability to be awarded new business; product liability, warranty and recall claims and investigations and other litigation and customer reactions thereto; (including the resolution of the Toyota recall); higher expenses for our pension and other postretirement benefits, including higher funding requirements for our pension plans; work stoppages or other labor issues; possible adverse results of pending or future litigation or infringement claims; our ability to protect our intellectual property rights; negative impacts of antitrust investigations or other governmental investigations and associated litigation relating to the conduct of our business; tax assessments by governmental authorities and changes in our effective tax rate; dependence on key personnel; legislative or regulatory changes impacting or limiting our business; political conditions; dependence on and relationships with customers and suppliers; and other risks and uncertainties identified under the headings “Risk Factors” and “Management’s Discussion and Analysis of Financial Condition and Results of Operations” in our Annual Reports and Quarterly Reports on Forms 10-K and 10-Q and any amendments thereto. For any forward-looking statements contained in this or any other document, we claim the protection of the safe harbor for forward-looking statements contained in the Private Securities Litigation Reform Act of 1995, and we assume no obligation to update publicly or revise any forward-looking statements in light of new information or future events, except as required by law.
July 27, 2018 ALV – Q2-2018 Earnings Call and Webcast2
(*) Non-US GAAP reconciliations are disclosed in our regulatory filings available at www.sec.gov or www.autoliv.com
Copyright Autoliv Inc., All Rights Reserved
Q2´18 Highlights
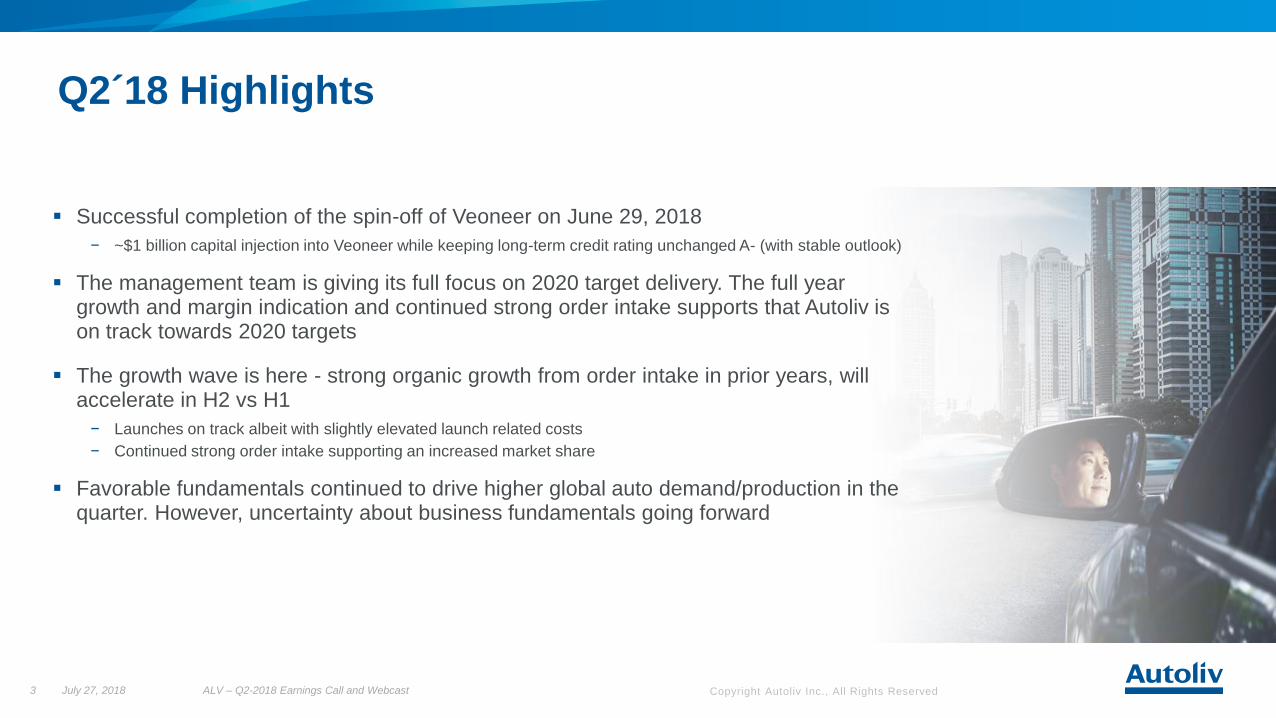
▪ Successful completion of the spin-off of Veoneer on June 29, 2018
− ~$1 billion capital injection into Veoneer while keeping long-term credit rating unchanged A- (with stable outlook)
▪ The management team is giving its full focus on 2020 target delivery. The full year growth and margin indication and continued strong order intake supports that Autoliv is on track towards 2020 targets
▪ The growth wave is here - strong organic growth from order intake in prior years, will accelerate in H2 vs H1
− Launches on track albeit with slightly elevated launch related costs
− Continued strong order intake supporting an increased market share
▪ Favorable fundamentals continued to drive higher global auto demand/production in the quarter. However, uncertainty about business fundamentals going forward
3 July 27, 2018 ALV – Q2-2018 Earnings Call and Webcast

Copyright Autoliv Inc., All Rights Reserved
Step-up in sales growth from past three years order intake
July 27, 2018 ALV – Q2-2018 Earnings Call and Webcast4
Q2´18 Financial Highlights
1,984
2,212
Q2´17 Q2´18
Consolidated Sales$ million
216
230
Q2´17 Q2´18
Operating Income adjusted*$ million
1.50
2.22
Q2´17 Q2´18
EPS adjusted*$
>11% >6%
(*) Non-US GAAP measures exclude costs for capacity alignments and antitrust related matters.
~48%

Copyright Autoliv Inc., All Rights Reserved
AMERICAS
12.8%LVP* 0%
EUROPE
0.3%LVP* 4%
REST OF ASIA
1.4%LVP* 5%
JAPAN
3.5%LVP* 1%
CHINA
18.0%LVP* 9%
Q2´18 Sales Growth
Regional Organic Growth**Sales Bridge
+11.5%
Org. growth
+7.3%
July 27, 2018 ALV – Q2-2018 Earnings Call and Webcast5
(*) Light Vehicle Production (LVP) according to IHS @ July 16, 2018,
(**) Non-US GAAP measure.
$ million

Copyright Autoliv Inc., All Rights ReservedJuly 27, 2018 ALV – Q2-2018 Earnings Call and Webcast6
These models are anticipated to contribute ~$0.5B towards the expected Organic Sales growth of ~8% in FY’18
2018 - Key ModelsContributing to the ramp-up of organic sales* growth
Honda Accord Tesla Model 3
VW PoloHonda Odyssey
Honda CR-V
(*) Non-US GAAP measure.
Nissan Qashqai / Rogue Hyundai Genesis G70
Jeep Compass Ram Truck
Jeep Wrangler
Infinity QX50 Nissan Altima Volkswagen Jetta

Copyright Autoliv Inc., All Rights Reserved
Product Launches per Quarter
July 27, 2018 ALV – Q2-2018 Earnings Call and Webcast7
0
50
100
150
200
250
Num
be
r o
f L
au
nch
es
2016 2017 2018 2019
~600
~740
Q2’18 increased >70% YoY
~600
+25%

Copyright Autoliv Inc., All Rights Reserved
Major light vehicle markets remain uncertain
July 27, 2018 ALV – Q2-2018 Earnings Call and Webcast8
Overall Market Conditions
FY’18 Light Vehicle Production*
RegionMillions of
Vehicles
YoY Chg.
@ July 16th
China 27.2 2%
Japan 9.0 0%
RoA* 13.1 4%
North America 16.0 1%
South America 3.6 10%
Europe 22.5 2%
Global 94.2 2.2%
▪ Asia− In Q2´18, China’s LV sales rose by 8% to nearly 6.5 million behind strong deliveries in April and
May
− China inventory** levels are in line with last year, but have increased sequentially from Q1’18
− The Q3’18 LVP* is expected to increase YoY* in China by ~3%, ~0% in RoA* and ~2% in Japan
▪ Americas− US SAAR** continues on a high level, despite headwinds from rising interest rates, fuel prices and
geopolitical uncertainties. Inventories declined YoY to by ~250´units to ~68 days by the end of
Q2’18
− Q3’18 LVP in North America is expected to increase ~6% YoY. South America continues to rebound
and is expected to increase ~14% YoY
▪ Europe− EU28** light vehicle registrations increased by ~5% YoY in Q2´18
− Q3’18 LVP in Europe is expected to be relatively flat YoY whereof WEU* is expected to decrease
by ~2% while EEU* is expected to increase by ~7%
For Q3’18 we see lower production of certain models due to WLTP and uncertainty around trade tariffs
(*) Light Vehicle Production (LVP) according to IHS @ July 16, 2018, Year over Year (YoY), Rest of Asia (RoA), Western Europe (WEU), Eastern Europe (EEU),
(**) Source: ACEA, Ward’s Auto, CAAM, CADA.
Light Vehicle Sales LTM**

Copyright Autoliv Inc., All Rights Reserved
Trade and Regulatory Update
July 27, 2018 ALV – Q2-2018 Earnings Call and Webcast9
▪ Autoliv continues to monitor the trade and regulatory environment
▪ Monitoring the potential U.S. auto tariff and potential NAFTA re-negotiations
▪ China/S.Korean/U.S. trade tariffs
− Autoliv has imports/exports with both China and South Korea
− Our U.S. suppliers are net importers from China
− Chinese tariffs that have already impacted exports of vehicles from the US to China
− Mitigating this risk through a geographically diverse supply chain
▪ Aluminum and steel tariffs in U.S.
− Contributes to raw material headwind of ~$30M for FY’18
− Autoliv has received exclusions from the new tariffs for certain products
− Also mitigating this risk through a geographically diverse supply chain
▪ New EU emissions testing - Worldwide Harmonized Light Vehicles Test Procedure (WLTP)
− OEMs have acknowledged may not be able to execute required volume of testing
− OEMs may have to temporarily reduce production of certain models

Copyright Autoliv Inc., All Rights ReservedJuly 27, 2018 ALV – Q2-2018 Earnings Call and Webcast10
(*) Non-US GAAP measures exclude costs for capacity alignments and antitrust related matters. Earnings per share (EPS), Return on Capital Employed (RoCE) and Return on
Equity (RoE), (**) Global Light Vehicle Production (GLVP) according to IHS @ July 16, 2018.
** Cash flows is presented on a consolidated basis of both continuing and discontinued operations and net income attributable to a controlling interest.
(US $ Millions unless specified) 2018 2017
Sales $2,212 $1,984
Gross Profit $440 19.9% $415 20.9%
Operating Income* $230 10.4% $216 10.9%
EPS* (assuming dilution) $2.22 $1.50
RoCE* 21% n/a
RoE* 25% n/a
Operating cash flow** $47 $179
Dividend per share $0.62 $0.60
GLVP** (annual run rate) ~93M ~89M
Step-up in growth for new focused Autoliv
Q2´18 Financial Overview

Copyright Autoliv Inc., All Rights Reserved
Q2’18 vs. Prior Year
July 27, 2018 ALV – Q2-2018 Earnings Call and Webcast11
Operating Margin* Bridge
Adjusted Operating Margin of 10.4% includes ~70 bps increase in Raw material and Currency impact
(*) Non-US GAAP measures exclude costs for capacity alignments and antitrust related matters.
(0.5%)
Adj. EBIT
+6.4%
Copyright Autoliv Inc., All Rights Reserved
Cash Flow – including discontinued operations
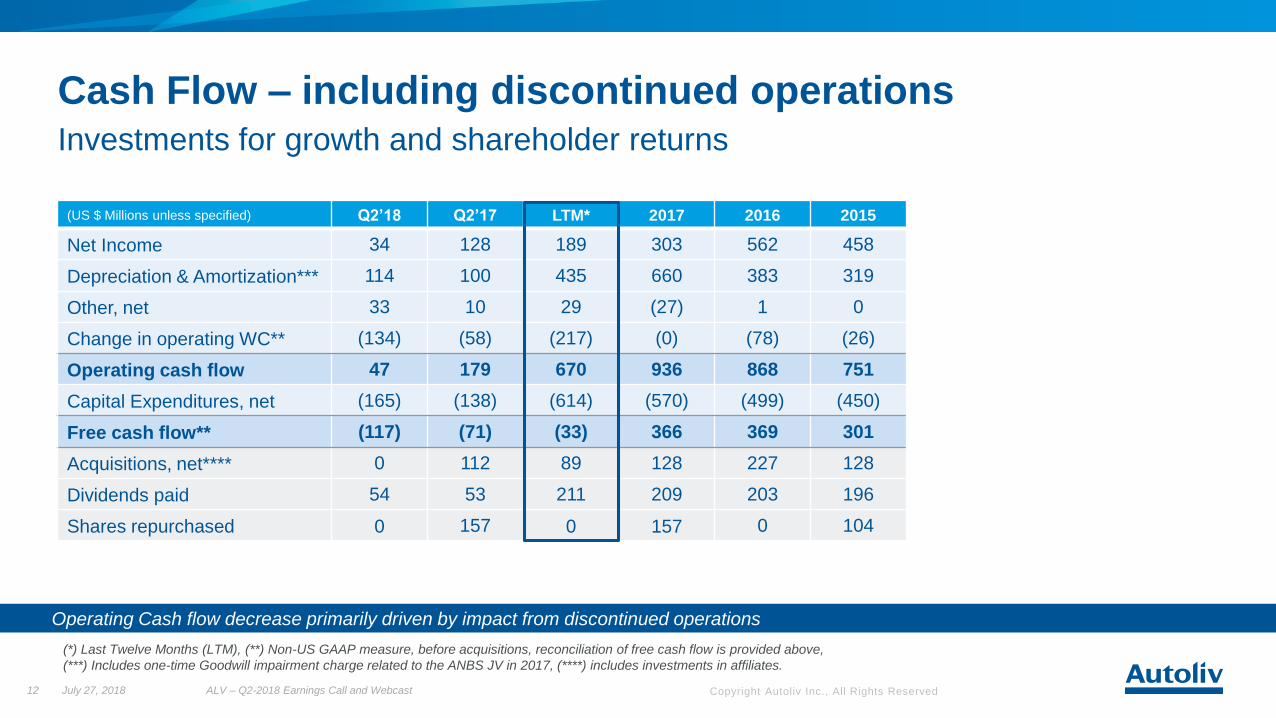
(US $ Millions unless specified) Q2’18 Q2’17 LTM* 2017 2016 2015
Net Income 34 128 189 303 562 458
Depreciation & Amortization*** 114 100 435 660 383 319
Other, net 33 10 29 (27) 1 0
Change in operating WC** (134) (58) (217) (0) (78) (26)
Operating cash flow 47 179 670 936 868 751
Capital Expenditures, net (165) (138) (614) (570) (499) (450)
Free cash flow** (117) (71) (33) 366 369 301
Acquisitions, net**** 0 112 89 128 227 128
Dividends paid 54 53 211 209 203 196
Shares repurchased 0 157 0 157 0 104
Investments for growth and shareholder returns
July 27, 2018 ALV – Q2-2018 Earnings Call and Webcast12
Operating Cash flow decrease primarily driven by impact from discontinued operations
(*) Last Twelve Months (LTM), (**) Non-US GAAP measure, before acquisitions, reconciliation of free cash flow is provided above,
(***) Includes one-time Goodwill impairment charge related to the ANBS JV in 2017, (****) includes investments in affiliates.

Copyright Autoliv Inc., All Rights ReservedJuly 27, 2018 ALV – Q2-2018 Earnings Call and Webcast13
Underlying EPS* improvementDriven by lower tax and higher operating income
$1.54
$2.20
Q2´17 Q2´18
Continuing Operations
$
$1.50
$2.22
Q2´17 Q2´18
+48%+43%
Continuing Operations excluding items
affecting comparability* $
(*) Non-US GAAP measures exclude costs for capacity alignments and antitrust related matters. Assuming dilution.
The main items impacting EPS* were
▪ ~58 cents from tax rate
▪ ~12 cents from operating income

Copyright Autoliv Inc., All Rights Reserved
Higher ROCE* and ROE* in the new corporate structure
July 27, 2018 ALV – Q2-2018 Earnings Call and Webcast14
Capital Structure
20% 20%
13%
21%
2015 2016 2017 Q2´18
ROCE* ROE* Shareholder returns
0
200
400
600
800
'09 '11 '13 '15 '17 LTM
Share Repurchase
Dividend
Free Cash flow
14%15%
7%
25%
2015 2016 2017 Q2'18
(*) Non-US GAAP measure Return on Capital Employee (ROCE), Return on Equity (ROE). For the periods 2015-2017 all returns are on a pre-spin basis.
$M
Additionally we distributed approximately $4 billion to shareholders in the spin-off of Veoneer
Copyright Autoliv Inc., All Rights Reserved
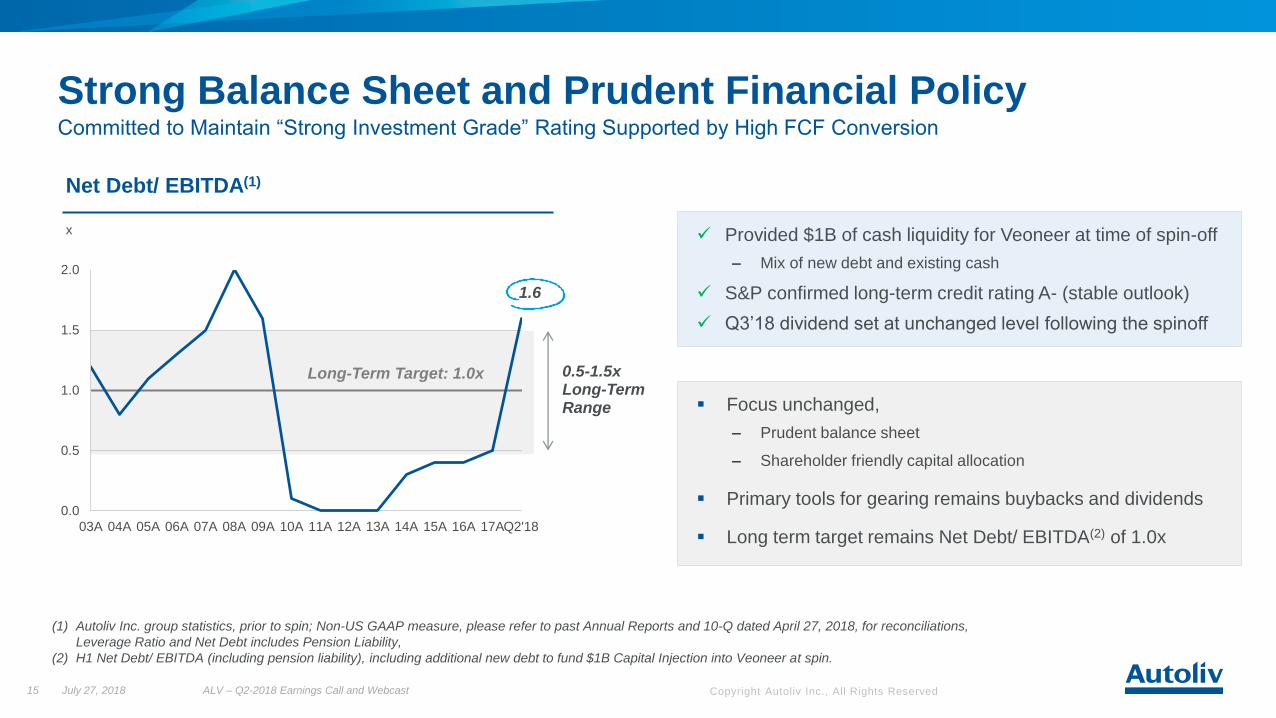
(1) Autoliv Inc. group statistics, prior to spin; Non-US GAAP measure, please refer to past Annual Reports and 10-Q dated April 27, 2018, for reconciliations,
Leverage Ratio and Net Debt includes Pension Liability,
(2) H1 Net Debt/ EBITDA (including pension liability), including additional new debt to fund $1B Capital Injection into Veoneer at spin.
✓ Provided $1B of cash liquidity for Veoneer at time of spin-off
‒ Mix of new debt and existing cash
✓ S&P confirmed long-term credit rating A- (stable outlook)
✓ Q3’18 dividend set at unchanged level following the spinoff
Strong Balance Sheet and Prudent Financial PolicyCommitted to Maintain “Strong Investment Grade” Rating Supported by High FCF Conversion
0.0
0.5
1.0
1.5
2.0
03A 04A 05A 06A 07A 08A 09A 10A 11A 12A 13A 14A 15A 16A 17AQ2'18
Net Debt/ EBITDA(1)
x
Long-Term Target: 1.0x 0.5-1.5xLong-Term Range
July 27, 2018 ALV – Q2-2018 Earnings Call and Webcast15
1.6
▪ Focus unchanged,
‒ Prudent balance sheet
‒ Shareholder friendly capital allocation
▪ Primary tools for gearing remains buybacks and dividends
▪ Long term target remains Net Debt/ EBITDA(2) of 1.0x
Copyright Autoliv Inc., All Rights Reserved
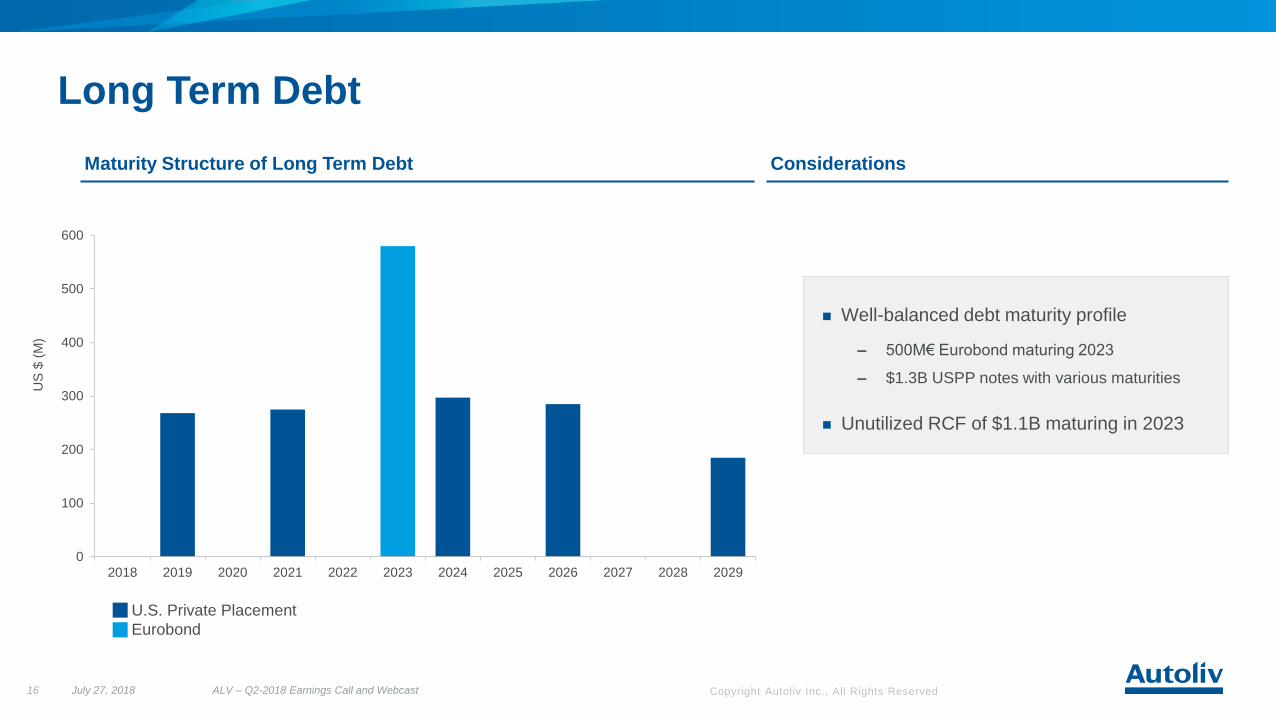
Long Term Debt
0
100
200
300
400
500
600
2018 2019 2020 2021 2022 2023 2024 2025 2026 2027 2028 2029
US
$ (
M)
Maturity Structure of Long Term Debt Considerations
16
U.S. Private Placement
Eurobond
July 27, 2018 ALV – Q2-2018 Earnings Call and Webcast
Well-balanced debt maturity profile
‒ 500M€ Eurobond maturing 2023
‒ $1.3B USPP notes with various maturities
Unutilized RCF of $1.1B maturing in 2023

Copyright Autoliv Inc., All Rights Reserved
Financial Outlook
July 27, 2018 ALV – Q2-2018 Earnings Call and Webcast17
Consolidated sales, net and operating margin*
FY’18
Sales
Organic* ~8%
Fx** ~2%
Consolidated Sales, net ~10%
Operating Margin* >11%
(*) Non-US GAAP measures exclude costs for capacity alignments, antitrust related matters and separation of the Electronics segment,
(**) Mid-July 2018 exchange rates.
Exchange rates** FY’18
EUR / US$ 1,1915
US$ / JPY 110,31
US$ / KRW 1100
US$ / MXN 19,03
US$ / CNY 6,52

autoliv.com
Each year, Autoliv’sproducts save over30,000 lives
Top Related