


Languages
Pages
Legal

1
1Q14 Earning Results

2
1Q14 Earning Results
Mexico City, April 24, 2014
QC – Doing Things Right Management’s Discussion & Analysis
During the quarter, we acquired a company with licenses to operate in 14 states within
the United States, including the border zones of California, Arizona and Texas. With this
deal we founded Quálitas Insurance Company, Inc., investing an initial equity of US$15
million. The company we purchased stopped operating 3 years ago, so it does not have
any current contingencies or liabilities. We consider this acquisition as strategic because it
will allow us to focus on a new and attractive market, in which our experience,
specialization and economies of scale should prove very profitable.
The market segment we will target with this subsidiary is that of Fleet clients based in
Mexico, which cross the border to deliver merchandise. Sales of these policies will take
place in Mexico, where we currently have over 30% of the truck market.
Also during the quarter, the administrative rules for the operation of the Third Party
Liability Mandatory Insurance for vehicles circulating in federal roads and bridges were
published in the Mexican Official Gazette. From these rules we conclude that the impact
on Quálitas México’s results will be marginal and that its implementation will take place
gradually.
For Quálitas, the results attained were satisfactory across all aspects of the business.
Premiums earned achieved an attractive growth rate, of 11.9%, over a high 1Q13
comparison base. Moreover, premiums written rose by 15.3%, driven by the vitality of the
Fleet and Financial Institutions segments.
We maintained considerable costs containment, achieving a significant combined ratio for
the period of 89.2%. As a result of the actions we undertook, and that we are still
implementing to control the average costs of material damages, we succeeded in
maintaining the L&LAE ratio at 64.6%. The operating income reached $154.
On the other hand, it was a good quarter for our investment portfolio. In spite of the
strong market volatility, we continue in line to attain our target yield for the year of Cetes
+ 200 b.p. We decreased our position in fixed rate and real rate bonds, and restructured
our equities portfolio. Net income for the period amounted to $234.
3
1Q14 Earning Results
In our international operations, in Quálitas El Salvador we are consolidating the necessary
structures, both in service offices as in claims assistance, to offer a quality service
profitably. In Quálitas Costa Rica there is still an important market potential since the INS,
decentralized State Institution that during 84 years was the only insurance broker in the
country, still maintains 87% of the market’s total premiums, and in the case of automobile
insurance, 96% of the total.
Throughout the document, figures are expressed in millions of pesos, except when otherwise
specified. Figures may vary due to rounding; variations expressed are with regard to the same
period in 2013.
4
1Q14 Earning Results
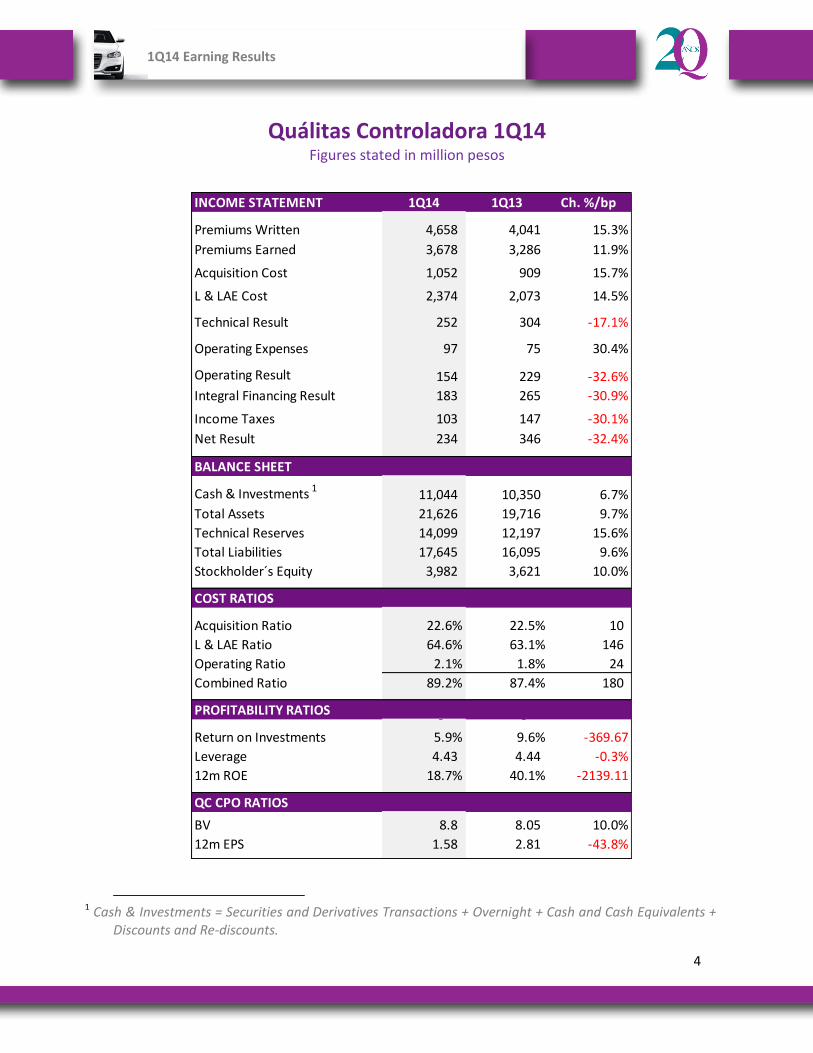
Quálitas Controladora 1Q14 Figures stated in million pesos
1
INCOME STATEMENT 1Q14 1Q13 Ch. %/bp
Premiums Written 4,658 4,041 15.3%
Premiums Earned 3,678 3,286 11.9%- -
0.0%
Acquisition Cost 1,052 909 15.7%
L & LAE Cost 2,374 2,073 14.5%
Technical Result 252 304 -17.1%
Operating Expenses 97 75 30.4%- -
0.0%
Operating Result 154 229 -32.6%
Integral Financing Result 183 265 -30.9%- -
0.0%
Income Taxes 103 147 -30.1%
Net Result 234 346 -32.4%- -
BALANCE SHEET
Cash & Investments 11,044 10,350 6.7%
Total Assets 21,626 19,716 9.7%
Technical Reserves 14,099 12,197 15.6%
Total Liabilities 17,645 16,095 9.6%
Stockholder´s Equity 3,982 3,621 10.0%
COST RATIOS
Acquisition Ratio 22.6% 22.5% 10
L & LAE Ratio 64.6% 63.1% 146
Operating Ratio 2.1% 1.8% 24
Combined Ratio 89.2% 87.4% 180
PROFITABILITY RATIOS - -
Return on Investments 5.9% 9.6% -369.67
Leverage 4.43 4.44 -0.3%
12m ROE 18.7% 40.1% -2139.11
QC CPO RATIOS
BV 8.8 8.05 10.0%
12m EPS 1.58 2.81 -43.8%-
1 Cash & Investments = Securities and Derivatives Transactions + Overnight + Cash and Cash Equivalents +
Discounts and Re-discounts.
1
5
1Q14 Earning Results
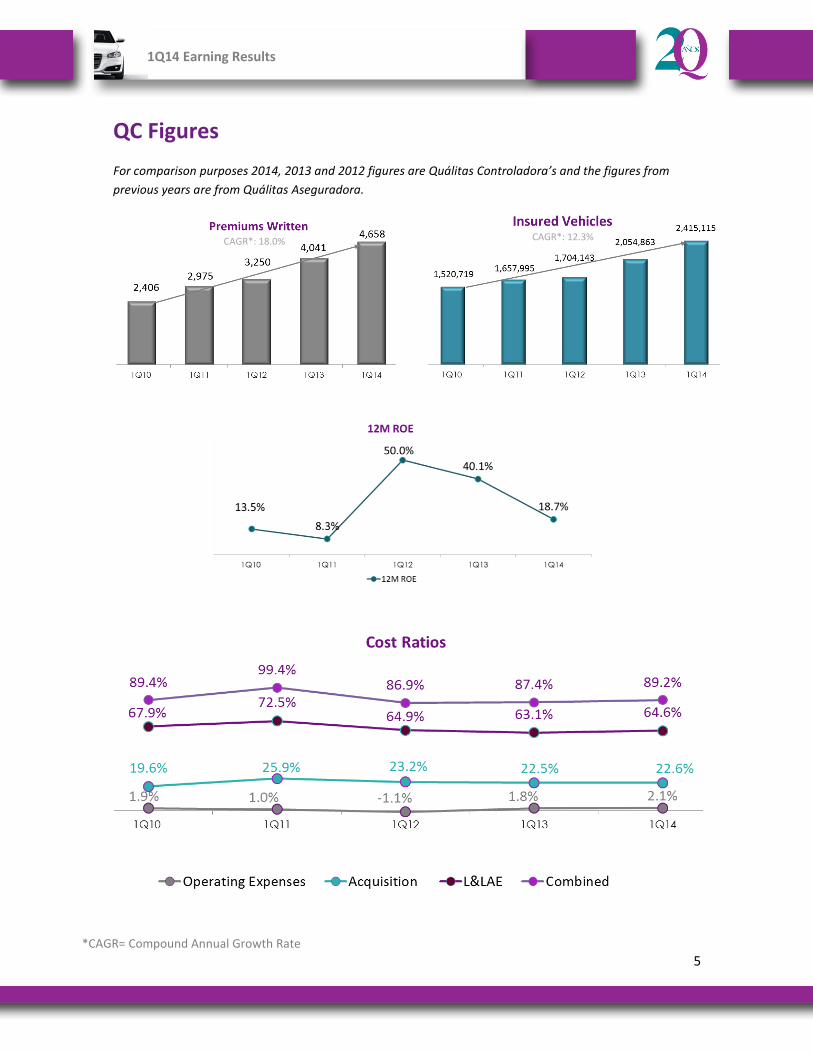
QC Figures
For comparison purposes 2014, 2013 and 2012 figures are Quálitas Controladora’s and the figures from
previous years are from Quálitas Aseguradora.
CAGR*: 18.0% CAGR*: 12.3%
*CAGR= Compound Annual Growth Rate

6
1Q14 Earning Results
QC - Financial Results 1Q14 Discussion & Analysis
Figures stated in million pesos
Premiums Written
Individual 1,042 1,055 -14 -1.3%
Fleets 1,633 1,397 235 16.8%
Sum of Traditional 2,675 2,453 222 9.0%
Toll Roads 103 24 79 331.2%
Financial Institutions 1,816 1,514 302 19.9%
Subsidiaries 65 50 15 30.3%
Total 4,658 4,041 618 15.3%
Ch. %Segment 1Q14 1Q13 Ch. $
Quálitas Controladora’s premiums written amounted to $4,658, increasing by 15.3%
during the quarter.
Qmx
In the Individual segment we continue operating in a very competitive market, which
brought about a decrease in sales of 1.3% during the quarter.
On the other hand, the Fleet segment registered a solid growth, of 16.8%, driven by new
businesses and the value added we provide clients with initiatives such as technological
innovation. Our agreements with technology companies have allowed us to offer clients
devices to decrease the frequency of accidents, as well as to explore new means to
measure their driving habits.
The Fleet segment also includes policies from Collectivities, which are groups of
employees and their relatives within one company, public or private. These policies can be
annual or have an 18 month term.
In the Financial Institutions segment, the recovery in automobile financing and new car
sales attained during 2013 allowed for an important growth, of 19.9%.
Additionally, we registered a $103 premium in the Toll Roads segment during the quarter,
as a result of approximately 100 roads and bridges nationwide that we obtained at the
end of 2013 in the CAPUFE account.
7
1Q14 Earning Results
Qsv
In El Salvador, the economic environment was impacted by the uncertainty generated by
the presidential elections in February and the tight margin which determined the winner
in March. This caused a decline in the country’s credit rating, in the financial market prices
and in the level of investments in the country.
In spite of this, we achieved a satisfactory growth of 22.1% during the quarter, reaching
$26 of premiums written. We have improved our working relation with some brokers and
increased our sales in the third party liability coverage.
Of our total policies, close to half are sold to the Individual segment, almost a third to
individuals and companies for commercial use, and the remaining are policies for car
rentals or public transportation.
Qcr
At the beginning of the year, the political environment generated uncertainty in the
country since the presidential elections in February did not surpass the 40% required to
elect a candidate. This implied holding a second voting starting April. This uncertainty
caused a contention in local and foreign investment, a slowdown in the economic activity,
a decrease in the price of government bonds and the exit of some foreign banks and
technology companies from the country.
Premiums written registered by our subsidiary, on the other hand, were very satisfactory,
reaching $23 with a 98.3% growth. While our main market segment continues being Fleets
with companies that rent cars, transport merchandise, and corporates, it is encouraging to
note the development of new segments. This development has been the result of the
service offered, of delegating the underwriting of policies to independent agents and of
using technological tools such as our On Line Operator.

8
1Q14 Earning Results
Premiums Written by Segment
Premiums Written per Period

9
1Q14 Earning Results
Insured Vehicles
Quálitas Controladora’s insured vehicles reached 2,415,115, increasing by 17.5%.
Business Line 1Q14 1Q13 Ch. %
Automobiles 1,631,862 1,353,835 20.5%
Trucks 587,158 532,985 10.2%
Subtotal 2,219,020 1,886,820 17.6%
Tourists 99,992 92,633 7.9%
Motorcycles 67,056 55,529 20.8%
Subsidiaries 29,047 19,881 46.1%
Insured Vehicles 2,415,115 2,054,863 17.5%
Qmx
Qmx’s insured vehicles reached 2,386,068, increasing by 17.3% during the quarter. This
increase exceeds the 15.1% growth in premiums written due to the sale of mandatory
insurance policies, which today comprise close to 6.0% of insured vehicles and contribute
less insured sums than the average policy.
Qsv
During the quarter, we reached 14,655 insured vehicles, a 26.1% growth.
Qcr
Qcr’s insured vehicles achieved a significant increase of 74.2%, reaching 14,392 units.
Premiums Ceded, Net Premiums Written and Reinsurance
Due to the profitability levels attained in past quarters, we do not keep proportional
reinsurance, so no premiums are ceded. On the other hand, we have a catastrophic
reinsurance contract for Qmx, Qsv and Qcr.
Premiums Earned
Premiums earned reached $3,678, a satisfactory growth of 11.9%, as a result of sales of
multiannual policies in the past, both in the Financial Institutions segment and in some
public institutions accounts within the Individual segment.

10
1Q14 Earning Results
Net Acquisition Cost
Quálitas Controladora’s acquisition cost amounted to $1,052, growing by 15.7%.
Qmx
The acquisition cost increased by 15.7%, in line with the growth in premiums written.
The acquisition cost ratio reached 22.8% for the quarter, and continues influenced by
higher commissions paid to intermediaries in a competitive market, both in the Individual
segment as in the Financial Institutions one.
Qsv
The acquisition cost ratio registered 30.0%, and is comprised by the commissions paid to
agents and the UOFs directed to the financial branch of a broker which sells approximately
30% of our premiums written.
Qcr
The acquisition cost ratio registered 15.7%, since most of our sales costs are still
commissions and bonuses paid to agents, while the UOFs paid to banks do not yet affect
significantly the acquisition costs.
L&LAE
L&LAE for QC amounted to $2,374, growing by 14.5% vis-à-vis the 1Q13 figure. We
maintained a very positive L&LAE ratio, of 64.6%.
Qmx
The L&LAE ratio remained fairly stable, at 64.9%, due to an important containment in the
direct an average costs of material damages as a result of the efforts initiated at the end
of 2013. Likewise, the trend in thefts continues downward, while our revenues from
salvages and recoveries maintain appropriate levels.
On the other hand, third party liability costs have risen due to the renewal of the Toll
Roads business and the increases in the severance costs in case of death established in the
Labor Law. While we do not yet have enough experience to calculate the impact of this
change, we consider that our ability to respond promptly to new circumstances will help

11
1Q14 Earning Results
us mitigate such impact. We also believe that, eventually, this guideline will generate a
culture of increased awareness in drivers.
Number of automobile thefts to insurance companies
Comparative 2000-2014
(January - March)
Qsv
The L&LAE ratio registered 69.5%. The economic slowdown has originated less
maintenance in cars and increased accidents.
The item that most contributes to the L&LAE is material damages and, to a lesser extent,
total losses. In material damages we have managed to diminish average costs significantly,
while frequency remains relevant. In thefts, on the other hand, there are few incidents.
Qcr
L&LAE have increased significantly in the last 6 months, upon the growth of the portfolio
of Collective policies with banks. We are working on improving the register of these
policies’ reserves, as well as on analyzing the increase in the frequency of material
damages.
We have also negotiated agreements with repair shops to lower the average repair costs,
incorporating our own adjusters to have a greater control on costs, and an internal audit
to review reserves on a weekly basis.

12
1Q14 Earning Results
Operating Expenses
QC’s operating expenses amounted to $97, which resulted in a favorable operating expenses ratio for the quarter, of 2.1%.
Qmx
Operating expenses remained at outstanding levels for the period, resulting in a 1.6% ratio. This is the result of our conservative expense policy and of revenues from policies’ fees.
Qsv
The operating expenses ratio stood at 5.0%. The main operating expenses are headcount, office leases, energy and depreciations.
Qcr
The operating expenses ratio was 28.8%, given the need to hire new personnel and to the change in the call center supplier. This change requires a higher fixed payment per vehicle but has allowed us to offer a better quality service in claims adjustment and roadside assistance.

13
1Q14 Earning Results
Integral Financing Result
During 1Q14, emerging markets experienced considerable volatility due to the slowdown
in China. Additionally, the Mexican market was affected by the decline in the country’s
consumer spending during the quarter, and benefitted from Moody’s upgrade of Mexico’s
sovereign rating to A3 with a stable perspective.
We continue in line to achieve our objective of Cetes + 200 b.p. During the quarter, we
decreased our bonds positions and integrated our equities portfolio. The annualized yield
for the quarter was 5.9%.
Portfolio by Type of Risk Portfolio by Type of Issuer
It is important to note that the valuation of investments differs in the countries in which
we operate:
In Qmx debt and equity investments, as well as other securities, are marked to
market.
In Qsv we only hold debt securities. When these have a maturity of less than 1
year, they are valued at acquisition price, registering the accrued interests. When
maturities are over 1 year, securities are marked to market.
In Qcr we also have only investments in debt securities, which are valued with the
effective interest method. This implies that the security is marked to market and
then: variations in price are registered in shareholders’ equity, while interest
income is recorded in the income statement.
14
1Q14 Earning Results
Taxes
Taxes for the period reached $103, which represents a 30.5% effective tax rate.
Net Result
We attained a solid net profit of $234, as a result of a satisfactory growth in premiums and
appropriate costs containment, as well as of a favorable investment income. Net profit
was 32.4% less than the same figure for the previous year.
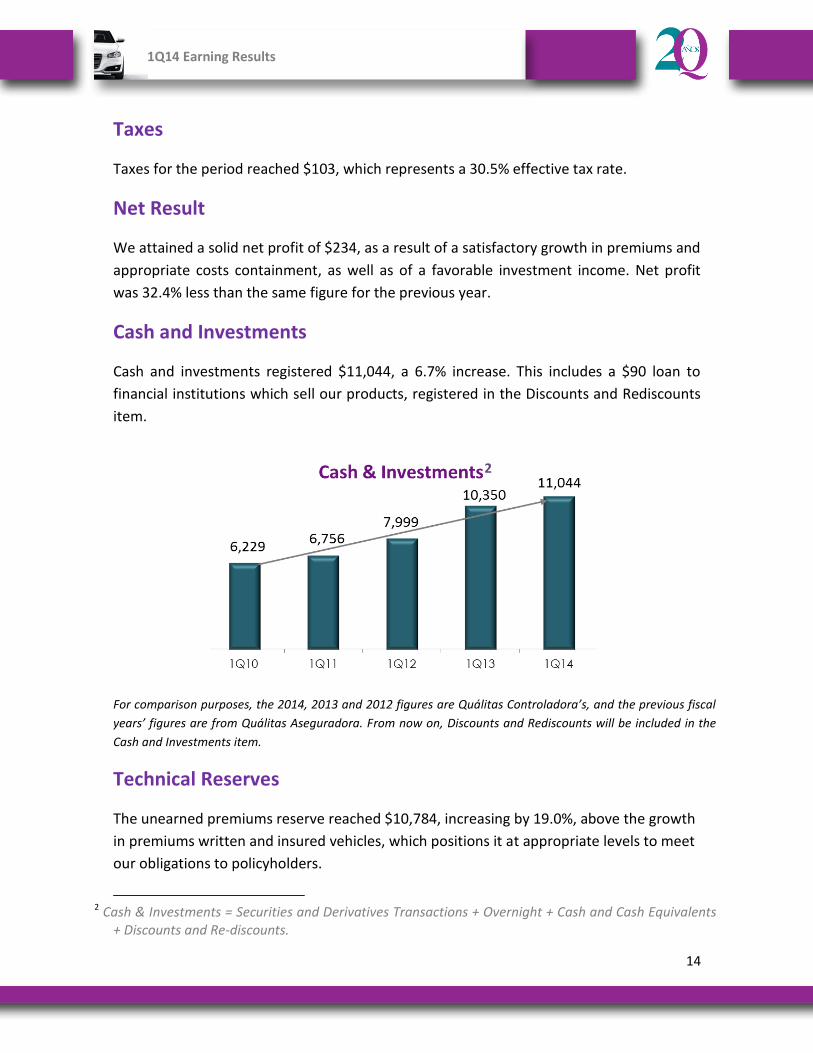
Cash and Investments
Cash and investments registered $11,044, a 6.7% increase. This includes a $90 loan to
financial institutions which sell our products, registered in the Discounts and Rediscounts
item.
2
For comparison purposes, the 2014, 2013 and 2012 figures are Quálitas Controladora’s, and the previous fiscal
years’ figures are from Quálitas Aseguradora. From now on, Discounts and Rediscounts will be included in the
Cash and Investments item.
Technical Reserves
The unearned premiums reserve reached $10,784, increasing by 19.0%, above the growth
in premiums written and insured vehicles, which positions it at appropriate levels to meet
our obligations to policyholders.
2 Cash & Investments = Securities and Derivatives Transactions + Overnight + Cash and Cash Equivalents
+ Discounts and Re-discounts.
2
15
1Q14 Earning Results
Solvency
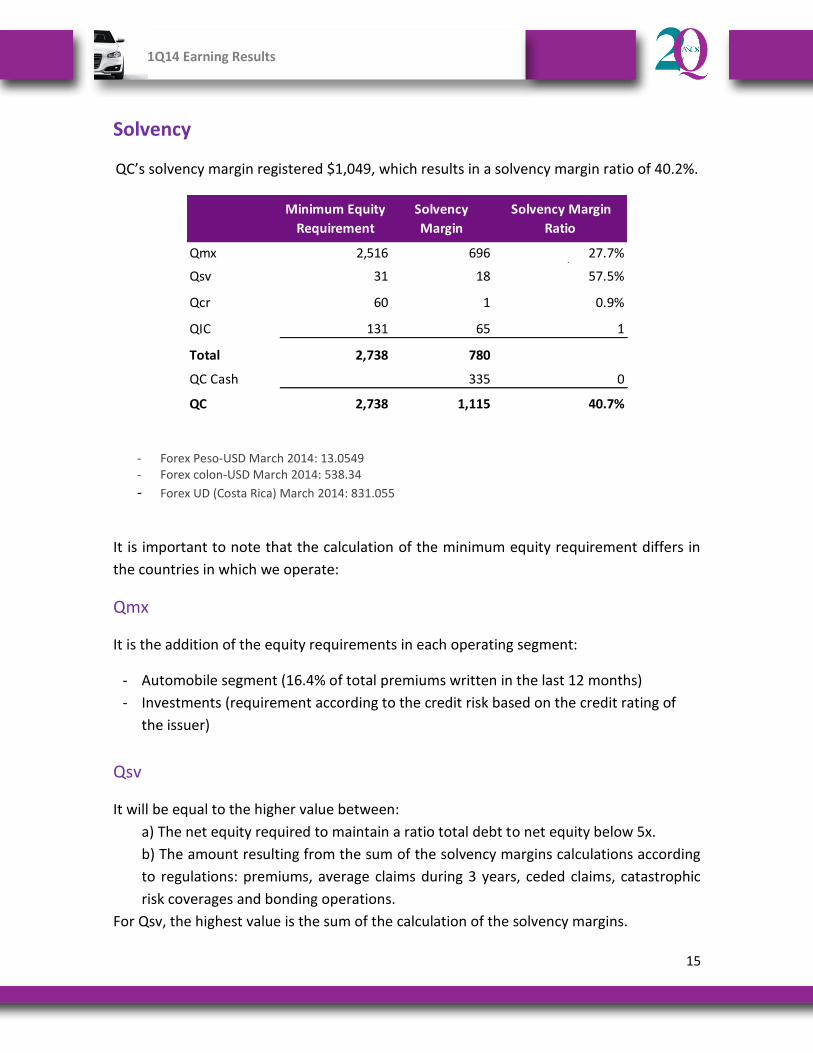
QC’s solvency margin registered $1,049, which results in a solvency margin ratio of 40.2%.
Qmx 2,516 696 27.7%0 0 #¡DIV/0!
Qsv 31 18 57.5%
Qcr 60 1 0.9%
QIC 131 65 1
Total 2,738 780
QC Cash 335 0
QC 2,738 1,115 40.7%
Solvency Margin
Ratio
Minimum Equity
Requirement
Solvency
Margin
- Forex Peso-USD March 2014: 13.0549 - Forex colon-USD March 2014: 538.34
- Forex UD (Costa Rica) March 2014: 831.055
It is important to note that the calculation of the minimum equity requirement differs in
the countries in which we operate:
Qmx
It is the addition of the equity requirements in each operating segment:
- Automobile segment (16.4% of total premiums written in the last 12 months)
- Investments (requirement according to the credit risk based on the credit rating of
the issuer)
Qsv
It will be equal to the higher value between:
a) The net equity required to maintain a ratio total debt to net equity below 5x.
b) The amount resulting from the sum of the solvency margins calculations according
to regulations: premiums, average claims during 3 years, ceded claims, catastrophic
risk coverages and bonding operations.
For Qsv, the highest value is the sum of the calculation of the solvency margins.

16
1Q14 Earning Results
Qcr
The minimum equity requirement is measured in development units. For insurance
companies of personal or general policies, the requirement is of 3 million development
units.
QIC
In Quálitas Insurance Company the initial minimum equity requirement amounts to
US$10, sum determined by the Authority to be able to launch operations.
17
1Q14 Earning Results
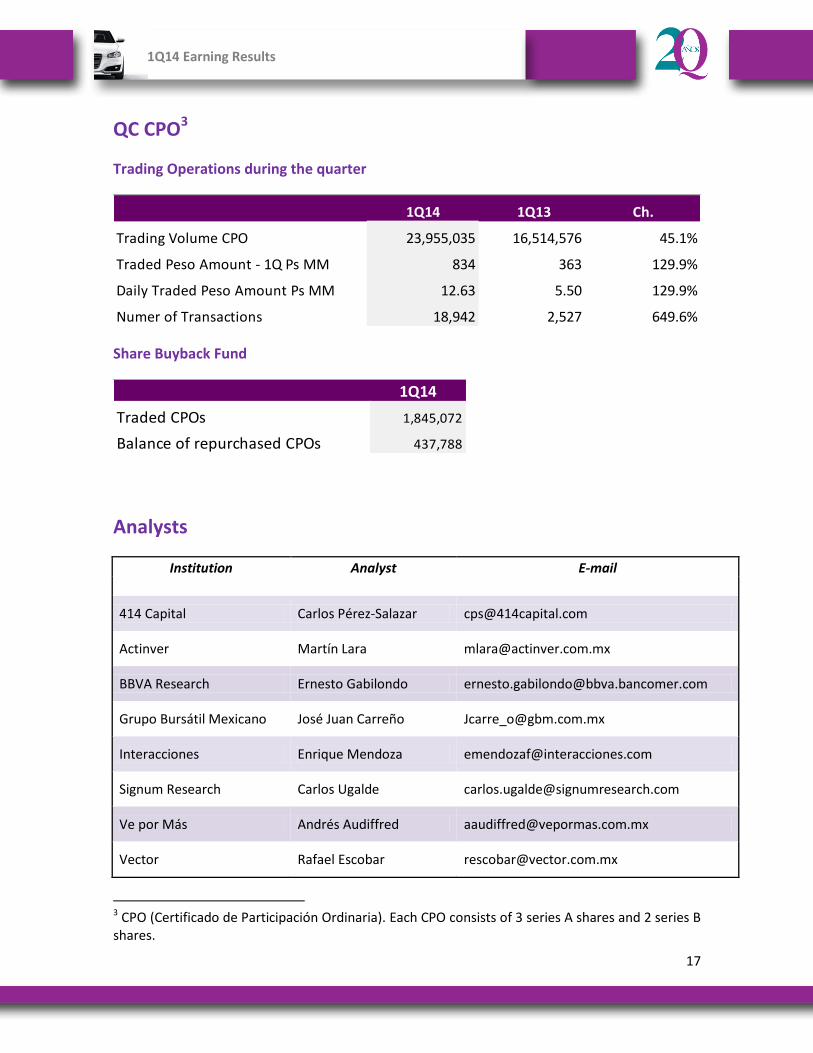
QC CPO3
Trading Operations during the quarter
1Q14 1Q13 Ch.
Trading Volume CPO 23,955,035 16,514,576 45.1%
Traded Peso Amount - 1Q Ps MM 834 363 129.9%
Daily Traded Peso Amount Ps MM 12.63 5.50 129.9%
Numer of Transactions 18,942 2,527 649.6%
Share Buyback Fund
1Q14
Traded CPOs 1,845,072
Balance of repurchased CPOs 437,788
Analysts
Institution Analyst E-mail
414 Capital Carlos Pérez-Salazar [email protected]
Actinver Martín Lara [email protected]
BBVA Research Ernesto Gabilondo [email protected]
Grupo Bursátil Mexicano José Juan Carreño [email protected]
Interacciones Enrique Mendoza [email protected]
Signum Research Carlos Ugalde [email protected]
Ve por Más Andrés Audiffred [email protected]
Vector Rafael Escobar [email protected]
3 CPO (Certificado de Participación Ordinaria). Each CPO consists of 3 series A shares and 2 series B shares.

18
1Q14 Earning Results
2014 2013
Assets
Investments 11,694,830,062 11,093,251,048
Securities and Derivatives Transactions 9,431,932,245 9,004,982,205
Securities 9,431,932,245 9,004,982,205
Government 1,381,455,672 2,244,071,767
Private Companies 7,296,371,558 6,064,179,343
Fixed Maturities 5,753,378,605 4,741,120,617
Equity 1,542,992,953 1,323,058,726
Foreign 217,790,696 137,172,015
Net Value 519,317,730 538,120,562
Interest Receivable 16,996,589 21,438,518
Overnight 1,252,637,403 1,246,066,131
Loans 103,786,864 14,643,859
Secured 17,043,005 13,353,628
Unsecured - -
Discounts and Re-discounts 90,000,000 4,625,000
(-) Allowance for Doubtful Accounts 3,256,141 3,334,769
Property 906,473,550 827,558,853
Real Estate 566,566,591 543,815,244
Net Value 385,179,542 323,508,553
(-) Depreciation 45,272,583 39,764,944
Reserve for Labor Obligations 62,407,677 50,811,397
Cash and Cash Equivalents 269,280,284 94,513,468
Cash and Banks 269,280,284 94,513,468
Debtors 7,851,224,389 6,831,427,002
Premiums 7,338,927,894 6,342,357,314
Agents and Adjusters 35,900,705 39,043,679
Accounts Receivable 83,320,282 92,698,956
Employee's loans 30,432,192 30,566,639
Other 415,786,020 373,930,160
(-) Allowance for Doubtful Accounts 53,142,704 47,169,746
Reinsurers and Re-Bonding Companies 161,154,122 75,426,926
Insurance and Bonds Institutions 3,246,304 7,209,402
Equity Participation of Reinsurers in Outstanding Claims 62,316,003 24,491,863
Equity Participation of Reinsurers in Unearned Premiums 91,275,952 39,497,619
Other Equity Participations 4,315,863 4,228,042
Permanent investments 270,882,552 15,790,785
Associate 226,570,381 564,650
Other permanent investments 44,312,171 15,226,135
Other Assets 1,316,462,422 1,554,329,004
Furniture and Equipment 339,460,933 322,432,886
Miscellaneous 970,408,993 1,230,430,028
Amortizable Expenses 13,137,799 11,390,123
(-) Amortization 6,545,303 9,924,033
Total Assets 21,626,241,508 19,715,549,630
QUALITAS CONTROLADORA, S.A.B. DE C.V.
Consolidated Balance Sheet as of March 31, 2014

19
1Q14 Earning Results
2014 2013
Liabilities
Underwriting Reserves 14,099,423,360 12,197,241,221
Unearned Premiums 10,783,712,388 9,064,660,657
Casualities 10,783,712,388 9,064,660,657
Contractual Obligations 3,315,579,086 3,131,987,915
For Claims and Maturities 3,116,242,477 2,939,946,285
For Incurred and Non-Reported Claims 98,522,738 95,885,722
For Dividends on Policies 35,835,998 33,275,626
For Premiums in Deposit 64,977,873 62,880,282
Preventive Reserve 131,886 592,649
Catastrophic Risks 131,886 592,649
Reserve for Labor Obligations 124,972,748 106,999,799
Creditors 1,855,941,731 1,972,845,287
Agents and Adjusters 659,109,455 549,664,977
Funds for Losses Management 6,519,493 3,801,669
Miscellaneous 1,190,312,783 1,419,378,641
Reinsurers and Re-Bonding Companies 99,003,222 33,215,152
Insurance and Bond Companies 99,003,222 33,215,152
Other Liabilities 1,465,213,027 1,784,352,192
Provisions for employee profit sharing 5,837,906 16,234,230
Income Tax Provisions 167,177,475 687,052,140
Other Obligations 1,143,886,686 964,289,812
Deferred Credits 148,310,960 116,776,010
Total Liabilities 17,644,554,088 16,094,653,651
Stockholder's Equity
Capital Stock 2,671,325,103 2,684,887,926
Capital Stock 2,684,887,926 2,684,887,926
(-) Acciones Propias Recompradas 13,562,823 0
Reserves 180,821,494 0
Para Adquisición de Acciones Propias 135,000,000 0
Valuation Surplus -9,050,635 -25,140,057
Retained Result 884,723,236 601,239,673
Net Income 238,246,412 353,742,186
Translation effect -103,266 -177,776
Minority Interest 15,725,076 6,344,027
Total Stockholder's Equity 3,981,687,421 3,620,895,979
Total Liabilities and Stockholder's Equity 21,626,241,508 19,715,549,630
QUALITAS CONTROLADORA, S.A.B. DE C.V.
Consolidated Balance Sheet as of March 31, 2014

20
1Q14 Earning Results
QUÁLITAS CONTROLADORA, S.A.B. DE C.V.
Consolidated Income Statements for the three months ended March 31, 2014
1Q14 1Q13
Premiums
Written 4,658,266,046 4,040,577,003
(-) Ceded 0 -2,224,145
Net premiums written 4,658,266,046 4,042,801,148
(-) Net increase in unearned premiums 980,128,895 756,786,668
Net premiums earned 3,678,137,151 3,286,014,480
(-) Net Acquisition Cost 1,052,127,701 909,236,172
Agents' commissions 297,526,853 265,730,065
Agent's additional compensation 61,938,090 59,402,366
(-) Comissions on ceded reinsurance 702,286 -
Excess loss coverage 3,611,262 -
Other 689,753,782 584,103,741
(-) Net Losses and loss adjustment expenses and other
contractual liabilities 2,374,408,096 2,073,263,935
Losses and other contractual liabilities 2,348,818,214 2,067,634,309
Losses on non-proportional reinsurance - -
Reclamaciones 25,589,882 5,629,626
Underwriting income (loss) 251,601,354 303,514,373
Gross (income) loss 251,601,354 303,514,373
(-) Net operating expenses 97,441,447 74,746,798
Administrative and Operating expenses 3,500,837 -22,110,243
Employees' compensation and benefits 54,143,800 61,537,884
Depreciation and Amortization 39,796,810 35,319,157
Operating income (loss) 154,159,907 228,767,575
Integral Financing Result 182,827,213 264,560,151
Investments 104,916,279 106,990,872
Sale of investments 24,396,048 44,321,609
Non-realized gain (loss) on investments 25,601,019 83,264,360
Premiums finance charge 29,106,989 28,473,499
Other -949,435 6,431,886
Foreign Exchange -243,687 -4,922,075
Participation in Permanent Investments Result - -
336,987,120 493,327,726
(-) Provision for income taxes 102,704,703 146,921,338
Income (Loss) before Discontinued Operations 234,282,417 346,406,388
Net income (loss) 234,282,417 346,406,388
Minority Interest -3,963,995 -7,335,798
Share holding 238,246,412 353,742,186
Net income (loss) 234,282,417 346,406,388
Income (loss) before taxes and employee's profit sharing

21
1Q14 Earning Results
Glossary of Terms and Definitions
Acquisition Cost: Includes commissions and compensations paid to agents and the fees paid to Financial Institutions for the sale of our policies (UOF).
Acquisition Ratio: Results from dividing the Acquisition Cost by Net Premiums Written.
CAGR: Compound Annual Growth Rate = [(End of Period Figure / Beginning of Period Figure) ^ (1/ Number of periods)]
Cash & Investments: Securities and Derivatives Transactions + Overnight + Cash and Cash Equivalents.
Combined Ratio: In the insurance industry, the combined ratio is used as a general performance measure. It results from the addition of the Acquisition, Operating, and L&LAE Ratios.
CNSF: National Insurance & Bonds Commission, the regulator of the insurance sector in Mexico.
CPO: Ordinary Participation Certificates. Quálitas shares are in deposit in a trust that issues the CPOs. The holders of the CPOs have rights over their shares in deposit. Each CPO consists of 3 series A shares and 2 series B shares.
EBTDA: Earnings before Taxes, Depreciation and Amortization. It differs from EBITDA in that, in EBTDA, the Investment Income is not subtracted, since it is part of the operation of insurance companies.
Financial Institutions: Institutions that belong to both Financial Groups as well as to the major automakers in the industry, responsible for credit sales of new automobiles.
L&LAE: Loss and Loss Adjustment Expenses: Includes the costs incurred in the payment of claims: valuation experts, adjusters, claim’s coordinators, and repair costs.
L&LAE Ratio: Results from dividing the L&LAE by Net Premiums Earned period.
22
1Q14 Earning Results
Minimum Equity Requirement: Is the minimum equity level that an insurance company should maintain, according to the authorities' requirements. In Mexico, in the automobile insurance industry, it is approximately calculated as the 16.4% of the premiums written in the last 12 months or the 25.1% of the net L&LAE for the last 36 months, that which results higher.
Multi-annual Policies: Policies with a term greater than 13 months. They are typically issued for the automobiles sold on credit.
Net Premiums Earned: Portion of premiums written that is registered as income as time goes by.
Net Premiums Written: Equal to premiums written less the part yielded to reinsurance.
Operating Expenses: Includes expenses incurred in by the Company in its regular operations.
Operating Ratio: Results from dividing Operating Expenses by Premiums Written.
Policies’ Fees: Administrative fee charged when the policy is issued and recorded as an income in operating expenses.
Premium Debtor: Records the portion of sold policies which will be paid in installments.
Premiums finance charge: Financial penalty imposed to policyholders that choose to pay their policy’s premium in installments.
Premiums Written: Premiums corresponding to policies underwritten.
Solvency Margin: Results from subtracting the Minimum Equity Requirement and the Underwriting Reserves, from the sum of Securities and Cash and Banks.
Solvency Margin Ratio: Results from dividing the Solvency Margin by the Minimum Equity Requirement.
UOF: Use of Facilities: Fees paid to the Financial Institutions for the sale of our insurance policies.
23
1Q14 Earning Results
Quálitas Controladora (QC), is a holding company whose purpose is to own companies related to auto insurance. The business model focuses on excellence in service and cost controls. Since 2007, it occupies the first place in the Mexican market with a 22.5% share as of December 2013, and has presence in El Salvador and Costa Rica.
Except for the historic information provided in this document, statements regarding the Company’s business outlook and estimated financial and operating results or regarding the Company’s growth potential, constitute forward-looking statements and are based
solely on management’s expectations regarding the economic and business conditions in countries where Quálitas operates.
Contacts at Quálitas:
Mariana Fernández
Investor Relations [email protected] T: +52 (55) 1555-6103
Anahí Escamilla
Investor Relations [email protected] T: +52 (55) 1555-6104
Alejandro Meléndez
Investments & Investor Relations Officer [email protected] T: +52 (55) 1555-6137
www.qualitas.com.mx
Top Related