


Languages
Pages
Legal

19
20
21
22
23
24

JS Bank LimitedMCB Bank Limited
Habib Bank Limited
Citi Bank N.A.Royal Bank of Scotland
Faysal Bank Limited
United Bank Limited HSBC Bank (Middle East) Limited
NIB Bank Limited Standard Chartered Bank (Pakistan) Limited
National Bank of Pakistan
Allied Bank Limited My Bank Limited
KASB Bank Limited Silk Bank Limited AtlasBank Limited
Al Baraka Bank Pakistan Limited
Mr. Aamer GhiasMr. Usman Rasheed
Mr. Khalid A.H. Al-Sagar ChairmanMr. Mueen Afzal Mr. Aehsun M.H. Shaikh Mr. Aamer Ghias Mr. Usman Rasheed
The Board of Directors of Azgard Nine Limited (“the Company”) hereby presents the un-audited interim financial statements for the fifteen months ended March 31, 2011.
PRINCIPAL ACTIVITIES
The Company's principal business is the vertically integrated manufacture and marketing of Denim focused Textile and Apparel products from raw cotton to retail ready products.
Azgard Nine, through its subsidiaries Agritech Limited (AGL) and Hazara Phosphate Fertilizers (Pvt.) Limited (HPFL), is also engaged in the manufacturing and marketing of both Nitrogenous and Phosphate fertilizers.
Textile and Apparel
A major financial reprofiling exercise was completed successfully during the period. This represents a significant breakthrough for The Company and its providers of debt finances. As a result The Company has been able to avert serious repercussions cascading out of the negative situation in the past year. The financial reprofiling has allowed The Company to manage its immediate financial needs and to continue its operations effectively albeit at a reduced capacity.
The Company is still faced with persistent issues primarily related to high cotton prices at a time when adequate cotton stocks could not be built. Cotton prices are hovering near record highs due to global market dynamics as well as loss of crops in Pakistan during the flooding, and it is anticipated that this situation will take the better part of this year to resolve.
In the present situation the Company is slowly and surely regaining its footing and starting to rebuild capacity as efficiently and cost effectively as possible. So far it has been able to increase capacity to 65% in March and is continuing its efforts to scale up operations at the most optimal rate. The dynamics involved in achieving peak manufacturing rates will likely require a period of one year for this goal to be achieved.
The Company looks forward to receiving the agreed support from the financial institutions enabling the Company to run its operations smoothly and at higher capacity and therefore achieve its targeted results.
Fertilizers
The Company's subsidiary, Agritech Limited (AGL), operates the newest and most efficient urea plant in the country. AGL through its 100% owned subsidiary Hazara Phosphate Fertilizers (Pvt.) Limited is also the largest manufacturer of Single Super Phosphate (SSP) fertilizer in Pakistan.
4
Directors’ Review
thUnscheduled gas shutdown from 27 December to present day, have resulted in a significant loss of operating days which is reflected in the financial reporting. The Company previously undertook a major plant revamp project to coincide with scheduled gas shutdown in order to minimize the loss of working days. The initial indications regarding the outcome of the revamp project are positive and it is expected that the projected capacity enhancement will be achieved. However the revamp project will only be fully tested once gas supply normalizes. Discussions are underway with concerned authorities in order to restore gas supply.
Operating Financial Results of Azgard Nine Limited (Stand Alone)
Consolidated Results Including Subsidiaries
Fifteen months endedMarch 31, 2010
Sales-Net
Operating Profit
Finance Cost
(Loss)/profit before Tax
Loss after Tax
Loss per share
Fifteen months ended1March 31, 201
13,988,051,325
600,142,327
(2,613,002,036)
(2,012,859,709)
(2,155,796,410)
(4.80)
15,012,036,511
3,088,484,432
(2,932,469,772)
142,845,605
(8,158,634)
(0.15)
Fifteen months endedMarch 31, 2010
Fifteen months endedMarch 31, 2011
23,962,966,990
2,050,545,243
(4,787,323,576)
(2,736,778,333)
(1,892,753,114)
(4.53)
31,964,352,697
6,964,004,512
5,849,782,888
1,030,505,241
1,128,126,197
2.42
Sales-Net
Operating Profit
Finance Cost
(Loss)/profit before Tax
(Loss)/profit after Tax
(Loss)/earning per share
Future Market Outlook
The demand outlook for Textile and Apparel is fundamentally sound with good volumes in the forecast. As a result of the financial reprofiling, The Company is able continue operations as expected and is steadily increasing production rates necessary for optimal manufacturing efficiencies and margins.
5

On behalf of the Board
Chief ExecutiveLahore: April 30, 2011
Uncertainties and long term challenges remain on the horizon in the shape of high interest rates, persisting energy crisis and rising utility costs, high cost of cotton, and deteriorating law and order conditions. However in light of all possible and necessary steps the company is taking to turn around the situation, it is expected that the efforts will produce positive results by the end of the year 2011.
Subject to a successful and sustained solution for the supply of gas, the future outlook for the Fertilizer business is expected to be positive. Agricultural demand and production is expected to be strong in the upcoming quarters, with good support prices anticipated for the major crops.
Acknowledgement
The Board would like to avail this opportunity to thank our valued customers and the financial institutions whose faith and support over the years has fostered strong relationships which have played a pivotal role in the growth of the Company.
The board also wishes to place on record its appreciation for the employees of the Company. All this has been possible with their hard work and commitment.
6
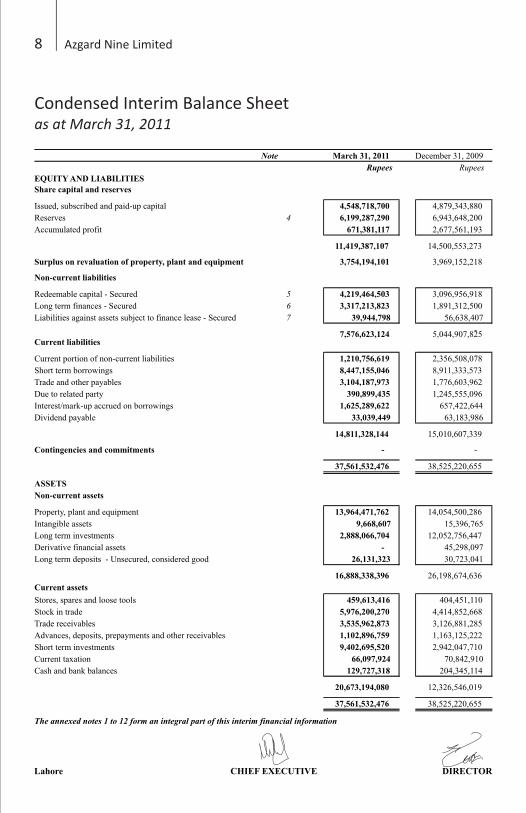
8
Condensed Interim Balance Sheetas at March 31, 2011
EQUITY AND LIABILITIES
Share capital and reserves
Issued, subscribed and paid-up capital 4,548,718,700
4,879,343,880
Reserves 4 6,199,287,290
6,943,648,200
Accumulated profit 671,381,117
2,677,561,193
11,419,387,107
14,500,553,273
Surplus on revaluation of property, plant and equipment 3,754,194,101
3,969,152,218
Non-current liabilities
Redeemable capital - Secured 5 4,219,464,503
3,096,956,918
Long term finances - Secured 6 3,317,213,823
1,891,312,500
Liabilities against assets subject to finance lease - Secured 7 39,944,798
56,638,407
-7,576,623,124
5,044,907,825
Current liabilities
Current portion of non-current liabilities 1,210,756,619
2,356,508,078
Short term borrowings 8,447,155,046
8,911,333,573
Trade and other payables 3,104,187,973
1,776,603,962
Due to related party 390,899,435
1,245,555,096
Interest/mark-up accrued on borrowings 1,625,289,622
657,422,644
Dividend payable 33,039,449
63,183,986
14,811,328,144
15,010,607,339
Contingencies and commitments -
-
37,561,532,476 38,525,220,655
ASSETS
Non-current assets
Property, plant and equipment 13,964,471,762
14,054,500,286
Intangible assets 9,668,607
15,396,765
Long term investments 2,888,066,704
12,052,756,447
Derivative financial assets -
45,298,097
Long term deposits - Unsecured, considered good 26,131,323
30,723,041
16,888,338,396
26,198,674,636
Current assets
Stores, spares and loose tools 459,613,416
404,451,110
Stock in trade 5,976,200,270
4,414,852,668
Trade receivables 3,535,962,873
3,126,881,285
Advances, deposits, prepayments and other receivables 1,102,896,759
1,163,125,222
Short term investments 9,402,695,520
2,942,047,710
Current taxation 66,097,924
70,842,910
Cash and bank balances 129,727,318 204,345,114
20,673,194,080 12,326,546,019
37,561,532,476 38,525,220,655
The annexed notes 1 to 12 form an integral part of this interim financial information
Note March 31, 2011 December 31, 2009
Rupees Rupees
9
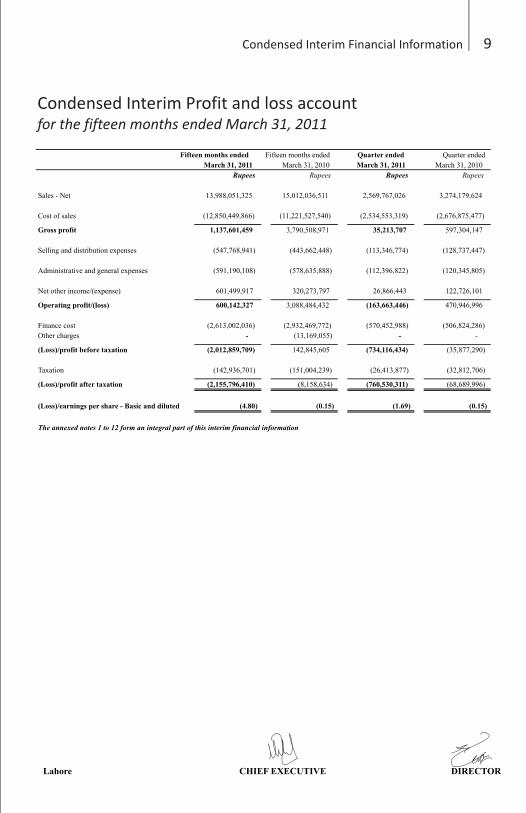
Condensed Interim Profit and loss accountfor the fifteen months ended March 31, 2011
Fifteen months ended Fifteen months ended Quarter ended Quarter ended
March 31, 2011 March 31, 2010 March 31, 2011 March 31, 2010
Rupees Rupees Rupees Rupees
Sales - Net 13,988,051,325
15,012,036,511
2,569,767,026
3,274,179,624
Cost of sales (12,850,449,866)
(11,221,527,540)
(2,534,553,319)
(2,676,875,477)
Gross profit 1,137,601,459
3,790,508,971
35,213,707
597,304,147
Selling and distribution expenses (547,768,941)
(443,662,448)
(113,346,774)
(128,737,447)
Administrative and general expenses (591,190,108)
(578,635,888)
(112,396,822)
(120,345,805)
Net other income/(expense) 601,499,917 320,273,797 26,866,443 122,726,101
Operating profit/(loss) 600,142,327
3,088,484,432
(163,663,446)
470,946,996
Finance cost (2,613,002,036)
(2,932,469,772)
(570,452,988)
(506,824,286)
Other charges -
(13,169,055)
-
-
(Loss)/profit before taxation (2,012,859,709)
142,845,605
(734,116,434)
(35,877,290)
Taxation (142,936,701)
(151,004,239)
(26,413,877)
(32,812,706)
(Loss)/profit after taxation (2,155,796,410)
(8,158,634)
(760,530,311)
(68,689,996)
(Loss)/earnings per share - Basic and diluted (4.80) (0.15) (1.69) (0.15)
The annexed notes 1 to 12 form an integral part of this interim financial information
8
Condensed Interim Balance Sheetas at March 31, 2011
EQUITY AND LIABILITIES
Share capital and reserves
Issued, subscribed and paid-up capital 4,548,718,700
4,879,343,880
Reserves 4 6,199,287,290
6,943,648,200
Accumulated profit 671,381,117
2,677,561,193
11,419,387,107
14,500,553,273
Surplus on revaluation of property, plant and equipment 3,754,194,101
3,969,152,218
Non-current liabilities
Redeemable capital - Secured 5 4,219,464,503
3,096,956,918
Long term finances - Secured 6 3,317,213,823
1,891,312,500
Liabilities against assets subject to finance lease - Secured 7 39,944,798
56,638,407
-7,576,623,124
5,044,907,825
Current liabilities
Current portion of non-current liabilities 1,210,756,619
2,356,508,078
Short term borrowings 8,447,155,046
8,911,333,573
Trade and other payables 3,104,187,973
1,776,603,962
Due to related party 390,899,435
1,245,555,096
Interest/mark-up accrued on borrowings 1,625,289,622
657,422,644
Dividend payable 33,039,449
63,183,986
14,811,328,144
15,010,607,339
Contingencies and commitments -
-
37,561,532,476 38,525,220,655
ASSETS
Non-current assets
Property, plant and equipment 13,964,471,762
14,054,500,286
Intangible assets 9,668,607
15,396,765
Long term investments 2,888,066,704
12,052,756,447
Derivative financial assets -
45,298,097
Long term deposits - Unsecured, considered good 26,131,323
30,723,041
16,888,338,396
26,198,674,636
Current assets
Stores, spares and loose tools 459,613,416
404,451,110
Stock in trade 5,976,200,270
4,414,852,668
Trade receivables 3,535,962,873
3,126,881,285
Advances, deposits, prepayments and other receivables 1,102,896,759
1,163,125,222
Short term investments 9,402,695,520
2,942,047,710
Current taxation 66,097,924
70,842,910
Cash and bank balances 129,727,318 204,345,114
20,673,194,080 12,326,546,019
37,561,532,476 38,525,220,655
The annexed notes 1 to 12 form an integral part of this interim financial information
Note March 31, 2011 December 31, 2009
Rupees Rupees
9
Condensed Interim Profit and loss accountfor the fifteen months ended March 31, 2011
Fifteen months ended Fifteen months ended Quarter ended Quarter ended
March 31, 2011 March 31, 2010 March 31, 2011 March 31, 2010
Rupees Rupees Rupees Rupees
Sales - Net 13,988,051,325
15,012,036,511
2,569,767,026
3,274,179,624
Cost of sales (12,850,449,866)
(11,221,527,540)
(2,534,553,319)
(2,676,875,477)
Gross profit 1,137,601,459
3,790,508,971
35,213,707
597,304,147
Selling and distribution expenses (547,768,941)
(443,662,448)
(113,346,774)
(128,737,447)
Administrative and general expenses (591,190,108)
(578,635,888)
(112,396,822)
(120,345,805)
Net other income/(expense) 601,499,917 320,273,797 26,866,443 122,726,101
Operating profit/(loss) 600,142,327
3,088,484,432
(163,663,446)
470,946,996
Finance cost (2,613,002,036)
(2,932,469,772)
(570,452,988)
(506,824,286)
Other charges -
(13,169,055)
-
-
(Loss)/profit before taxation (2,012,859,709)
142,845,605
(734,116,434)
(35,877,290)
Taxation (142,936,701)
(151,004,239)
(26,413,877)
(32,812,706)
(Loss)/profit after taxation (2,155,796,410)
(8,158,634)
(760,530,311)
(68,689,996)
(Loss)/earnings per share - Basic and diluted (4.80) (0.15) (1.69) (0.15)
The annexed notes 1 to 12 form an integral part of this interim financial information

10
Condensed Interim Statement of other comprehensive Incomefor the fifteen months ended March 31, 2011
Fifteen months ended Fifteen months ended Quarter ended Quarter ended
March 31, 2011 March 31, 2010 March 31, 2011 March 31, 2010
Rupees Rupees Rupees Rupees
(Loss)/profit after taxation (2,155,796,410)
(8,158,634)
(760,530,311)
(67,689,996)
Other comprehensive income/(loss):
Changes in fair value of cash flow hedges (17,449,338)
(81,892,584)
1,546,930
(16,598,254)
Available for sale financial assets - -
Changes in fair value of available for sale financial assets (279,417) 3,764,666,520 - 3,764,690,563
Surplus realized on derecognition. (762,382,985)
-
-
-
Incremental depreciation 214,958,117
19,716,821
42,753,598
5,428,605
-
-Taxation relating to components of other comprehensive income -
-
-
-
(565,153,623)
3,702,490,757
44,300,528
3,753,520,914
Total comprehensive income/(loss) (2,720,950,033)
3,694,332,123
(716,229,783)
3,685,830,918
The annexed notes 1 to 12 form an integral part of this interim financial information
11
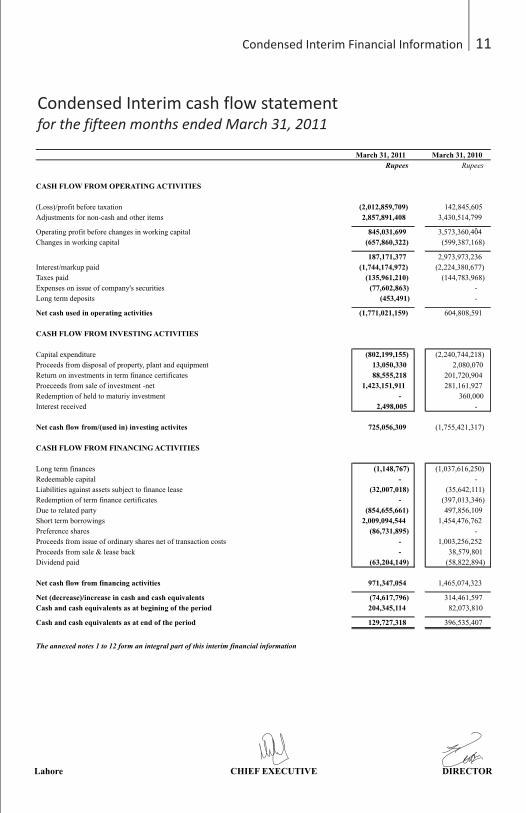
Condensed Interim cash flow statementfor the fifteen months ended March 31, 2011
CASH FLOW FROM OPERATING ACTIVITIES
(Loss)/profit before taxation (2,012,859,709) 142,845,605
Adjustments for non-cash and other items 2,857,891,408 3,430,514,799
-Operating profit before changes in working capital 845,031,699
3,573,360,404
Changes in working capital (657,860,322)
(599,387,168)
187,171,377
2,973,973,236
Interest/markup paid (1,744,174,972)
(2,224,380,677)
Taxes paid (135,961,210)
(144,783,968)
Expenses on issue of company's securities (77,602,863)
-
Long term deposits (453,491)
-
Net cash used in operating activities (1,771,021,159)
604,808,591
CASH FLOW FROM INVESTING ACTIVITIES
Capital expenditure (802,199,155)
(2,240,744,218)
Proceeds from disposal of property, plant and equipment 13,050,330
2,080,070
Return on investments in term finance certificates 88,555,218
201,720,904
Proeceeds from sale of investment -net 1,423,151,911 281,161,927
Redemption of held to maturiy investment - 360,000
Interest received 2,498,005
-
Net cash flow from/(used in) investing activites 725,056,309
(1,755,421,317)
CASH FLOW FROM FINANCING ACTIVITIES
Long term finances (1,148,767)
(1,037,616,250)
Redeemable capital -
-
Liabilities against assets subject to finance lease (32,007,018)
(35,642,111)
Redemption of term finance certificates -
(397,013,346)
Due to related party (854,655,661)
497,856,109
Short term borrowings 2,009,094,544
1,454,476,762
Preference shares (86,731,895)
-
Proceeds from issue of ordinary shares net of transaction costs -
1,003,256,252
Proceeds from sale & lease back -
38,579,801
Dividend paid (63,204,149)
(58,822,894)
Net cash flow from financing activities 971,347,054 1,465,074,323
Net (decrease)/increase in cash and cash equivalents (74,617,796) 314,461,597
Cash and cash equivalents as at begining of the period 204,345,114 82,073,810
Cash and cash equivalents as at end of the period 129,727,318 396,535,407
March 31, 2011 March 31, 2010
Rupees Rupees
The annexed notes 1 to 12 form an integral part of this interim financial information
10
Condensed Interim Statement of other comprehensive Incomefor the fifteen months ended March 31, 2011
Fifteen months ended Fifteen months ended Quarter ended Quarter ended
March 31, 2011 March 31, 2010 March 31, 2011 March 31, 2010
Rupees Rupees Rupees Rupees
(Loss)/profit after taxation (2,155,796,410)
(8,158,634)
(760,530,311)
(67,689,996)
Other comprehensive income/(loss):
Changes in fair value of cash flow hedges (17,449,338)
(81,892,584)
1,546,930
(16,598,254)
Available for sale financial assets - -
Changes in fair value of available for sale financial assets (279,417) 3,764,666,520 - 3,764,690,563
Surplus realized on derecognition. (762,382,985)
-
-
-
Incremental depreciation 214,958,117
19,716,821
42,753,598
5,428,605
-
-Taxation relating to components of other comprehensive income -
-
-
-
(565,153,623)
3,702,490,757
44,300,528
3,753,520,914
Total comprehensive income/(loss) (2,720,950,033)
3,694,332,123
(716,229,783)
3,685,830,918
The annexed notes 1 to 12 form an integral part of this interim financial information
11
Condensed Interim cash flow statementfor the fifteen months ended March 31, 2011
CASH FLOW FROM OPERATING ACTIVITIES
(Loss)/profit before taxation (2,012,859,709) 142,845,605
Adjustments for non-cash and other items 2,857,891,408 3,430,514,799
-Operating profit before changes in working capital 845,031,699
3,573,360,404
Changes in working capital (657,860,322)
(599,387,168)
187,171,377
2,973,973,236
Interest/markup paid (1,744,174,972)
(2,224,380,677)
Taxes paid (135,961,210)
(144,783,968)
Expenses on issue of company's securities (77,602,863)
-
Long term deposits (453,491)
-
Net cash used in operating activities (1,771,021,159)
604,808,591
CASH FLOW FROM INVESTING ACTIVITIES
Capital expenditure (802,199,155)
(2,240,744,218)
Proceeds from disposal of property, plant and equipment 13,050,330
2,080,070
Return on investments in term finance certificates 88,555,218
201,720,904
Proeceeds from sale of investment -net 1,423,151,911 281,161,927
Redemption of held to maturiy investment - 360,000
Interest received 2,498,005
-
Net cash flow from/(used in) investing activites 725,056,309
(1,755,421,317)
CASH FLOW FROM FINANCING ACTIVITIES
Long term finances (1,148,767)
(1,037,616,250)
Redeemable capital -
-
Liabilities against assets subject to finance lease (32,007,018)
(35,642,111)
Redemption of term finance certificates -
(397,013,346)
Due to related party (854,655,661)
497,856,109
Short term borrowings 2,009,094,544
1,454,476,762
Preference shares (86,731,895)
-
Proceeds from issue of ordinary shares net of transaction costs -
1,003,256,252
Proceeds from sale & lease back -
38,579,801
Dividend paid (63,204,149)
(58,822,894)
Net cash flow from financing activities 971,347,054 1,465,074,323
Net (decrease)/increase in cash and cash equivalents (74,617,796) 314,461,597
Cash and cash equivalents as at begining of the period 204,345,114 82,073,810
Cash and cash equivalents as at end of the period 129,727,318 396,535,407
March 31, 2011 March 31, 2010
Rupees Rupees
The annexed notes 1 to 12 form an integral part of this interim financial information

12C
on
den
sed
Inte
rim
Sta
tem
ent
of
chan
ges
in E
qu
ity
for
the
fift
een
mo
nth
s en
ded
Ma
rch
31
, 20
11
Pre
fere
nce
shar
esA
vail
able
Ord
inar
yP
refe
ren
ceS
har
eC
ash
flo
wR
eser
vere
dem
pti
onfo
r sa
leA
ccu
mu
late
dT
otal
shar
essh
ares
Tot
alp
rem
ium
hed
ges
on m
erge
rre
serv
efi
nan
cial
ass
ets
Tot
alp
rofi
teq
uit
y
Ru
pees
Ru
pees
Ru
pees
Ru
pees
Ru
pees
Ru
pees
Ru
pees
Ru
pees
Ru
pees
Ru
pees
Ru
pees
As
at J
anua
ry 0
1, 2
009
3,16
5,86
7,71
066
1,25
0,83
03,
827,
118,
540
2,73
7,84
1,49
915
2,63
5,94
010
5,15
2,00
551
7,50
0,00
019
,339
,558
3,53
2,46
9,00
22,
764,
494,
959
10,1
24,0
82,5
01
--
--
-
Issu
e of
bon
us s
hare
s63
3,17
3,53
0-
633,
173,
530
(633
,173
,530
)-
--
--
--
--
--
-
Issu
e of
rig
ht s
hare
s74
9,67
7,46
0-
749,
677,
460
262,
387,
112
--
--
--
1,01
2,06
4,57
2
-
-
-
-
-
Tra
nsac
tion
cos
ts in
curr
ed o
n is
sue
of r
ight
sha
res
-
-
-
(8,8
08,3
20)
-
-
-
--
-(8
,808
,320
)
-
-
-
-
-
Pro
fit f
or th
e tw
elve
mon
ths
ende
d D
ecem
ber
31, 2
009
-
-
-
-
-
-
-
--
60,5
31,3
6260
,531
,362
-
-
-
-
-
Oth
er c
ompr
ehen
sive
inco
me/
(los
s) f
or th
e tw
elve
mon
ths
ende
d D
ecem
ber
31, 2
009
-
-
-
-
(81,
892,
584)
-
-
3,76
4,66
6,52
03,
682,
773,
936
19,7
16,8
213,
702,
490,
757
-
-
-
-
-
Pro
fit t
rans
ferr
ed to
pre
fere
nce
shar
es r
edem
ptio
n re
serv
e-
-
-
-
-
-
10
8,00
0,00
0
-10
8,00
0,00
0(1
08,0
00,0
00)
-
Pre
fere
nce
shar
es c
alss
ifie
d as
cur
rent
liab
ilit
y(3
30,6
25,6
50)
(330
,625
,650
)
(3
30,6
25,6
50)
Pre
fere
nce
shar
e di
vide
nd(5
9,18
1,94
9)(5
9,18
1,94
9)
As
at D
ecem
ber
31, 2
009
4,54
8,71
8,70
033
0,62
5,18
0
4,87
9,34
3,88
0
2,35
8,24
6,76
1
70,7
43,3
56
105,
152,
005
625,
500,
000
3,78
4,00
6,07
87,
323,
242,
938
2,67
7,56
1,19
314
,500
,553
,273
As
at J
anua
ry 0
1, 2
010
4,54
8,71
8,70
033
0,62
5,18
04,
879,
343,
880
2,35
8,24
6,76
170
,743
,356
105,
152,
005
625,
500,
000
3,78
4,00
6,07
86,
943,
648,
200
2,67
7,56
1,19
314
,500
,553
,273
(Los
s) f
or th
e tw
elve
mon
ths
ende
d D
ecem
ber
31, 2
010
--
--
--
(2,1
55,7
96,4
10)
(2,1
55,7
96,4
10)
Oth
er c
ompr
ehen
sive
inco
me/
(los
s) f
or th
e tw
elve
mon
ths
ende
d D
ecem
ber
31, 2
010
--
--
(17,
449,
338)
-(7
62,6
62,4
02)
(780
,111
,740
)21
4,95
8,11
7(5
65,1
53,6
23)
Pre
fere
nce
shar
es c
lass
ifie
d as
cur
rent
liab
ilit
y(3
30,6
25,1
80)
(330
,625
,180
)-
--
--
--
(330
,625
,180
)
Pro
fit t
rans
ferr
ed to
pre
fere
nce
shar
es r
edem
ptio
n re
serv
e-
--
--
-35
,750
,830
35,7
50,8
30(3
5,75
0,83
0)-
Pre
fere
nce
shar
es d
ivid
end
(29,
590,
953)
(29,
590,
953)
As
at D
ecem
ber
31, 2
010
4,54
8,71
8,70
0-
4,54
8,71
8,70
02,
358,
246,
761
53,2
94,0
1810
5,15
2,00
566
1,25
0,83
03,
021,
343,
676
6,19
9,28
7,29
067
1,38
1,11
711
,419
,387
,107
Sh
are
cap
ital
Res
erve
s
Th
e an
nex
ed n
otes
1 t
o 12
for
m a
n i
nte
gral
par
t of
th
is i
nte
rim
fin
anci
al i
nfo
rmat
ion
Notes to the forming part of interim financial informationfor the fifteen months ended March 31, 2011
13
1 REPORTING ENTITY
1.1 Change in accounting year
2 BASIS OF PREPARATION
2.1 Statement of compliance
This condensed interim financial information is neither audited nor reviewed.
2.2 Financial liabilities and continuing operations
Reprofiling of debts
Divestment of shareholding in Agritech Limited
Azgard Nine Limited ("the Company") is incorporated in Pakistan as a Public Limited Company and is currently listed on Karachi Stock
Exchange (Guarantee) Limited. The Company is a composite spinning, weaving, dyeing and stitching unit engaged in the manufacture of
yarn, denim and denim products. The registered office of the Company is situated at Ismail Aiwan-e-Science, off Shahrah-e-Roomi, Lahore.
The interim financial information report is neither audited nor reviewed, and has been presented in condensed form and does not include all
the information as is required to be provided in a full set of annual financial statements. This condensed interim financial report should be
read in conjunction with the audited financial statements of the Company for the year ended December 31, 2009.
The comparative interim balance sheet as at December 31, 2009 and the related notes, are based on audited financial statements. The
comparative interim profit and loss account, interim statement of other comprehensive income, interim cash flow statement, interim
statement of changes in equity and related notes for the fifteen months ended March 31, 2011 are neither audited nor reviewed.
This condensed interim financial report of the Company for the year ended December 31, 2010 has been prepared in accordance with
the requirements of International Accounting Standard 34 - Interim Financial Reporting, as applicable in Pakistan and does not
include all the information as is required to be provided in a full set of annual financial statements. This condensed interim financial
information should be read in conjunction with the financial statements of the Company for the year ended December 31, 2009.
As mentioned in the annual report of the Company for the year ended December 31, 2009, the Company in line with the worldwide
and nationwide recessionary trends and other economic conditions is facing liquidity crisis. Due to liquidty problems and unavailability
of working capital finances, the Company was not able to make timely purchases of raw material and had to procure raw material at
higher prices, resulting in substantial increase in cost of sales. High finance costs also had an adverse impact on the profitability of
the Company. The Company has taken the following measures in this context for the management of liquid resources and for
The Company has been accorded approval by the relevant authorities to adopt the financial year to be from July 1st to June 30th in
line with that of the textile indutsry and also has obtained approvals from regulartory authorities to prepare financial statements
exceeding twelve months, and, accordingly the next audited financial statements of the Company will be prepared for eighteen
months ending June 30, 2011. As such this interim financial information has been prepared and circulated in compliance with the
requirements of Section 245 of the Companies Ordinance, 1984, as allowed by Securities and Exchange Commission of Pakistan.
This condensed interim financial report of the Company for the fifteen months ended March 31, 2011 has been prepared in accordance
with the requirements of International Accounting Standard 34 - Interim Financial Reporting, and provisions of and directives issued under
the Companies Ordinance, 1984. In case where requirements differ, the provisions of and directives issued under the Companies Ordinance,
Tthe Company during the year has entered into restructing / reprofiling agreement with providers of debt finances, whereby various
short term and long term debts aggregating to Rs. 8,417.18 million have been restructed / reprofiled and the Company has been
allowed graced periods of upto two years. The Company also has overdue debt finances and interest-mark-up thereon amounting to
Rs. 1,667 million (see note 10) as at March 31, 2011. Due to reprofiling/restructuring, grace periods, proposed sale of Agritech
Limited, the Company will be in a better position to manage its resources and operations and will be able to repay the overdues in due
As mentioned in note , the Company, during the period, divested 20.13% comprising 79,006,816 ordinary shares held by it in
Agritech Limited, through a combination of private placement and public offering, at a price of Rs. 30 per shares, including a
premium of Rs. 20 per share. Further, the shareholders of the Company, in the extraordinary general meeting held on July 23, 2010,
have approved the divestment of remaining 79.87% shares held in Agritech Limited. Majority of the funds generated through
divestment of remaining shares will be utilized towards repayment/prepayment of some of the Company's debts.

12
Co
nd
ense
d In
teri
m S
tate
men
t o
f ch
ange
s in
Eq
uit
yfo
r th
e fi
ftee
n m
on
ths
end
ed M
arc
h 3
1, 2
01
1
Pre
fere
nce
shar
esA
vail
able
Ord
inar
yP
refe
ren
ceS
har
eC
ash
flo
wR
eser
vere
dem
pti
onfo
r sa
leA
ccu
mu
late
dT
otal
shar
essh
ares
Tot
alp
rem
ium
hed
ges
on m
erge
rre
serv
efi
nan
cial
ass
ets
Tot
alp
rofi
teq
uit
y
Ru
pees
Ru
pees
Ru
pees
Ru
pees
Ru
pees
Ru
pees
Ru
pees
Ru
pees
Ru
pees
Ru
pees
Ru
pees
As
at J
anua
ry 0
1, 2
009
3,16
5,86
7,71
066
1,25
0,83
03,
827,
118,
540
2,73
7,84
1,49
915
2,63
5,94
010
5,15
2,00
551
7,50
0,00
019
,339
,558
3,53
2,46
9,00
22,
764,
494,
959
10,1
24,0
82,5
01
--
--
-
Issu
e of
bon
us s
hare
s63
3,17
3,53
0-
633,
173,
530
(633
,173
,530
)-
--
--
--
--
--
-
Issu
e of
rig
ht s
hare
s74
9,67
7,46
0-
749,
677,
460
262,
387,
112
--
--
--
1,01
2,06
4,57
2
-
-
-
-
-
Tra
nsac
tion
cos
ts in
curr
ed o
n is
sue
of r
ight
sha
res
-
-
-
(8,8
08,3
20)
-
-
-
--
-(8
,808
,320
)
-
-
-
-
-
Pro
fit f
or th
e tw
elve
mon
ths
ende
d D
ecem
ber
31, 2
009
-
-
-
-
-
-
-
--
60,5
31,3
6260
,531
,362
-
-
-
-
-
Oth
er c
ompr
ehen
sive
inco
me/
(los
s) f
or th
e tw
elve
mon
ths
ende
d D
ecem
ber
31, 2
009
-
-
-
-
(81,
892,
584)
-
-
3,76
4,66
6,52
03,
682,
773,
936
19,7
16,8
213,
702,
490,
757
-
-
-
-
-
Pro
fit t
rans
ferr
ed to
pre
fere
nce
shar
es r
edem
ptio
n re
serv
e-
-
-
-
-
-
10
8,00
0,00
0
-10
8,00
0,00
0(1
08,0
00,0
00)
-
Pre
fere
nce
shar
es c
alss
ifie
d as
cur
rent
liab
ilit
y(3
30,6
25,6
50)
(330
,625
,650
)
(3
30,6
25,6
50)
Pre
fere
nce
shar
e di
vide
nd(5
9,18
1,94
9)(5
9,18
1,94
9)
As
at D
ecem
ber
31, 2
009
4,54
8,71
8,70
033
0,62
5,18
0
4,87
9,34
3,88
0
2,35
8,24
6,76
1
70,7
43,3
56
105,
152,
005
625,
500,
000
3,78
4,00
6,07
87,
323,
242,
938
2,67
7,56
1,19
314
,500
,553
,273
As
at J
anua
ry 0
1, 2
010
4,54
8,71
8,70
033
0,62
5,18
04,
879,
343,
880
2,35
8,24
6,76
170
,743
,356
105,
152,
005
625,
500,
000
3,78
4,00
6,07
86,
943,
648,
200
2,67
7,56
1,19
314
,500
,553
,273
(Los
s) f
or th
e tw
elve
mon
ths
ende
d D
ecem
ber
31, 2
010
--
--
--
(2,1
55,7
96,4
10)
(2,1
55,7
96,4
10)
Oth
er c
ompr
ehen
sive
inco
me/
(los
s) f
or th
e tw
elve
mon
ths
ende
d D
ecem
ber
31, 2
010
--
--
(17,
449,
338)
-(7
62,6
62,4
02)
(780
,111
,740
)21
4,95
8,11
7(5
65,1
53,6
23)
Pre
fere
nce
shar
es c
lass
ifie
d as
cur
rent
liab
ilit
y(3
30,6
25,1
80)
(330
,625
,180
)-
--
--
--
(330
,625
,180
)
Pro
fit t
rans
ferr
ed to
pre
fere
nce
shar
es r
edem
ptio
n re
serv
e-
--
--
-35
,750
,830
35,7
50,8
30(3
5,75
0,83
0)-
Pre
fere
nce
shar
es d
ivid
end
(29,
590,
953)
(29,
590,
953)
As
at D
ecem
ber
31, 2
010
4,54
8,71
8,70
0-
4,54
8,71
8,70
02,
358,
246,
761
53,2
94,0
1810
5,15
2,00
566
1,25
0,83
03,
021,
343,
676
6,19
9,28
7,29
067
1,38
1,11
711
,419
,387
,107
Sh
are
cap
ital
Res
erve
s
Th
e an
nex
ed n
otes
1 t
o 12
for
m a
n i
nte
gral
par
t of
th
is i
nte
rim
fin
anci
al i
nfo
rmat
ion
Notes to the forming part of interim financial informationfor the fifteen months ended March 31, 2011
13
1 REPORTING ENTITY
1.1 Change in accounting year
2 BASIS OF PREPARATION
2.1 Statement of compliance
This condensed interim financial information is neither audited nor reviewed.
2.2 Financial liabilities and continuing operations
Reprofiling of debts
Divestment of shareholding in Agritech Limited
Azgard Nine Limited ("the Company") is incorporated in Pakistan as a Public Limited Company and is currently listed on Karachi Stock
Exchange (Guarantee) Limited. The Company is a composite spinning, weaving, dyeing and stitching unit engaged in the manufacture of
yarn, denim and denim products. The registered office of the Company is situated at Ismail Aiwan-e-Science, off Shahrah-e-Roomi, Lahore.
The interim financial information report is neither audited nor reviewed, and has been presented in condensed form and does not include all
the information as is required to be provided in a full set of annual financial statements. This condensed interim financial report should be
read in conjunction with the audited financial statements of the Company for the year ended December 31, 2009.
The comparative interim balance sheet as at December 31, 2009 and the related notes, are based on audited financial statements. The
comparative interim profit and loss account, interim statement of other comprehensive income, interim cash flow statement, interim
statement of changes in equity and related notes for the fifteen months ended March 31, 2011 are neither audited nor reviewed.
This condensed interim financial report of the Company for the year ended December 31, 2010 has been prepared in accordance with
the requirements of International Accounting Standard 34 - Interim Financial Reporting, as applicable in Pakistan and does not
include all the information as is required to be provided in a full set of annual financial statements. This condensed interim financial
information should be read in conjunction with the financial statements of the Company for the year ended December 31, 2009.
As mentioned in the annual report of the Company for the year ended December 31, 2009, the Company in line with the worldwide
and nationwide recessionary trends and other economic conditions is facing liquidity crisis. Due to liquidty problems and unavailability
of working capital finances, the Company was not able to make timely purchases of raw material and had to procure raw material at
higher prices, resulting in substantial increase in cost of sales. High finance costs also had an adverse impact on the profitability of
the Company. The Company has taken the following measures in this context for the management of liquid resources and for
The Company has been accorded approval by the relevant authorities to adopt the financial year to be from July 1st to June 30th in
line with that of the textile indutsry and also has obtained approvals from regulartory authorities to prepare financial statements
exceeding twelve months, and, accordingly the next audited financial statements of the Company will be prepared for eighteen
months ending June 30, 2011. As such this interim financial information has been prepared and circulated in compliance with the
requirements of Section 245 of the Companies Ordinance, 1984, as allowed by Securities and Exchange Commission of Pakistan.
This condensed interim financial report of the Company for the fifteen months ended March 31, 2011 has been prepared in accordance
with the requirements of International Accounting Standard 34 - Interim Financial Reporting, and provisions of and directives issued under
the Companies Ordinance, 1984. In case where requirements differ, the provisions of and directives issued under the Companies Ordinance,
Tthe Company during the year has entered into restructing / reprofiling agreement with providers of debt finances, whereby various
short term and long term debts aggregating to Rs. 8,417.18 million have been restructed / reprofiled and the Company has been
allowed graced periods of upto two years. The Company also has overdue debt finances and interest-mark-up thereon amounting to
Rs. 1,667 million (see note 10) as at March 31, 2011. Due to reprofiling/restructuring, grace periods, proposed sale of Agritech
Limited, the Company will be in a better position to manage its resources and operations and will be able to repay the overdues in due
As mentioned in note , the Company, during the period, divested 20.13% comprising 79,006,816 ordinary shares held by it in
Agritech Limited, through a combination of private placement and public offering, at a price of Rs. 30 per shares, including a
premium of Rs. 20 per share. Further, the shareholders of the Company, in the extraordinary general meeting held on July 23, 2010,
have approved the divestment of remaining 79.87% shares held in Agritech Limited. Majority of the funds generated through
divestment of remaining shares will be utilized towards repayment/prepayment of some of the Company's debts.

4 SHARE CAPITAL
Authorized share capital
Ordinary shares of Rs. 10 each
900,000,000 voting shares 9,000,000,000 9,000,000,000
300,000,000 non-voting shares 3,000,000,000 3,000,000,000
12,000,000,000 12,000,000,000
Preference shares of Rs. 10 each
300,000,000 non-voting shares 3,000,000,000 3,000,000,000
15,000,000,000 15,000,000,000
Issued, subscribed and paid-up capital
Voting ordinary shares of Rs. 10 each
323,712,733 shares fully paid in cash 3,237,127,330 3,237,127,330
62,548,641 shares issued as fully paid bonus shares 625,486,410 625,486,410
12,276,073 shares issued as consideration for machinery 122,760,730 122,760,730
50,811,992 shares issued as consideration on merger 508,119,920 508,119,920
4,493,494,390 4,493,494,390
Non-voting ordinary shares of Rs. 10 each
4,753,719 shares fully paid in cash 47,537,190 47,537,190
768,712 shares issued as fully paid bonus shares 7,687,120 7,687,120
55,224,310 55,224,310
Preference shares of Rs. 10 each (December 31, 2009: Rs. 10 each)
Nil (December 31, 2009: 33,062,518) shares fully paid in cash - 330,625,180
4,548,718,700 4,879,343,880
March 31, 2011 December 31, 2009
Rupees Rupees
2.3 Basis of measurement
2.3 Judgements, estimates and assumptions
2.4 Functional currency
3 SIGNIFICANT ACCOUNTING POLICIES
This condensed interim financial information has been prepared under the historical cost convention except for certain financial
instruments at fair value or amortized cost and certain items of property, plant and equipment at revalued amounts. In this financial
information, except for the amounts reflected in the cash flow statement, all transactions have been accounted for on accrual basis.
the Company is expected to continue its operations profitably, subject to impact, if any, of uncontrollable external circumstances
The preparation of financial information requires management to make judgements, estimates and assumptions that affect the
application of accounting policies and the reported amounts of assets, liabilities, income and expenses. The estimates and associated
assumptions and judgements are based on historical experience and various other factors that are believed to be reasonable under the
circumstances, the result of which forms the basis of making judgements about carrying values of assets and liabilities that are not
readily apparent from other sources. Actual results may differ from these estimates. Estimates and underlying assumptions are
reviewed on an ongoing basis. Revisions to accounting estimates are recognized in the period in which the estimate is revised and in
This financial information is prepared in Pak Rupees which is the Company's functional currency.
The accounting policies adopted for the preparation of this condensed interim financial information are consistent with those applied in the
preparation of the preceding annual published financial statements of the Company for the year ended December 31, 2009.
14
Notes to the forming part of interim financial informationfor the fifteen months ended March 31, 2011
Continuing operations
With the successful restrcuturing/reprofiling of the Company's debts, proposed divestment of shareholding in Agritech Limited, the
management of the Company envisages that sufficient financial resources will be available for the continuing operations of the
Company. With positive impact on the finance costs and more effective management of resources and raw material procurement,
March 31, 2011 December 31, 2009
Rupees Rupees
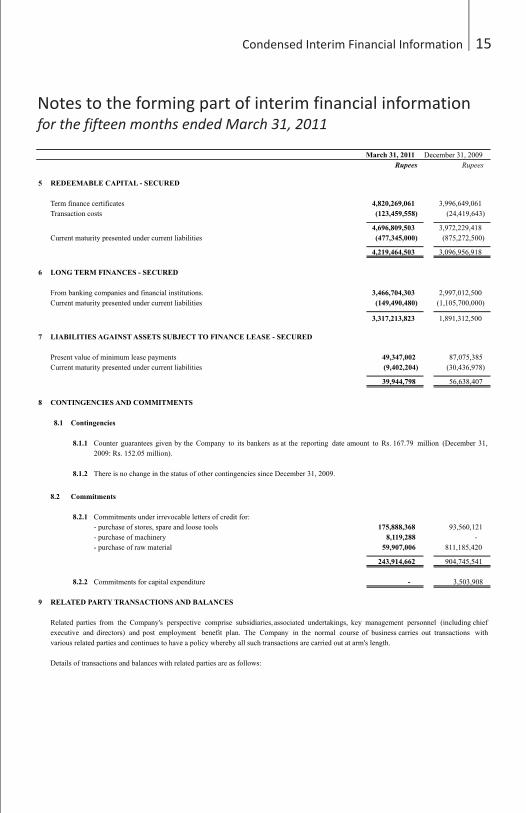
7 LIABILITIES AGAINST ASSETS SUBJECT TO FINANCE LEASE - SECURED
Present value of minimum lease payments 49,347,002 87,075,385
Current maturity presented under current liabilities (9,402,204) (30,436,978)
39,944,798 56,638,407
8 CONTINGENCIES AND COMMITMENTS
8.1 Contingencies
8.1.1
8.1.2
8.2 Commitments
8.2.1 Commitments under irrevocable letters of credit for:
- purchase of stores, spare and loose tools 175,888,368 93,560,121
- purchase of machinery 8,119,288 -
- purchase of raw material 59,907,006 811,185,420
243,914,662 904,745,541
8.2.2 Commitments for capital expenditure - 3,503,908
9 RELATED PARTY TRANSACTIONS AND BALANCES
Details of transactions and balances with related parties are as follows:
Counter guarantees given by the Company to its bankers as at the reporting date amount to Rs. 167.79 million (December 31,
2009: Rs. 152.05 million).
There is no change in the status of other contingencies since December 31, 2009.
Related parties from the Company's perspective comprise subsidiaries, associated undertakings, key management personnel (including chief
executive and directors) and post employment benefit plan. The Company in the normal course of business carries out transactions with
various related parties and continues to have a policy whereby all such transactions are carried out at arm's length.
5 REDEEMABLE CAPITAL - SECURED
Term finance certificates 4,820,269,061 3,996,649,061
Transaction costs (123,459,558) (24,419,643)
4,696,809,503 3,972,229,418
Current maturity presented under current liabilities (477,345,000) (875,272,500)
4,219,464,503 3,096,956,918
6 LONG TERM FINANCES - SECURED
From banking companies and financial institutions. 3,466,704,303 2,997,012,500
Current maturity presented under current liabilities (149,490,480) (1,105,700,000)
3,317,213,823 1,891,312,500
15
Notes to the forming part of interim financial informationfor the fifteen months ended March 31, 2011
4 SHARE CAPITAL
Authorized share capital
Ordinary shares of Rs. 10 each
900,000,000 voting shares 9,000,000,000 9,000,000,000
300,000,000 non-voting shares 3,000,000,000 3,000,000,000
12,000,000,000 12,000,000,000
Preference shares of Rs. 10 each
300,000,000 non-voting shares 3,000,000,000 3,000,000,000
15,000,000,000 15,000,000,000
Issued, subscribed and paid-up capital
Voting ordinary shares of Rs. 10 each
323,712,733 shares fully paid in cash 3,237,127,330 3,237,127,330
62,548,641 shares issued as fully paid bonus shares 625,486,410 625,486,410
12,276,073 shares issued as consideration for machinery 122,760,730 122,760,730
50,811,992 shares issued as consideration on merger 508,119,920 508,119,920
4,493,494,390 4,493,494,390
Non-voting ordinary shares of Rs. 10 each
4,753,719 shares fully paid in cash 47,537,190 47,537,190
768,712 shares issued as fully paid bonus shares 7,687,120 7,687,120
55,224,310 55,224,310
Preference shares of Rs. 10 each (December 31, 2009: Rs. 10 each)
Nil (December 31, 2009: 33,062,518) shares fully paid in cash - 330,625,180
4,548,718,700 4,879,343,880
March 31, 2011 December 31, 2009
Rupees Rupees
2.3 Basis of measurement
2.3 Judgements, estimates and assumptions
2.4 Functional currency
3 SIGNIFICANT ACCOUNTING POLICIES
This condensed interim financial information has been prepared under the historical cost convention except for certain financial
instruments at fair value or amortized cost and certain items of property, plant and equipment at revalued amounts. In this financial
information, except for the amounts reflected in the cash flow statement, all transactions have been accounted for on accrual basis.
the Company is expected to continue its operations profitably, subject to impact, if any, of uncontrollable external circumstances
The preparation of financial information requires management to make judgements, estimates and assumptions that affect the
application of accounting policies and the reported amounts of assets, liabilities, income and expenses. The estimates and associated
assumptions and judgements are based on historical experience and various other factors that are believed to be reasonable under the
circumstances, the result of which forms the basis of making judgements about carrying values of assets and liabilities that are not
readily apparent from other sources. Actual results may differ from these estimates. Estimates and underlying assumptions are
reviewed on an ongoing basis. Revisions to accounting estimates are recognized in the period in which the estimate is revised and in
This financial information is prepared in Pak Rupees which is the Company's functional currency.
The accounting policies adopted for the preparation of this condensed interim financial information are consistent with those applied in the
preparation of the preceding annual published financial statements of the Company for the year ended December 31, 2009.
14
Notes to the forming part of interim financial informationfor the fifteen months ended March 31, 2011
Continuing operations
With the successful restrcuturing/reprofiling of the Company's debts, proposed divestment of shareholding in Agritech Limited, the
management of the Company envisages that sufficient financial resources will be available for the continuing operations of the
Company. With positive impact on the finance costs and more effective management of resources and raw material procurement,
March 31, 2011 December 31, 2009
Rupees Rupees
7 LIABILITIES AGAINST ASSETS SUBJECT TO FINANCE LEASE - SECURED
Present value of minimum lease payments 49,347,002 87,075,385
Current maturity presented under current liabilities (9,402,204) (30,436,978)
39,944,798 56,638,407
8 CONTINGENCIES AND COMMITMENTS
8.1 Contingencies
8.1.1
8.1.2
8.2 Commitments
8.2.1 Commitments under irrevocable letters of credit for:
- purchase of stores, spare and loose tools 175,888,368 93,560,121
- purchase of machinery 8,119,288 -
- purchase of raw material 59,907,006 811,185,420
243,914,662 904,745,541
8.2.2 Commitments for capital expenditure - 3,503,908
9 RELATED PARTY TRANSACTIONS AND BALANCES
Details of transactions and balances with related parties are as follows:
Counter guarantees given by the Company to its bankers as at the reporting date amount to Rs. 167.79 million (December 31,
2009: Rs. 152.05 million).
There is no change in the status of other contingencies since December 31, 2009.
Related parties from the Company's perspective comprise subsidiaries, associated undertakings, key management personnel (including chief
executive and directors) and post employment benefit plan. The Company in the normal course of business carries out transactions with
various related parties and continues to have a policy whereby all such transactions are carried out at arm's length.
5 REDEEMABLE CAPITAL - SECURED
Term finance certificates 4,820,269,061 3,996,649,061
Transaction costs (123,459,558) (24,419,643)
4,696,809,503 3,972,229,418
Current maturity presented under current liabilities (477,345,000) (875,272,500)
4,219,464,503 3,096,956,918
6 LONG TERM FINANCES - SECURED
From banking companies and financial institutions. 3,466,704,303 2,997,012,500
Current maturity presented under current liabilities (149,490,480) (1,105,700,000)
3,317,213,823 1,891,312,500
15
Notes to the forming part of interim financial informationfor the fifteen months ended March 31, 2011

March 31, 2011 December 31, 2009
Rupees Rupees
9.2 Balances with related parties
9.2.1 Subsidiaries
Borrowings 390,899,435 1,245,555,096
Trade receivables 1,278,453,309 954,510,723
Markup payable 108,174,775 137,090,639
Investment in ordinary shares 9,003,317,920 10,612,790,135
Investment in term finance certificates 266,081,964 599,640,000
9.2.2 Associates
Trade payables - 1,877,139
9.2.3 Post-employment benefit plans
Payable to employees provident fund trust 13,514,583 5,352,298
9.2.4 Key Management Personnel
Short term employee benefits payable 3,772,400 1,517,000
10 OVERDUES DEBT FINANCES
10.1 Due to circumstances, described in note 2.2, the following debts are overdue.
Principal Interest/mark-up Total
Rupees Rupees Rupees
Redeemable capital 2,120,000 538,302,225 540,422,225
Long term finances - 167,627,280 167,627,280
Short term borrowings - 364,939,252 364,939,252
2,120,000 1,070,868,757 1,072,988,757
Fifteen months ended Fifteen months ended Quarter ended Quarter ended
March 31, 2011 March 31, 2010 March 31, 2011 March 31, 2010
Rupees Rupees Rupees Rupees
9.1 Transactions with related parties
9.1.1 Subsidiaries
Sale of goods 862,124,104 1,452,238,651 313,831,883 492,993,292
Return on investment in TFCs 88,555,218 135,311,901 10,100,697 20,810,795
Purchases of goods and services - 15,142,913 - -
119,884,136 181,438,625 18,430,663 55,327,458
9.1.2 Associates
Purchases of chemicals 2,857,196 6,941,645 - 536,800
9.1.3 Post-employment benefit plans
Contribution to employees provident fund 116,026,700 74,266,078 22,711,616 23,535,988
Interest on contribution payable 5,779,470 1,264,259
9.1.4 Key management personnel
Short-term employee benefits 48,723,500 38,511,354 11,654,700 19,423,367
Interest/markup on borrowing
16
Notes to the forming part of interim financial informationfor the fifteen months ended March 31, 2011
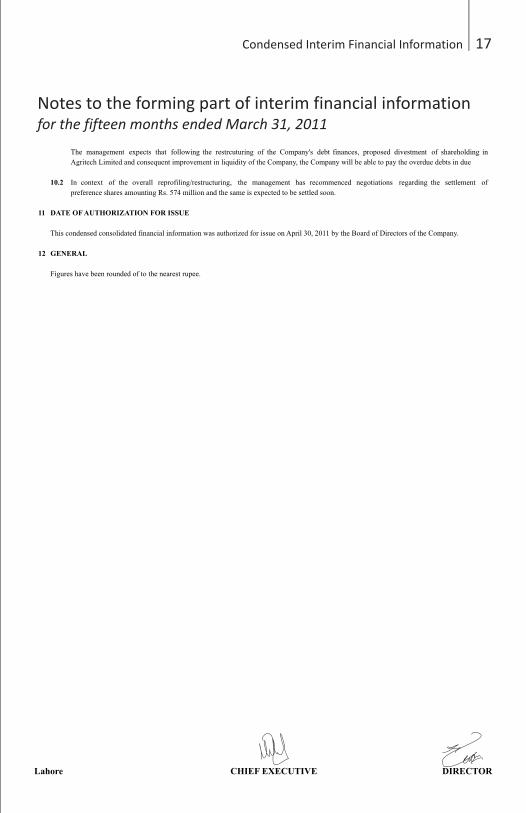
10.2
11 DATE OF AUTHORIZATION FOR ISSUE
This condensed consolidated financial information was authorized for issue on April 30, 2011 by the Board of Directors of the Company.
12 GENERAL
Figures have been rounded of to the nearest rupee.
In context of the overall reprofiling/restructuring, the management has recommenced negotiations regarding the settlement of
preference shares amounting Rs. 574 million and the same is expected to be settled soon.
The management expects that following the restrcuturing of the Company's debt finances, proposed divestment of shareholding in
Agritech Limited and consequent improvement in liquidity of the Company, the Company will be able to pay the overdue debts in due
17
Notes to the forming part of interim financial informationfor the fifteen months ended March 31, 2011
March 31, 2011 December 31, 2009
Rupees Rupees
9.2 Balances with related parties
9.2.1 Subsidiaries
Borrowings 390,899,435 1,245,555,096
Trade receivables 1,278,453,309 954,510,723
Markup payable 108,174,775 137,090,639
Investment in ordinary shares 9,003,317,920 10,612,790,135
Investment in term finance certificates 266,081,964 599,640,000
9.2.2 Associates
Trade payables - 1,877,139
9.2.3 Post-employment benefit plans
Payable to employees provident fund trust 13,514,583 5,352,298
9.2.4 Key Management Personnel
Short term employee benefits payable 3,772,400 1,517,000
10 OVERDUES DEBT FINANCES
10.1 Due to circumstances, described in note 2.2, the following debts are overdue.
Principal Interest/mark-up Total
Rupees Rupees Rupees
Redeemable capital 2,120,000 538,302,225 540,422,225
Long term finances - 167,627,280 167,627,280
Short term borrowings - 364,939,252 364,939,252
2,120,000 1,070,868,757 1,072,988,757
Fifteen months ended Fifteen months ended Quarter ended Quarter ended
March 31, 2011 March 31, 2010 March 31, 2011 March 31, 2010
Rupees Rupees Rupees Rupees
9.1 Transactions with related parties
9.1.1 Subsidiaries
Sale of goods 862,124,104 1,452,238,651 313,831,883 492,993,292
Return on investment in TFCs 88,555,218 135,311,901 10,100,697 20,810,795
Purchases of goods and services - 15,142,913 - -
119,884,136 181,438,625 18,430,663 55,327,458
9.1.2 Associates
Purchases of chemicals 2,857,196 6,941,645 - 536,800
9.1.3 Post-employment benefit plans
Contribution to employees provident fund 116,026,700 74,266,078 22,711,616 23,535,988
Interest on contribution payable 5,779,470 1,264,259
9.1.4 Key management personnel
Short-term employee benefits 48,723,500 38,511,354 11,654,700 19,423,367
Interest/markup on borrowing
16
Notes to the forming part of interim financial informationfor the fifteen months ended March 31, 2011
10.2
11 DATE OF AUTHORIZATION FOR ISSUE
This condensed consolidated financial information was authorized for issue on April 30, 2011 by the Board of Directors of the Company.
12 GENERAL
Figures have been rounded of to the nearest rupee.
In context of the overall reprofiling/restructuring, the management has recommenced negotiations regarding the settlement of
preference shares amounting Rs. 574 million and the same is expected to be settled soon.
The management expects that following the restrcuturing of the Company's debt finances, proposed divestment of shareholding in
Agritech Limited and consequent improvement in liquidity of the Company, the Company will be able to pay the overdue debts in due
17
Notes to the forming part of interim financial informationfor the fifteen months ended March 31, 2011
19
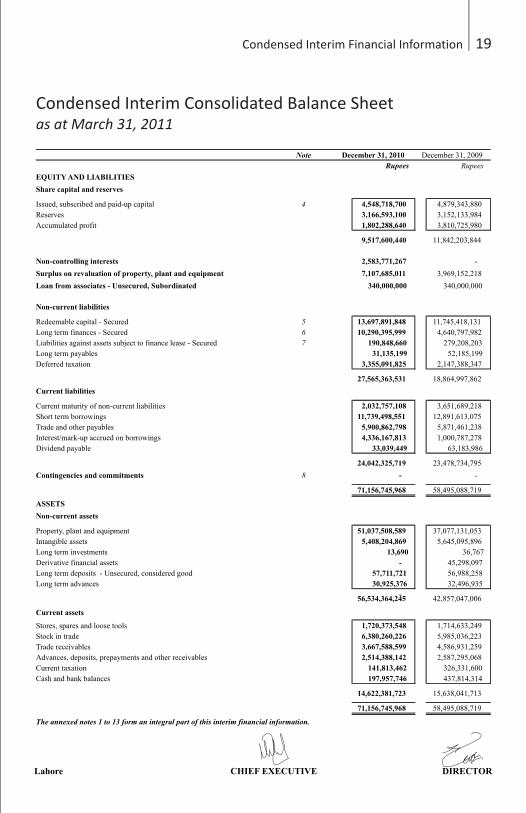
Condensed Interim Consolidated Balance Sheetas at March 31, 2011
Note December 31, 2010 December 31, 2009
Rupees Rupees
EQUITY AND LIABILITIES
Share capital and reserves
Issued, subscribed and paid-up capital 4 4,548,718,700 4,879,343,880
Reserves 3,166,593,100 3,152,133,984
Accumulated profit 1,802,288,640 3,810,725,980
9,517,600,440
11,842,203,844
Non-controlling interests 2,583,771,267
-
Surplus on revaluation of property, plant and equipment 7,107,685,011
3,969,152,218
Loan from associates - Unsecured, Subordinated 340,000,000
340,000,000
Non-current liabilities
Redeemable capital - Secured 5 13,697,891,848
11,745,418,131
Long term finances - Secured 6 10,290,395,999
4,640,797,982
Liabilities against assets subject to finance lease - Secured 7 190,848,660
279,208,203
Long term payables 31,135,199
52,185,199
Deferred taxation 3,355,091,825
2,147,388,347
27,565,363,531
18,864,997,862
Current liabilities
Current maturity of non-current liabilities 2,032,757,108
3,651,689,218
Short term borrowings 11,739,498,551
12,891,613,075
Trade and other payables 5,900,862,798
5,871,461,238
Interest/mark-up accrued on borrowings 4,336,167,813 1,000,787,278
Dividend payable 33,039,449 63,183,986
24,042,325,719 23,478,734,795
Contingencies and commitments 8 -
-
71,156,745,968
58,495,088,719
ASSETS
Non-current assets
Property, plant and equipment 51,037,508,589
37,077,131,053
Intangible assets 5,408,204,869
5,645,095,896
Long term investments 13,690
36,767
Derivative financial assets -
45,298,097
Long term deposits - Unsecured, considered good 57,711,721
56,988,258
Long term advances 30,925,376
32,496,935
-
56,534,364,245
42,857,047,006
Current assets
Stores, spares and loose tools 1,720,373,548
1,714,633,249
Stock in trade 6,380,260,226 5,985,036,223
Trade receivables 3,667,588,599 4,586,931,259
Advances, deposits, prepayments and other receivables 2,514,388,142 2,587,295,068
Current taxation 141,813,462 326,331,600
Cash and bank balances 197,957,746 437,814,314
14,622,381,723 15,638,041,713
71,156,745,968 58,495,088,719
The annexed notes 1 to 13 form an integral part of this interim financial information.
19
Condensed Interim Consolidated Balance Sheetas at March 31, 2011
Note December 31, 2010 December 31, 2009
Rupees Rupees
EQUITY AND LIABILITIES
Share capital and reserves
Issued, subscribed and paid-up capital 4 4,548,718,700 4,879,343,880
Reserves 3,166,593,100 3,152,133,984
Accumulated profit 1,802,288,640 3,810,725,980
9,517,600,440
11,842,203,844
Non-controlling interests 2,583,771,267
-
Surplus on revaluation of property, plant and equipment 7,107,685,011
3,969,152,218
Loan from associates - Unsecured, Subordinated 340,000,000
340,000,000
Non-current liabilities
Redeemable capital - Secured 5 13,697,891,848
11,745,418,131
Long term finances - Secured 6 10,290,395,999
4,640,797,982
Liabilities against assets subject to finance lease - Secured 7 190,848,660
279,208,203
Long term payables 31,135,199
52,185,199
Deferred taxation 3,355,091,825
2,147,388,347
27,565,363,531
18,864,997,862
Current liabilities
Current maturity of non-current liabilities 2,032,757,108
3,651,689,218
Short term borrowings 11,739,498,551
12,891,613,075
Trade and other payables 5,900,862,798
5,871,461,238
Interest/mark-up accrued on borrowings 4,336,167,813 1,000,787,278
Dividend payable 33,039,449 63,183,986
24,042,325,719 23,478,734,795
Contingencies and commitments 8 -
-
71,156,745,968
58,495,088,719
ASSETS
Non-current assets
Property, plant and equipment 51,037,508,589
37,077,131,053
Intangible assets 5,408,204,869
5,645,095,896
Long term investments 13,690
36,767
Derivative financial assets -
45,298,097
Long term deposits - Unsecured, considered good 57,711,721
56,988,258
Long term advances 30,925,376
32,496,935
-
56,534,364,245
42,857,047,006
Current assets
Stores, spares and loose tools 1,720,373,548
1,714,633,249
Stock in trade 6,380,260,226 5,985,036,223
Trade receivables 3,667,588,599 4,586,931,259
Advances, deposits, prepayments and other receivables 2,514,388,142 2,587,295,068
Current taxation 141,813,462 326,331,600
Cash and bank balances 197,957,746 437,814,314
14,622,381,723 15,638,041,713
71,156,745,968 58,495,088,719
The annexed notes 1 to 13 form an integral part of this interim financial information.
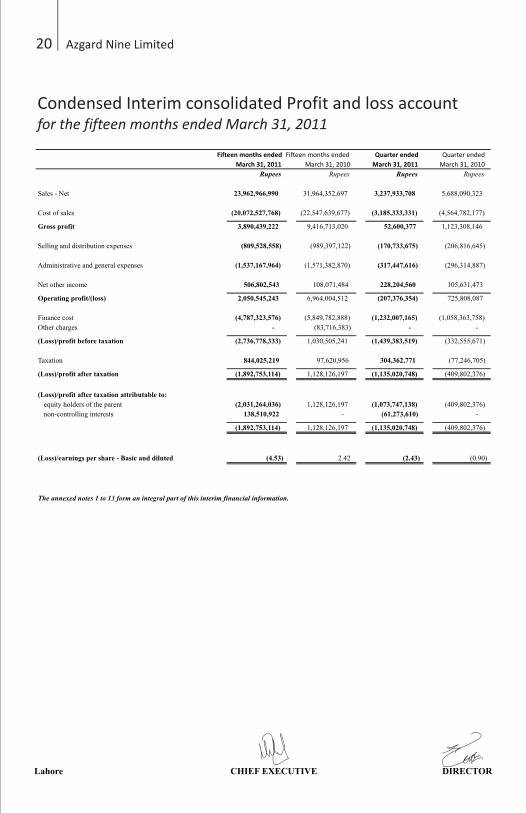
20
Fifteen months ended Fifteen months ended Quarter ended Quarter ended
March 31, 2011 March 31, 2010 March 31, 2011 March 31, 2010
Rupees Rupees Rupees Rupees
Sales - Net 23,962,966,990 31,964,352,697 3,237,933,708 5,688,090,323
Cost of sales (20,072,527,768)
(22,547,639,677)
(3,185,333,331)
(4,564,782,177)
Gross profit 3,890,439,222
9,416,713,020
52,600,377
1,123,308,146
Selling and distribution expenses (809,528,558)
(989,397,122)
(170,733,675)
(206,816,645)
Administrative and general expenses (1,537,167,964)
(1,571,382,870)
(317,447,616)
(296,314,887)
Net other income 506,802,543
108,071,484
228,204,560
105,631,473
Operating profit/(loss) 2,050,545,243
6,964,004,512
(207,376,354)
725,808,087
Finance cost (4,787,323,576) (5,849,782,888) (1,232,007,165) (1,058,363,758)
Other charges - (83,716,383) - -
(Loss)/profit before taxation (2,736,778,333)
1,030,505,241
(1,439,383,519)
(332,555,671)
Taxation 844,025,219
97,620,956
304,362,771
(77,246,705)
(Loss)/profit after taxation (1,892,753,114)
1,128,126,197
(1,135,020,748)
(409,802,376)
(Loss)/profit after taxation attributable to:
equity holders of the parent (2,031,264,036)
1,128,126,197
(1,073,747,138)
(409,802,376)
non-controlling interests 138,510,922
-
(61,273,610)
-
(1,892,753,114)
1,128,126,197
(1,135,020,748)
(409,802,376)
(Loss)/earnings per share - Basic and diluted (4.53) 2.42 (2.43) (0.90)
The annexed notes 1 to 13 form an integral part of this interim financial information.
Condensed Interim consolidated Profit and loss accountfor the fifteen months ended March 31, 2011
Fifteen months endedFifteen months ended Quarter ended Quarter ended
March 31, 2011 March 31, 2010 March 31, 2011 March 31, 2010
Rupees Rupees Rupees Rupees
Changes in fair value of cash flow hedges (17,449,338)
(87,974,163)
-
(6,081,579)
Changes in fair value available for sale financial assets (23,077)
(30,971)
-
-
Foreign exchange differences on translation of foreign subsidiaries (3,819,299)
(56,074,962)
36,536,714
(49,969,095)
Incremental depreciation 347,250,230
77,177,426
57,682,645
57,460,605
Other comprehensive income/(loss) before taxation 325,958,516
(66,902,670)
94,219,359
1,409,931
Taxation (38,746,644)
-
-
-
Other comprehensive income/(loss) after taxation 287,211,872 (66,902,670) 94,219,359 1,409,931
Profit after taxation (1,892,753,114)
1,128,126,197
(1,135,020,748)
(409,802,376)
Total comprehensive income (1,605,541,242)
1,061,223,527
(1,040,801,389)
(408,392,445)
Total comprehensive income attributable to:
equity holders of the parent (1,620,152,527)
1,061,223,527
(1,044,032,543)
(408,392,445)
non-controlling interests 14,611,285
-
3,231,154
(11,380,131)
(1,605,541,242) 1,061,223,527 (1,040,801,389) (419,772,576)
The annexed notes 1 to 13 form an integral part of this interim financial information.
Condensed Interim Consolidated Statement of other comprehensive Incomefor the fifteen months ended March 31, 2011
21

22
December 31, 2010 December 31, 2009
Rupees Rupees
CASH FLOW FROM OPERATING ACTIVITIES
(Loss)/profit before taxation (2,736,778,333) 1,030,505,241
Adjustments for non-cash and other items 7,842,874,410 7,126,572,295
Operating profit before changes in working capital 5,106,096,077
8,157,077,536
Changes in working capital 620,686,844
1,429,013,078
5,726,782,921
9,586,090,614
Payments for
Interest/markup paid (3,214,606,835)
(5,779,123,103)
Taxes paid (30,948,639)
(247,915,721)
Net cash flow from operating activities 2,481,227,447
3,559,051,790
CASH FLOW FROM INVESTING ACTIVITIES
Capital expenditure (9,106,248,583)
(11,104,290,131)
Purchase of software -
(520,852)
Proceeds from disposal of property, plant and equipment 60,312,096
54,444,193
Proceeds from disposal of investment in NIT - net 105,266
-
Proceeds from sale of investment in ordinary shares of AGL 1,476,084,480 -
Proceeds from sale of investment in term finance certificates 333,558,036 -
Proceeds from sale of investments at fair value through profit or loss -
108,761,692
Proceeds from sale of available for sale investment 149,867,716
281,161,927
Net cash used in investing activites (7,086,320,989)
(10,660,443,171)
CASH FLOW FROM FINANCING ACTIVITIES
Long term finances 3,993,361,461
1,781,369,232
Redeemable capital 82,713,559
(196,208,096)
Liabilities against assets subject to finance lease (108,944,648)
(185,035,227)
Proceeds from sale and lease back -
342,040,541
Short term borrowings 544,794,850
4,691,640,438
Proceeds from issue of ordinary shares - net of transaction costs -
1,003,256,252
Preference shares (86,731,895)
-
Dividend paid (59,956,353)
(58,822,894)
Net cash flow from financing activities 4,365,236,974
7,378,240,246
Net decrease in cash and cash equivalents (239,856,568) 276,848,865
Cash and cash equivalents as at begining of the period 437,814,314 428,860,804
Cash and cash equivalents as at end of the period 197,957,746 705,709,669
The annexed notes 1 to 13 form an integral part of this interim financial information.
Condensed Interim consolidated cash flow statementfor the fifteen months ended March 31, 2011
Pre
fere
nce
shar
esA
vail
able
Ord
inar
yP
refe
ren
ceS
har
eC
ash
flo
wT
ran
slat
ion
Res
erve
red
emp
tion
for
sale
Acc
um
ula
ted
Tot
alN
on-c
ontr
olli
ng
shar
essh
ares
Tot
alp
rem
ium
hed
ges
rese
rve
on m
erge
rre
serv
efi
nan
cial
ass
ets
Tot
alp
rofi
teq
uit
yin
tere
sts
Ru
pees
Ru
pees
Ru
pees
Ru
pees
Ru
pees
Ru
pees
Ru
pees
Ru
pees
Ru
pees
Ru
pees
Ru
pees
Ru
pees
Ru
pees
As
at J
anua
ry 0
1, 2
009
3,16
5,86
7,71
066
1,25
0,83
03,
827,
118,
540
2,73
7,84
1,49
915
2,63
5,94
0(1
,420
,374
)10
5,15
2,00
551
7,50
0,00
049
,074
3,51
1,75
8,14
42,
420,
262,
535
9,75
9,13
9,21
9-
` Issu
e of
bon
us s
hare
s63
3,17
3,53
0-
633,
173,
530
(633
,173
,530
)-
--
--
(633
,173
,530
)-
--
Issu
e of
rig
ht s
hare
s74
9,67
7,46
0-
749,
677,
460
262,
387,
112
--
--
-26
2,38
7,11
2-
1,01
2,06
4,57
2-
Tra
nsac
tion
cos
ts in
curr
ed o
n is
sue
of r
ight
sha
res
--
-(8
,808
,320
)-
--
--
(8,8
08,3
20)
-(8
,808
,320
)-
Pro
fit f
or th
e ye
ar e
nded
Dec
embe
r 31
, 200
9-
--
-
-
-
-
--
1,12
8,12
6,19
71,
128,
126,
197
-
Oth
er c
ompr
ehen
sive
inco
me/
(los
s) f
or th
e ye
ar e
nded
Dec
embe
r 31
, 200
9-
--
-
(87,
974,
163)
(56,
074,
962)
-
-
(30,
971)
(144
,080
,096
)77
,177
,426
(66,
902,
670)
-
Pro
fit t
rans
ferr
ed to
pre
fere
nce
shar
es r
edem
ptio
n re
serv
e-
--
-
-
-
108,
000,
000
-10
8,00
0,00
0(1
08,0
00,0
00)
--
Pref
eren
ce d
ivid
end
--
-
-
-
-
-
-
--
(59,
181,
949)
(59,
181,
949)
-
Pre
fere
nce
shar
es c
lass
ifie
d as
cur
rent
liab
ilit
y-
(330
,625
,650
)(3
30,6
25,6
50)
-
-
-
-
-
--
-(3
30,6
25,6
50)
-
As
at D
ecem
ber
31, 2
009
4,54
8,71
8,70
033
0,62
5,18
04,
879,
343,
880
2,35
8,24
6,76
1
64,6
61,7
77
(57,
495,
336)
105,
152,
005
625,
500,
000
18,1
033,
096,
083,
310
3,45
8,38
4,20
911
,433
,811
,399
-
As
at J
anua
ry 0
1, 2
010
4,54
8,71
8,70
033
0,62
5,18
04,
879,
343,
880
2,35
8,24
6,76
1
70,7
43,3
56
(7,5
26,2
41)
105,
152,
005
625,
500,
000
18,1
033,
152,
133,
984
3,81
0,72
5,98
011
,842
,203
,844
-
Non
-con
trol
ling
inte
rest
s ar
isin
g on
div
estm
ent
--
-
-
-
-
-
-
--
(207
,648
,853
)(2
07,6
48,8
53)
2,43
0,64
9,06
0
Pro
fit f
or f
ifte
en m
onth
s en
ded
Mar
ch 3
1, 2
011
--
--
--
--
-(2
,031
,264
,036
)(2
,031
,264
,036
)13
8,51
0,92
2
Oth
er c
ompr
ehen
sive
inco
me/
(los
s) f
or f
ifte
en m
onth
s en
ded
Mar
ch 3
1, 2
011
--
--
(17,
449,
338)
(3,8
19,2
99)
--
(23,
077)
(21,
291,
714)
293,
892,
301
272,
600,
587
14,6
11,2
85
Pre
fere
nce
shar
es c
lass
ifie
d as
cur
rent
liab
ilit
y-
(330
,625
,180
)(3
30,6
25,1
80)
--
--
--
--
(330
,625
,180
)-
Dis
posa
l of
subs
idia
ry1,
925,
031
1,92
5,03
1-
Pre
fere
nce
divi
dend
--
--
--
--
-(2
9,59
0,95
3)(2
9,59
0,95
3)-
Pro
fit t
rans
ferr
ed to
pre
fere
nce
shar
es r
edem
ptio
n re
serv
e-
--
--
-35
,750
,830
-35
,750
,830
(35,
750,
830)
--
As
at M
arch
31,
201
14,
548,
718,
700
-4,
548,
718,
700
2,35
8,24
6,76
153
,294
,018
(11,
345,
540)
105,
152,
005
661,
250,
830
(4,9
74)
3,16
6,59
3,10
01,
802,
288,
640
9,51
7,60
0,44
02,
583,
771,
267
Th
e an
nex
ed n
otes
1 to
13
form
an
inte
gral
par
t of
this
inte
rim
fin
anci
al in
form
atio
n.
Sh
are
cap
ital
Res
erve
s
23
Co
nd
ense
d In
teri
m C
on
solid
ated
Sta
tem
ent
of
chan
ges
in E
qu
ity
for
the
fift
een
mo
nth
s en
ded
Ma
rch
31
, 20
11

22
December 31, 2010 December 31, 2009
Rupees Rupees
CASH FLOW FROM OPERATING ACTIVITIES
(Loss)/profit before taxation (2,736,778,333) 1,030,505,241
Adjustments for non-cash and other items 7,842,874,410 7,126,572,295
Operating profit before changes in working capital 5,106,096,077
8,157,077,536
Changes in working capital 620,686,844
1,429,013,078
5,726,782,921
9,586,090,614
Payments for
Interest/markup paid (3,214,606,835)
(5,779,123,103)
Taxes paid (30,948,639)
(247,915,721)
Net cash flow from operating activities 2,481,227,447
3,559,051,790
CASH FLOW FROM INVESTING ACTIVITIES
Capital expenditure (9,106,248,583)
(11,104,290,131)
Purchase of software -
(520,852)
Proceeds from disposal of property, plant and equipment 60,312,096
54,444,193
Proceeds from disposal of investment in NIT - net 105,266
-
Proceeds from sale of investment in ordinary shares of AGL 1,476,084,480 -
Proceeds from sale of investment in term finance certificates 333,558,036 -
Proceeds from sale of investments at fair value through profit or loss -
108,761,692
Proceeds from sale of available for sale investment 149,867,716
281,161,927
Net cash used in investing activites (7,086,320,989)
(10,660,443,171)
CASH FLOW FROM FINANCING ACTIVITIES
Long term finances 3,993,361,461
1,781,369,232
Redeemable capital 82,713,559
(196,208,096)
Liabilities against assets subject to finance lease (108,944,648)
(185,035,227)
Proceeds from sale and lease back -
342,040,541
Short term borrowings 544,794,850
4,691,640,438
Proceeds from issue of ordinary shares - net of transaction costs -
1,003,256,252
Preference shares (86,731,895)
-
Dividend paid (59,956,353)
(58,822,894)
Net cash flow from financing activities 4,365,236,974
7,378,240,246
Net decrease in cash and cash equivalents (239,856,568) 276,848,865
Cash and cash equivalents as at begining of the period 437,814,314 428,860,804
Cash and cash equivalents as at end of the period 197,957,746 705,709,669
The annexed notes 1 to 13 form an integral part of this interim financial information.
Condensed Interim consolidated cash flow statementfor the fifteen months ended March 31, 2011
Pre
fere
nce
shar
esA
vail
able
Ord
inar
yP
refe
ren
ceS
har
eC
ash
flo
wT
ran
slat
ion
Res
erve
red
emp
tion
for
sale
Acc
um
ula
ted
Tot
alN
on-c
ontr
olli
ng
shar
essh
ares
Tot
alp
rem
ium
hed
ges
rese
rve
on m
erge
rre
serv
efi
nan
cial
ass
ets
Tot
alp
rofi
teq
uit
yin
tere
sts
Ru
pees
Ru
pees
Ru
pees
Ru
pees
Ru
pees
Ru
pees
Ru
pees
Ru
pees
Ru
pees
Ru
pees
Ru
pees
Ru
pees
Ru
pees
As
at J
anua
ry 0
1, 2
009
3,16
5,86
7,71
066
1,25
0,83
03,
827,
118,
540
2,73
7,84
1,49
915
2,63
5,94
0(1
,420
,374
)10
5,15
2,00
551
7,50
0,00
049
,074
3,51
1,75
8,14
42,
420,
262,
535
9,75
9,13
9,21
9-
` Issu
e of
bon
us s
hare
s63
3,17
3,53
0-
633,
173,
530
(633
,173
,530
)-
--
--
(633
,173
,530
)-
--
Issu
e of
rig
ht s
hare
s74
9,67
7,46
0-
749,
677,
460
262,
387,
112
--
--
-26
2,38
7,11
2-
1,01
2,06
4,57
2-
Tra
nsac
tion
cos
ts in
curr
ed o
n is
sue
of r
ight
sha
res
--
-(8
,808
,320
)-
--
--
(8,8
08,3
20)
-(8
,808
,320
)-
Pro
fit f
or th
e ye
ar e
nded
Dec
embe
r 31
, 200
9-
--
-
-
-
-
--
1,12
8,12
6,19
71,
128,
126,
197
-
Oth
er c
ompr
ehen
sive
inco
me/
(los
s) f
or th
e ye
ar e
nded
Dec
embe
r 31
, 200
9-
--
-
(87,
974,
163)
(56,
074,
962)
-
-
(30,
971)
(144
,080
,096
)77
,177
,426
(66,
902,
670)
-
Pro
fit t
rans
ferr
ed to
pre
fere
nce
shar
es r
edem
ptio
n re
serv
e-
--
-
-
-
108,
000,
000
-10
8,00
0,00
0(1
08,0
00,0
00)
--
Pref
eren
ce d
ivid
end
--
-
-
-
-
-
-
--
(59,
181,
949)
(59,
181,
949)
-
Pre
fere
nce
shar
es c
lass
ifie
d as
cur
rent
liab
ilit
y-
(330
,625
,650
)(3
30,6
25,6
50)
-
-
-
-
-
--
-(3
30,6
25,6
50)
-
As
at D
ecem
ber
31, 2
009
4,54
8,71
8,70
033
0,62
5,18
04,
879,
343,
880
2,35
8,24
6,76
1
64,6
61,7
77
(57,
495,
336)
105,
152,
005
625,
500,
000
18,1
033,
096,
083,
310
3,45
8,38
4,20
911
,433
,811
,399
-
As
at J
anua
ry 0
1, 2
010
4,54
8,71
8,70
033
0,62
5,18
04,
879,
343,
880
2,35
8,24
6,76
1
70,7
43,3
56
(7,5
26,2
41)
105,
152,
005
625,
500,
000
18,1
033,
152,
133,
984
3,81
0,72
5,98
011
,842
,203
,844
-
Non
-con
trol
ling
inte
rest
s ar
isin
g on
div
estm
ent
--
-
-
-
-
-
-
--
(207
,648
,853
)(2
07,6
48,8
53)
2,43
0,64
9,06
0
Pro
fit f
or f
ifte
en m
onth
s en
ded
Mar
ch 3
1, 2
011
--
--
--
--
-(2
,031
,264
,036
)(2
,031
,264
,036
)13
8,51
0,92
2
Oth
er c
ompr
ehen
sive
inco
me/
(los
s) f
or f
ifte
en m
onth
s en
ded
Mar
ch 3
1, 2
011
--
--
(17,
449,
338)
(3,8
19,2
99)
--
(23,
077)
(21,
291,
714)
293,
892,
301
272,
600,
587
14,6
11,2
85
Pre
fere
nce
shar
es c
lass
ifie
d as
cur
rent
liab
ilit
y-
(330
,625
,180
)(3
30,6
25,1
80)
--
--
--
--
(330
,625
,180
)-
Dis
posa
l of
subs
idia
ry1,
925,
031
1,92
5,03
1-
Pre
fere
nce
divi
dend
--
--
--
--
-(2
9,59
0,95
3)(2
9,59
0,95
3)-
Pro
fit t
rans
ferr
ed to
pre
fere
nce
shar
es r
edem
ptio
n re
serv
e-
--
--
-35
,750
,830
-35
,750
,830
(35,
750,
830)
--
As
at M
arch
31,
201
14,
548,
718,
700
-4,
548,
718,
700
2,35
8,24
6,76
153
,294
,018
(11,
345,
540)
105,
152,
005
661,
250,
830
(4,9
74)
3,16
6,59
3,10
01,
802,
288,
640
9,51
7,60
0,44
02,
583,
771,
267
Th
e an
nex
ed n
otes
1 to
13
form
an
inte
gral
par
t of
this
inte
rim
fin
anci
al in
form
atio
n.
Sh
are
cap
ital
Res
erve
s
23C
on
den
sed
Inte
rim
Co
nso
lidat
ed S
tate
men
t o
f ch
ange
s in
Eq
uit
yfo
r th
e fi
ftee
n m
on
ths
end
ed M
arc
h 3
1, 2
01
1

24
1 REPORTING ENTITY
Parent Company
Subsidiary Companies
2 BASIS OF PREPARATION
2.1 Statement of compliance
This condensed interim financial information is not audited.
2.2 Financial liabilities and continuing operations
Azgard Nine Limited ("ANL") is incorporated in Pakistan as a Public Limited Company and is currently listed on Karachi Stock Exchange
(Guarantee) Limited. ANL is a composite spinning, weaving, dyeing and stitching unit engaged in the manufacture of yarn, denim and denim
products. The registered office of ANL is situated at Ismail Aiwan-e-Science, off Shahrah-e-Roomi, Lahore.
Agritech Limited ("AGL") (formerly Pak American Fertilizers Limited) is incorporated in Pakistan as an Unquoted Public Limited
Company and is engaged in manufacture and sale of urea fertilizer. Proportion of interest held by ANL as at the reporting date is 100%. However,
during the period, ANL has divested 20.13% of its total holding through a combination of public subscription and private placement. Further, the
shareholders of ANL, in the extraordinary general meeting held on July 23, 2010, approved the divestment of remaining shares held in AGL. The
divestment is expected to completed before June 30, 2011. AGL was acquired on July 01, 2006.
The consolidated interim financial information report is not audited and has been presented in condensed form and does not include all the
information as is required to be provided in a full set of annual financial statements. This condensed interim financial report should be read in
conjunction with the audited financial statements of the Group for the year ended December 31, 2009. Further, the amounts for the quarters ended
Hazara Phosphate Fertilizers (Private) Limited ("HPFL") is incorporated in Pakistan as a Private Limited Company and is engaged in
manufacture and sale of granulated single super phosphate. HPFL was acquired on November 28, 2008 by AGL. Proportion of interest held by
ANL has been accorded approval by the relevant authorities to adopt the financial year to be from July 1st to June 30th in line with that of the
textile indutsry and also has obtained approvals from regulartory authorities to prepare financial statements exceeding twelve months, and,
accordingly the next audited financial statements of ANL will be prepared for eighteen months ending June 30, 2011. As such this interim
financial information has been prepared and circulated in compliance with the requirements of Section 245 of the Companies Ordinance, 1984, as
Farital AB ("FAB") is incorporated in Sweden. Investment in FAB was made in order to acquire Montebello SRL ("MSRL") a Limited Liability
Company incorporated in Italy and owner of an Italian fabric brand. MSRL is engaged in import, export, wholesale and retail marketing and
manufacture of textile and apparel products and accessories. Effective control of FAB and MSRL was obtained on December 31, 2008 by ANL.
As mentioned in the annual report of ANL for the year ended December 31, 2009, ANL in line with the worldwide and nationwide
recessionary trends and other economic conditions is facing liquidity crisis. Due to liquidty problems and unavailability of working capital
finances, ANL was not able to make timely purchases of raw material and had to procure raw material at higher prices, resulting in substantial
increase in cost of sales. High finance costs also had an adverse impact on the profitability of ANL. ANL has taken the following measures in
this context for the management of liquid resources and for continuing profitable opertaions of ANL.
This condensed consolidated interim financial report of the Group for the year ended December 31, 2010 has been prepared in accordance with the
requirements of International Accounting Standard 34 - Interim Financial Reporting, and provisions of and directives issued under the Companies
Ordinance, 1984. In case where requirements differ, the provisions of and directives issued under the Companies Ordinance, 1984 have been
The comparative consolidated interim balance sheet as at December 31, 2009 and the related notes, and, the consolidated comparative interim
profit and loss account, consolidated interim statement of other comprehensive income, consolidated interim cash flow statement, interim
consolidated statement of changes in equity and related notes for the year ended December 31, 2009 are based on audited financial statements. The
consolidated interim profit and loss account and consolidated interim statement of other comprehensive income for the quarters ended December
This condensed interim financial report of the Group for the year ended December 31, 2010 has been prepared in accordance with the
requirements of International Accounting Standard 34 - Interim Financial Reporting, as applicable in Pakistan and does not include all the
information as is required to be provided in a full set of annual financial statements. This condensed interim financial information should be
read in conjunction with the financial statements of the Group for the year ended December 31, 2009.
Nafees International Tekstil Sanayi Ve Ticaret ANONIM SIRKETI ("NIT") is incorporated in Turkey and is engaged in sale of denim and denim
products. Proportion of interest by ANL was 51%. NIT was acquired on 05 January 2004. During the period, ANL has disposed its entire
shareholding in NIT at USD 0.1 per share.
Notes to the forming part of Consolidated interim financial informationfor the fifteen months ended March 31, 2011
25
Reprofiling of debts
ANL has entered into restructing / reprofiling agreement with providers of debt finances, whereby various short term and long term debts
aggregating to Rs. 8,417.18 million have been restructed / reprofiled and ANL has been allowed graced periods of upto two years. ANL also
has overdue debt finances and interest-mark-up thereon amounting to Rs. 1,667 million (see note 10) as at December 31, 2010. Due to
reprofiling/restructuring, grace periods, proposed sale of Agritech Limited, ANL will be in a better position to manage its resources and
Divestment of shareholding in Agritech Limited (formerly Pak American Fertilizers Limited)
Continuing operations
2.3 Basis of measurement
2.4 Judgements, estimates and assumptions
2.5 Functional currency
3 SIGNIFICANT ACCOUNTING POLICIES
ANL, during the period, divested 20.13% comprising 79,006,816 ordinary shares held it Agritech Limited (formerly Pak American
Fertilizers Limited), through a combination of private placement and public offering, at a price of Rs. 30 per shares, including a premium of
Rs. 20 per share. Further, the shareholders of ANL, in the extraordinary general meeting held on July 23, 2010, have approved the
divestment of remaining 79.87% shares held in Agritech Limited. Majority of the funds generated through divestment remaining shares
will be utilized towards repayment/prepayment of some of ANL's debts.
The accounting policies adopted for the preparation of this condensed interim financial information are consistent with those applied in the
preparation of the preceding annual published financial statements of the Group for the year ended December 31, 2009.
This condensed interim financial information has been prepared under the historical cost convention except for certain financial instruments
at fair value or amortized cost and certain items of property, plant and equipment at revalued amounts. In this financial information, except
for the amounts reflected in the cash flow statement, all transactions have been accounted for on accrual basis.
The preparation of financial information requires management to make judgements, estimates and assumptions that affect the application of
accounting policies and the reported amounts of assets, liabilities, income and expenses. The estimates and associated assumptions and
judgements are based on historical experience and various other factors that are believed to be reasonable under the circumstances, the result
of which forms the basis of making judgements about carrying values of assets and liabilities that are not readily apparent from other sources.
Actual results may differ from these estimates. Estimates and underlying assumptions are reviewed on an ongoing basis. Revisions to
accounting estimates are recognized in the period in which the estimate is revised and in any future periods affected.
This financial information is prepared in Pak Rupees which is the Group's functional currency.
With the successful restrcuturing/reprofiling of ANL's debts, proposed divestment of shareholding in Agritech Limited, the management of
ANL envisages that sufficient financial resources will be available for the continuing operations of ANL. With positive impact on the
finance costs and more effective management of resources and raw material procurement, ANL is expected to continue its operations
profitably, subject to impact, if any, of uncontrollable external circumstances including power crises and global market conditions.
4 SHARE CAPITAL
Authorized share capital
Ordinary shares of Rs. 10 each
900,000,000 voting shares
300,000,000 non-voting shares
Preference shares of Rs. 10 each
300,000,000 non-voting shares
March 31, 2011 December 31, 2009
Rupees Rupees
9,000,000,000 9,000,000,000
3,000,000,000
3,000,000,000
12,000,000,000
12,000,000,000
3,000,000,000
3,000,000,000
15,000,000,000 15,000,000,000
Notes to the forming part of Consolidated interim financial informationfor the fifteen months ended March 31, 2011
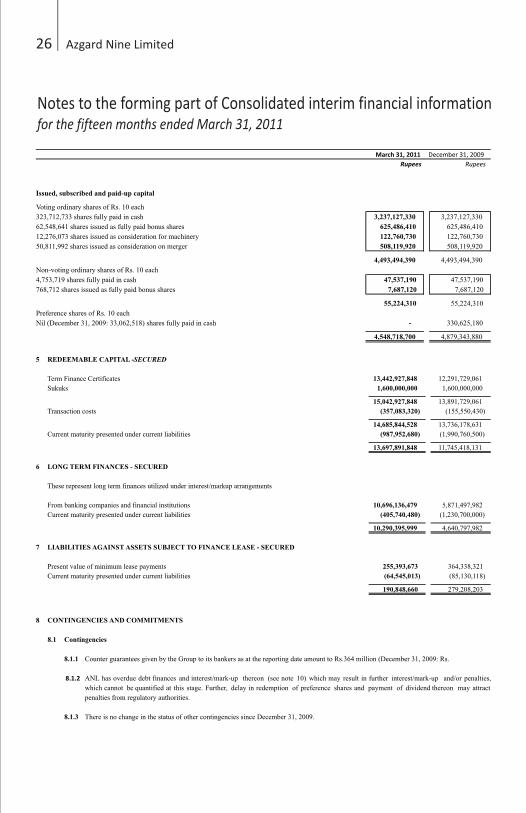
26
Notes to the forming part of Consolidated interim financial informationfor the fifteen months ended March 31, 2011
Issued, subscribed and paid-up capital
Voting ordinary shares of Rs. 10 each
323,712,733 shares fully paid in cash 3,237,127,330 3,237,127,330
62,548,641 shares issued as fully paid bonus shares 625,486,410
625,486,410
12,276,073 shares issued as consideration for machinery 122,760,730
122,760,730
50,811,992 shares issued as consideration on merger 508,119,920
508,119,920
4,493,494,390
4,493,494,390
Non-voting ordinary shares of Rs. 10 each
4,753,719 shares fully paid in cash 47,537,190
47,537,190
768,712 shares issued as fully paid bonus shares 7,687,120
7,687,120
55,224,310
55,224,310
Preference shares of Rs. 10 each
Nil (December 31, 2009: 33,062,518) shares fully paid in cash - 330,625,180
4,548,718,700 4,879,343,880
March 31, 2011 December 31, 2009
Rupees Rupees
5 REDEEMABLE CAPITAL - SECURED
Term Finance Certificates 13,442,927,848 12,291,729,061
Sukuks 1,600,000,000 1,600,000,000
15,042,927,848
13,891,729,061
Transaction costs (357,083,320)
(155,550,430)
14,685,844,528
13,736,178,631
Current maturity presented under current liabilities (987,952,680)
(1,990,760,500)
13,697,891,848
11,745,418,131
6 LONG TERM FINANCES - SECURED
These represent long term finances utilized under interest/markup arrangements
From banking companies and financial institutions 10,696,136,479
5,871,497,982
Current maturity presented under current liabilities (405,740,480)
(1,230,700,000)
10,290,395,999
4,640,797,982
7 LIABILITIES AGAINST ASSETS SUBJECT TO FINANCE LEASE - SECURED
Present value of minimum lease payments 255,393,673 364,338,321
Current maturity presented under current liabilities (64,545,013) (85,130,118)
190,848,660 279,208,203
8 CONTINGENCIES AND COMMITMENTS
8.1 Contingencies
8.1.1
8.1.2
8.1.3
Counter guarantees given by the Group to its bankers as at the reporting date amount to Rs.364 million (December 31, 2009: Rs.
ANL has overdue debt finances and interest/mark-up thereon (see note 10) which may result in further interest/mark-up and/or penalties,
which cannot be quantified at this stage. Further, delay in redemption of preference shares and payment of dividend thereon may attract
penalties from regulatory authorities.
There is no change in the status of other contingencies since December 31, 2009.
Notes to the forming part of Consolidated interim financial informationfor the fifteen months ended March 31, 2011
27
March 31, 2011 December 31, 2009
Rupees Rupees
8.2 Commitments
8.2.1 Commitments under irrevocable letters of credit for:
- purchase of stores, spare and loose tools 300,612,763
394,771,631
- purchase of machinery 134,091,820
1,781,959,711
- purchase of raw material 59,907,006
811,185,420
494,611,589 2,987,916,762
8.2.2 Commitments for capital expenditure -
3,503,908
9 RELATED PARTY TRANSACTIONS AND BALANCES
Details of transactions and balances with related parties are as follows:
Related parties from the Group's perspective comprise associated undertakings, key management personnel (including chief executive and directors)
and post employment benefit plan. the Group in the normal course of business carries out transactions with various related parties and continues to
have a policy whereby all such transactions are carried out at arm's length.
Fifteen months ended Fifteen months ended Quarter ended Quarter ended
March 31, 2011 March 31, 2010 March 31, 2011 March 31, 2010
Rupees Rupees Rupees Rupees
9.1 Transactions with related parties
9.1.1 Associated companies
Purchases of chemicals 2,857,196 6,941,645 - 536,800
Mark-up on borrowings 78,649,947 86,706,520 24,746,254 26,257,314
9.1.2 Post-employment benefit plans
Contribution to employees provident fund 138,940,020 91,116,402 27,337,552 26,979,715
Interest on amount due to provident fund 5,779,470 - 1,264,259 -
Contribution to employees gratuity fund 10,023,253 5,896,901 5,549,567 2,100,000
9.1.3 Key management personnel
Short-term employee benefits 96,060,324 53,721,354 35,145,524 40,434,727
March 31, 2011 December 31, 2009
Rupees Rupees
9.2 Balances with related parties
9.2.1 Associated companies
Trade payables - 1,877,139
Long term loan 340,000,000 340,000,000
Redeemable capital 89,928,000 89,928,000
Mark-up payable 91,185,352 4,959,715
9.2.2 Post-employment benefit plans
Payable to employees provident fund 19,841,010 11,723,338
Payable to employees gratuity fund 24,418,523 16,413,300
9.2.3 Key Management Personnel
Short term employee benefits payable 3,772,400 1,517,000
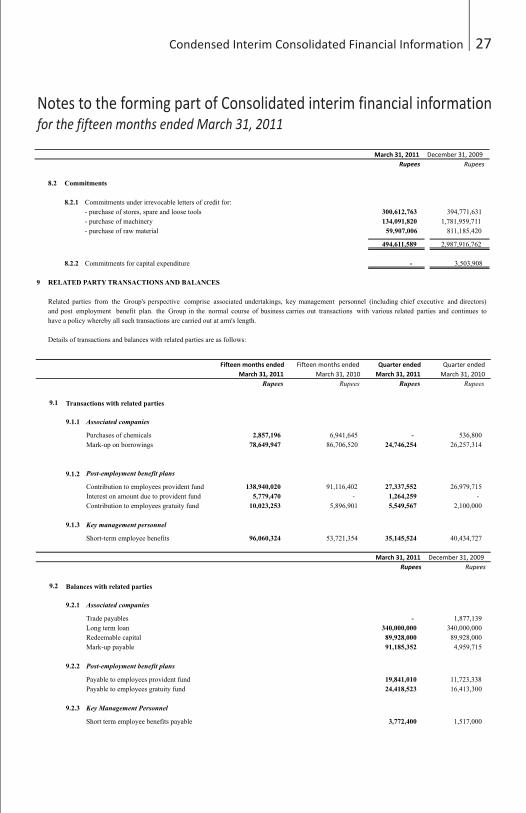

10 OVERDUES DEBT FINANCES
10.1 Due to circumstances, described in note 2.2, the following debts are overdue.
Principal Interest/mark-up Total
Rupees Rupees Rupees
Redeemable capital 2,120,000
538,302,225
540,422,225
Long term finances -
167,627,280
167,627,280
Short term borrowings - 364,939,252 364,939,252
2,120,000 1,070,868,757 1,072,988,757
10.2 In context of the overall reprofiling/restructuring, the management has recommenced negotiations regarding the settlement of preference
shares amounting Rs. 574 million and the same is expected to be settled soon.
The management expects that following the restrcuturing of ANL's debt finances, proposed divestment of shareholding in Agritech Limited and
consequent improvement in liquidity of ANL, ANL will be able to pay the overdue debts in due course.
29
Notes to the forming part of Consolidated interim financial informationfor the fifteen months ended March 31, 2011
11S
EG
ME
NT
IN
FO
RM
AT
ION
- T
exti
le a
nd A
ppar
el.
Ma
nu
fact
ure
an
d s
ale
of
text
ile
an
d a
ppare
l pro
duct
s
- F
erti
lize
rs.
Ma
nu
fact
ure
an
d s
ale
of
nit
rog
eno
us
and p
hosp
hati
c fe
rtil
izer
s
Info
rmat
ion a
bout
oper
atin
g s
egm
ents
as
at M
arch
31
, 2
011
is
as f
oll
ow
s:
Per
iod
en
ded
Per
iod e
nded
Per
iod
en
ded
Per
iod e
nded
Per
iod
en
ded
Per
iod e
nded
Ma
rch
31
, 2
011
Mar
ch 3
1, 2010
Marc
h 3
1, 2011
Mar
ch 3
1, 2010
Marc
h 3
1, 2011
Mar
ch 3
1, 2010
Ru
pee
sR
upee
sR
upee
sR
upee
sR
upee
sR
upee
s
Rev
enue
from
exte
rnal
cust
om
ers
14
,92
1,5
47
,55
1
16
,29
0,5
06,0
34
9,0
41,4
19,4
39
15,6
73,8
46,6
63
23,9
62,9
66,9
90
31,9
64,3
52,6
97
Inte
r-se
gm
ent
reven
ues
-
-
-
-
-
-
Seg
men
t pro
fit
/ (l
oss
)(2
,45
3,7
06
,23
1)
(11
7,8
83,4
03)
560,9
53,1
17
1,2
46,0
09,6
00
(1,8
92,7
53,1
14)
1,1
28,1
26,1
97
As
at
As
atA
s at
As
atA
s at
As
at
Ma
rch
31
, 2
011
Dec
emb
er 3
1, 2009
Marc
h 3
1, 2011
Dec
ember
31, 2009
Marc
h 3
1, 2011
Dec
ember
31, 2009
Ru
pee
sR
upee
sR
upee
sR
upee
sR
upee
sR
upee
s
Seg
men
t as
sets
37
,54
2,2
46
,83
2
39
,58
9,2
51,3
58
42,7
61,6
61,4
88
31,5
17,8
10,9
76
80,3
03,9
08,3
20
71,1
07,0
62,3
34
As
at
As
atH
alf
yea
r en
ded
Hal
f yea
r en
ded
Sep
tem
ber
30, 2010
Dec
ember
31, 2009
Sep
tem
ber
30, 2010
June
30, 2009
Ru
pee
sR
upee
sR
upee
sR
upee
s
11.1
Rec
on
cili
ati
on
of
rep
ort
ab
le s
egm
ent
ass
ets
an
d s
egm
ent
pro
fit
Tota
l fo
r re
port
able
seg
men
ts80,3
03,9
08,3
20
71,1
07,0
62,3
34
(1,8
92,7
53,1
14)
1,1
28,1
26,1
97
Eli
min
atio
n o
f
Inves
tmen
ts i
n o
ther
seg
men
ts(9
,668,7
77,4
84)
(12,3
72,5
40,0
00)
--
Inte
r-se
gm
ent
bal
ance
s(3
90,8
99,4
35)
(1,3
82,6
45,7
35)
--
Inte
r-se
gm
ent
pro
fits
--
--
Goodw
ill
acquir
ed i
n b
usi
nes
s co
mb
inat
ion
912,5
14,5
67
1,1
43,2
12,1
20
--
Conso
lidat
ed t
ota
l71,1
56,7
45,9
68
58,4
95,0
88,7
19
(1,8
92,7
53,1
14)
1,1
28,1
26,1
97
Seg
men
t ass
ets
Seg
men
t p
rofi
t
The
Gro
up h
as t
wo r
eport
able
seg
men
ts, w
hic
h o
ffer
dif
fere
nt
pro
du
cts
and
are
man
aged
sep
arat
ely.
The
foll
ow
ing s
um
mar
y d
escr
ibes
the
oper
atio
ns
in e
ach o
f th
e G
roup's
rep
ort
able
Tex
tile
Fer
tili
zer
Tota
l
30
Not
es to
the
form
ing
part
of C
onso
lidat
ed in
terim
fina
ncia
l inf
orm
atio
nfo
r the
fift
een
mon
ths
ende
d M
arch
31,
201
1
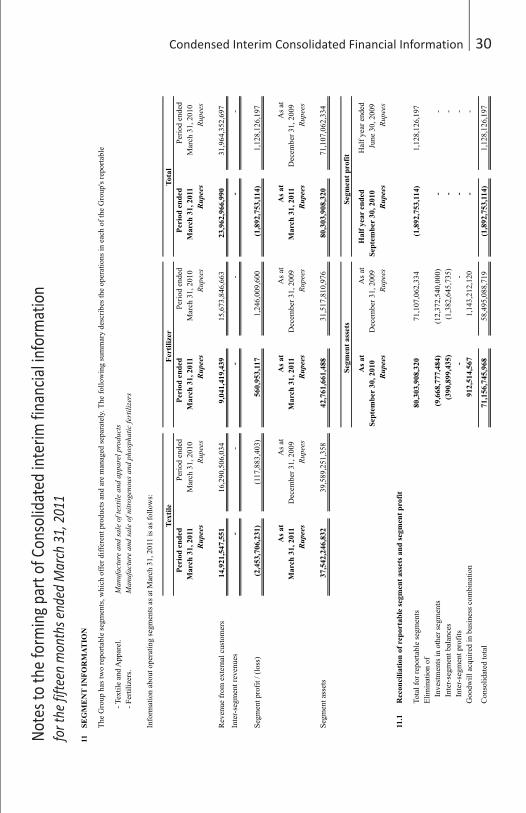
10 OVERDUES DEBT FINANCES
10.1 Due to circumstances, described in note 2.2, the following debts are overdue.
Principal Interest/mark-up Total
Rupees Rupees Rupees
Redeemable capital 2,120,000
538,302,225
540,422,225
Long term finances -
167,627,280
167,627,280
Short term borrowings - 364,939,252 364,939,252
2,120,000 1,070,868,757 1,072,988,757
10.2 In context of the overall reprofiling/restructuring, the management has recommenced negotiations regarding the settlement of preference
shares amounting Rs. 574 million and the same is expected to be settled soon.
The management expects that following the restrcuturing of ANL's debt finances, proposed divestment of shareholding in Agritech Limited and
consequent improvement in liquidity of ANL, ANL will be able to pay the overdue debts in due course.
29
Notes to the forming part of Consolidated interim financial informationfor the fifteen months ended March 31, 2011
11S
EG
ME
NT
IN
FO
RM
AT
ION
- T
exti
le a
nd A
ppar
el.
Ma
nu
fact
ure
an
d s
ale
of
text
ile
an
d a
ppare
l pro
duct
s
- F
erti
lize
rs.
Ma
nu
fact
ure
an
d s
ale
of
nit
rog
eno
us
and p
hosp
hati
c fe
rtil
izer
s
Info
rmat
ion a
bout
oper
atin
g s
egm
ents
as
at M
arch
31
, 2
011
is
as f
oll
ow
s:
Per
iod
en
ded
Per
iod e
nded
Per
iod
en
ded
Per
iod e
nded
Per
iod
en
ded
Per
iod e
nded
Ma
rch
31
, 2
011
Mar
ch 3
1, 2010
Marc
h 3
1, 2011
Mar
ch 3
1, 2010
Marc
h 3
1, 2011
Mar
ch 3
1, 2010
Ru
pee
sR
upee
sR
upee
sR
upee
sR
upee
sR
upee
s
Rev
enue
from
exte
rnal
cust
om
ers
14
,92
1,5
47
,55
1
16
,29
0,5
06,0
34
9,0
41,4
19,4
39
15,6
73,8
46,6
63
23,9
62,9
66,9
90
31,9
64,3
52,6
97
Inte
r-se
gm
ent
reven
ues
-
-
-
-
-
-
Seg
men
t pro
fit
/ (l
oss
)(2
,45
3,7
06
,23
1)
(11
7,8
83,4
03)
560,9
53,1
17
1,2
46,0
09,6
00
(1,8
92,7
53,1
14)
1,1
28,1
26,1
97
As
at
As
atA
s at
As
atA
s at
As
at
Ma
rch
31
, 2
011
Dec
emb
er 3
1, 2009
Marc
h 3
1, 2011
Dec
ember
31, 2009
Marc
h 3
1, 2011
Dec
ember
31, 2009
Ru
pee
sR
upee
sR
upee
sR
upee
sR
upee
sR
upee
s
Seg
men
t as
sets
37
,54
2,2
46
,83
2
39
,58
9,2
51,3
58
42,7
61,6
61,4
88
31,5
17,8
10,9
76
80,3
03,9
08,3
20
71,1
07,0
62,3
34
As
at
As
atH
alf
yea
r en
ded
Hal
f yea
r en
ded
Sep
tem
ber
30, 2010
Dec
ember
31, 2009
Sep
tem
ber
30, 2010
June
30, 2009
Ru
pee
sR
upee
sR
upee
sR
upee
s
11.1
Rec
on
cili
ati
on
of
rep
ort
ab
le s
egm
ent
ass
ets
an
d s
egm
ent
pro
fit
Tota
l fo
r re
port
able
seg
men
ts80,3
03,9
08,3
20
71,1
07,0
62,3
34
(1,8
92,7
53,1
14)
1,1
28,1
26,1
97
Eli
min
atio
n o
f
Inves
tmen
ts i
n o
ther
seg
men
ts(9
,668,7
77,4
84)
(12,3
72,5
40,0
00)
--
Inte
r-se
gm
ent
bal
ance
s(3
90,8
99,4
35)
(1,3
82,6
45,7
35)
--
Inte
r-se
gm
ent
pro
fits
--
--
Goodw
ill
acquir
ed i
n b
usi
nes
s co
mb
inat
ion
912,5
14,5
67
1,1
43,2
12,1
20
--
Conso
lidat
ed t
ota
l71,1
56,7
45,9
68
58,4
95,0
88,7
19
(1,8
92,7
53,1
14)
1,1
28,1
26,1
97
Seg
men
t ass
ets
Seg
men
t p
rofi
t
The
Gro
up h
as t
wo r
eport
able
seg
men
ts, w
hic
h o
ffer
dif
fere
nt
pro
du
cts
and
are
man
aged
sep
arat
ely.
The
foll
ow
ing s
um
mar
y d
escr
ibes
the
oper
atio
ns
in e
ach o
f th
e G
roup's
rep
ort
able
Tex
tile
Fer
tili
zer
Tota
l
30N
otes
to th
e fo
rmin
g pa
rt o
f Con
solid
ated
inte
rim fi
nanc
ial i
nfor
mat
ion
for t
he fi
ftee
n m
onth
s en
ded
Mar
ch 3
1, 2
011
12 DATE OF AUTHORIZATION FOR ISSUE
13 GENERAL
Figures have been rounded of to the nearest rupee
31
April 30, 2011 by the Board of Directors of ANL.
Top Related