


Languages
Pages
Legal


Solange GuedesExecutive Manager
Petrobras S/A
70% Recovery factor: Petrobras Perspective
Rio Oil & Gas 2008

1 Overview of Petrobras E&P Reserves and Production Forecasting
2 Mature Fields Management Strategy: Continuing IOR Improvement
3
4 Conclusions
September/2006
Technological Challenges
Summary

Overview of Petrobras E&P Reserves and Production Forecasting

Reserves - SPE�Proven reserves of 13.92 billion boe
�Internal Reserve Replacement of 123.6%
Production �2,065 thousand boed (1,792thousand bopd)
�5-year CAGR of 5.6%
Exploratory Area �140.3 thousand km²
Overview of Domestic E&P - 2007

Domestic Proven Reserve Development

Onshore Production Replacement (MM boe)
1.305,61.325,91.325,71.321,21.409,81.400,31.387,71.346,31.333,5
1.402,31.363,71.411,01.344,2
-1.400
-1.100
-800
-500
-200
100
400
700
1.000
1.300
1.600
Proved Reserves Cumulative Production Annual Production
Equ
ival
ent O
il -
Mill
ion
boe
1995 1996 1997 1998 1999 2000 2001 2002 2003 2004 2005 2006 2007
78,5[78,5] 164,5
[86] 255,8[91,4] 348,9
[93] 438,7[89,8]
534,4[95,7] 622,0
[87,6] 706,0[84]
811,3[105,3] 914,3
[103]1021,2[106,9] 1110,2
[89] 1196,5[86,3]

Equ
ival
ent O
il -
Mill
ion
boe
Offshore Production Replacement (MM boe)
12614,112427,411906,611701,4
11191,8
9608,2
8282,58301,38186,37377,27174,36676
6187,1
-6.800
-4.800
-2.800
-800
1.200
3.200
5.200
7.200
9.200
11.200
13.200
Proved Reserves Cumulative Production Annual Production
1995 1996 1997 1998 1999 2000 2001 2002 2003 2004 2005 2006 2007
[214,7] 214,7[247,2]
461,9[265,4] 727,3
[318] 1045,2[369,1] 1414,3
[417,2] 1831,6[443,6] 2275,2
[501,4] 2776,6[520,3] 3297,0
[499,5] 3796,5[546,6] 4343,1
[613,7] 4956,9[630,1]

16,0% 13,3%
66,2%
4,5%
Shallow water (0-300m)Shallow water (0-300m)OnshoreOnshore Deep water (300-1500m)Deep water (300-1500m) Ultra-deep water (> 1500m)Ultra-deep water (> 1500m)
9% 10%
58%
23%
Current Exploratory Area140.3 thousand km 2
24%
11%
27%
38%
� 65% of the concession areas are located in deep / u ltra-deep waters.
2007 Production
2,065 thousand boed 13.92 billion boe
2007 Proven Reserves (SPE)
Domestic E&P Profile

Mature Fields Management Strategy: Continuing IOR Improvement
Mature Fields - E&P Strategy
Inte
grity
Technology, Process, People
Inte
grat
ion
Cos
t

Domestic Fields
Brown Fields59%
Green Fields41%
Domestic Production 2.065 mil boed
Offshore69%
Onshore31%
Brown Fields Production1.218 mil boed

Reserves13%
Remain in Place68%
Produced19%
Volumes In Place = 17.1 billion boe
Onshore Equivalent Oil in Place
Total RF = 32%

Offshore Equivalent Oil in Place
Reserves20%
Remain in Place72%
Produced8%
Volumes In Place = 97 billion boe
Total RF = 28%

� Improve production levels
� Improve the Recovery Factor
� Costs optimization
� Reduce decline rates
� Lengthening the economic life
Main ObjectivesMain Objectives
Corporate program focused on the improvement of production levels of fields with high degree of exploitation.
RECAGE

First Phase (2004-2008)
� Increase water injection and velocity drainageup to 10% VOIP and final WOR up to 35;
� Improve reservoir management practices;
� Optimize steam injection and water injection projects;
� Remove bottlenecks in production facilities;
� Optimize lift systems;
� Reduce drilling and workover costs – onshore operations (rigless operations)
Main focus : onshore and shallow water mature fields

6075
68777125 7333
0
1000
2000
3000
4000
5000
6000
7000
8000
9000
2004 2005 2006 2007
Additional Recoverable Volume: 1258 MM boe
RECAGE: main results
35%31%
20072004
4% Increase on Recovery Factor (average from 206 fields)
13,2% 3,6% 2,9%
Tot
al R
eser
ves
(Bro
wn
Fie
lds)
MM
boe
Time (year)

Onshore Sergipe mature fields - productionhistory and forecasting
0,00
0,02
0,04
0,06
0,08
1963 1973 1983 1993 2003 2013 2023 2033 2043 2053
Oil
rate
(M
Mbb
l/day
)
History Forecast
RECAGE Phase 1
Carmópolis
Siririzinho
Camorim
Dourado
Time (year)
Total
∆∆∆∆RF = 4%

0
5000
10000
15000
20000
25000
30000
35000
40000
45000
50000
1986 1991 1996 2001 2006 2011 2016 2021
BPD
Production History Project
� Increase the water injection up to 7% VOIP per year
� Drill 200 new wells (injectors and producers)
� Selectivity only for injectors
� Commingled completion
� High volume of water produced
Revitalization Project
Canto do Amaro Field
∆∆∆∆RF = 5%

∆∆∆∆RF = 10%
Also, a CCS effort in Brazil
Miscible CO2 Injection - Miranga Field
0
50
100
150
200
250
2008 2011 2014 2017 2020 2023 2026 2029 2032 2035 2038 2041 2044 2047
0
600.000
1.200.000
1.800.000
2.400.000
3.000.000
Cu
mul
ativ
eA
dditi
onal
Pro
duct
ion
(m3)
Add
ition
alP
rodu
ctio
n(m
3/d)
Pilot Project (april, 2009)

Well Technology: Multifractured Horizontal Wells (HRM F)
Bonito Field: low-permeability carbonate reservoirs
∆∆∆∆RF = 15% - 20%
Oil Pipeline
Production Unit
Gas Pipeline

Produced water Reinjection
N
Sea water Injection
Planned Sea water Injection
Campos Basin: The maturity phase has arrived
Discovery: 1974 – Garoupa Field
First Oil Production:1977 – Enchova Field
Water Depth: 50 - 1500m
Floating Production Systems: 32 (23 SS, 9 FPSO)
Fixed Platforms: 15
Total Stationary Production Units : 46
Producing Fields: 39

13 new wells (11 producers and 2 injectors)
Marlim Projects
2008 2009 2010 2011 2012 2013 2014 2015150
200
250
300
350
400
Tho
usan
d B
PD
Production maintenance Increase Processing Marlim Phase 2 Marlim Phase 3 Marlim Phase 4
Increase water processing in FPSOs P-35 and P-37100 thousand bbl/d in 2010Marlim – Phase 4: preparing the basis to achieve RF aroun d 70% (900 MM bboe additional)
6 new wells – December/07
83100
8167
RF = 55%
51
RF = 52%RF = 50%RF = 47%
RF = 46%
Marlim Field: different phases of production
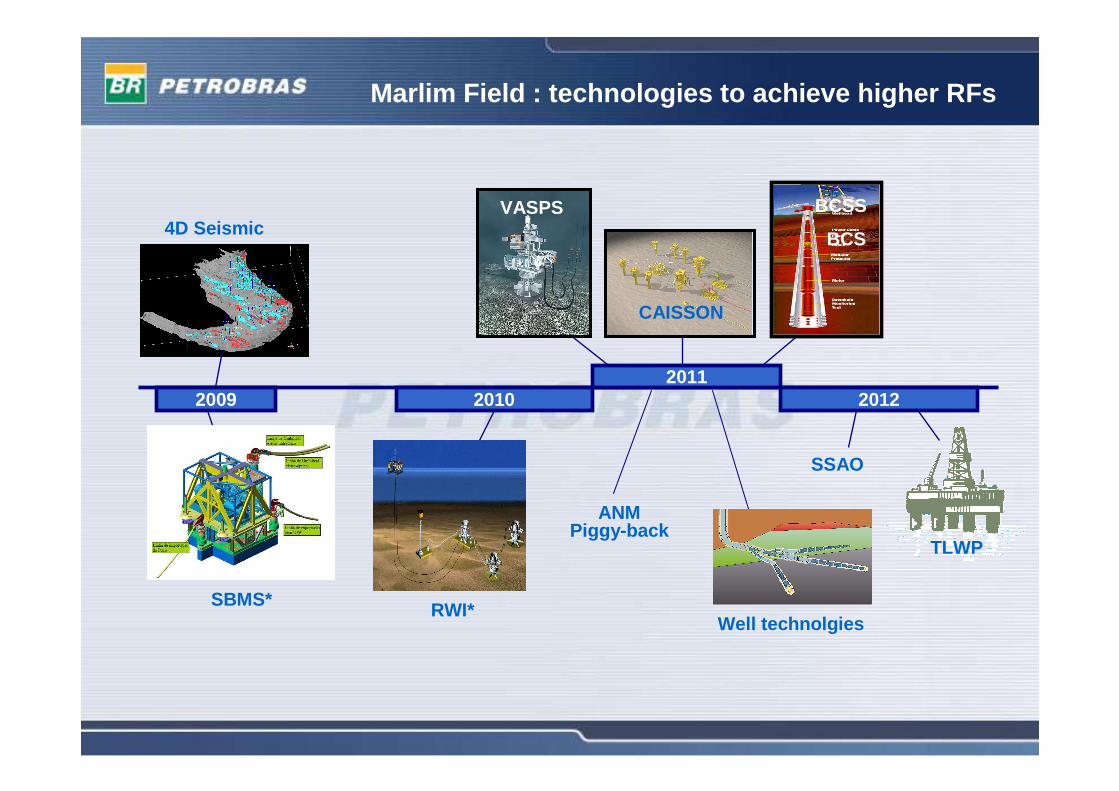
Marlim Field : technologies to achieve higher RFs
2009 20102011
2012
TLWP
ANM Piggy-back
SBMS* RWI*
SSAO
Well technolgies
4D SeismicVASPS
CAISSON
BCSS
BCS
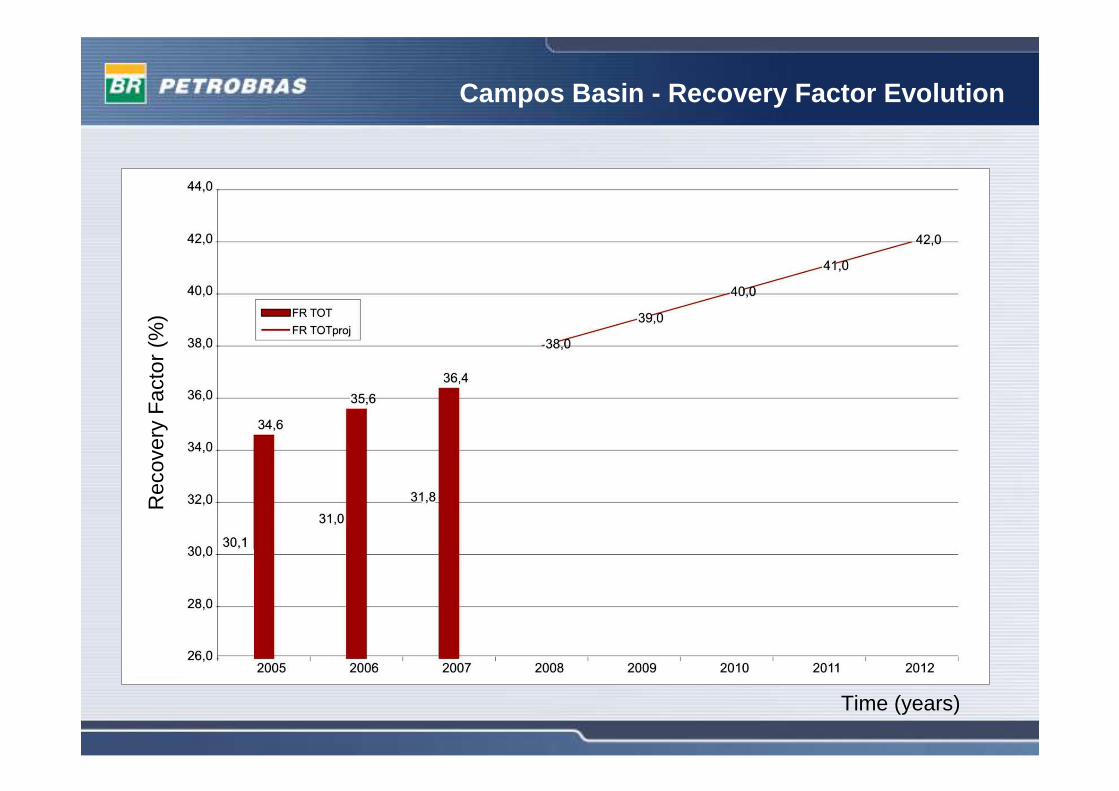
Campos Basin - Recovery Factor Evolution
Rec
over
yF
acto
r(%
)
Time (years)

Technological Challenges to achieve higher recovery factors
PROPES

Recovery toolbox
� Water injection� HC gas injection� 4D Seismics� Raw sea water injection� WAG� MEOR� Steam� CO2 injection� Polymer injection
� Conventional wells� Horizontal wells� Multilateral wells� SMART wells� ERD wells� HRMF wells � Light Well Intervention
� Topside processing� Sub sea separation � Down hole separation� Sub sea pumping &
compression � Down hole pumping &
compression� Boosting systems
(VASPs, SBMS..)
Real Time Operations Centers

Identificação de Falhas e Área de Sobrepressão.
Interpretação S4D - Casos
Identificação de Capa de Gás
Identificação de Áreas Lavadas
Anisotropia de Permeabilidades
Ajuste de Histórico de Poços
Caracterização de Falhas Selantes
Capa de Gás Identificação de Falhas Área de Sobrepressão
Falha Selante Anisotropia de Permeabilidade
Ajuste Histórico com suporte S4D
305 kgf/cm 2
262 kgf/cm 2
Applications of 4D SeismicApplications of 4D Seismic
13 wells - 9 relocatedMarlim Field
Faults andOverpressure Areas
Gas Caps Sealing FaultsPermeabilityAnisotropy Production
History Matching
4D Seismic

StructureFiltersPumpControls
Mid-water Inlet
Injection Well
Subsea raw water injection (RWI)
Scenario: Albacora Field (2009)Light oilUnconsolidated sandstone
0
20000
40000
60000
80000
100000
120000
140000
160000
180000
out/8
7
out/9
0
out/9
3
out/9
6
out/9
9
out/0
2
out/0
5
out/0
8
out/1
1
out/1
4
out/1
7
out/2
0
out/2
3
out/2
6
out/2
9
out/3
2
out/3
5
out/3
8
out/4
1
out/4
4
out/4
7
out/5
0
out/5
3
bpd
1st Revitalization cycle
2nd Revitalization cycle
47%40%
20072003
RF

INJECTION WELL
SUBSEA OIL-WATERSEPARATION
PRODUCED WATER INJECTION FLOWLINE
OIL & GASFLOWLINE
PRODUCED FLUIDS
PRODUCTION WELL
GAS SEPARATION
OIL & GAS
OIL – WATERSEPARATION
WATER
OIL
GAS
PRODUCTION
Scenario: • Marlim Field (2010)• Heavy oil• Very unconsolidated sandstone
Subsea system oil-water separation
Pilot Project in Marlim Field (jan. 2010)
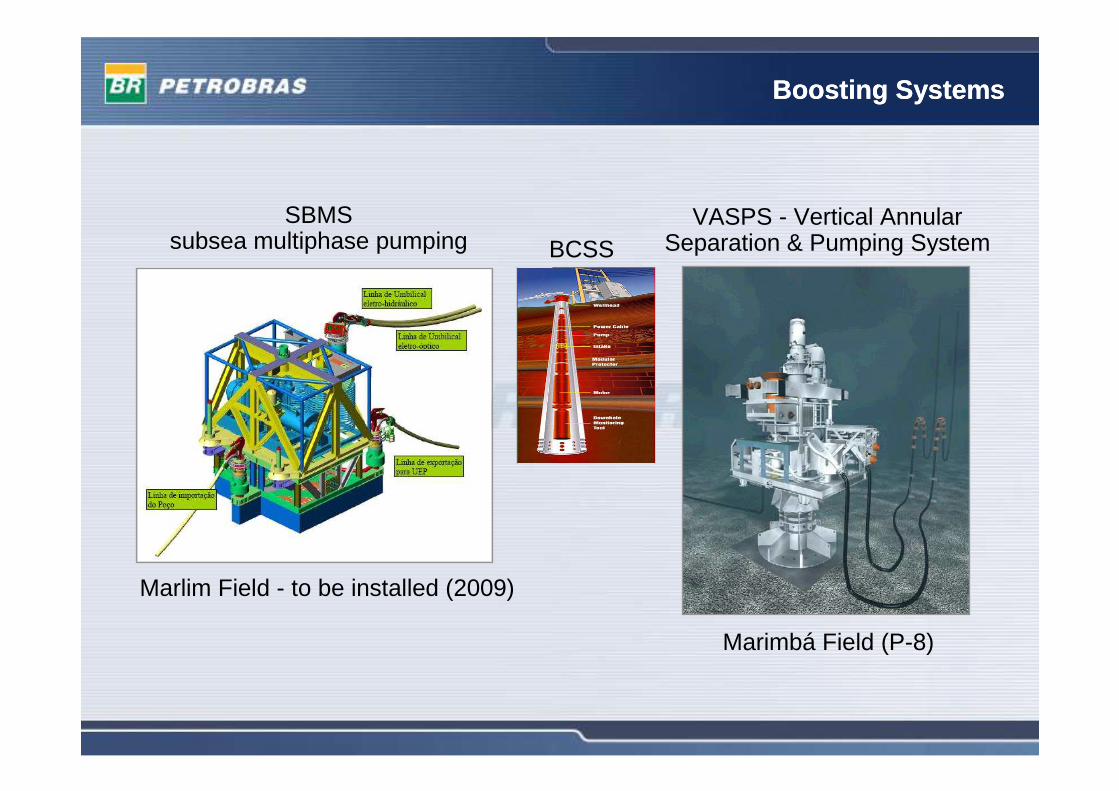
Boosting SystemsBoosting Systems
VASPS - Vertical Annular Separation & Pumping System
Marimbá Field (P-8)
SBMS subsea multiphase pumping
Marlim Field - to be installed (2009)
BCSS

Offshore Polymer Injection
New scenario:Heavy oil offshore field (~15 o API) Excellent permoporosity quality
Recovery Process: viscosified water (by polymer inje ction)Example: � PapaTerra field (DW: 1200 m - Campos Basin)� High porosity and permeability� 15º API � oil viscosity: 50 to 150 cP� Horizontal wells with OHGP� TLWP and FPSO
Benefits - preliminary analysis :
� Increase Recovery Factor : ∆∆∆∆RF = 7%
� Decrease water production Seminário “OG21-Workshop for Enhanced Oil Recovery”
Polymer Flood Equipment

Picture
Real Time Operation Centers

RECAGE – Phase 2
� Expand the concept of Phase 1 to all fields, including the Deepwater Fields Revitalization
� Investment on key technologies (EOR process, light well intervention, subsea processing and complex well geometries)
� Fenix Project: recovery factors benchmarking x reservoir technical limits identification for all Petrobras fields (onshore and offshore)
Phase 2
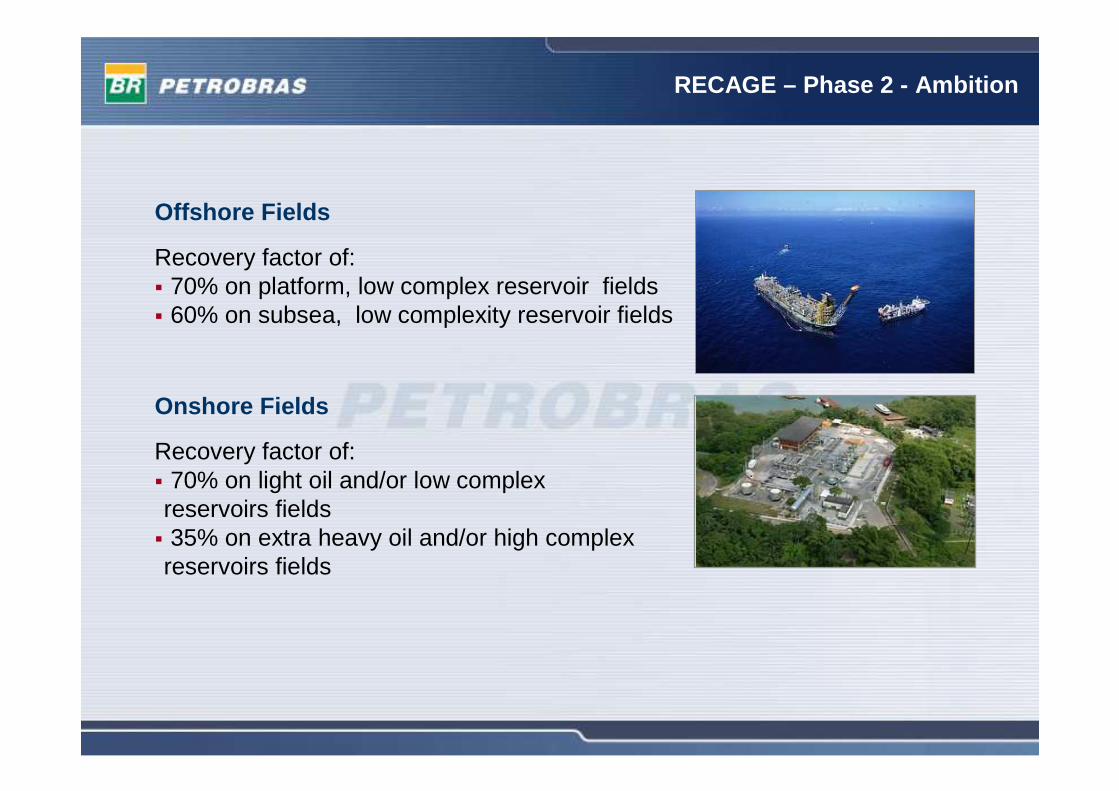
Recovery factor of:� 70% on platform, low complex reservoir fields� 60% on subsea, low complexity reservoir fields
Offshore Fields
Recovery factor of:� 70% on light oil and/or low complex reservoirs fields� 35% on extra heavy oil and/or high complex reservoirs fields
Onshore Fields
RECAGE – Phase 2 - Ambition

70% RF is becoming a reality
61onshoreAraças
56offshoreMarlim
56offshoreBicudo
69onshoreBuracica
67onshoreMiranga
64offshoreNamorado
63offshorePiraúna
61onshoreRio Urucu
61onshoreLagoa Parda
Recovery Factor (%)LocationField

Final Remarks
� During at least the next 20 years, oil and gas production from mature fields will supply at least half of the World’s demand for energy.
� Old paradigms for oil and gas production will be eclipsed by newpractices, new drivers and new technologies geared towards increased recovery from mature fields.
� The continued high oil price scenario, coupled with new tools, technologies and processes will make 70% recovery targets for low complexity reservoirs a reality .
Top Related