


Languages
Pages
Legal


Liquid and Gas Fuels from BiomassWoody Biomass and Small Log WorkshopFrom Feedstock to ProductCollege of the Siskiyous19 September 2007
Bryan M. Jenkins, ProfessorUniversity of California, Davis

Bioenergy/Biofuels
BiogasBiomethaneCompressed
Biomethane (CNG)Hydrogen
Producer gasSynthesis gas (Syngas)Hydrogen
Gases
Biodiesel (esters)from Plant Oils, Yeast Oils, Algal Oils
Alkanes (catalytic)
EthanolButanolOther Alcohols/
Mixed AlcoholsLiquified-
BioMethane (LNG)(Bio)gas-to-Liquids
(GTL)
MethanolBiomass-to-Liquids
Renewable diesels, biogasolines, other hydrocarbons and oxygenated hydrocarbons
Ethanol/Mixed AlcoholsDimethyl ether(pressurized)Bio-oils (pyrolysis oils)
Liquids
Biomass(incl. densified and other processed fuel)
BiosolidsBiomass/Chars/CharcoalSolids
PhysicochemicalBiochemicalThermochemical
Conversion ProcessFuel

Biomass Conversion Pathways• Thermochemical Conversion
– Combustion– Gasification– Pyrolysis
• Bioconversion– Anaerobic/Fermentation– Aerobic Processing– Biophotolysis
• Physicochemical– Esters– Alkanes
• Energy– Heat– Electricity
• Fuels– Solids– Liquids– Gases
• Products– Chemicals– Materials

SyngasFermentation
Biorefining Approaches
• Thermochemical • Biochemical
• Synthesis gas – (CO + H2 + other)
• Sugar monomers, acids
Gasification,Pyrolysis
Pretreatment,Hydrolysis
ThermolyticSolidsOils
HydrolyticCellulose
HemicelluloseStarch, Sugars
CatalyticSynthesis Fermentation
• Hydrocarbons, hydrogen, ammonia, DME, methane, SNG, methanol, ethanol, higher alcohols, mixed alcohols…
• Ethanol, higher alcohols, biomethane, hydrogen, acids…

Integrated Biorefinery Concept
Source: US Department of Energy
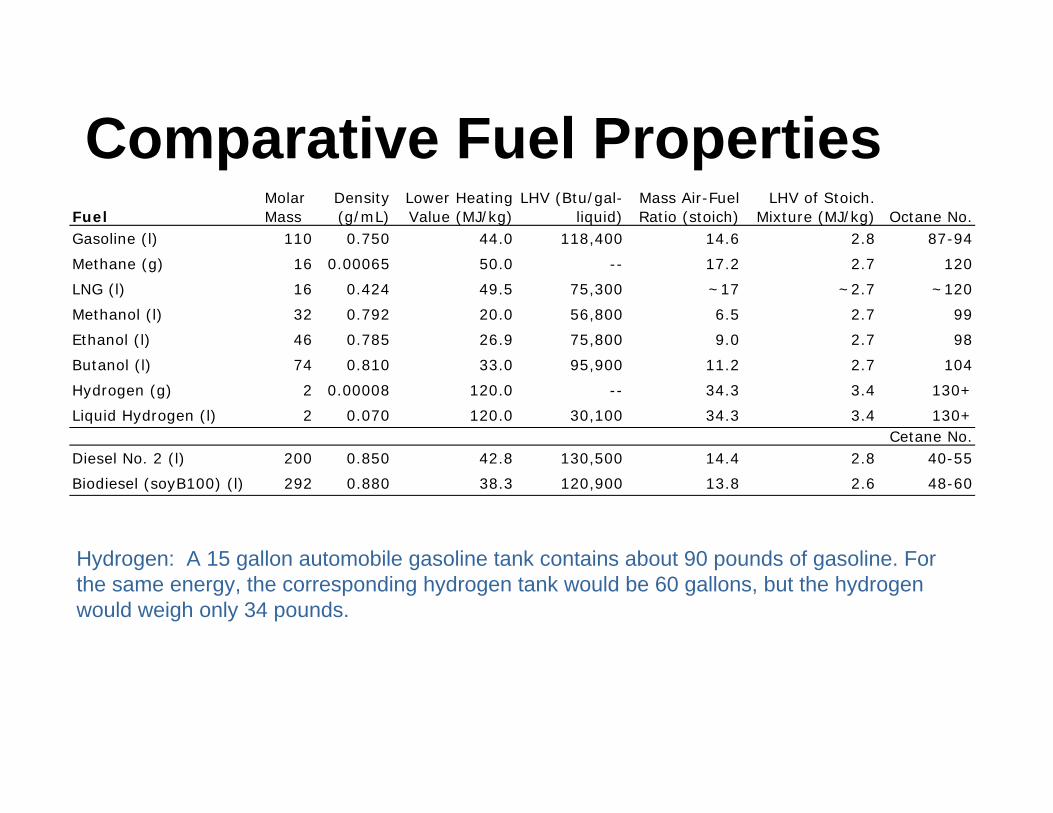
Hydrogen: A 15 gallon automobile gasoline tank contains about 90 pounds of gasoline. For the same energy, the corresponding hydrogen tank would be 60 gallons, but the hydrogen would weigh only 34 pounds.
FuelMolar Mass
Density (g/mL)
Lower Heating Value (MJ/kg)
LHV (Btu/gal-liquid)
Mass Air-Fuel Ratio (stoich)
LHV of Stoich. Mixture (MJ/kg) Octane No.
Gasoline (l) 110 0.750 44.0 118,400 14.6 2.8 87-94
Methane (g) 16 0.00065 50.0 -- 17.2 2.7 120
LNG (l) 16 0.424 49.5 75,300 ~17 ~2.7 ~120
Methanol (l) 32 0.792 20.0 56,800 6.5 2.7 99
Ethanol (l) 46 0.785 26.9 75,800 9.0 2.7 98
Butanol (l) 74 0.810 33.0 95,900 11.2 2.7 104
Hydrogen (g) 2 0.00008 120.0 -- 34.3 3.4 130+
Liquid Hydrogen (l) 2 0.070 120.0 30,100 34.3 3.4 130+Cetane No.
Diesel No. 2 (l) 200 0.850 42.8 130,500 14.4 2.8 40-55
Biodiesel (soyB100) (l) 292 0.880 38.3 120,900 13.8 2.6 48-60
Comparative Fuel Properties

0 1000 2000 3000 4000 5000 6000
Miles per dry ton of biomass
Transport Range for Bioenergy
Electricity (35% efficiency/IGCC/Cofiring)
Electricity (25% efficiency/current)
BTL-Syndiesel
Ethanol
Ethanol
(63 gals/ton)
Miles per dry ton biomass
(110 gals/ton)
(80 gals/ton)
Based on hybrid vehicle with 44 miles per gallon fuel economy on gasoline, 260 Wh/mile battery (vehicle data from B. Epstein, E2). Electricity includes generating efficiency, transmission, distribution, and battery charging losses. Ethanol, BTL-Syndiesel, and H2 include fuel distribution transport energy.
Hydrogen Fuel Cell (62 kg/ton)
Production Scale
• Resource potential• Biofuels potential• Competing uses• Co-products• Process integration

US--Billion Ton StudyAre there sufficient resources to meet 30% of the country’s petroleum requirements?
• Land resources of the U.S. can sustainablysupply more than 1.3 billion dry tons annually and still continue to meet food, feed, and export demands
• Realizing this potential will require R&D, policy change, stakeholder involvement
• Required changes are not unreasonable given current trends
Source: USDOE, ORNL

0.0
1.0
2.0
3.0
4.0
0 500 1,000 1,500 2,000
Quantity of Biomass (Million tons/year)
Bio
fuel
(Bill
ion
BO
E/ye
ar)
30
50
40
60
Biofuel Potential
US Billion ton study
Conversion Efficiency (%)• 1.8 BBOE/year• 78 BGY/year
diesel equivalent• 80-100 x 109
kg/year Hydrogen equivalent

Biofuel Potential in US Transportation
source: Bain, 2005

Potential bio-refinery locations
Mapping of Feedstock
Bio-refinery Site Selection
Network Analysis of Transportation
CostsOptimization
Supply Curves
Mapping of Fuel Supply
BiorefineryNetwork

-25
-20
-15
-10
-5
0
5
0 0.2 0.4 0.6 0.8 1s
dMop
t/ds
(GW
)
0
500
1000
1500
2000
2500
Mop
t (M
W)
Influence of Scale Factor
on Optimal Capacity
and Sensitivity of Solution
(s = constant)
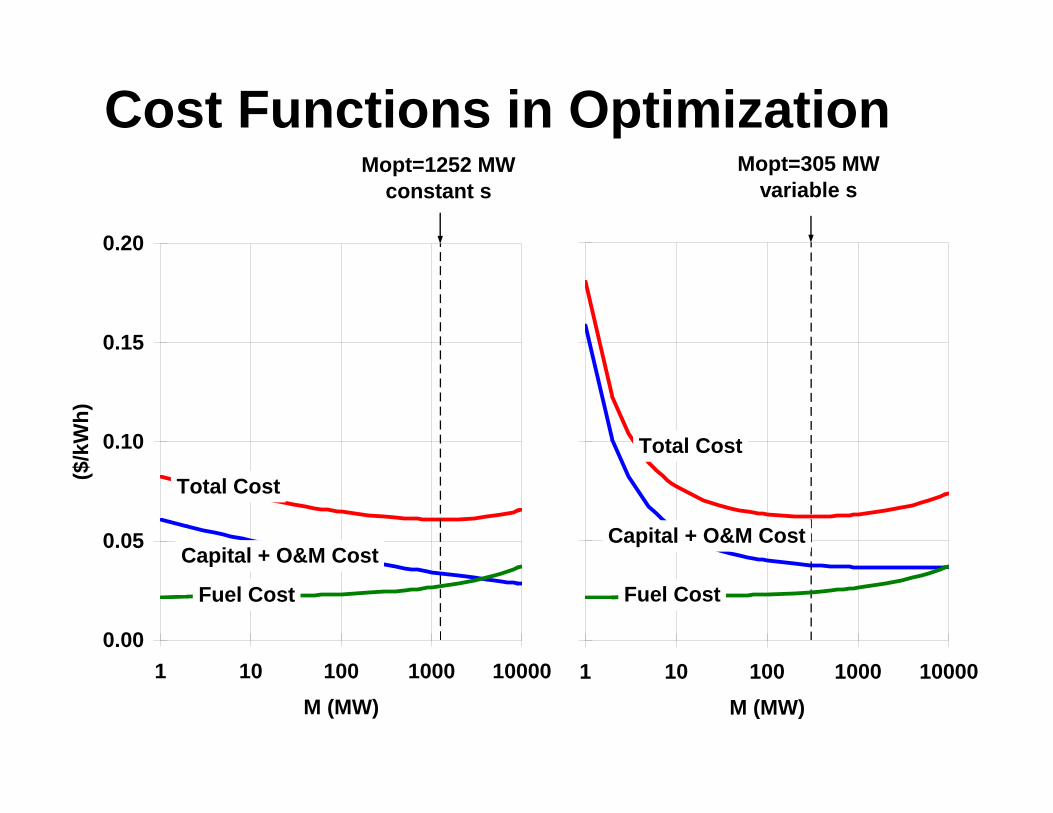
Cost Functions in Optimization
1 10 100 1000 10000M (MW)
Capital + O&M Cost
Total Cost
Fuel Cost
Mopt=305 MWvariable s
0.00
0.05
0.10
0.15
0.20
1 10 100 1000 10000M (MW)
($/k
Wh)
Capital + O&M Cost
Total Cost
Fuel Cost
Mopt=1252 MWconstant s

US Highway Transportation System (2005)
24.8Average equivalent CO2 emissions (lb/gallon)85Average highway traffic volume (vehicles/hour)
17.2Average US highway vehicle fuel economy (mpg)1,959Equivalent CO2 emissions (million metric tons)
173.8On-highway fuel consumption (billion gallons)3.0Highway vehicle miles traveled (trillions)
247,421,120Number of highway vehicles3,995,635Total miles of highway*
*public roadways.Sources: USDOT Bureau of Transportation Statistics; US Energy Information Administration.

Scale: Offset Biomass Production AreaAverage 85 vehicles/hour traffic volume (43,291 gallons gasoline equivalent/mile-year)
Annual Increment:5 tons/acre-year 80 tons/acre-year
538 feet(65 acres/mile)
34 feet(4 acres/mile)
CO2 uptake90% carbon closure
1,550 feet(188 acres/mile)
97 feet(12 acres/mile)Fuel substitution
51.2 gge/ton, 90% carbon closure
Highway 80 at Davis, California:Annual Average Traffic Volume =5,250 vehicles/hourPeak hour: 11,100 vehicles/hour(Cal DOT Traffic and Vehicle Data Systems Unit, 2006 data)
1 mile

0 10 20 30 40 50
Cost ($/MMBtu)
Ethanol
Methanol
Biodiesel
Biomethane
Biogas
BTL
Bio-oil
Syngas
H2
DME
Solid Fuel
Petroleum
Diesel Fuel
Electricity
$10/bbl $100/bbl
$1/gal $4/gal
$0.05/kWh $0.15/kWh
Production costs and prices

Federal Ethanol Cost Targets

DOE Cellulosic Biorefinery Demonstration Project Awards, 2007-2010, $385M
76Georgia1,200 tpd wood residues and energy wood
Gasification followed by catalytic syngas
upgrading
40+ 9 methanol
Range Fuels
80Idaho700 tpd wheat and rice straw, other ag. residues,
switchgrass
Enzymatic hydrolysis(Iogen)
18IogenBiorefineryPartners
80Iowa842 tpd corn fiber, cobs, stalks
engineered Zymomonas bacteria
(Dupont)
31 cellulosic94 starch
Broin (POET)
19
13.9+ power, 8 tpd
hydrogen, 50 tpdammonia
11.4 (cellulosic)85 (starch)
+ power and syngas
Ethanol Capacity(MGY)
California
Florida
Kansas
Location
40700 tpd sorted greenwaste and wood
waste from landfill
Concentrated acid hydrolysis
(Arkenol process)
BlueFireEthanol
33770 tpd greenwaste and energycane
Gasification followed by syngas
fermentation(BRI)
ALICO
76700 tpd corn stover, wheat straw, switchgrass,
others
Enzymatic hydrolysis + biomass gasification
for process energy
Abengoa
Award($ Milliion)Feedstock
(tpd=tons per day)Technology Awarded to

DOE Cost Goals
• Ethanol– $1.07/gallon
• Hydrogen– Previous goal of $1.50/gge (~$1.50/kg)– New goal of $2.00 – 3.00/gge
• delivered, untaxed, 2005 $Constant by 2015

-100
-80
-60
-40
-20
0
20
Cel
lulo
sic
(hig
h yi
eld)
Suga
rcan
e
Cel
lulo
sic
(low
yie
ld)
Suga
r bee
t
Cor
n (W
DG
S)
Cor
n (D
DG
S)
Gas
olin
e
Cor
n/C
oal-f
ired
Cha
nge
in G
HG
em
issi
ons
(%)
Lifecycle ethanol GHG emissions relative to gasoline
based on R.B. Williams, 2006
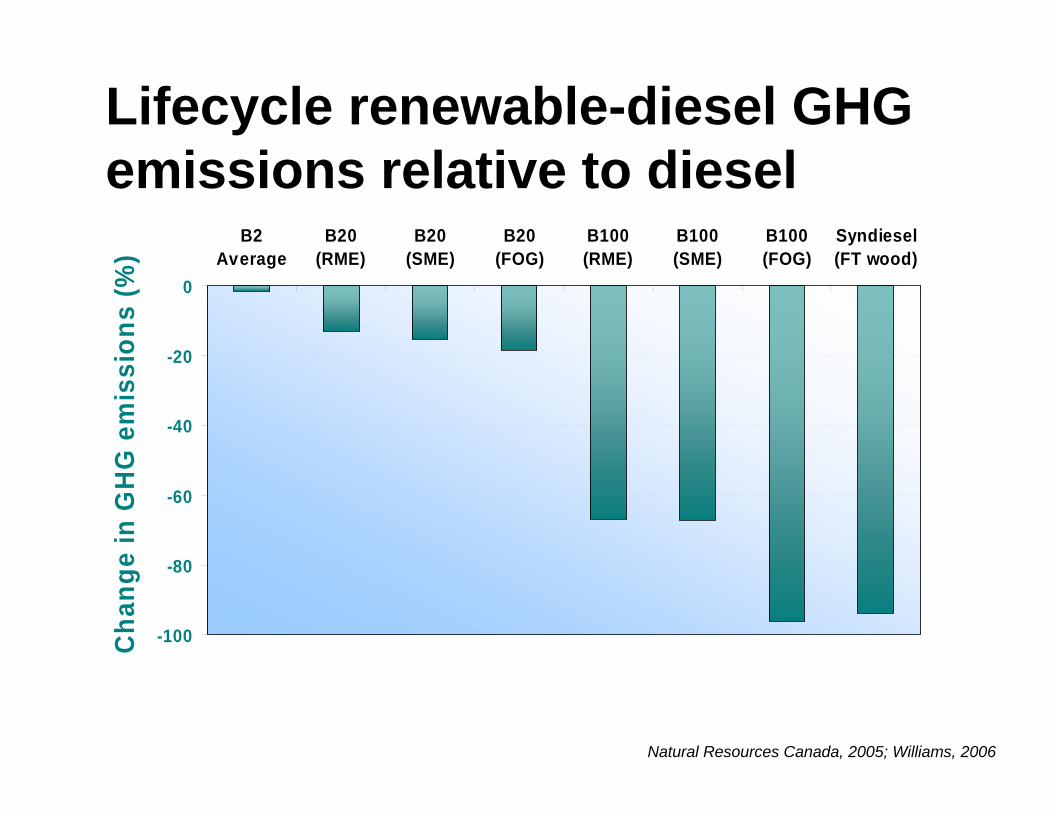
Lifecycle renewable-diesel GHG emissions relative to diesel
Natural Resources Canada, 2005; Williams, 2006
-100
-80
-60
-40
-20
0
B2Average
B20(RME)
B20(SME)
B20(FOG)
B100(RME)
B100(SME)
B100(FOG)
Syndiesel(FT wood)
Cha
nge
in G
HG
em
issi
ons
(%)

California Low Carbon Fuel Standard
• UC Berkeley and UC Davis LCFS study report– Part I: Technical Analysis
– Part II: Policy
International LCFS Symposium, 18 May 2007, LBNLInternational LCFS Symposium, 18 May 2007, LBNL

LCFS• Defines carbon intensity metric (at-the-
wheel)
( )LCFS
E
ECIAFCI
iim
iimii
≤=∑
∑ η
) MJeCO (gintensity carbon fuel average sfirm' AFCI -12=
) MJeCO (g standard setLCFS -12=
) MJeCO (g plug or tank the atintensity carbon fuel CI -12=
)(energy motive to efficiency conversionenergy fuel i −=η
iitim E)(MJ fuel each forenergy motive total E η==
)(MJ plug or tank atenergy fuel total Eit =
g CO2e/MJ

Representative Fuels
76Current Average Midwest corn ethanol
27California averageElectricity
48Steam methane reformingHydrogen
AFCI gCO2e/MJ
DescriptionFuel type
4Poplar, switchgrass, prairie grasses Cellulosic production
Low-GHG ethanol
58Corn feedstock, modern dry millsNatural gas, natural gas (wet DGs), stover
Mid-GHG ethanol
92California averageGasoline
-6California poplar Gasification and Fischer-Tropsch
Low-GHG biodiesel
38Soy feedstockMid-GHG biodiesel
Source: A. Farrell, UC Berkeley

Biofuel Production Issues
• Performance and Cost• Sustainability
– Life cycle impacts including land use– Climate change and other environmental,
ecosystem, environmental justice, and regional economic impacts
– Standards• Resource and end product potentials
(Scale)– Fuel substitution potential– Policy influences


Biofuels
• Thermochemical Conversion• Biochemical Conversion• Physicochemical Conversion

Thermal GasificationFuel + Oxidant/HeatFuel + Oxidant/Heat
CO + HCO + H22 + HC + CO+ HC + CO22 + N+ N22 + H+ H22O + O + Char + Tar + PM + HChar + Tar + PM + H22S + NHS + NH33 + + Other + HeatOther + Heat
Partial Oxidation/Air or OxygenPartial Oxidation/Air or OxygenSteam/Water/Carbon Dioxide/HydrogenSteam/Water/Carbon Dioxide/HydrogenIndirect HeatingIndirect Heating

Biomass Gasification
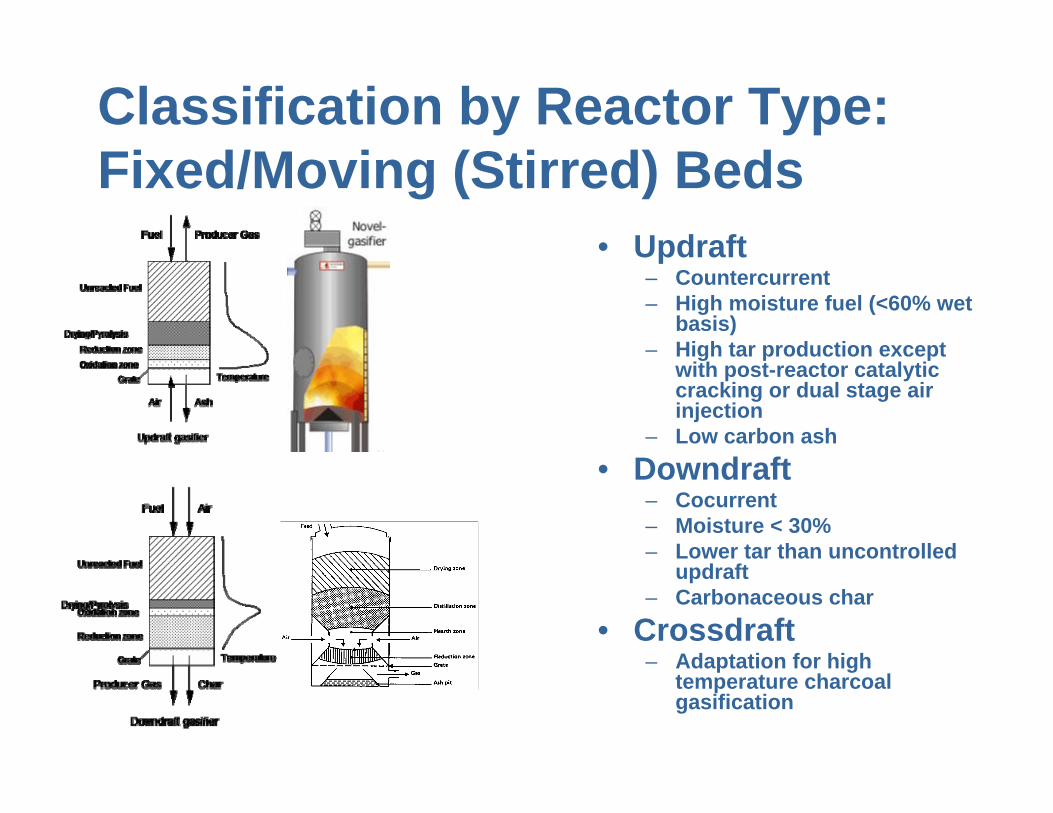
Classification by Reactor Type: Fixed/Moving (Stirred) Beds
• Updraft– Countercurrent– High moisture fuel (<60% wet
basis)– High tar production except
with post-reactor catalytic cracking or dual stage air injection
– Low carbon ash• Downdraft
– Cocurrent– Moisture < 30%– Lower tar than uncontrolled
updraft– Carbonaceous char
• Crossdraft– Adaptation for high
temperature charcoal gasification
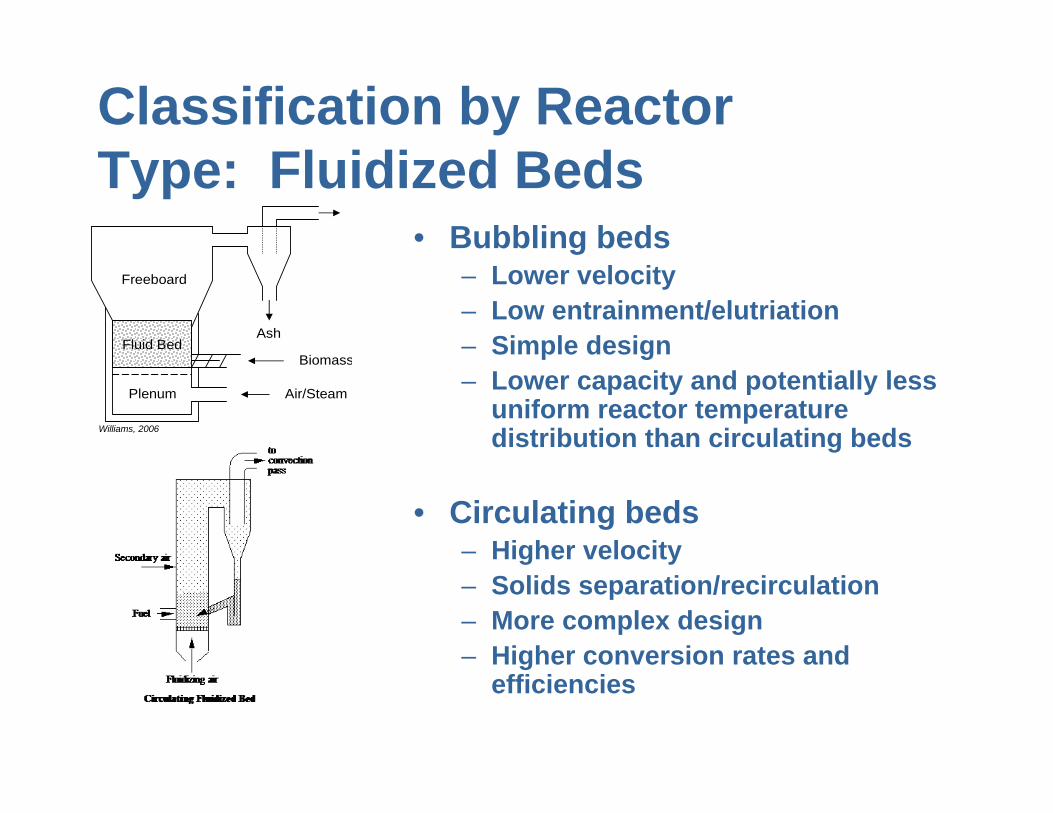
Classification by Reactor Type: Fluidized Beds
• Bubbling beds– Lower velocity– Low entrainment/elutriation– Simple design– Lower capacity and potentially less
uniform reactor temperature distribution than circulating beds
• Circulating beds– Higher velocity– Solids separation/recirculation– More complex design– Higher conversion rates and
efficiencies
Ash
Freeboard
Fluid BedBiomass
Air/SteamPlenum
Williams, 2006

Classification by Reactor Type: Entrained Beds
• Solids or slurry entrained on gas flow– Small particle size– Entrained flow used
as component in some developmental pyrolytic biomass reactor systems
GE-Texaco Gasifier

Battelle/ FERCO gasifier
Mark Paisley, FERCO Bolhar-Nordenkampf, et al. (2002)
Fast Internal Circulating Fluidized Bed (FICFB) gasifier, Güssing, Austria
Gasification: Indirect Heating
Williams, 2006

Wet Gasification
• Catalytic hydrothermal gasification– 250 – 360°C, 22 MPa (3,200 psi)– Ruthenium-based catalysts– Primary products: CH4 and CO2
– Energy breakeven at solids content above 2 - 8%
– Need to remove sulfur
• Ethanol
• Methanol
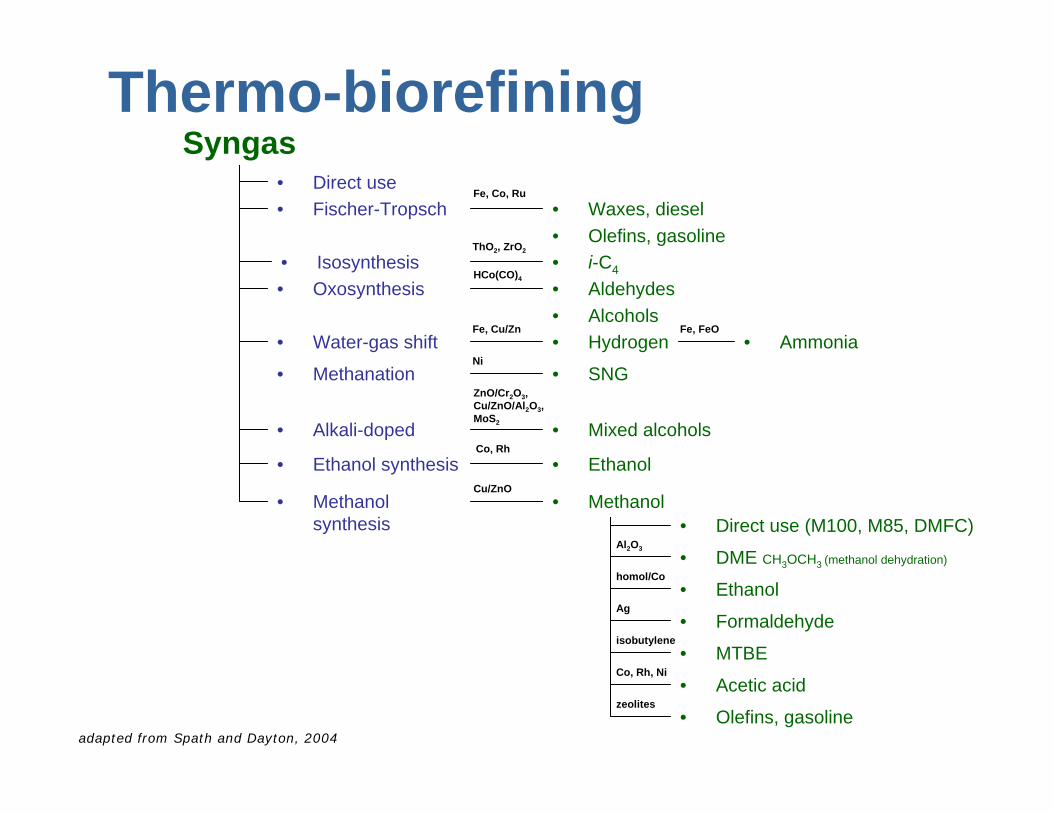
Thermo-biorefiningSyngas
• Fischer-Tropsch
• Methanol synthesis
• Isosynthesis• Oxosynthesis
• Water-gas shift
• Alkali-doped
• Waxes, diesel• Olefins, gasoline
Fe, Co, Ru
• i-C4
• Aldehydes• Alcohols• Hydrogen • Ammonia
• Mixed alcohols
ThO2, ZrO2
HCo(CO)4
Fe, FeO
ZnO/Cr2O3, Cu/ZnO/Al2O3, MoS2
Al2O3
• EthanolCo, Rh
• Ethanol synthesis
• Direct use
• DME CH3OCH3 (methanol dehydration)
• Formaldehyde
• MTBE
• Acetic acid
• Olefins, gasoline
homol/Co
• Direct use (M100, M85, DMFC)
Cu/ZnO
Ag
isobutylene
Co, Rh, Ni
zeolites
• SNG• Methanation
Fe, Cu/Zn
Ni
adapted from Spath and Dayton, 2004
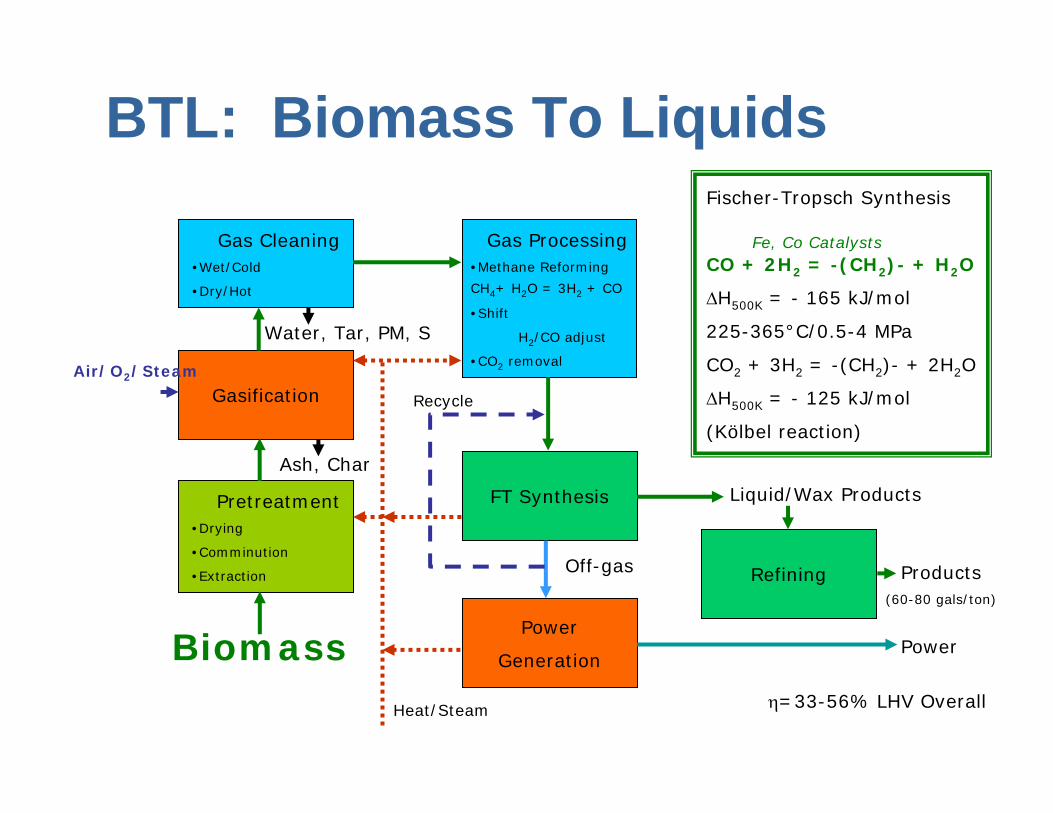
BTL: Biomass To Liquids
Pretreatment•Drying
•Comminution
•Extraction
Gasification
Gas Cleaning•Wet/Cold
•Dry/Hot
Gas Processing•Methane Reforming
CH4+ H2O = 3H2 + CO
•Shift
H2/CO adjust
•CO2 removal
FT Synthesis
Power
Generation
Recycle
Liquid/Wax Products
Off-gas
PowerBiomass
Fischer-Tropsch Synthesis
CO + 2H2 = -(CH2)- + H2O
ΔH500K = - 165 kJ/mol
225-365°C/0.5-4 MPa
CO2 + 3H2 = -(CH2)- + 2H2O
ΔH500K = - 125 kJ/mol
(Kölbel reaction)
Fe, Co Catalysts
Refining
Heat/Steam
Products(60-80 gals/ton)
Ash, Char
Water, Tar, PM, S
η=33-56% LHV Overall
Air/O2/Steam

FT Biofuel Production Cost
0
10
20
30
40
50
0.1 0.5 3.4 7.7 15.9
Biomass (Million tons per year)
Prod
uctio
n C
ost (
$/M
MB
tu)
ConversionPretreatmentTransportBiomass
adapted from Boerrigter, 2006
50 250 1,800 4,100 8,500MWth425 2,125 15,300 34,849 72,248bbl/d

Comparative Area Requirements
502501,8004,1008,500MWth 3
7
19
28
40 miles3.1 million acres
Davis
Arbuckle
Fairfield
733
235
534
1,100 million gallons/yearDiesel equivalent
Average 5 tons/acre-year
Sacramento

Pyrolysis• Thermally degrade material w/o the addition of
air or oxygen• Similar to gasification – can be optimized for the
production of fuel liquids (pyrolysis oils), with fewer gaseous products (may leave some carbon as char)
– Fast/Flash pyrolysis• Temperature range (typical): 750-1500°F • Can utilize catalysts to promote reaction
(Catalytic cracking)

Pyrolysis oils• Liquids used in a number of applications
– Crude liquids as boiler fuel– Commercial consumer products, adhesives, other
• Crude liquids may be suitable for further processing and refining– Potential petroleum refinery integration– Crude bio-oils of low quality
• Poor oxidative stability• Aqueous and solid phases• Corrosive• Toxicity
• Potential intermediate product for increasing scale of biofuel production facility
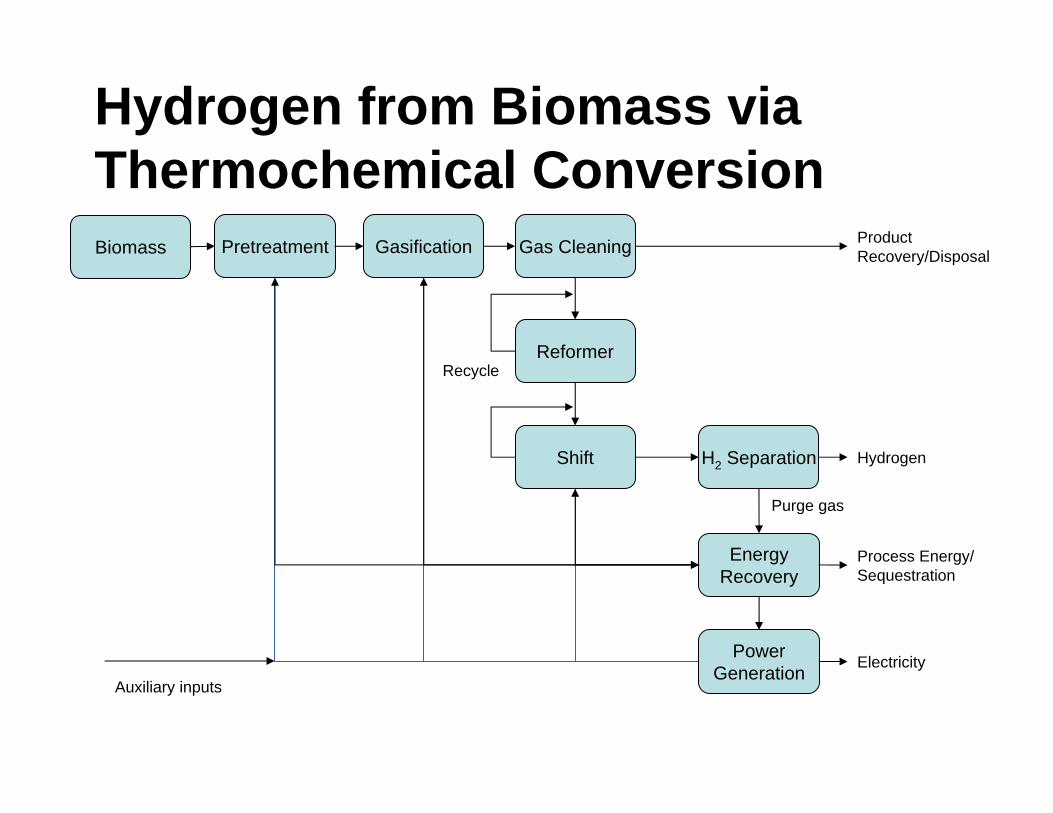
Hydrogen from Biomass via Thermochemical Conversion
Pretreatment Gasification Gas Cleaning
Reformer
Shift H2 Separation
EnergyRecovery
PowerGeneration
Recycle
Purge gas
Hydrogen
Process Energy/Sequestration
Electricity
Product Recovery/DisposalBiomass
Auxiliary inputs

Hydrogen from Biomass
• Estimated plant gate costs vary substantially
$1 – 5/kg
0.0
1.0
2.0
3.0
4.0
5.0
6.0
0 200,000 400,000 600,000 800,000 1,000,000
Hydrogen Capacity (kg/day)
Hyd
roge
n LC
OE
($/k
g)Katofsky,1993
Hamelinck, 2000
Spath, et al., 2003
NAS, 2004
Spath, et al., 2005
Larson, 2006
Parker, 2006

Delivered Costs of Hydrogen• Biomass (rice straw) to H2 analysis (Parker, 2006)
– Sacramento Valley
H2 Demand: 39 412 994 2,015 Mg/day
Biofuels
• Thermochemical Conversion• Biochemical Conversion• Physicochemical Conversion

Ethanol Fermentation• Ethanol (C2H5OH) is widely produced by fermentation and is the predominant
liquid fuel derived at present by biochemical means from biomass. • The overall reaction for the fermentation of glucose to ethanol is
C6H12O6 = 2C2H5OH + 2CO2
• Cellulosic feedstocks (such as wood and herbaceous biomass) are less expensive to produce than corn grain and represent a large resource for fuel ethanol production with potentially better net energy yields and lower environmental impacts.
• They are more difficult to hydrolyze into monosaccharides and ferment, however, incurring more costly pretreatment.
• Current methods under development for cellulosic biomass hydrolysis and fermentation essentially fall into four categories:
– 1) concentrated acid hydrolysis, – 2) dilute acid hydrolysis,– 3) enzymatic hydrolysis, and – 4) thermochemical conversion (gasification and pyrolysis)
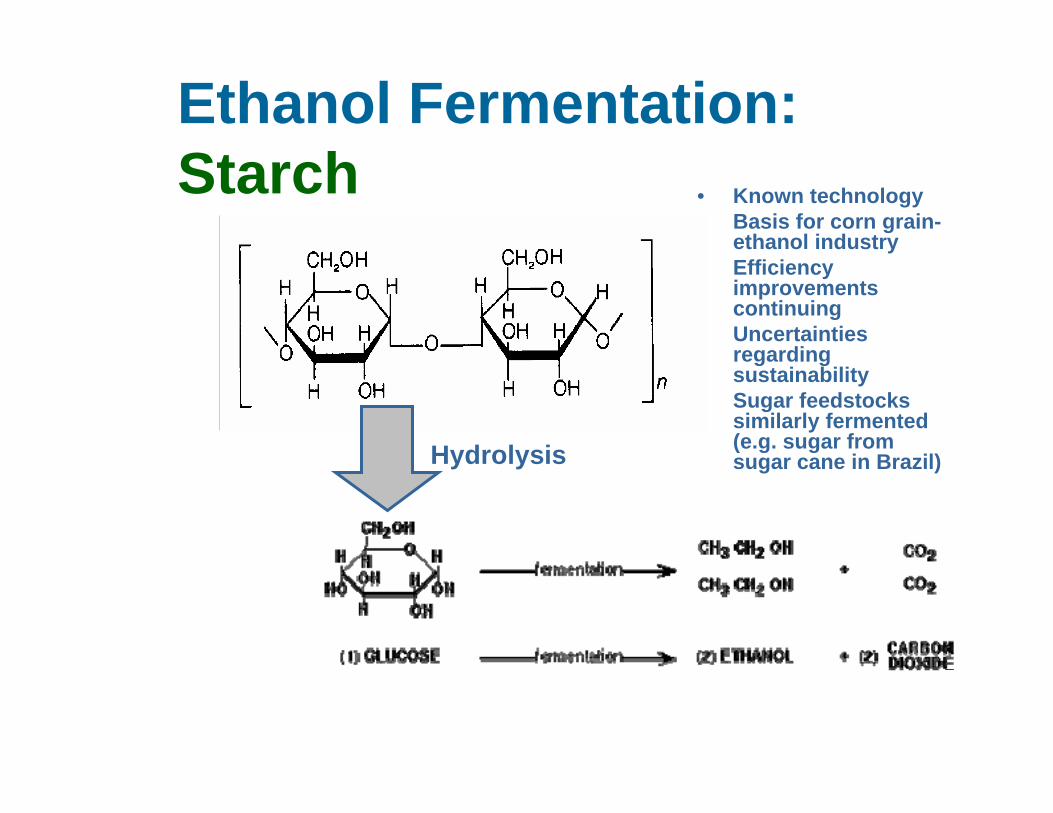
Ethanol Fermentation:Starch • Known technology
• Basis for corn grain-ethanol industry
• Efficiency improvements continuing
• Uncertainties regarding sustainability
• Sugar feedstockssimilarly fermented (e.g. sugar from sugar cane in Brazil)Hydrolysis

• Pretreatment– Size reduction/grinding– Acid (dilute or concentrated)
• hemicellulose hydroylsis– Heating– Steam explosion/AFEX,
others• Hydrolysis (cellulose
depolymerization--glucose release)
– Acid– Enzymatic
• Fermentation of sugars (C5 and C6)
– Separate– Simultaneous
saccharification and co/fermentation (SSF; SSCF)
• Product Recovery and Purification
– Distillation and dehydration– Lignin separation
(unfermented)
Cellulosic Fermentation
Butanol fermentation• Butanol (CH3(CH2)3OH) has higher
heating value per gallon (energy content) than ethanol and is less hygroscopic
• Acetone-Butanol-Ethanol fermentation pathway
• Clostridium beijerinckii, C. acetobutylcium
• Gas stripping

Anaerobic Digestion
Biogas forPower orBiofuelUpgrading
OnsiteAndGrid Power,Fuels,Chemicals
• Electricity• Heat• Biogas upgrading
– Pipeline quality– CNG– LNG– Gas-To-Liquids (GTL)– Other chemical synthesis

Anaerobic digestion for biogas generation
• California Dairy Power Production Program (CEC)
• European-California collaborations
Biofuels
• Thermochemical Conversion• Biochemical Conversion• Physicochemical Conversion

Biodiesel (FAME, FAEE)• Transesterification
– Reaction between lipid and alcohol using alkaline catalyst
– Fatty acid methylester (FAME)—oil + methanol/NaOHor KOH
– Fatty acid ethylester (FAEE)— oil + ethanol/KOH or NaOH
• Reduced viscosity, improved atomization• Improved emissions (uncertainties regarding NOx)• Lower Toxicity
38.5 lbs Soybeans38.5 lbs Soybeans
7.7 lbs soy oil7.7 lbs soy oil30.5 lbs soybean meal30.5 lbs soybean meal1.5 lb methanol1.5 lb methanol
(added in excess)(added in excess)
1 gallon B100 1 gallon B100 biodieselbiodiesel 0.6 lbs 0.6 lbs glycerineglycerine
(52 gallons/ton)(52 gallons/ton) (32 lbs/ton)(32 lbs/ton)
Warm water washWarm water wash Acid neutralizationAcid neutralization
ReactReactMethanol FlashMethanol Flash
SaltSalt
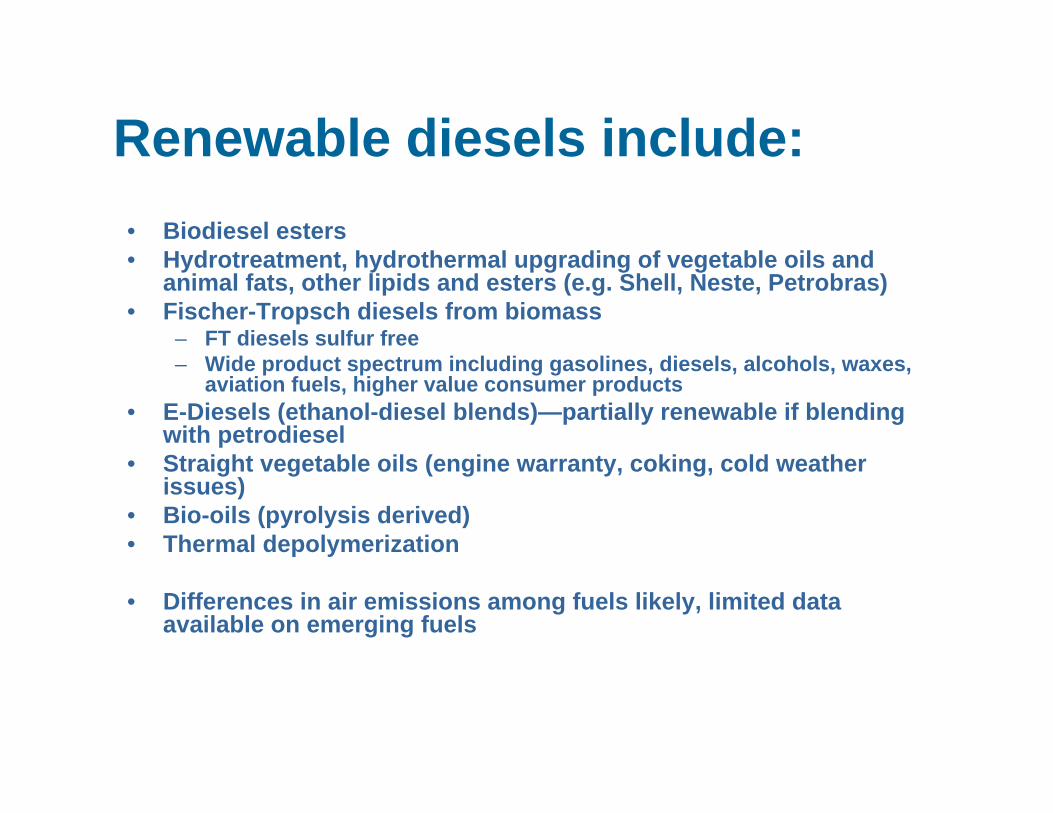
Renewable diesels include:• Biodiesel esters• Hydrotreatment, hydrothermal upgrading of vegetable oils and
animal fats, other lipids and esters (e.g. Shell, Neste, Petrobras) • Fischer-Tropsch diesels from biomass
– FT diesels sulfur free– Wide product spectrum including gasolines, diesels, alcohols, waxes,
aviation fuels, higher value consumer products• E-Diesels (ethanol-diesel blends)—partially renewable if blending
with petrodiesel• Straight vegetable oils (engine warranty, coking, cold weather
issues)• Bio-oils (pyrolysis derived)• Thermal depolymerization
• Differences in air emissions among fuels likely, limited data available on emerging fuels
Top Related