


Languages
Pages
Legal


1
VERIFICATION OF THE CHERNOBYL VERIFICATION OF THE CHERNOBYL REGISTRY DOSIMETRIC DATA AS A REGISTRY DOSIMETRIC DATA AS A
RESOURCE FOR EFFICIENT RESOURCE FOR EFFICIENT DOSIMETRIC SUPPORT SOLUTION DOSIMETRIC SUPPORT SOLUTION FOR POST-CHERNOBYL HEALTH FOR POST-CHERNOBYL HEALTH
EFFECTS STUDIESEFFECTS STUDIES
Vadim Chumak
Scientific Center for Radiation Medicine AMS Ukraine

2
Total number of liquidators Total number of liquidators (UNSCEAR, 2000)(UNSCEAR, 2000)
Countryand period
Number ofclean-up workers
Percentage for whom dose is known
Belarus 1986-1987 1986-1989
31 00063 000
2814
Russian Federation 1986 1987 1988 1989 1986-1989
69 00053 00020 5006 000
148 000
5171837363
Ukraine 1986 1987 1988 1989 1986-1989
98 00043 00018 00011 000170 000
4172798656

3
Inventory of dosimetric databasesInventory of dosimetric databases Only about 47% records in SRU, which are related
to liquidators of 1986-1990, contain individual doses (51% for 1986-1987)
95% of ODR in SRU belong to military liquidators Six IDM databases related to civilian liquidators
(ChNPP, AC-605, PA “Combinat”) – 168,394 dose records – failure to link with SRU data
Paper archives of the Ministry of Defense were converted into electronic databases (ca.50,000 records) – good overlap and coincidence with SRU data
4
Frequency histogram of doses of Frequency histogram of doses of military liquidators (“partisans”) of 1986military liquidators (“partisans”) of 1986
0
1000
2000
3000
4000
0 50 100 150 200 250 300
Cumulative dose, mSv
Fre
quen
cy, p
erso
ns

5
Frequency histogram of individual daily Frequency histogram of individual daily doses of military liquidators of 1986doses of military liquidators of 1986
0
200
400
600
800
1000
1200
1400
0 5 10 15 20 25 30
Daily dose, mSv
Fre
quen
cy, p
erso
ns
6
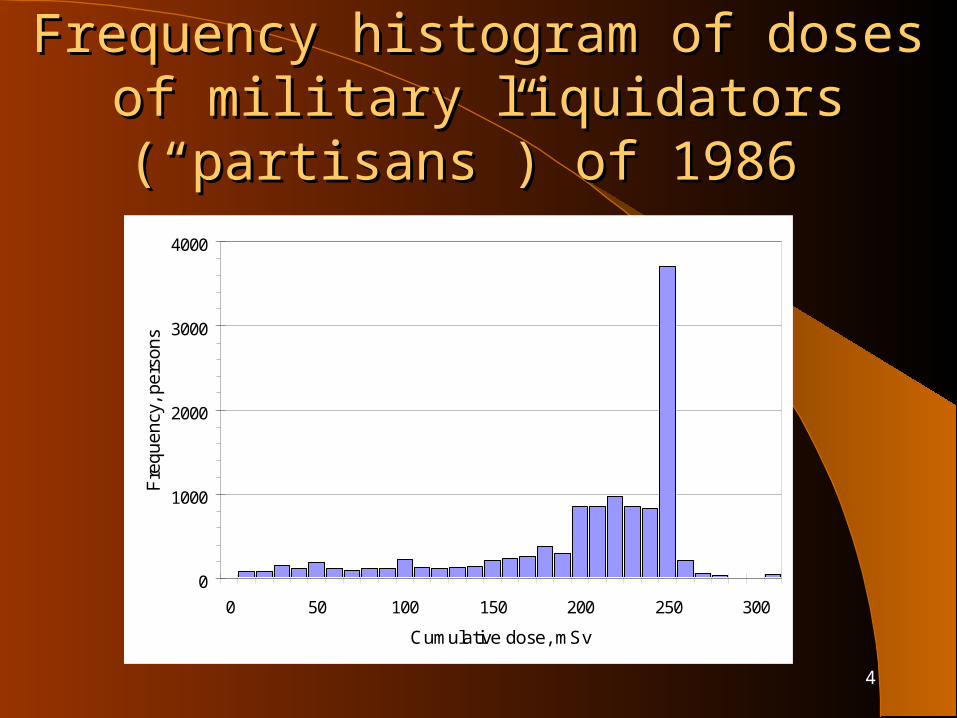
Normalized probability plot for distribution of Normalized probability plot for distribution of daily doses of military liquidators daily doses of military liquidators
(“partisans”) of 1986 (HLN hypothesis)(“partisans”) of 1986 (HLN hypothesis)
0
20
40
60
80
100
0 20 40 60 80 100
Probability (experimental data)
Pro
babi
lity
(HLN
dis
trib
utio
n)

7
Experimental dependence of entropy Experimental dependence of entropy coefficient on increment of histogram coefficient on increment of histogram
(solid line) and modeled calibration (solid line) and modeled calibration dependenciesdependencies
8
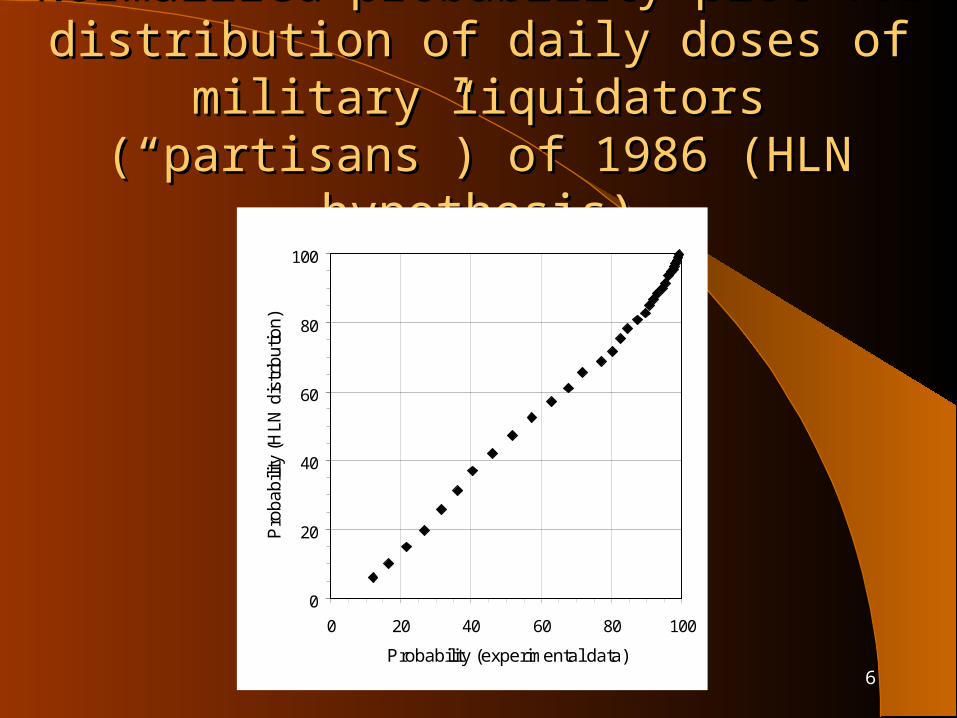
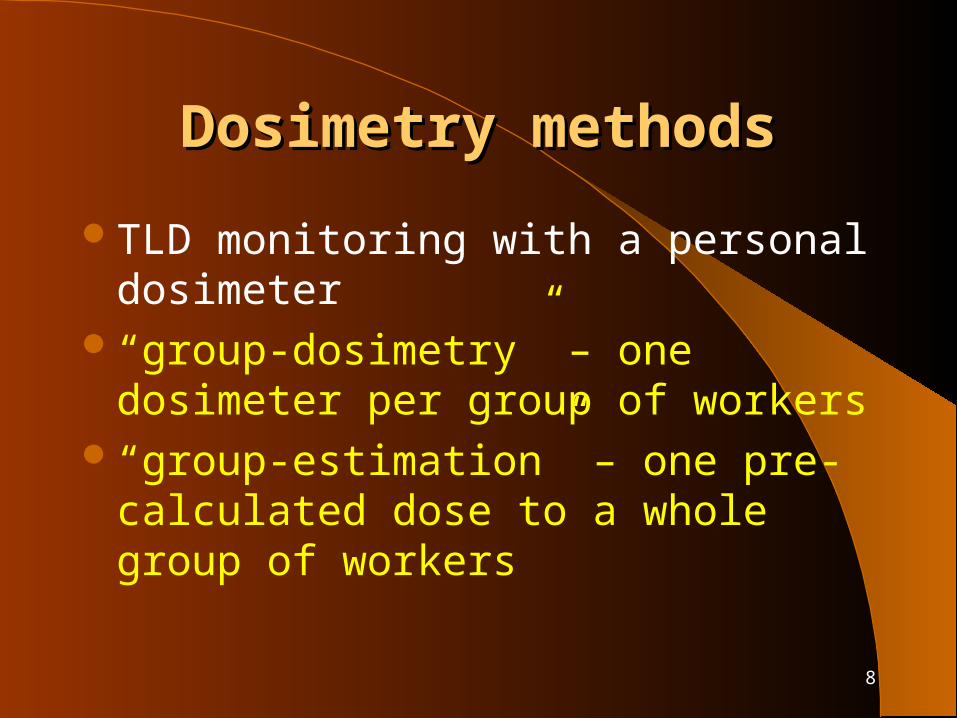
Dosimetry methodsDosimetry methods
TLD monitoring with a personal dosimeter
“group-dosimetry” – one dosimeter per group of workers
“group-estimation” – one pre-calculated dose to a whole group of workers
9
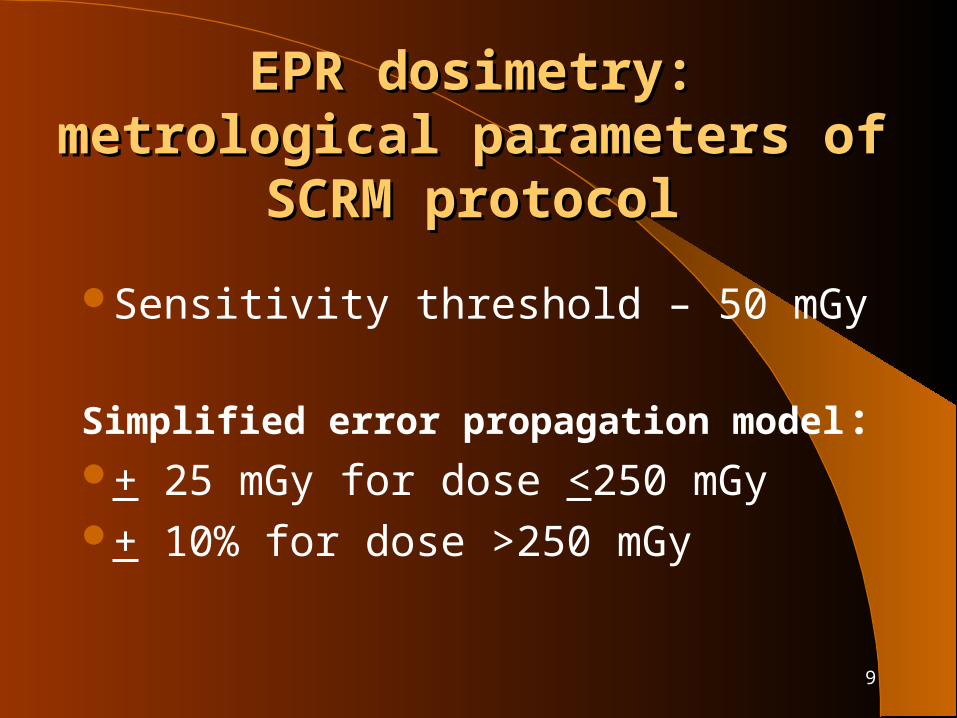
EPR dosimetry:EPR dosimetry:metrological parameters of metrological parameters of
SCRM protocolSCRM protocol
Sensitivity threshold – 50 mGy
Simplified error propagation model:+ 25 mGy for dose <250 mGy+ 10% for dose >250 mGy

10
Cutting tooth into Cutting tooth into lingual and buccal partslingual and buccal parts

11
Samples for analysis: Samples for analysis: Tooth acquisition network in UkraineTooth acquisition network in Ukraine
Health M inistryof Ukraine
D neprope trovsk
P oltava
C hernyhiv K harkiv
Zaporizhya
C herkasy
K iev
Central b ioprobe bank
Bioprobe section Database sectionconservation ep idem iologyregis tra tion o f incom ing probesstorage m ed icinetracing of the sam plessam ple preparation socia l serv icestorage o f reconstruc ted dosesaccess fo r analysis exposed ind iv idualsre trieva l and output of doses
. . .. . .. . .. . .
EPR-dosim etrym ethodo logica l
centerEPR-dosim etry lab
Consum erso f dosim etric in fo rm ation
12
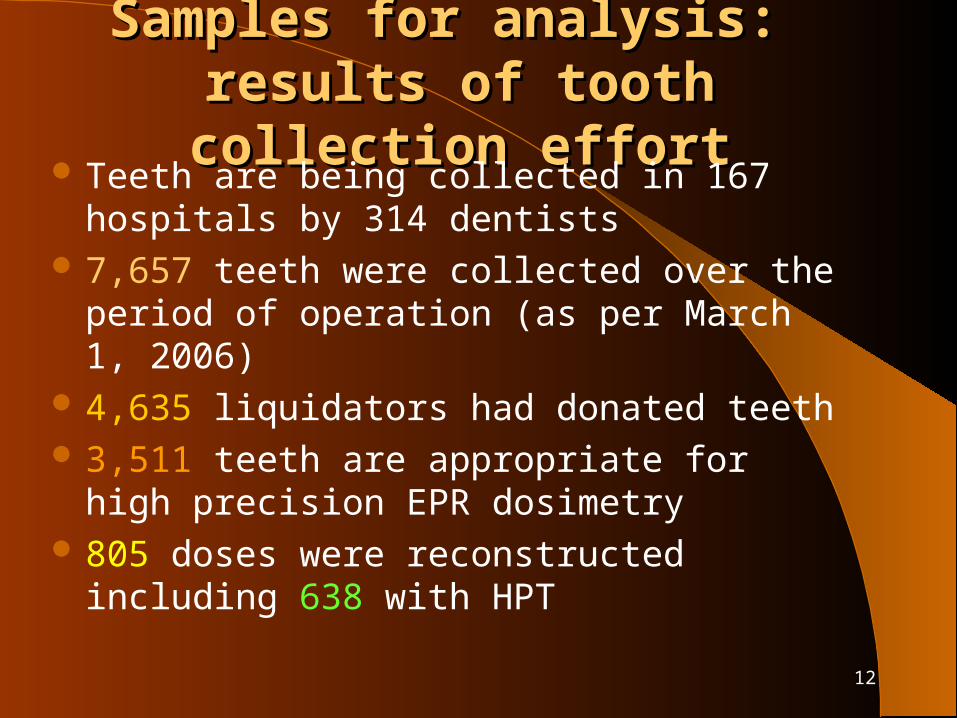
Samples for analysis: Samples for analysis: results of tooth collection effortresults of tooth collection effort
Teeth are being collected in 167 hospitals by 314 dentists
7,657 teeth were collected over the period of operation (as per March 1, 2006)
4,635 liquidators had donated teeth 3,511 teeth are appropriate for high precision
EPR dosimetry 805 doses were reconstructed including 638
with HPT
13
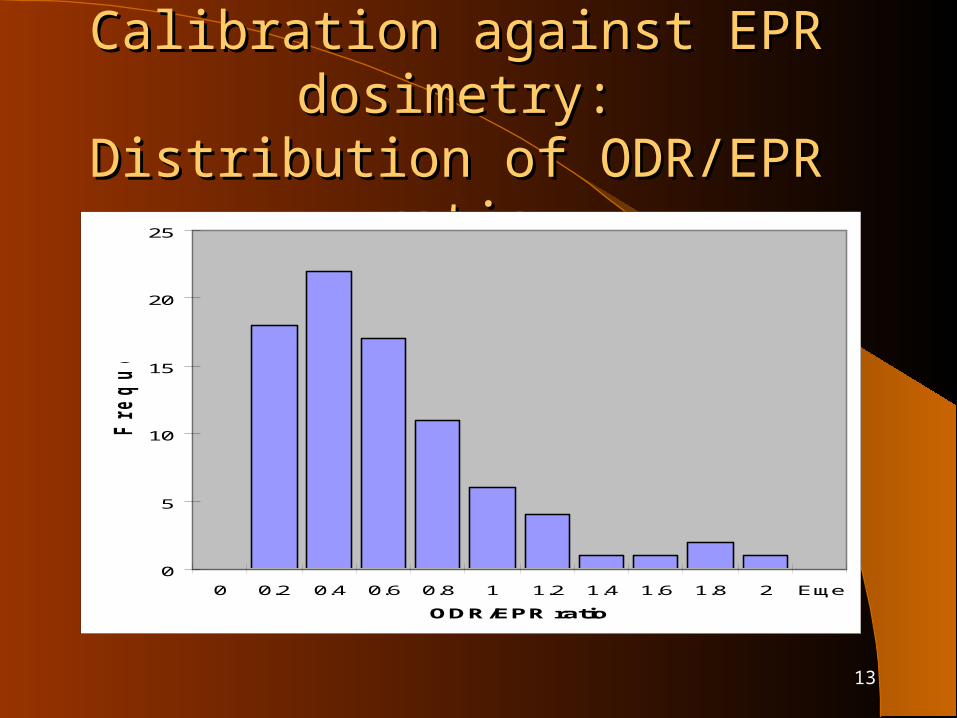
Calibration against EPR dosimetry:Calibration against EPR dosimetry:Distribution of ODR/EPR ratioDistribution of ODR/EPR ratio
0
5
10
15
20
25
0 0.2 0.4 0.6 0.8 1 1.2 1.4 1.6 1.8 2 Еще
ODR/EPR ratio
Fre
qu
en
cy
14
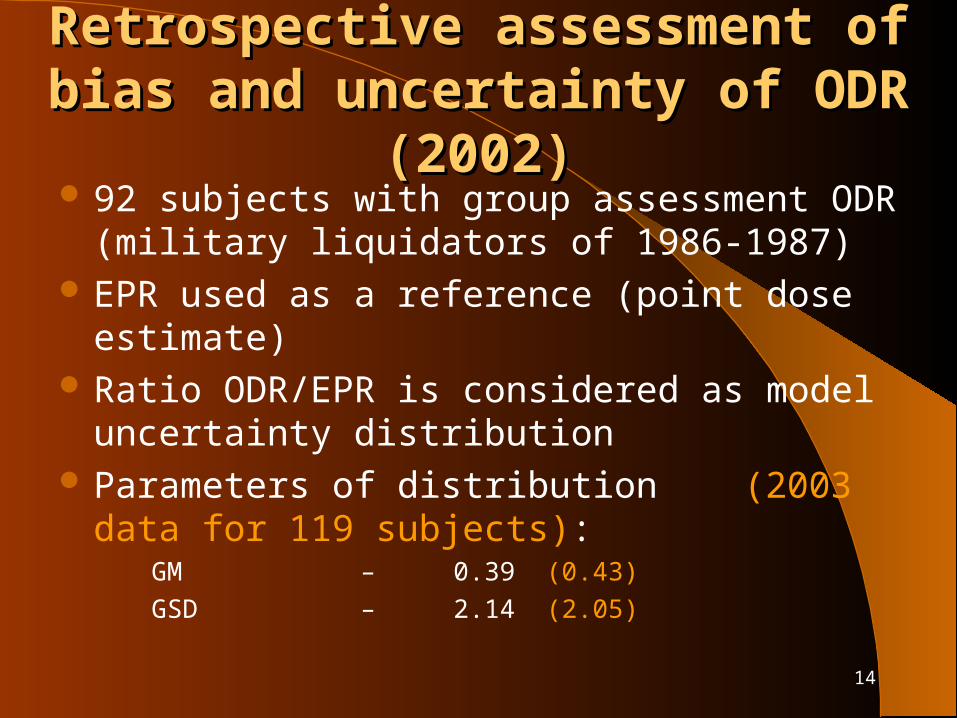
Retrospective assessment of bias Retrospective assessment of bias and uncertainty of ODR (2002)and uncertainty of ODR (2002)
92 subjects with group assessment ODR (military liquidators of 1986-1987)
EPR used as a reference (point dose estimate) Ratio ODR/EPR is considered as model
uncertainty distribution Parameters of distribution
(2003 data for 119 subjects): GM – 0.39 (0.43)
GSD – 2.14 (2.05)

15
Plan of validation of official Plan of validation of official dose records in SRUdose records in SRU
Collection of teeth from liquidators Stratification of military liquidators by
category of dosimetric dataApplication of EPR dosimetry as a
reference for recalibration of ODRElaboration of criteria for identification of
falsified dose values

16
Expected outcomeExpected outcome
Ca.60,000 validated and re-calibrated Official Dose Records
Individual uncertainty distributions (possibility to derive point estimate along with uncertainty)
Dosimetric database for SRU members to be available for researchers of post-Chernobyl medical effects

17
Thank you!Thank you!
Top Related