


Languages
Pages
Legal


2
Rules
No use of mobile devices unless told Computer use strictly for tutorial
purposes
Failure to comply means immediate expelling from class which might also have other consequences

3
Attitude
STUDENT TYPE I
Excuses Complaints 9 to 5 Procrastinate Bored
STUDENT TYPE II
Overcomes obstacles
Suggestions Beginning to end Hard work Will find interest
in it

4
Round of Introductions
Name
Experience with statistics
Why is statistics useful for a media manager?

5

6

7

8
Participant wearing biometric sensorsParticipant wearing biometric sensors

9
Plan for today
• Introduction to statistics• Variables and frequencies• Purpose of statistics• Tables and diagrams• Terminology
• The BIG Smartie survey• SPSS workshop

10
Building blocks
statistical theory
statistical theory
data collection
data collection
data analysis
data analysis
reportingpresentingreporting
presenting
Howitt&
Cramer
Limesurvey
SPSS
Matthews

11
Introduction statistics (chapter 1 and 2)

12
Variables
• Nominal / category • Examples: cigarette brand (Camel, Marlboro, other), religious
affiliation (Roman Catholic, Dutch Reformed, Calvinist, other Christian, Muslim, other religion, none).
• Score / numerical• Examples: temperature of the smoke in °C, golf scores (holes
above or below par), year, time to complete a task, age, height.

13
Variables
• Dichotomous. • Examples: being a smoker (yes/no), gender (male/female).
• Other nominal. • Examples: cigarette brand (Camel, Marlboro, other), religious
affiliation (Roman Catholic, Dutch Reformed, Calvinist, other Christian, Muslim, other religion, none).
• Ordinal. • Examples: frequency of smoking (never, incidentally, daily),
rank in competion, clothing sizes (S,M,L,XL), attitude toward organic vegetables (positive, neutral, negative).
• Interval. • Examples: temperature of the smoke in °C, golf scores (holes
above or below par), year.• Ratio.
• Examples: time to complete a task, age, height.
14
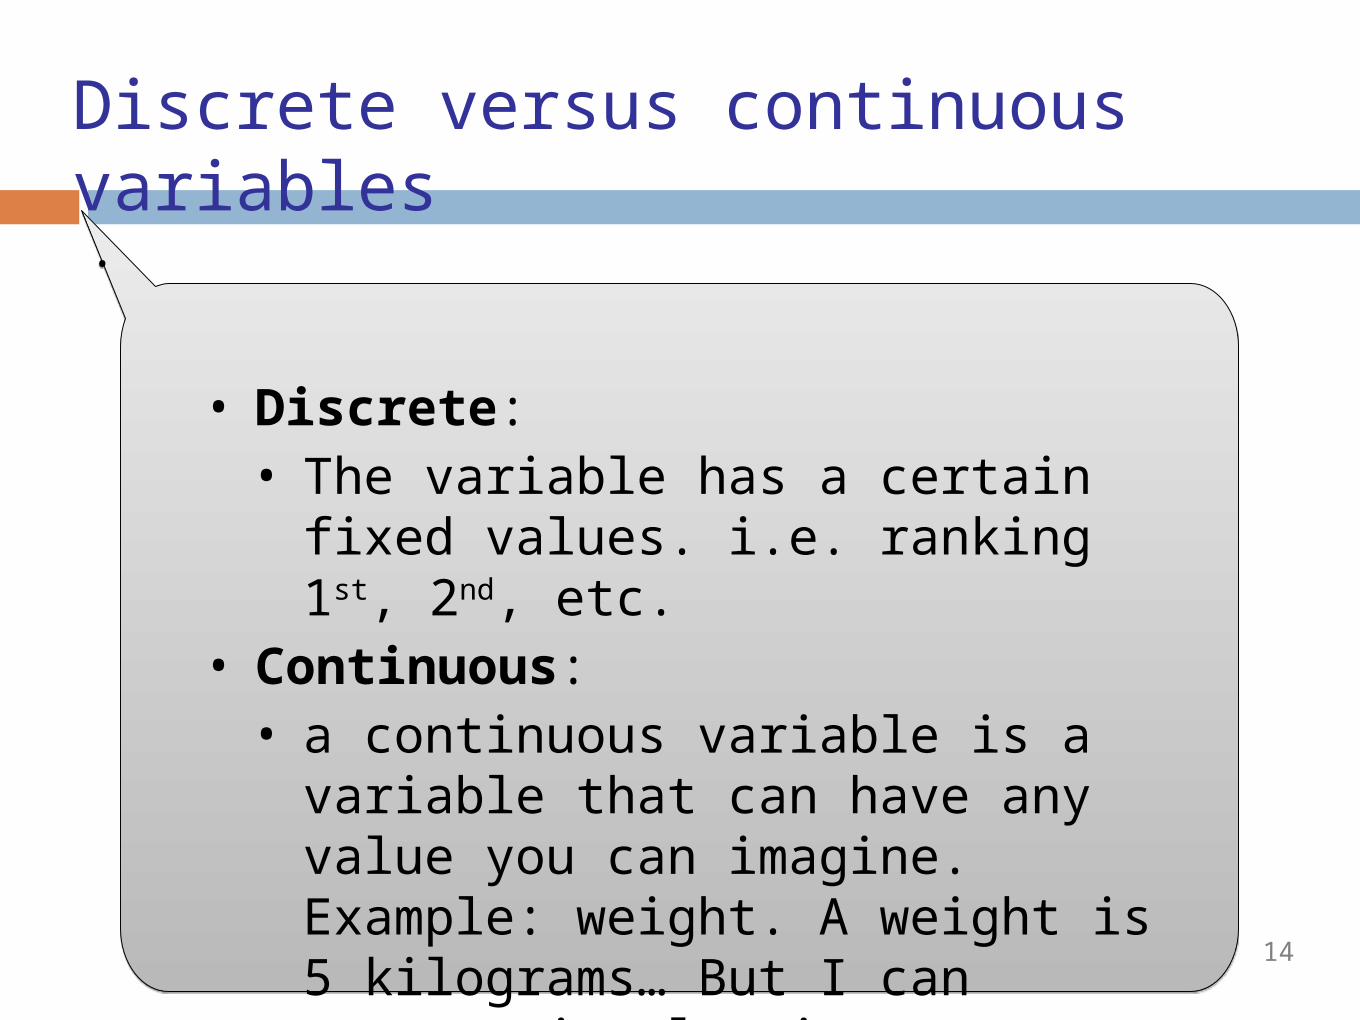
Discrete versus continuous variables
..
• Discrete: • The variable has a certain fixed values.
i.e. ranking 1st, 2nd, etc.• Continuous:
• a continuous variable is a variable that can have any value you can imagine. Example: weight. A weight is 5 kilograms… But I can measure it also in grams… then it might be 5025 grams…

15
Variables and data
• variable: characteristic or condition that changes or has different values for different individuals
• value: possible outcome• code: a number for a score• data: measurements or observations of a
variable • data set: a collection of measurements or
observations. • score: a single measurement or observation

16
Populations and samples
• population: the set of all the individuals or objects of interest in a particular study
• sample: a set of individuals or objects selected from the population, usually intended to represent the population in a research study

17
Populations and samples

18
Population and samples
• parameter: a value that describes a population
• statistic: a value that describes a sample
• sampling error: the discrepancy, or amount of error, that exists between a sample statistic and the corresponding population parameter

19 watch soaps do not watch soaps
Sample with a lot of sampling error

20
Descriptive versus inferential statistics
Statistics serve two general purposes:•descriptive statistics: statistics is used to present data in a convenient way: tables, graphs and figures (summarize, organize and simplify the data).
•inferential statistics: statistics is used to generalize from the sample to the population (it uses information from a sample to draw conclusions – inferences – about the population from which the sample was taken).

21
Functions of statistics
descriptive statisticsdescriptive statistics inferential statisticsinferential statistics
individualindividualvariablesvariables
frequency distribution, frequency distribution, means, etc.means, etc.
for example election for example election research to predict the research to predict the percentage of votes that a percentage of votes that a party will receiveparty will receive
relationshirelationships ps between between variablesvariables
cross tabulation, cross tabulation, compare means, compare means, scatter plot, scatter plot, correlation coefficient, etc.correlation coefficient, etc.
hypotheses, hypotheses, significance testingsignificance testing

22
Statistical notation
’’
statistics uses basic mathematicaloperations and notation, but also some specific notation:•X: scores are referred to as X (and Y etc.)•N: is the number of scores in a population •n: the number of scores in a sample•Σ: the frequently used symbol (Greek capital S) stands for ‘summation’

23
Presentation modes
••• raw data (data matrix)• tables• diagrams
• measures• words

24
Raw data
25
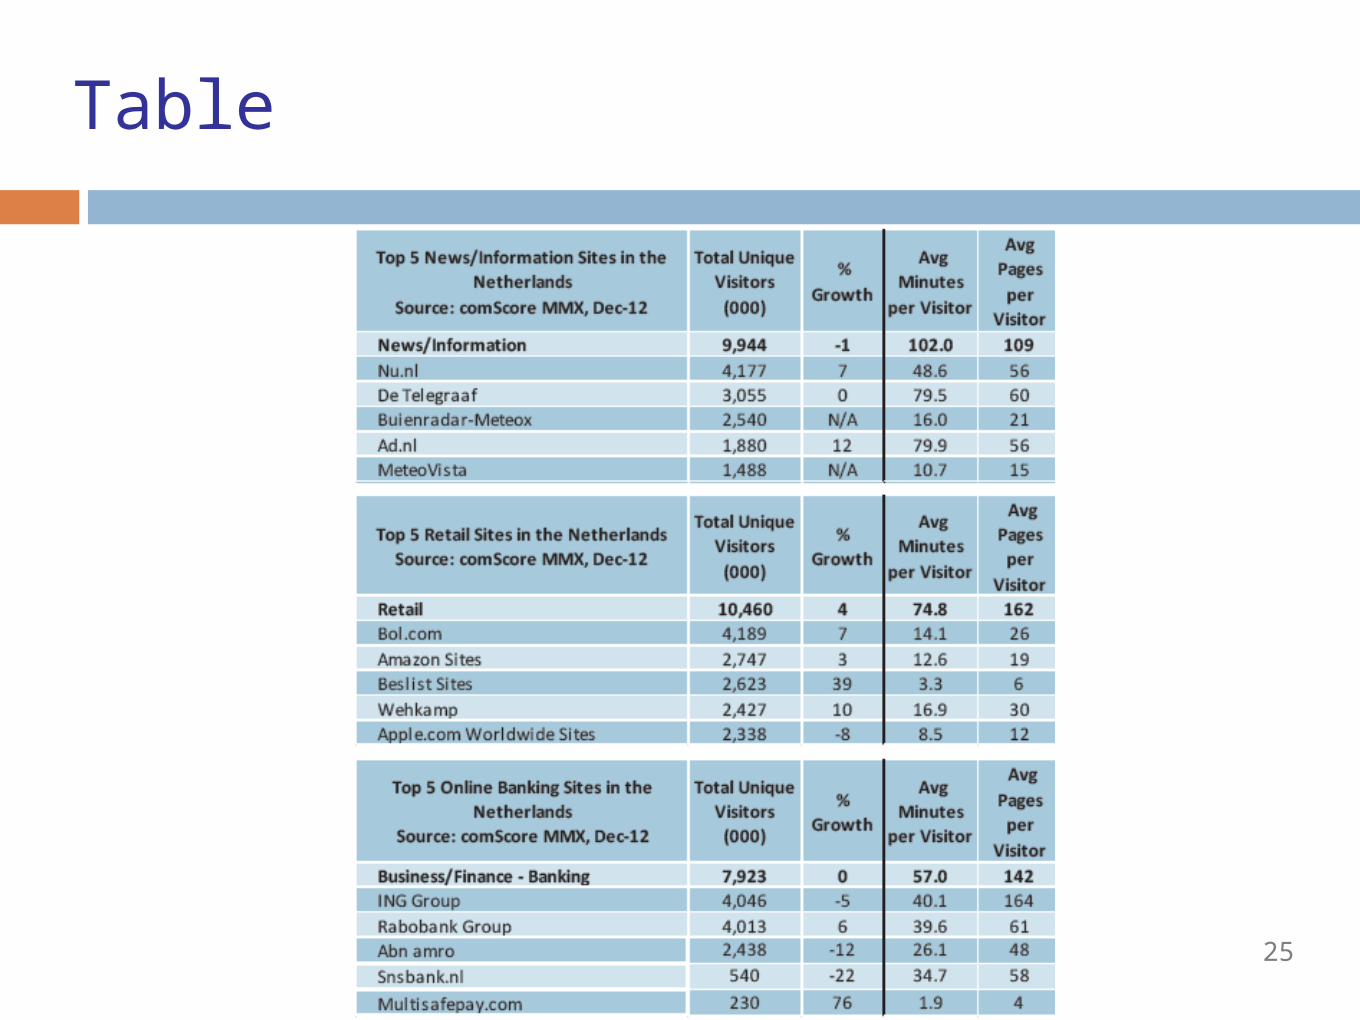
Table

26
(Bar) graphs

27
(Histogram) Graphs

2847
(Line) graph
29
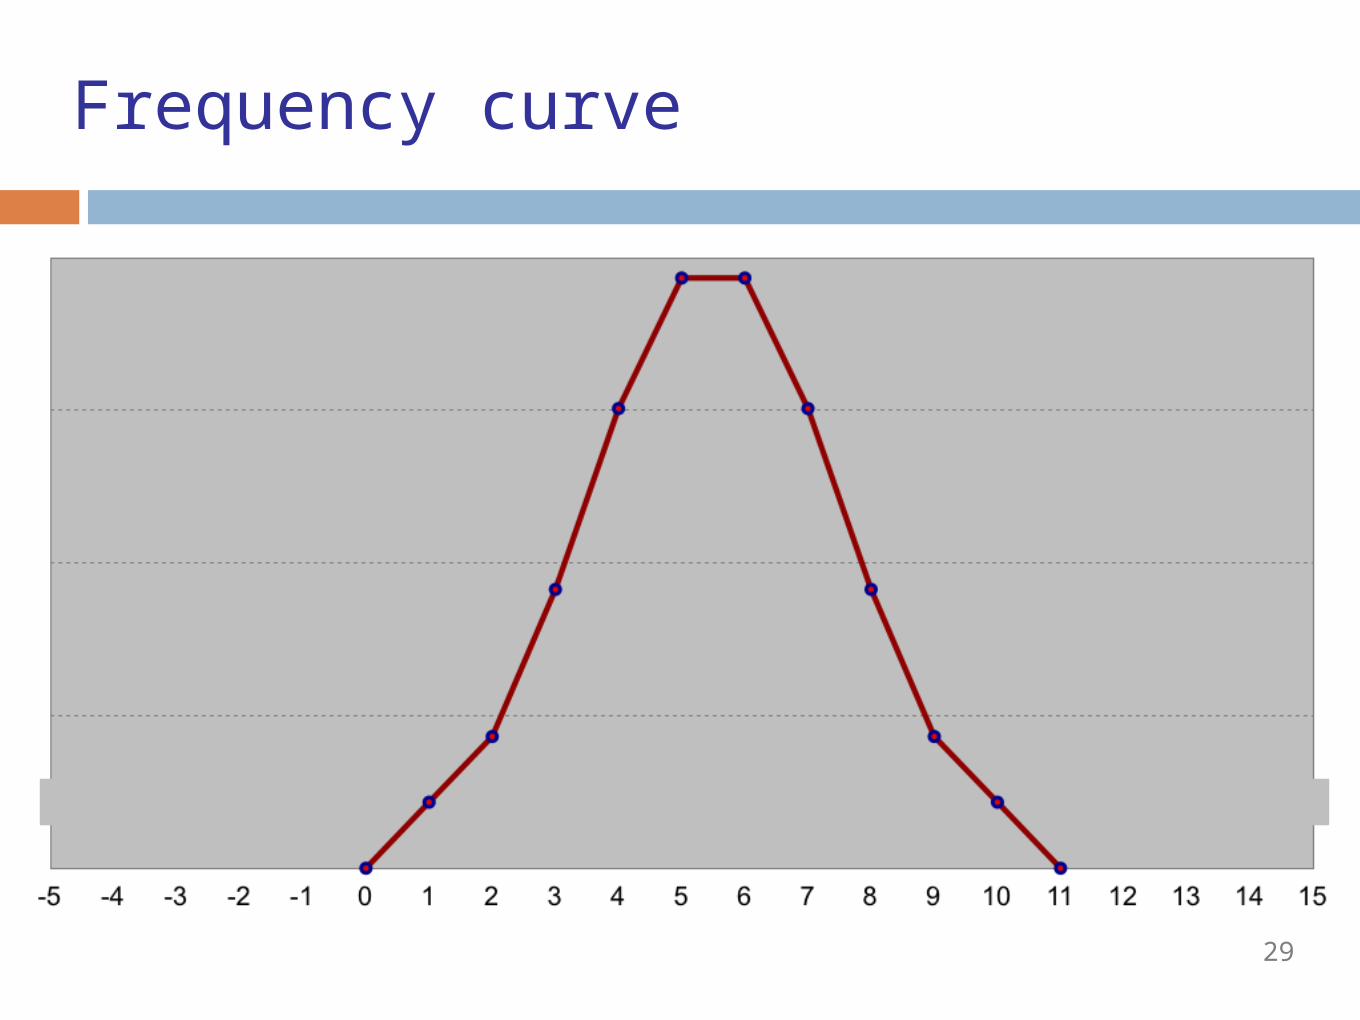
Frequency curve

31
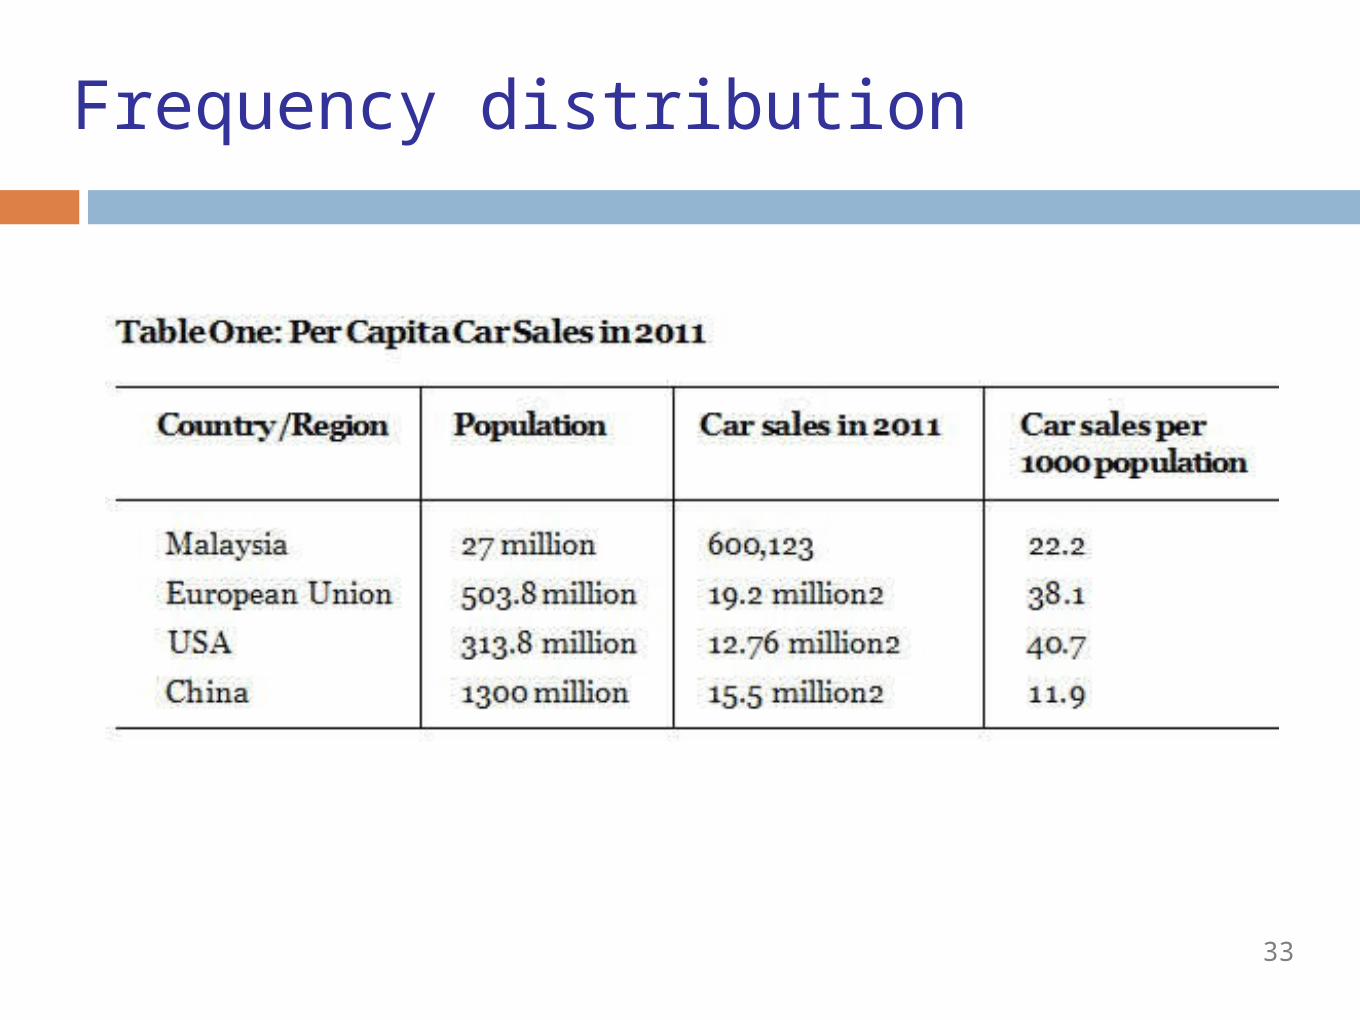
Frequency distribution
• a frequency distribution shows the number of individuals located in each category
• can be either a table or a graph• the table or the graph shows:
(1) the categories that make up the scale, (2) the frequency, or number of individuals

32
Frequency distribution (example)
33
Frequency distribution

34
do the The BIG smartie survey

35
CREATE TEAMS
DO NOT VISIT MOODLE WEBSITE UNLESS INSTRUCTED!
Groups of 2 Decide who are you partnering with
In case of an odd number of class members: 1 group of 3WAIT until you are pointed at. Groups will register one by one Do not make a mess!

36
steps
• 1st team member choses team
• 2nd team member joins team
• 1 person uploads file from assignment ( according guidelines on Moodle)
• !!!! if you are not part of a team you will not receive a mark!!!!!

37
SPSS
38
Functions of SPSS
• data input• data processing• statistical analysis• presentation results

39
SPSS WORKSHOP

40
SPSS OVERVIEW• Data view• Variable view• Output (on Viewer)
• Frequencies
• Select cases• Transform -> Recode into different vars

41
Exercise
For 10 students: Gender Height

42
Menu
READ AND WRITE FILES (Menu: File)•Open (Data files, Output file, Syntax files)•Save / Save as …
DATA DEFINITIONS (Menu: Data or Data View)•Insert variables•Define variable properties•Select cases
DATA TRANSFORMATIONS (Menu: Transform)•Recode•Count•Compute
STATISTICAL PROCEDURES (Menu: Analyze)•Descriptive Statistics > Frequencies
•etc.

43
Variable view switch to SPSS
• name• type (numerical, …, string)• width• decimals• label• values • missing• measure (scale, ordinal, nominal)

44
Variable types
• numeric: figures (real figures and codes)
• string: names etc.(no mean calculation possible etc.)
• other: less important (dates etc.)

45
• Download the big smartie survey dataset from moodle
• Open the file in SPSS
• We will give A Guided tour• Variable view• Date View• Menu options ( basic)• Cleaning and making the Dataset ready for analysis
Example

46
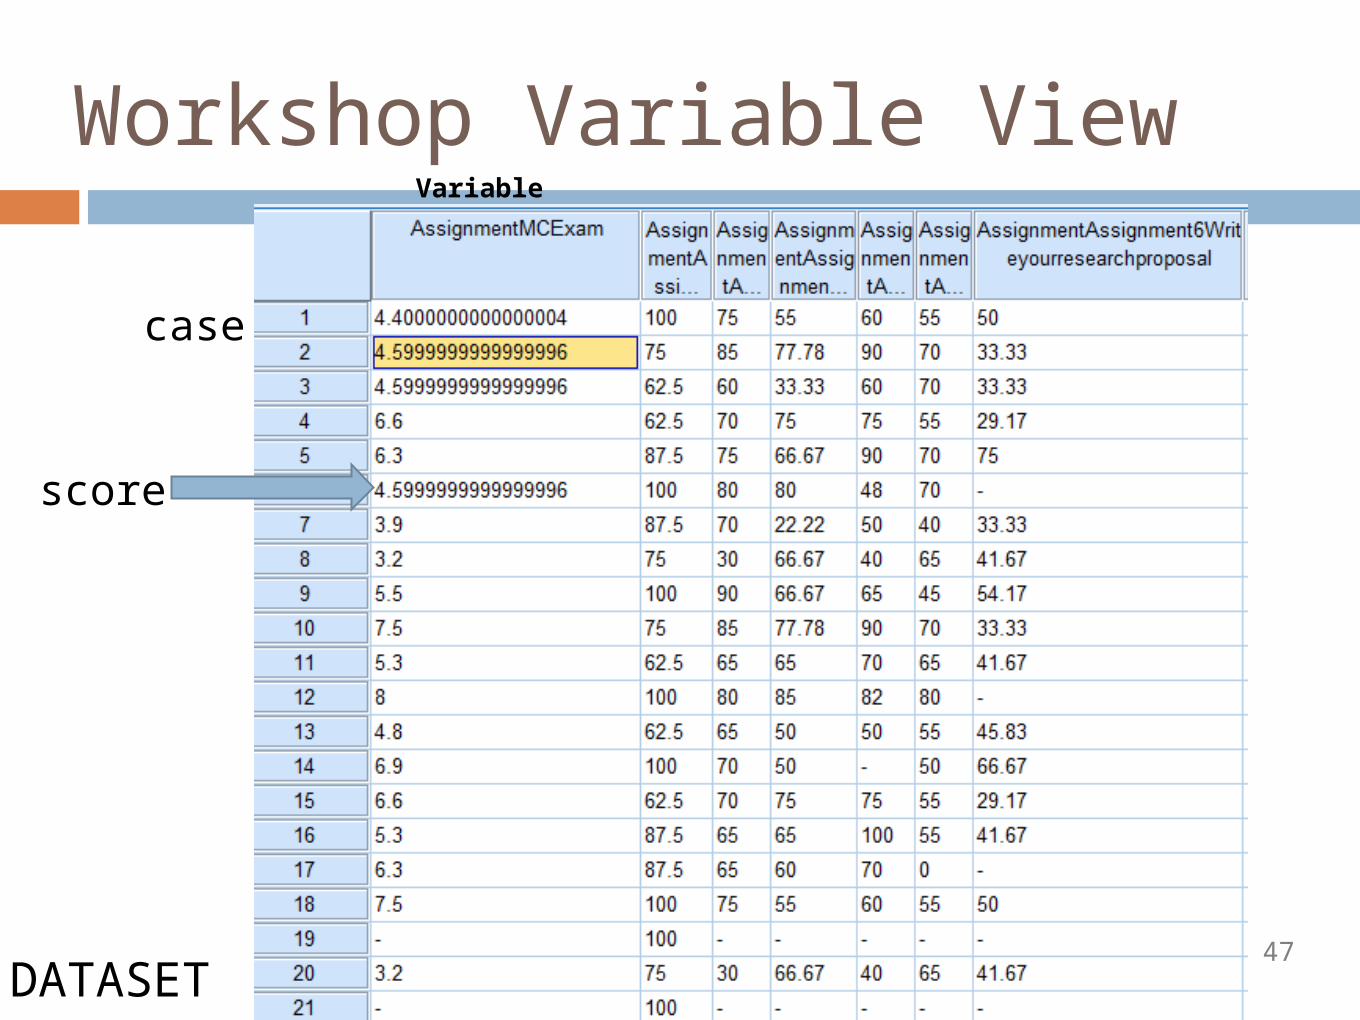
Workshop Variable View
Elementsnametype(width)decimalslabelvaluesmissing(columns)(align)measure(role)
47
Workshop Variable View
case
Variable
score
DATASET

48
Workshop Cleaning Dataset
Take a look at the dataview. -What do you notice in the dataset
-Clean your dataset-Select the FIRST variable and SORT ( right mouse
click)-Select the cases that are empty-Delete the cases

49
Workshop Cleaning Dataset
Take a look at the dataview. -What do you notice in the dataset
-Clean your dataset-Select the FIRST variable and SORT ( right mouse
click)-Select the cases that are empty-Delete the cases-Check the other cases if there are cases that do not
contain any relevant information ( delete those cases too)

50
Workshop Setting the correct variable information
Take a look at the variable view. -What do you notice in the variable view?
-Correct the incorrect variables-Type-Measure
-Check the labels

54
HOMEWORK
Top Related