
![© Spiros Mancoridis Software Design (Architectural), Pg 1 Software Design Topics in Architectural Design Material drawn from [Shaw96, Perry93]](https://static.fdocuments.us/doc/165x107/56649e225503460f94b0febc/-spiros-mancoridis-software-design-architectural-pg-1-software-design.jpg)


![© SERG Dependable Software Systems (Control-Flow Testing) Dependable Software Systems Topics in Control-Flow Testing Material drawn from [Beizer, Mancoridis]](https://static.fdocuments.us/doc/165x107/56649e1a5503460f94b079c1/-serg-dependable-software-systems-control-flow-testing-dependable-software.jpg)


Languages
Pages
Legal


1
The Search Landscape ofGraph Partitioning Problems
using Coupling and Cohesion as the Clustering Criteria
Brian S. Mitchell & Spiros Mancoridis{bmitchel,smancori}@mcs.drexel.eduhttp://www.mcs.drexel.edu/~{bmitchel,smancori}Department of Computer ScienceSoftware Engineering Research Grouphttp://serg.mcs.drexel.eduDrexel University, Philadelphia, PA, USA
10/05/2002

2Drexel University Software Engineering Research Group (SERG)http://serg.mcs.drexel.edu
Software Clustering with Bunch
Source CodeAnalysis Tools
MDG File
Bunch ClusteringTool
Partitioned MDG File
Visualization ToolSource Code
void main(){ printf(“hello”);}
Acacia Chava
M1
M2
M3
M5M4
M6
M7 M8
M1
M2
M3
M5M4
M6
M7 M8
Bunch GUI
ClusteringAlgorithms
Clustering Tools
ProgrammingAPI

3Drexel University Software Engineering Research Group (SERG)http://serg.mcs.drexel.edu
Software Clustering as a Search Problem
Source CodeAnalysis Tools
MDG
Source Codevoid main(){ printf(“hello”);}
Acacia Chava
M1
M2
M3
M5M4
M6
M7 M8
Software ClusteringSearch Algorithms
bP = null;
while(searching()){ p = selectNext(); if(p.isBetter(bP)) bP = p;}
return bP;
“GOOD” MDG Partition“GOOD” MDG Partition
M1
M2
M3
M5M4
M6
M7 M8
SEARCH SPACESet of All
MDG Partitions
M1
M2
M3
M5M4
M6
M8 M7
M1
M2
M3
M5M4
M6
M8 M7
Total = 4140 Partitions

4Drexel University Software Engineering Research Group (SERG)http://serg.mcs.drexel.edu
The Search Space is Enormous
1 = 12 = 23 = 54 = 155 = 52
6 = 2037 = 8778 = 41409 = 2114710 = 115975
11 = 67857012 = 421359713 = 2764443714 = 19089932215 = 1382958545
16 = 1048014214717 = 8286486980418 = 68207680615919 = 583274220505720 = 51724158235372
otherwisekSS
nkkifS
knknkn
,11,1,
11
The number of MDG partitions grows very quickly, as the number of modules in the system increases…
A 15 Module System is about the limit for performing Exhaustive Analysis

5Drexel University Software Engineering Research Group (SERG)http://serg.mcs.drexel.edu
Our Assumption…“Well designed software systems are organized into cohesive clusters that are loosely interconnected.”
We designed a measurement called MQ that embodies our assumptionThe MQ measurement balances cohesion and coupling We apply MQ to partitions of the MDG

6Drexel University Software Engineering Research Group (SERG)http://serg.mcs.drexel.edu
Not all Partitions of the MDG are Good Solutions
MDG
Good Partition! Bad Partition!
M1
M2
M1
M2 M3
M1
M2
M4
M3M5
M6M3
M4
M5 M6
M4
M5
M6
MQ(Good Partition) > MQ(Bad Partition)

7Drexel University Software Engineering Research Group (SERG)http://serg.mcs.drexel.edu
The Software Clustering Problem:Algorithm Objectives
“Find a good partition of the MDG.”
A partition is the decomposition of a set of elements (i.e., all the nodes of the graph) into mutually disjoint clusters.A good partition is a partition where: highly interdependent nodes are grouped in
the same clusters independent nodes are assigned to separate
clusters
The better the partition the higher the MQ

8Drexel University Software Engineering Research Group (SERG)http://serg.mcs.drexel.edu
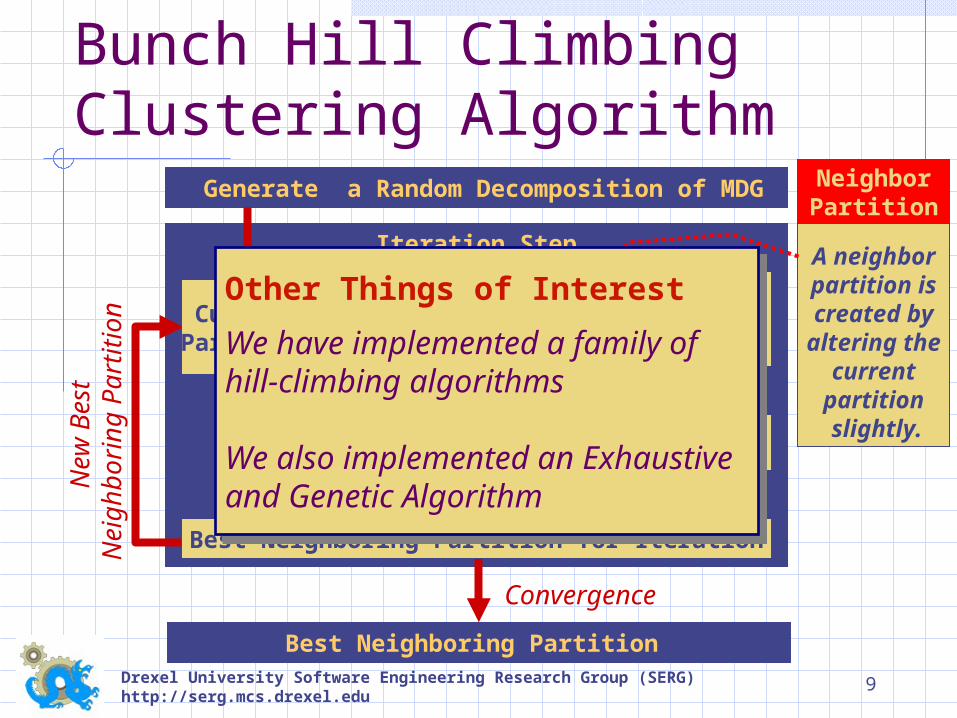
Bunch Hill Climbing Clustering Algorithm
Generate a Random Decomposition of MDG
Iteration Step
GenerateNext
Neighbor
MeasureMQ
Compare to BestNeighboring Partition
Better
Measu
re M
Q
Best Neighboring Partition
New
Best
N
eig
hb
ori
ng
Part
itio
n
Convergence
Best Neighboring Partition for Iteration
CurrentPartition
A neighborpartition iscreated byaltering the
currentpartition slightly.
NeighborPartition
Better?
9Drexel University Software Engineering Research Group (SERG)http://serg.mcs.drexel.edu
Bunch Hill Climbing Clustering Algorithm
Generate a Random Decomposition of MDG
Iteration Step
GenerateNext
Neighbor
MeasureMQ
Compare to BestNeighboring Partition
Better
Measu
re M
Q
Best Neighboring Partition
New
Best
N
eig
hb
ori
ng
Part
itio
n
Convergence
Best Neighboring Partition for Iteration
CurrentPartition
A neighborpartition iscreated byaltering the
currentpartition slightly.
NeighborPartition
Better?
Other Things of Interest
We have implemented a family ofhill-climbing algorithms
We also implemented an Exhaustiveand Genetic Algorithm
Other Things of Interest
We have implemented a family ofhill-climbing algorithms
We also implemented an Exhaustiveand Genetic Algorithm

10Drexel University Software Engineering Research Group (SERG)http://serg.mcs.drexel.edu
Hierarchical Clustering (1):Nested View
1.
2. Default
4.
3.

11Drexel University Software Engineering Research Group (SERG)http://serg.mcs.drexel.edu
Hierarchical Clustering (2):Consolidated View
1.
2. Default
4.
3.

12Drexel University Software Engineering Research Group (SERG)http://serg.mcs.drexel.edu
Hierarchical Clustering (3):Tree View

13Drexel University Software Engineering Research Group (SERG)http://serg.mcs.drexel.edu
Hierarchical Clustering (3):Tree View
Observations
•The number of levels for a givensystem’s clustering hierarchy isbounded by:
O(log2N)
because Bunch places at least 2nodes in each cluster.
Observations
•The number of levels for a givensystem’s clustering hierarchy isbounded by:
O(log2N)
because Bunch places at least 2nodes in each cluster.

14Drexel University Software Engineering Research Group (SERG)http://serg.mcs.drexel.edu
Evaluating The Software Clustering Results
Over the past few years we have spent a lot of time evaluating Bunch’s software clustering results Empirically Semi-formally Measuring Similarity

15Drexel University Software Engineering Research Group (SERG)http://serg.mcs.drexel.edu
What We Know
Given a particular MDG, the results produced by Bunch converge to a family of related solutionsThe search space is large, and the probability of finding a good solution by random sampling is infinitesimal

16Drexel University Software Engineering Research Group (SERG)http://serg.mcs.drexel.edu
Software Clustering using Graph Partitioning Techniques
Running Bunch multiple times produces a family of related clustering results Bunch starts with a random partition of the
MDG, and makes random moves to explore the search space

17Drexel University Software Engineering Research Group (SERG)http://serg.mcs.drexel.edu
Software Clustering using Graph Partitioning Techniques
How related are these clustering results?

18Drexel University Software Engineering Research Group (SERG)http://serg.mcs.drexel.edu
Software Clustering using Graph Partitioning Techniques
Given that there are 2,7644,437 distinct partitionsof this MDG, there is a lot of agreement…

19Drexel University Software Engineering Research Group (SERG)http://serg.mcs.drexel.edu
Software Clustering using Graph Partitioning TechniquesWhy Some Modules Don’t Agree…
Library Modules
IsomorphismOmnipresent
Module Influences

20Drexel University Software Engineering Research Group (SERG)http://serg.mcs.drexel.edu
Special ModulesIsomorphic – Modules that are connected to multiple clusters with equal strengthLibrary – All edges fan-inDriver – All edges fan-outOmnipresent – Modules that are strongly connected to many other modules in the system

21Drexel University Software Engineering Research Group (SERG)http://serg.mcs.drexel.edu
Clustering a SystemMany Times (1)…
RCS (Random)
0
0.5
1
1.5
2
2.5
0 10 20 30
Number of Clusters
MQ
Va
lue
RCS (Bunch)
0
0.5
1
1.5
2
2.5
0 10 20 30
Number of Clusters
MQ
Va
lue
RCS
0
5
10
15
20
25
30
0 250 500 750 1000
Sample
Nu
mb
er
Clu
ste
rs
RCS
0
0.5
1
1.5
2
2.5
0 250 500 750 1000
Sample
MQ
Dot (Random)
0
0.2
0.4
0.6
0.8
1
1.2
1.4
1.6
1.8
0 10 20 30 40
Number of Clusters
MQ
Va
lue
Dot (Bunch)
0
0.2
0.4
0.6
0.8
1
1.2
1.4
1.6
1.8
0 10 20 30 40
Number of Clusters
MQ
Va
lue
Dot
0
5
10
15
20
25
30
35
40
45
0 250 500 750 1000
Sample
Nu
mb
er
Clu
ste
rs
Dot
0
0.2
0.4
0.6
0.8
1
1.2
1.4
1.6
1.8
0 250 500 750 1000
Sample
MQ
RC
SD
ot
Random
Bunch

22Drexel University Software Engineering Research Group (SERG)http://serg.mcs.drexel.edu
Bunch
0
25
50
75
100
125
0 250 500 750 1000
Sample
Nu
mb
er
Clu
ste
rs
Clustering a SystemMany Times (2)…
Swing (Random)
0
1
2
3
4
5
6
7
0 100 200 300 400
Number of Clusters
MQ
Val
ue
Swing (Bunch)
0
1
2
3
4
5
6
7
0 100 200 300 400
Number of Clusters
MQ
Va
lue
Swing
0
50
100
150
200
250
300
350
400
450
0 250 500 750 1000
Sample
Nu
mb
er
Clu
ste
rs
Swing
0
1
2
3
4
5
6
7
0 250 500 750 1000
Sample
MQ
Sw
ing
Bunch (Random)
0
0.5
1
1.5
2
2.5
3
3.5
4
4.5
0 25 50 75 100 125
Number of Clusters
MQ
Val
ue
Bunch (Bunch)
0
0.5
1
1.5
2
2.5
3
3.5
4
4.5
0 25 50 75 100 125
Number of Clusters
MQ
Va
lue
Bunch
0
0.5
1
1.5
2
2.5
3
3.5
4
4.5
0 250 500 750 1000
Sample
MQ
Bu
nch
Random
Bunch

23Drexel University Software Engineering Research Group (SERG)http://serg.mcs.drexel.edu
Bunch
0
25
50
75
100
125
0 250 500 750 1000
Sample
Nu
mb
er
Clu
ste
rs
Clustering a SystemMany Times (2)…
Swing (Random)
0
1
2
3
4
5
6
7
0 100 200 300 400
Number of Clusters
MQ
Val
ue
Swing (Bunch)
0
1
2
3
4
5
6
7
0 100 200 300 400
Number of Clusters
MQ
Va
lue
Swing
0
50
100
150
200
250
300
350
400
450
0 250 500 750 1000
Sample
Nu
mb
er
Clu
ste
rs
Swing
0
1
2
3
4
5
6
7
0 250 500 750 1000
Sample
MQ
Sw
ing
Bunch (Random)
0
0.5
1
1.5
2
2.5
3
3.5
4
4.5
0 25 50 75 100 125
Number of Clusters
MQ
Val
ue
Bunch (Bunch)
0
0.5
1
1.5
2
2.5
3
3.5
4
4.5
0 25 50 75 100 125
Number of Clusters
MQ
Va
lue
Bunch
0
0.5
1
1.5
2
2.5
3
3.5
4
4.5
0 250 500 750 1000
Sample
MQ
Bu
nch
Random
Bunch
Observations
•As the number of clusters increasedin the random samples, MQ decreased
•Bunch converged to a consistent“family” of solutions, no matter wherethe random starting point was generated
•Some solutions were multi-modal•Random solutions were consistentlyworse than Bunch’s solutions.
Observations
•As the number of clusters increasedin the random samples, MQ decreased
•Bunch converged to a consistent“family” of solutions, no matter wherethe random starting point was generated
•Some solutions were multi-modal•Random solutions were consistentlyworse than Bunch’s solutions.

24Drexel University Software Engineering Research Group (SERG)http://serg.mcs.drexel.edu
Example - Detailed Results: Bunch System
MQ For Random Clusters (4-8)
0
0.5
1
1.5
2
2.5
3
3.5
4
4.5
0 250 500 750 1000
Sample
MQ
MQ For Random Clusters (11-16)
0
0.5
1
1.5
2
2.5
3
3.5
4
4.5
0 250 500 750 1000
Sample
MQ
MQ versus Number of Clusters
0
0.5
1
1.5
2
2.5
3
3.5
4
4.5
0 5 10 15 20
Number of ClustersM
Q
The search spacehas some inherent
structure, as randomclusters constrained
to the area whereBunch converged didnot produce better
MQ values.
77%
23%

25Drexel University Software Engineering Research Group (SERG)http://serg.mcs.drexel.edu
Understanding the Search Space
There are characteristics of Bunch’s clustering algorithms that are interesting: It seems unusual that the clustering algorithms
produce consistent MQ values given the large search space
Other approaches [spectral methods] to solving the clustering problem using Bunch’s MQ have not produced better clustering results
The median clustering level is a good tradeoff between cluster size and number of clusters Harman et al. examined using a target granularity
[GECCO’02] to bias the desired cluster sizes

26Drexel University Software Engineering Research Group (SERG)http://serg.mcs.drexel.edu
Investigating the Search Space
Examined multiple systems of different size: 15 open source systems developed in
C, C++, or Java 13 randomly generated graphs with
different properties that we wanted to investigate
We clustered each MDG 500 times and examinedthe clustering data to gain some insight into thesearch space.

27Drexel University Software Engineering Research Group (SERG)http://serg.mcs.drexel.edu
45
50
55
60
65
70
L1 L2
L3 L4
L5 L6
L7 Median
Example: Median Clustering Level
Cu
mu
lati
ve M
Q
45
50
55
60
65
70
75
L1 L2
L3 L4
L5 L6
L7 Median Cu
mu
lati
ve M
Q
swing Kerbos v.5

28Drexel University Software Engineering Research Group (SERG)http://serg.mcs.drexel.edu
0
0.5
1
1.5
2
2.5
3
3.5
4
4.5
L1 L2
L3 Median
2
3
4
5
6
7
8
9
L1 L2L3 L4Median
Example: Median Clustering Level
MQ
MQ
telnetd php
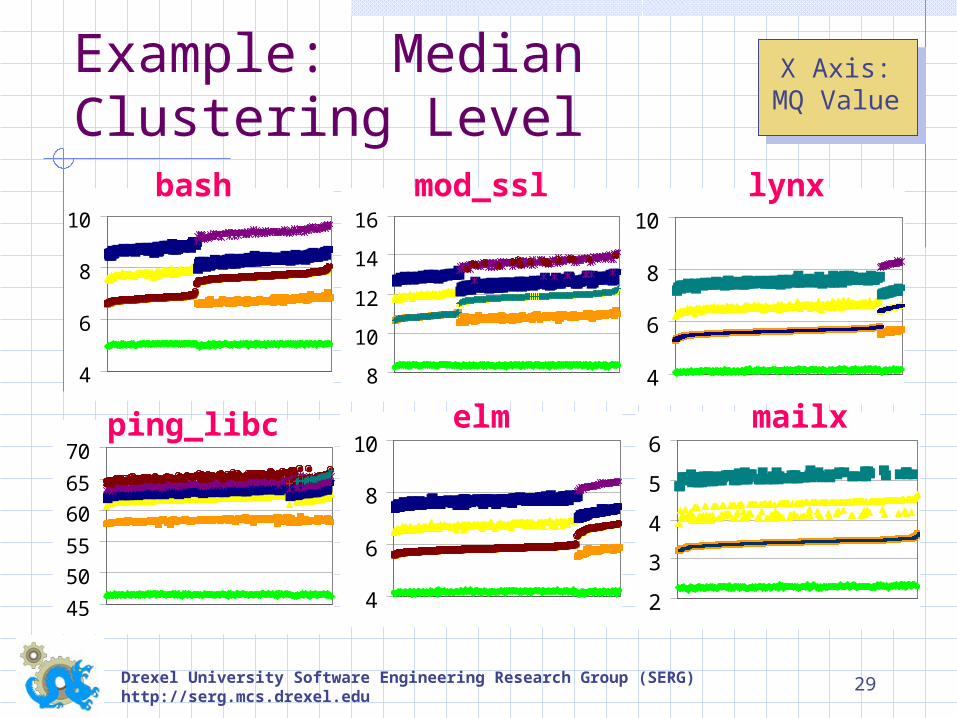
29Drexel University Software Engineering Research Group (SERG)http://serg.mcs.drexel.edu
8
10
12
14
16
4
6
8
10
Example: Median Clustering Level
bash mod_ssl
45
50
55
60
65
70
4
6
8
10ping_libc elm
4
6
8
10
2
3
4
5
6
lynx
mailx
X Axis:MQ Value

30Drexel University Software Engineering Research Group (SERG)http://serg.mcs.drexel.edu
2
4
6
8
10
18
23
28
33
Example: Median Clustering Level – Random Bipartite Graphs
bip-100-1
2
4
6
8bip-100-2 bip-100-5
2
4
6
8
10
2
3
4
5bip-100-25 bip-100-75
X Axis:MQ Value

31Drexel University Software Engineering Research Group (SERG)http://serg.mcs.drexel.edu
2
3
4
5
2
4
6
8
8
13
18
18
23
28
33
38
18
23
28
33
38
Example: Median Clustering Level – Random Graphs
rnd-100-1 rnd-100-2 rnd-100-5
rnd-100-25 rnd-100-75
X Axis:MQ Value

32Drexel University Software Engineering Research Group (SERG)http://serg.mcs.drexel.edu
10
15
20
25
20
30
40
50
Example: Median Clustering Level – Random “Circle” Graphs
circle-50
35
45
55
65
75
circle-100
circle-150
X Axis:MQ Value

33Drexel University Software Engineering Research Group (SERG)http://serg.mcs.drexel.edu
4
4.1
4.2
4.3
25 35 45
2.22.252.3
2.352.4
5 10 15
4.454.5
4.554.6
4.65
10 15 20
MQ versus #Clusters
44.845
45.245.445.6
150 160 170 180
4646.246.446.646.8
47
170 180 1900
1
2
3
0 5 10
krb5 swing telnetd php
4.94.95
55.055.1
5.15
25 35 45
8.2
8.3
8.4
8.5
40 45 50
4646.246.446.646.8
47
170 180 190
4.054.1
4.154.2
4.254.3
20 30 40
bash mod_ssl ping_libc elm
lynx mailx
X Axis: #ClustersY Axis: MQ Value

34Drexel University Software Engineering Research Group (SERG)http://serg.mcs.drexel.edu
11.812
12.212.412.6
20 25 30
23.5
24
24.5
25
40 45 50
36
36.5
37
37.5
65 70 75
25.67
25.67
25.67
25.67
30 31 32
10
10.5
11
11.5
35 40 45 50
3.53.63.73.83.9
30 40 50
1.6
1.7
1.8
1.9
30 35 40
4.74.75
4.84.85
4.94.95
10 12 14
3.853.9
3.954
4.05
38 40 42
1.77
1.78
1.79
1.8
20 30 40
19.3819.4
19.4219.4419.46
20 25 30
MQ versus #Clustersbip-100-1 bip-100-5 bip-100-25 bip-100-75
rnd-100-1 rnd-100-5 rnd-100-25 rnd-100-75
cir-50 cir-100
cir-150
X Axis: #ClustersY Axis: MQ Value

35Drexel University Software Engineering Research Group (SERG)http://serg.mcs.drexel.edu
1450
1500
1550
1600
0 200 400
0
100
200
300
0 100 200
900
920940
960
980
100 150 200
900
920940
960
980
100 150 200
2260
2280
2300
2320
500 550 600
125
130135
140
145
0 50 100
2260
2280
2300
2320
500 550 6001180119012001210122012301240
250 300 350
0
20
40
60
80
10 30 50
125
130
135
140
145
0 50 100
Internal- versus External Edges
krb5 swing telnetd php
bash mod_ssl ping_libc elm
lynx mailx
X Axis: External EdgesY Axis: Internal Edges

36Drexel University Software Engineering Research Group (SERG)http://serg.mcs.drexel.edu20212223242526
20 25 30
42
44
46
48
50
50 55 60
66
68
70
72
74
75 80 85
0
5
10
15
0 50
175
180
185
190
195
0 50 100
1080
1100
1120
1140
0 100 200
3200
3300
3400
3500
3600
0 500
0
5
10
15
0 20 40
130132134136138140142
85 90 95 100
985
990
995
1000
100 110 120
2250
2300
2350
2400
2450
0 200 400
Internal- versus External Edgesbip-100-1 bip-100-5 bip-100-25 bip-100-75
rnd-100-1 rnd-100-5 rnd-100-25 rnd-100-75
cir-50 cir-100
cir-150
X Axis: External EdgesY Axis: Internal Edges

37Drexel University Software Engineering Research Group (SERG)http://serg.mcs.drexel.edu
Real SystemsSimilarity of Clustering Results
0
10
20
30
40
50
60
70
80
90
100
telnetd
crond
mailx
joe
dhcpd
php
elm
inn
bash
bunch
mod_ssl
lynx
swing
ping_libc
krb5
System
Pe
rce
nta
ge
IntraEdge AgreementIsomporphic Nodes

38Drexel University Software Engineering Research Group (SERG)http://serg.mcs.drexel.edu
Random SystemsSimilarity of Clustering Results
0
10
20
30
40
50
60
70
80
90
100
bip-100-1
bip-100-2
bip-100-5
bip-100-25
bip-100-75
rnd-100-1
rnd-100-2
rnd-100-5
rnd-100-25
rnd-100-75
circle-50
circle-100
circle-150
System
Pe
rce
nta
ge
IntraEdge AgreementIsomporphic Nodes

39Drexel University Software Engineering Research Group (SERG)http://serg.mcs.drexel.edu
Real SystemsSimilarity of Clustering Results
0
10
20
30
40
50
60
70
80
90
100
telnetd
crond
mailx
joe
dhcpd
php
elm
inn
bash
bunch
mod_ssl
lynx
swing
ping_libc
krb5
System
Pe
rce
nta
ge
IntraEdge Agreement
40Drexel University Software Engineering Research Group (SERG)http://serg.mcs.drexel.edu
Random SystemsSimilarity of Clustering Results
0
10
20
30
40
50
60
70
80
90
100
bip-100-1
bip-100-2
bip-100-5
bip-100-25
bip-100-75
rnd-100-1
rnd-100-2
rnd-100-5
rnd-100-25
rnd-100-75
circle-50
circle-100
circle-150
System
Pe
rce
nta
ge
IntraEdge Agreement

41Drexel University Software Engineering Research Group (SERG)http://serg.mcs.drexel.edu
What we Learned From Studying the Search Landscape
Not all modules are “equal” - Some modules: Are connected to many other modules Are connected to few other modules Have a large fan-in Have a large fan-out Are uniformly connected to other system
components Are not uniformly connected to other system
componentsSome modules may have a more “natural” home thanother subsystems with respect to their assigned cluster

42Drexel University Software Engineering Research Group (SERG)http://serg.mcs.drexel.edu
What we Learned From Studying the Search Landscape
Bunch tends to converge to a consistent solution with respect to MQ There is a very low probability of finding one
of these partitions by random selection The partitions found by Bunch are a very
small subset of the overall search landscape
The degree of isomorphism in the clustering results was larger than expected

43Drexel University Software Engineering Research Group (SERG)http://serg.mcs.drexel.edu
What we Learned From Studying the Search Landscape
When examining the median level of the clustering hierarchy we observed that all systems tend to converge to at most 2 levels
The systems that we studied range from under 100 modules to several thousand modules
The number of levels in the clustering hierarchy is bounded by O(log2N)
We expect that studying systems with several hundred thousand modules would produce results where the median level converges to more than 2 levels.
We observed this in very sparse graphs (e.g., rnd-100-1, and bip-100-1)
44Drexel University Software Engineering Research Group (SERG)http://serg.mcs.drexel.edu
Conclusions (1)
Understanding the search landscape is important A single run of Bunch is helpful, but it
does not highlight modules/classes that tend to drift between clusters
Analysis of many Bunch runs helps build a mental model of the search landscape

45Drexel University Software Engineering Research Group (SERG)http://serg.mcs.drexel.edu
Conclusions (2)
A best practice for program understanding Cluster a system many times in order to
understand the search landscape Identify and separate omnipresent, library and
supplier modules Identify that tend to drift between many
subsystems Assign to other clusters manually, or influence the
clustering algorithm by adjusting the edge weights Bunch supports manual and semi-automatic
clustering features to help with this type of analysis

46Drexel University Software Engineering Research Group (SERG)http://serg.mcs.drexel.edu
Questions
Special Thanks To: AT&T Research Sun Microsystems DARPA NSF US Army
SEMINAL Group
Top Related