


Languages
Pages
Legal


1
Pierre Y. Julien
Reservoir Sedimentation
Department of Civil EngineeringColorado State University
Fort Collins, Colorado
Short CourseGadjah Mada UniversityYogyakarta, Indonesia
July 21, 2009
ObjectivesReservoir Sedimentation and Socio-Environmental Impacts:
1. Steep Mountain Channels and Sabo Dams; 2. Reservoir Sedimentation;3. Sediment Removal;4. Locks and Dams and Estuary Barrages;5. Effects Downstream of Reservoirs;6. Socio-Economic Impact.
1. Steep Mountains and Sabo Dams

2
Upper Basin: high-elevation snowpack; snowmelt runoff
Diverse Topography: highest mountains in Colorado – Elbert, Massive, Harvard, etc.
Lesser Himalayan Area

3
Tala HE Project
4
2. Reservoir Sedimentation
Wonogiri survey paths

5
Bed Profile - 1988
250
270
290
310
330
350
370
0 10 20 30 40 50 60
Distance from Main Dam (KM)
Elev
atio
n (m
)
OGL,1967SURVEYED,1988SIMULATED,1988
Reservoir storage capacity of Sempor Dam
30
35
40
45
50
55
60
65
70
75
0 5 10 15 20 25 30 35 40 45 50
Volume (million m3)
Ele
vatio
n (m
)
197719811982198419942004
Volume (million m3)
Elev
atio
n (m
)
Imha reservoir

6
Barrier island loss due to hurricane Katrina, Mississippi RiverBarrier island loss due to hurricane Katrina, Mississippi River
July 2005July 2005
September 2005September 2005

7
Fuensanta reservoir of the river Segura in Spain
Bengal and Indus

8
3. Mechanical Removal and Sediment Flushing
Impact of Sedimentation

9
Sediment Flushing

10
CSU Hydraulics Laboratory

11
CASC2D-SED Modeling 2004
4. Locks and Dams and Estuary Barrages
CASC2D-SED Modeling 2004
L&D No. 3
Locks and Dams

12
CASC2D-SED Modeling 2004
CASC2D-SED Modeling 2004
Sedimentation Problems Can Be Solved
CASC2D-SED Modeling 2004
Nakdong River and NREB Unsteady modeling for the upstream of NREB

13
CASC2D-SED Modeling 2004
Nakdong River Estuary Barrage
CASC2D-SED Modeling 2004
Quasi-steady state model
Upstream water level
Tide level
CASC2D-SED Modeling 2004
Quasi-steady state model (Model validation 2003 – with dredging)
4.8% (-0.32m)
2.9% (0.16m)
32.9% (0.27m)
5.9% (0.52m)
21.2% (0.17m)

14
CASC2D-SED Modeling 2004
5. Effects Downstream of Reservoirs
Hapcheon Re-regulation Dam
0
10
20
30
40
50
60
70
80
90
100
0 10 20 30 40 50 60 70 80 90 100
time (hr)
wat
er d
epth
(m)
Plan view from Main dam to Re-regulation dam
Main Dam
Re-regulation Dam
Main Power Station
Diversion Tunnel
119 m3/s during 3 hr per day
20 m3/s during 24 hr per day
Spillway
0
20
40
60
80
100
120
0 50 100 150 200 250Time ( hour, July 01 2005, 01:00 - July 10 2005, 24:00)
Flow r
ate
(m3 /s
)
Discharge at main damDischarge at re- regulation dam

15
Study Reach
Hapcheon Main Dam
Re-regulation Dam
Nakdong River
Study Reach = 45 km
Hapcheon city
Degradation and armouring
40 km
37
39
41
43
45
47
49
0 100 200 300 400 500 600
width (m)
bed
elev
atio
n (m
)
19832003
1 0 1 Kilometers
N
Sub-reach 1
Sub-reach 2
Sub-reach 3
Variation of Non-vegetated Active Channel Planform
1982
1993
2004

16
Variation of Non-vegetatedActive Channel Width
0
100
200
300
400
500
600
700
051015202530354045Distance from the confluence with the Nakdong River (km )
Active channel width (m)
1982199320041982_avg.1993_avg.2004 avg.
River changes below Hapcheon dam
2004
2007
1983
0.1
1
10
100
051015202530354045
Distance from the confluence (km)
Part
icle
siz
e, d
m (m
m)
198319932003
Median Bed Material Size (d50) along the study reach
Sub-reach 1 Sub-reach 2 Sub-reach 3

17
CASC2D-SED Modeling 2004
6. Socio-Economic Impacts: Case Study in Haiti
Example: Peligre Dam in Haiti

18
Demographic Expansion
Lowland Slash and Burn
Subsistence Farming

19
Farming Uphill
Farming Hilltops?
Watershed Deforestation
20
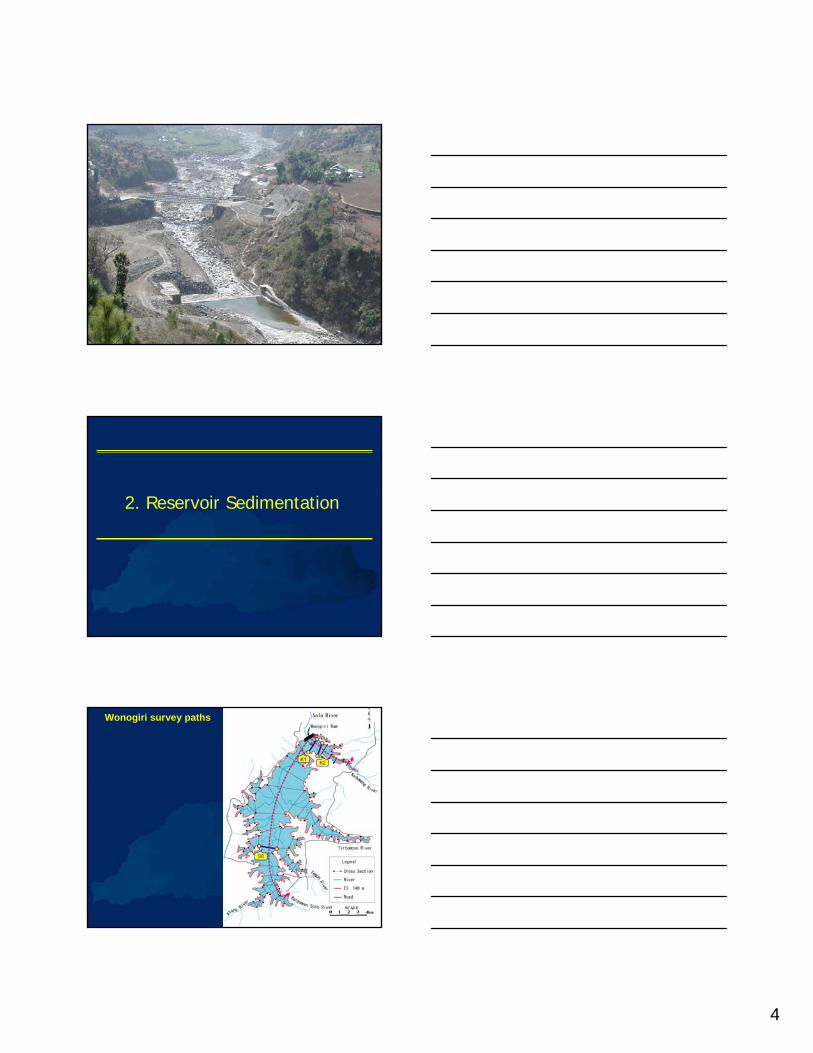
Haiti River
Sedimentation Problems Can Be Important
Peligre Dam (sedimentation)
Hurricane Impact

21
Emergency Spillway Operation
Flood Damages
Citizens Blame their Government
22
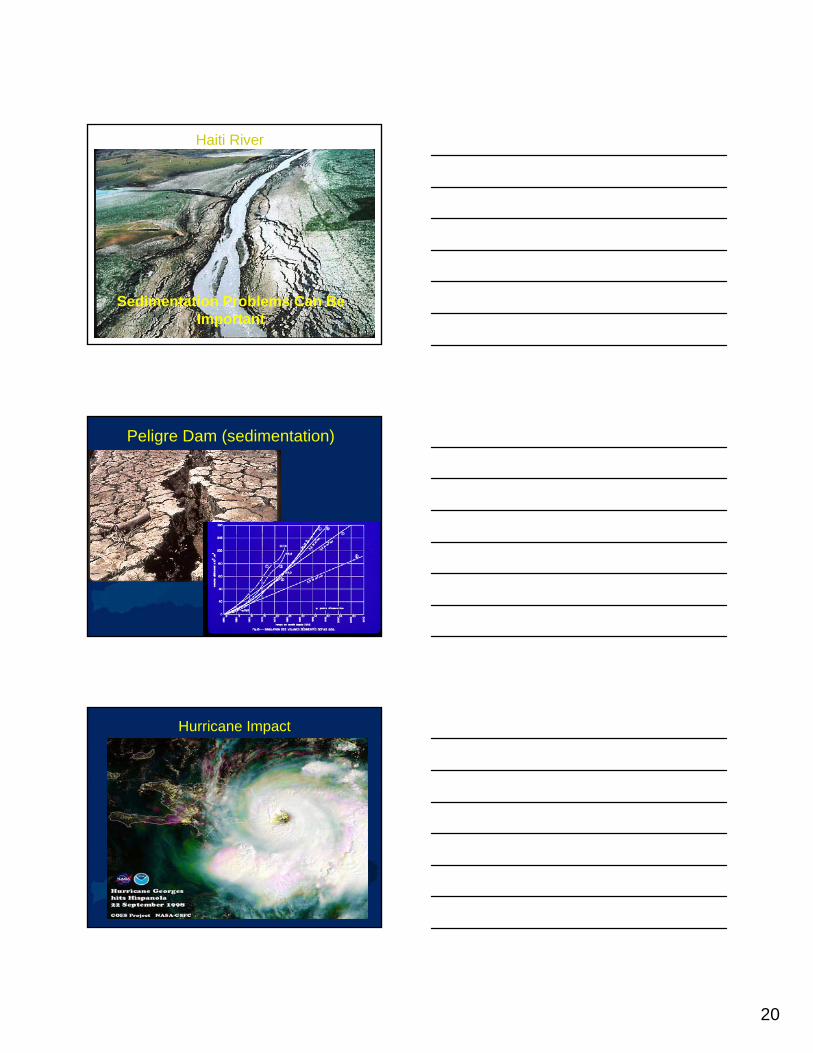
Could this be avoided?
CASC2D-SED Modeling 2004
Acknowledgments
Dr. Phil Combs (USACE-ERDC)Dr. Drew Baird (US Bureau of Reclamation)Dr. Marcel Frenette (U Laval)Dr. Sang-Kil Park ( PNU)Dr. Jose Luis Lopez (UCV)Dr. Y. Lan and D. Elsner (URS)Dr. Gigi Richard (Mesa State College)Dr. Un Ji (MJU)Dr. Z.Y. Wang (IRTCES)Dr. Chris Thornton (CSU – Hydraulics Lab.)Dr. Claudia LeonDr. Young Ho Shin (K-Water)
CASC2D-SED Modeling 2004
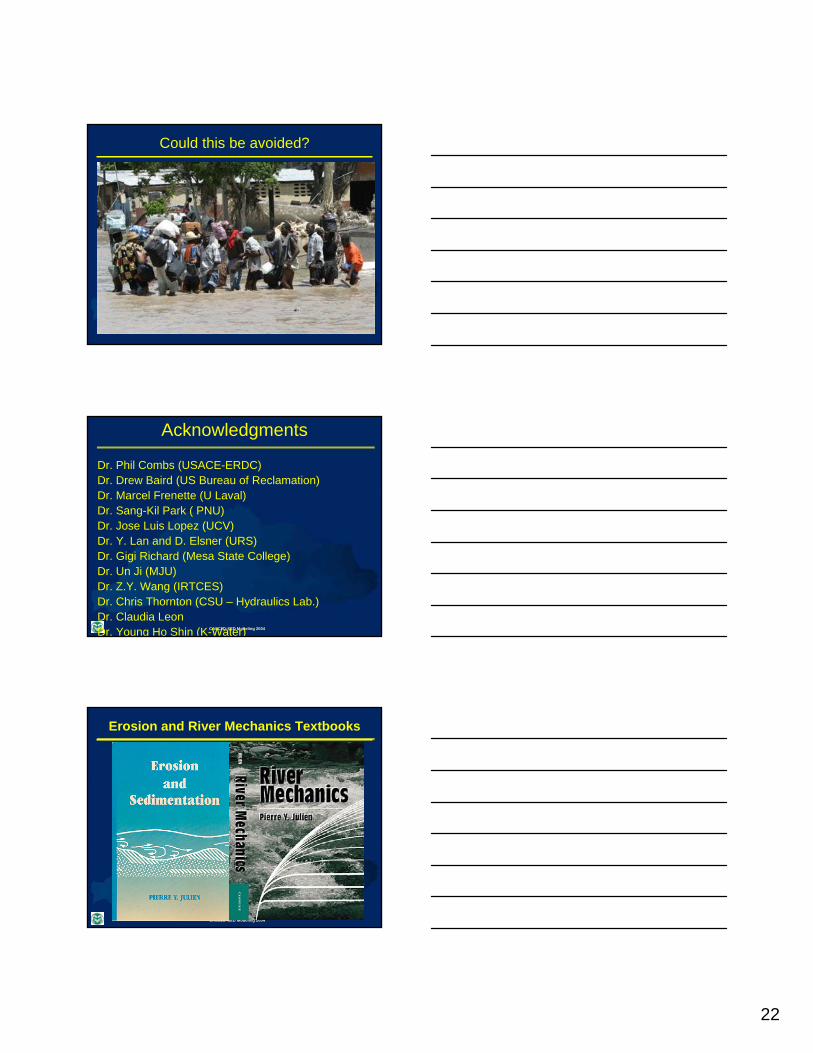
Erosion and River Mechanics Textbooks
Top Related