


Languages
Pages
Legal

1
SEXUAL INTERCOURSE TREND OF TURKISH ADOLESCENTS
Dagdeviren N., Set T., Akturk Z
Trakya University Faculty of Medicine Department of Family Medicine, Edirne TURKEY
[email protected] http://ailehekimligi.trakya.edu.tr
2
Background
• Mean age of first sexual intercourse is decreasing
• Number of sexual partners are increasing
• Unsafe sexual behaviours are becoming more common
Trends in the prevalence of sexual behaviors, youth risk behavior survey. 2005. http://www.cdc.gov/yrbss.
Oksuz E, Malhan S. Socioeconomic factors and health risk behaviors among university students in Turkey: questionnaire study. Croat Med J 2005; 46(1):66-73.
3
Purpose
• To investigate the trends of sexual behaviour of students applying for education at Trakya University
4
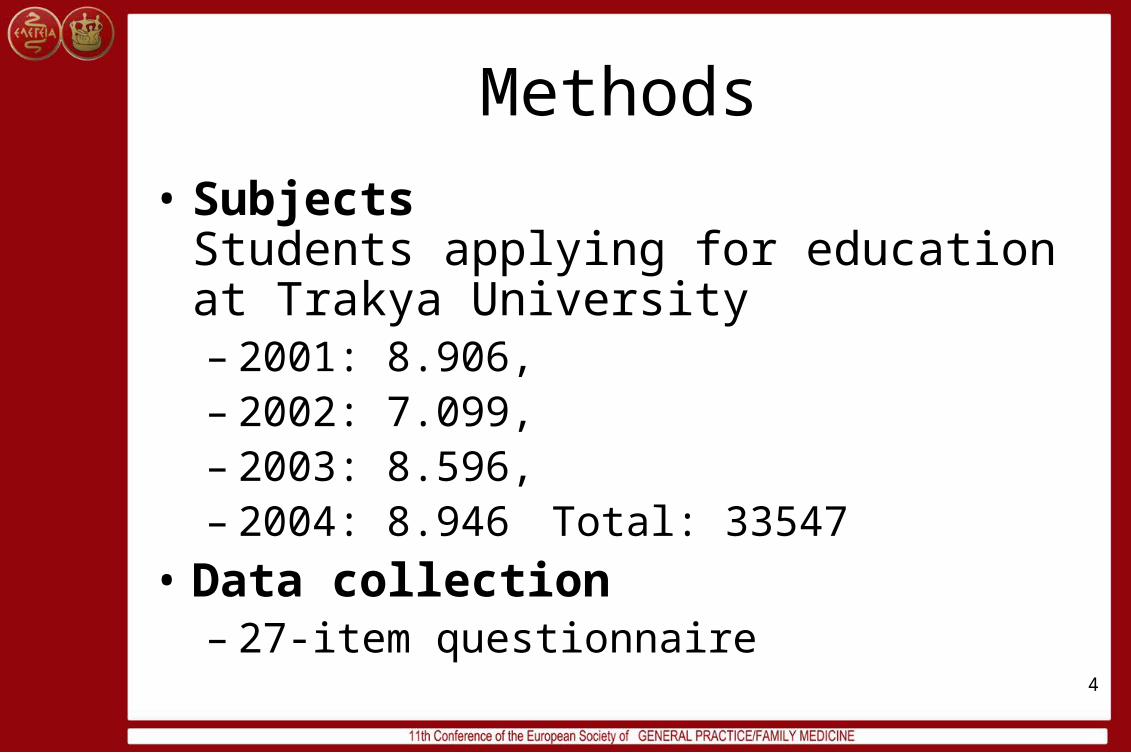
Methods
• SubjectsStudents applying for education at Trakya University– 2001: 8.906,– 2002: 7.099, – 2003: 8.596, – 2004: 8.946 Total: 33547
• Data collection– 27-item questionnaire
5
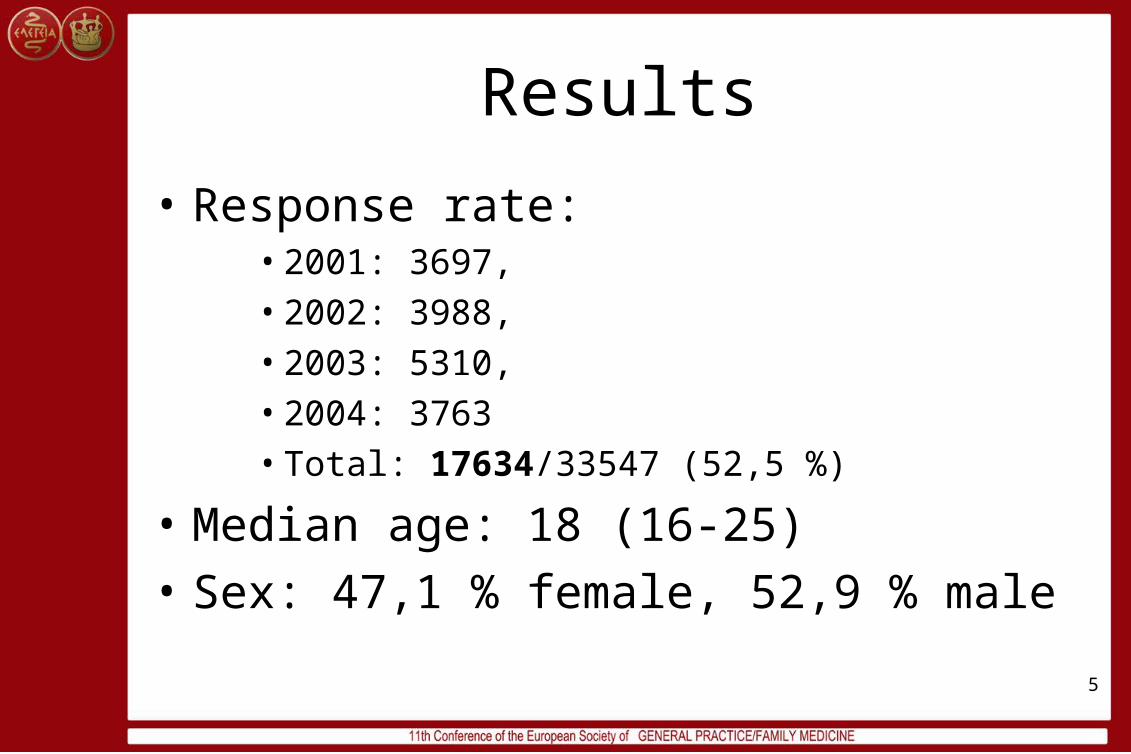
Results
• Response rate:• 2001: 3697,
• 2002: 3988,
• 2003: 5310,
• 2004: 3763
• Total: 17634/33547 (52,5 %)
• Median age: 18 (16-25)
• Sex: 47,1 % female, 52,9 % male

6
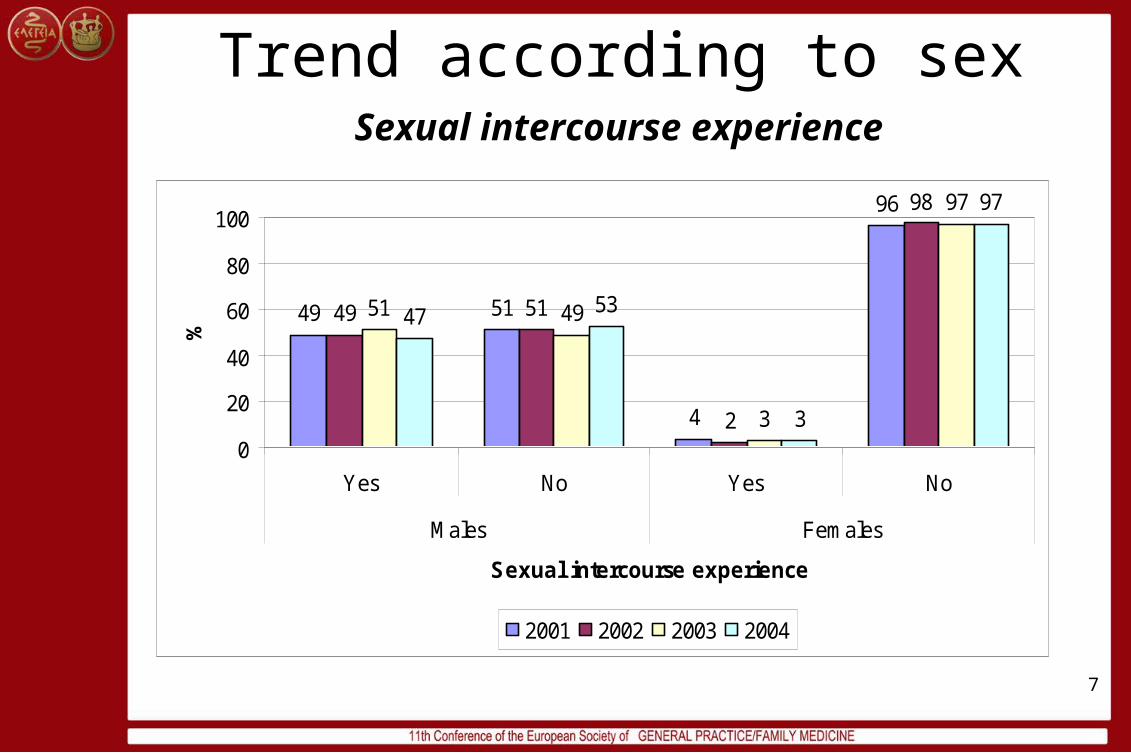
Trend according to sexSexual intercourse experience
2001 2002 2003 2004 Chi square, pMale Yes 831 953 1418 872 9,45; 0,024
% 48,94 49,28 51,06 46,48No 867 981 1359 1004
% 51,06 50,72 48,94 53,52Female Yes 74 36 74 52 11,60; 0,009
% 4,26 2,23 3,09 3,01No 1662 1577 2317 1677
% 95,74 97,77 96,91 96,99
Study year
7
49 51
4
96
49 51
2
98
51 49
3
97
47 53
3
97
0
20
40
60
80
100
Yes No Yes No
Males Females
Sexual intercourse experience
%
2001 2002 2003 2004
Trend according to sexSexual intercourse experience
8
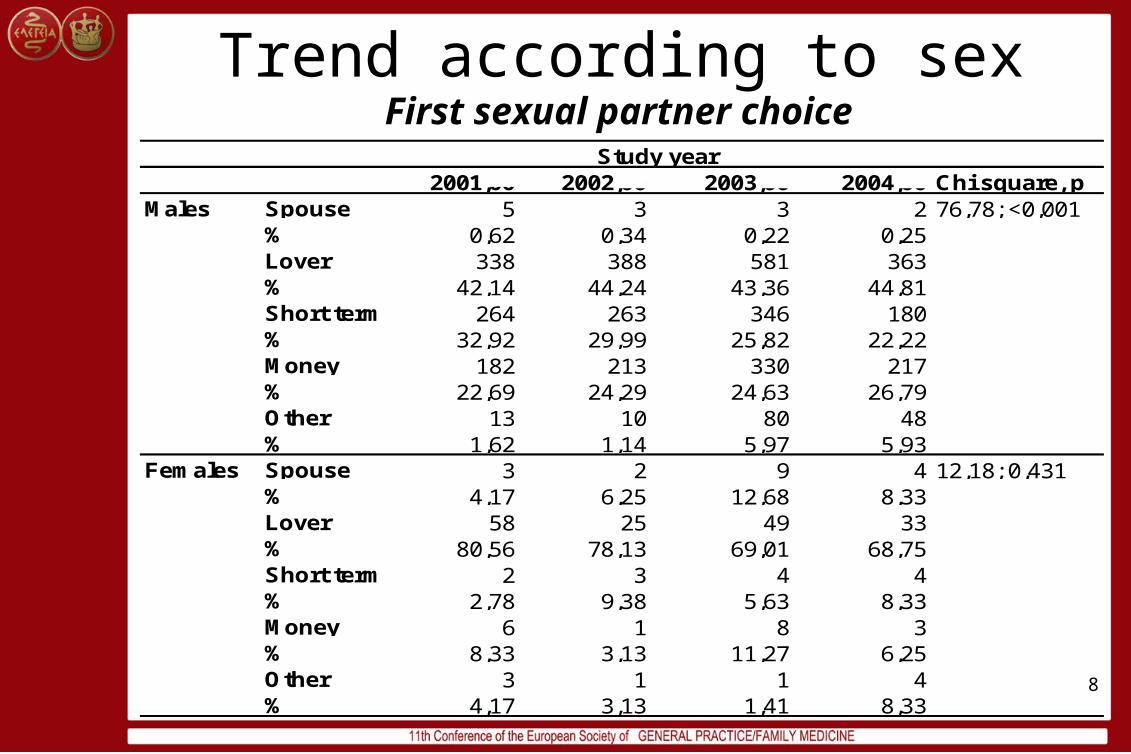
Trend according to sex
2001,00 2002,00 2003,00 2004,00 Chi square, pMales Spouse 5 3 3 2 76,78; <0,001
% 0,62 0,34 0,22 0,25Lover 338 388 581 363% 42,14 44,24 43,36 44,81Short term 264 263 346 180% 32,92 29,99 25,82 22,22Money 182 213 330 217% 22,69 24,29 24,63 26,79Other 13 10 80 48% 1,62 1,14 5,97 5,93
Females Spouse 3 2 9 4 12,18; 0,431% 4,17 6,25 12,68 8,33Lover 58 25 49 33% 80,56 78,13 69,01 68,75Short term 2 3 4 4% 2,78 9,38 5,63 8,33Money 6 1 8 3% 8,33 3,13 11,27 6,25Other 3 1 1 4% 4,17 3,13 1,41 8,33
Study year
First sexual partner choice
9
0
20
40
60
80
100
Spouse Lover Shortterm
Money Other Spouse Lover Shortterm
Money Other
Males Females
First sexual partner
%
2001 2002 2003 2004
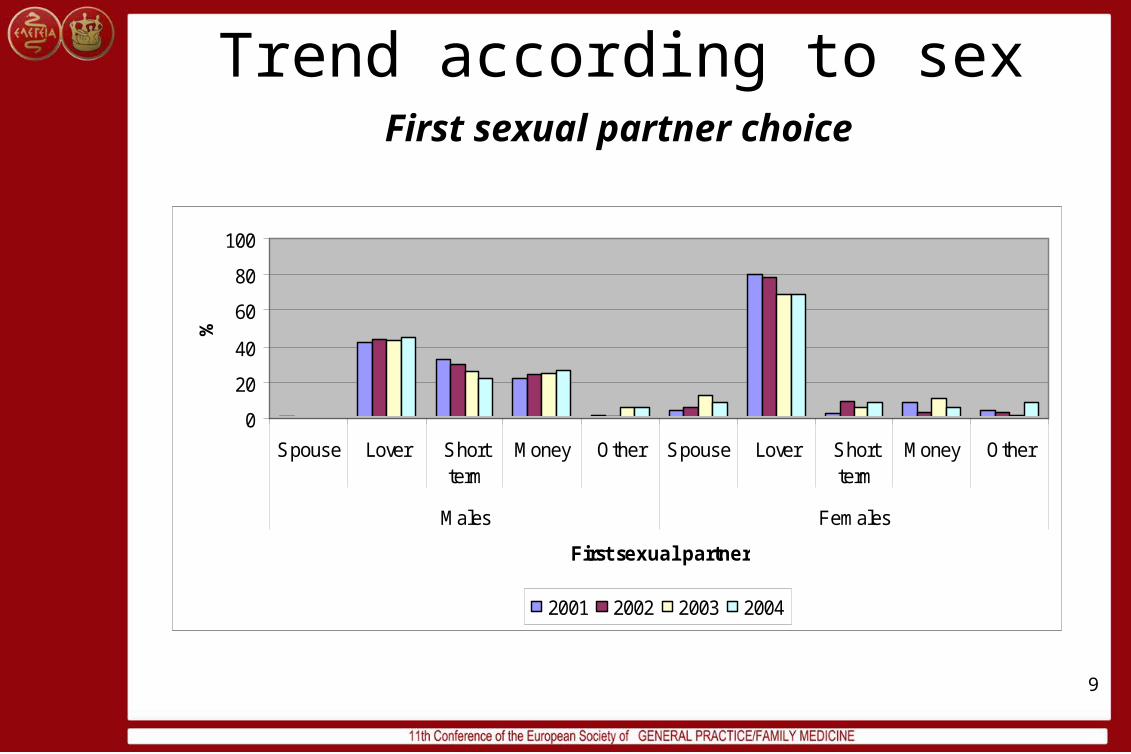
Trend according to sexFirst sexual partner choice

10
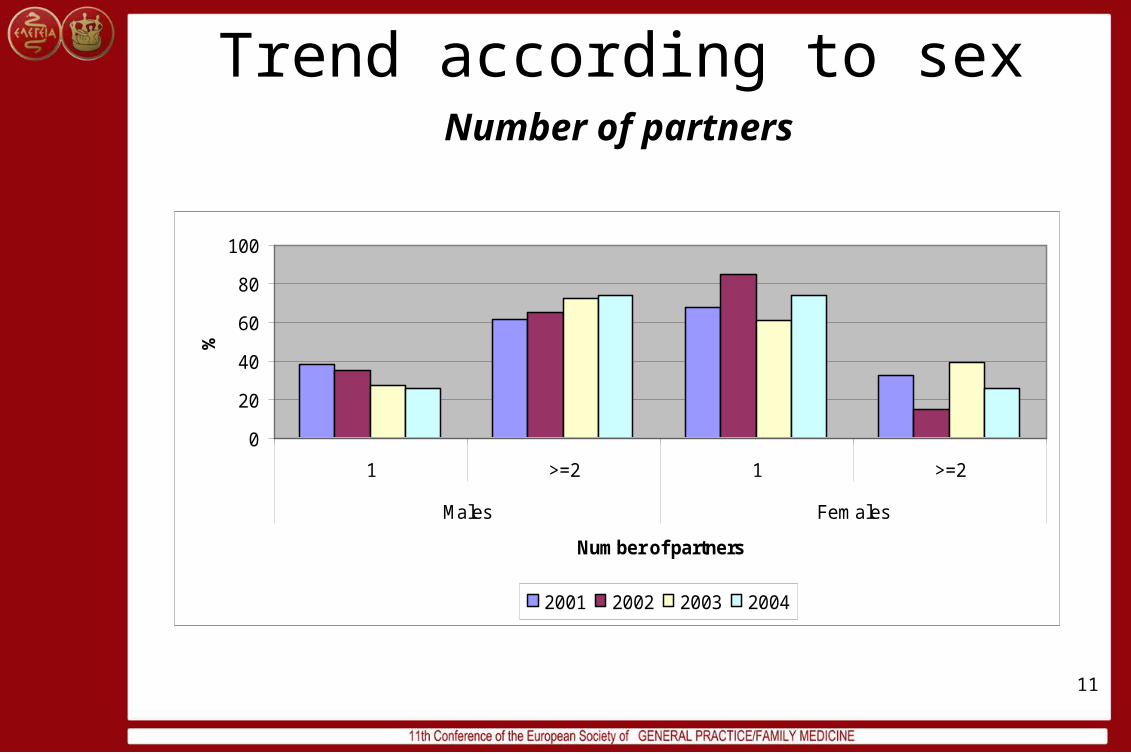
Chi square, pNumber of partners 2001 2002 2003 2004
Males 1 167 151 194 100 21,51; <0,001% 38,13 35,20 27,60 26,25
>=2 271 278 509 281% 61,87 64,80 72,40 73,75
Females 1 27 11 30 23 3,25; 0,355% 67,50 84,62 61,22 74,19
>=2 13 2 19 8% 32,50 15,38 38,78 25,81
Study year
Trend according to sexNumber of partners
11
0
20
40
60
80
100
1 >=2 1 >=2
Males Females
Number of partners
%
2001 2002 2003 2004
Trend according to sexNumber of partners

12
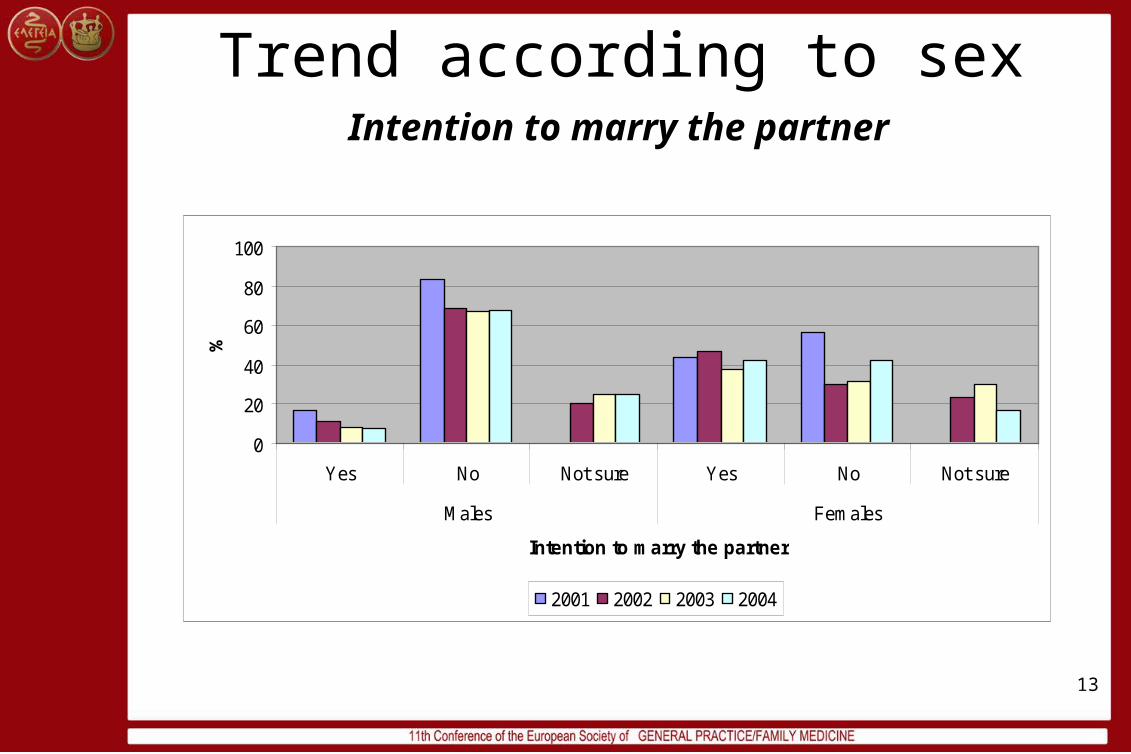
2001 2002 2003 2004 Chi square, pMales Yes 71 94 113 62 148,01; <0,001
% 16,32 11,10 8,49 7,72No 364 580 889 542
% 83,68 68,48 66,79 67,50Not sure 0 173 329 199
% 0,00 20,43 24,72 24,78Females Yes 18 14 25 18 17,82; 0,007
% 43,90 46,67 37,88 41,86No 23 9 21 18
% 56,10 30,00 31,82 41,86Not sure 0 7 20 7
% 0,00 23,33 30,30 16,28
Study year
Trend according to sexIntention to marry the partner
13
0
20
40
60
80
100
Yes No Not sure Yes No Not sure
Males Females
Intention to marry the partner
%
2001 2002 2003 2004
Trend according to sexIntention to marry the partner
14
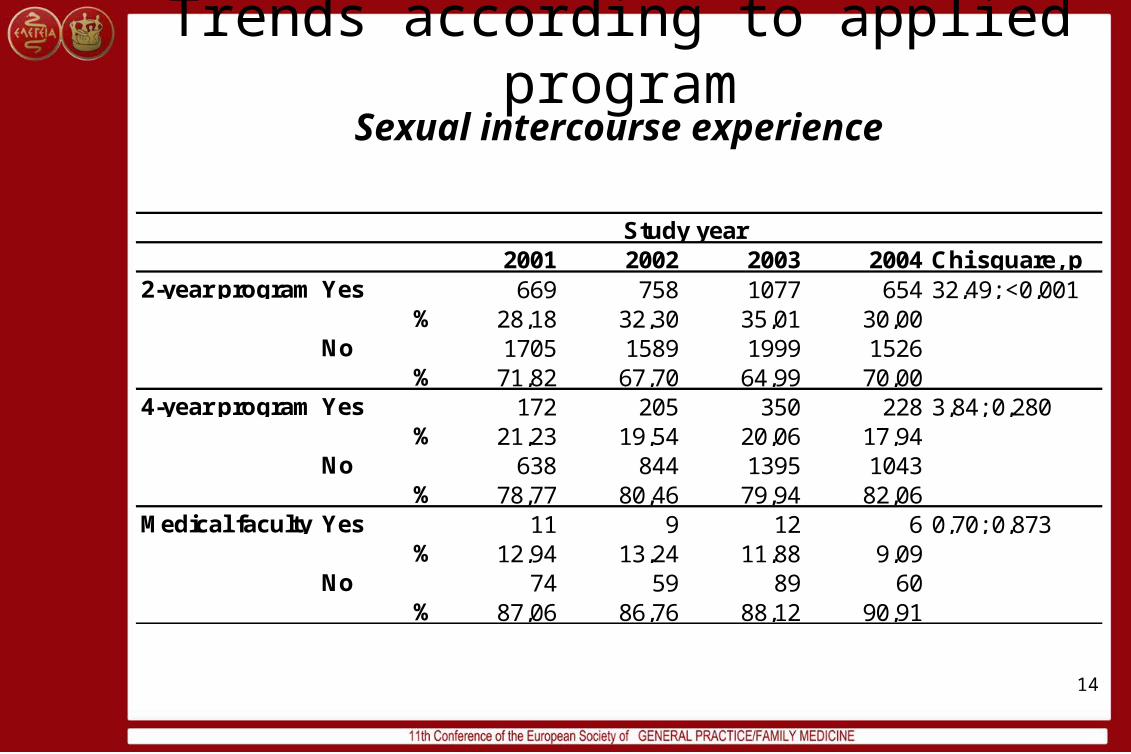
2001 2002 2003 2004 Chi square, p2-year program Yes 669 758 1077 654 32,49; <0,001
% 28,18 32,30 35,01 30,00No 1705 1589 1999 1526
% 71,82 67,70 64,99 70,004-year program Yes 172 205 350 228 3,84; 0,280
% 21,23 19,54 20,06 17,94No 638 844 1395 1043
% 78,77 80,46 79,94 82,06Medical faculty Yes 11 9 12 6 0,70; 0,873
% 12,94 13,24 11,88 9,09No 74 59 89 60
% 87,06 86,76 88,12 90,91
Study year
Trends according to applied programSexual intercourse experience

15
0
20
40
60
80
100
Yes No Yes No Yes No
2-year program 4-year program Medical faculty
Sexual intercourse experience
%
2001 2002 2003 2004
Trends according to applied programSexual intercourse experience
16
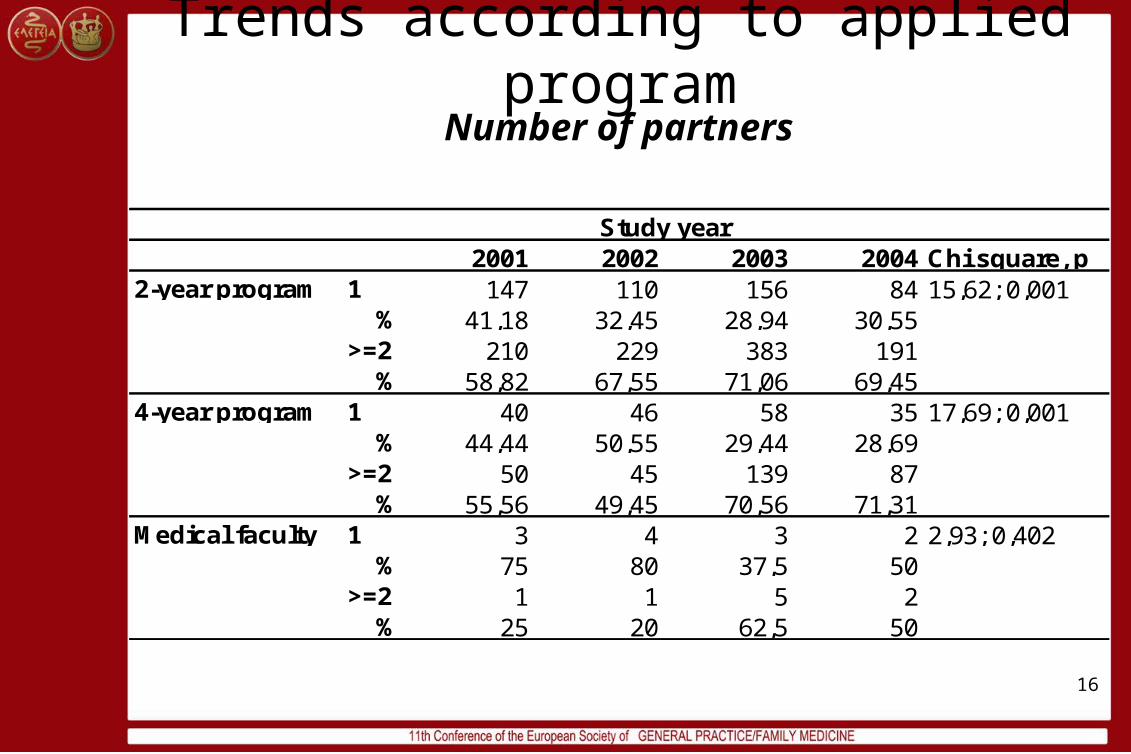
2001 2002 2003 2004 Chi square, p2-year program 1 147 110 156 84 15,62; 0,001
% 41,18 32,45 28,94 30,55>=2 210 229 383 191
% 58,82 67,55 71,06 69,454-year program 1 40 46 58 35 17,69; 0,001
% 44,44 50,55 29,44 28,69>=2 50 45 139 87
% 55,56 49,45 70,56 71,31Medical faculty 1 3 4 3 2 2,93; 0,402
% 75 80 37,5 50>=2 1 1 5 2
% 25 20 62,5 50
Study year
Trends according to applied programNumber of partners

17
0102030405060708090
1 >=2 1 >=2 1 >=2
2-year program 4-year program Medical faculty
Number of partners
%
2001 2002 2003 2004
Trends according to applied programNumber of partners
18
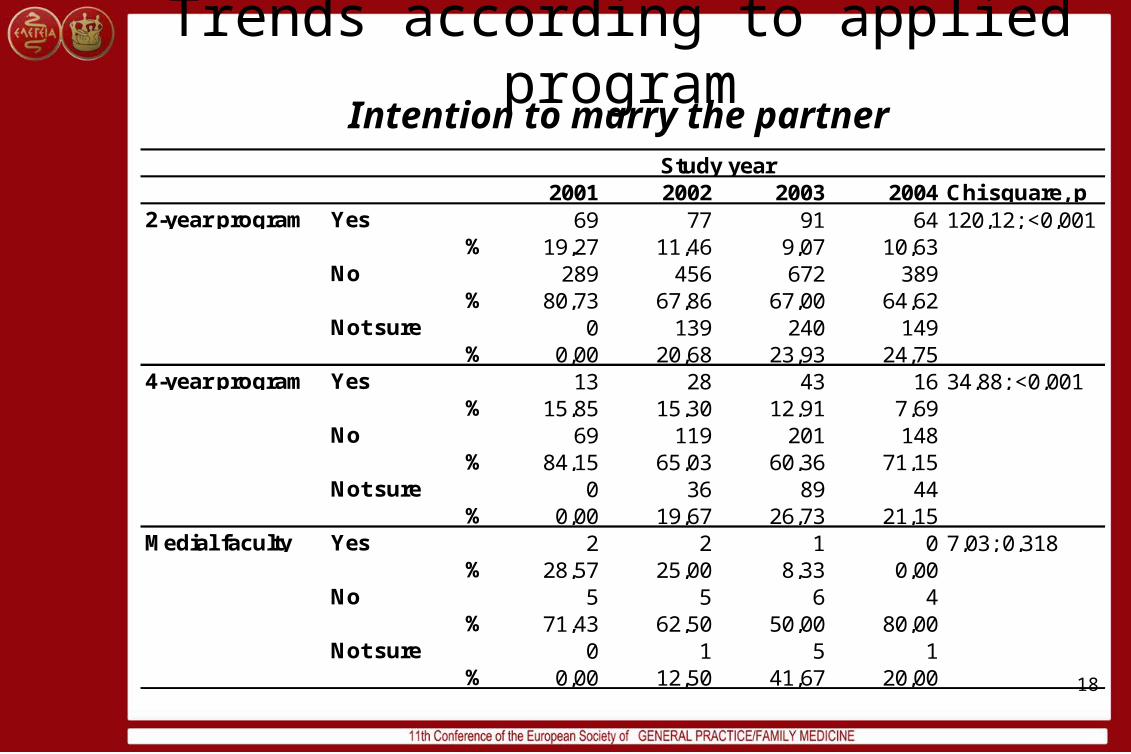
Trends according to applied program
2001 2002 2003 2004 Chi square, p2-year program Yes 69 77 91 64 120,12; <0,001
% 19,27 11,46 9,07 10,63No 289 456 672 389
% 80,73 67,86 67,00 64,62Not sure 0 139 240 149
% 0,00 20,68 23,93 24,754-year program Yes 13 28 43 16 34,88; <0,001
% 15,85 15,30 12,91 7,69No 69 119 201 148
% 84,15 65,03 60,36 71,15Not sure 0 36 89 44
% 0,00 19,67 26,73 21,15Medial faculty Yes 2 2 1 0 7,03; 0,318
% 28,57 25,00 8,33 0,00No 5 5 6 4
% 71,43 62,50 50,00 80,00Not sure 0 1 5 1
% 0,00 12,50 41,67 20,00
Study year
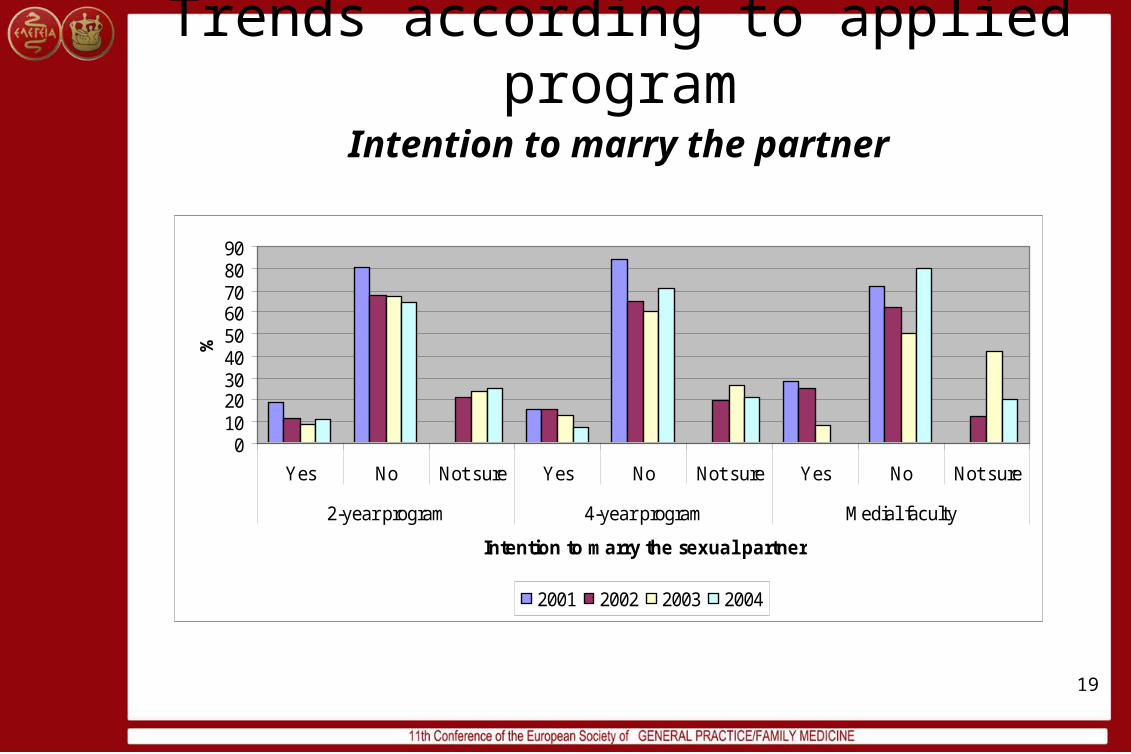
Intention to marry the partner
19
0102030405060708090
Yes No Not sure Yes No Not sure Yes No Not sure
2-year program 4-year program Medial faculty
Intention to marry the sexual partner
%
2001 2002 2003 2004
Intention to marry the partner
Trends according to applied program
20
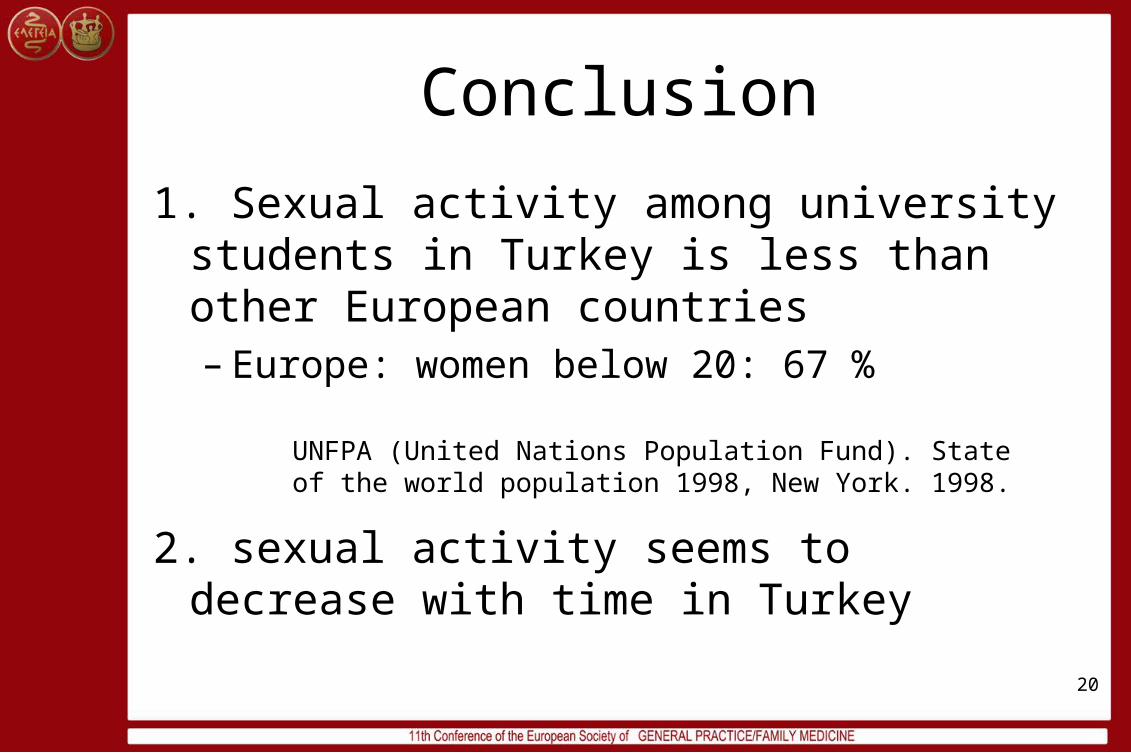
Conclusion
1. Sexual activity among university students in Turkey is less than other European countries– Europe: women below 20: 67 %
2. sexual activity seems to decrease with time in Turkey
UNFPA (United Nations Population Fund). State of the world population 1998, New York. 1998.
21
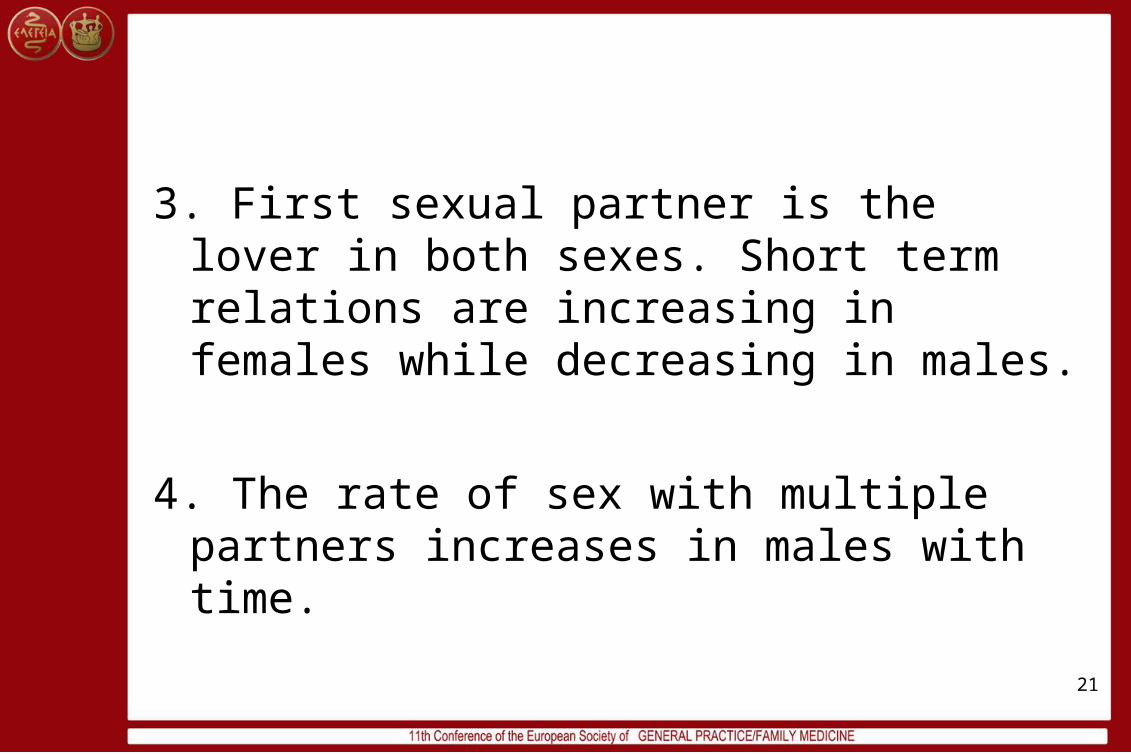
3. First sexual partner is the lover in both sexes. Short term relations are increasing in females while decreasing in males.
4. The rate of sex with multiple partners increases in males with time.
22
5. Intention to marry the partner decreases in both sexes: Turkish youth is adopts a more liberal sexual lifestyle.
6. Studies to monitor the changes in sexual activities should be continued.
Top Related