


Languages
Pages
Legal


1
Presentation at
SULIJuly 12, 2007
Burton Richter
Freeman Spogli Institute of International Studies Senior FellowPaul Pigott Professor in the Physical Sciences Emeritus
Stanford University
Former DirectorStanford Linear Accelerator Center

2
GreenhouseGases
AtmosphereSunlight
Mauna Loa, Hawaii
Source: Dave Keeling and Tim Whorf (Scripps Institution of Oceanography)

Quantitative Greenhouse Effect
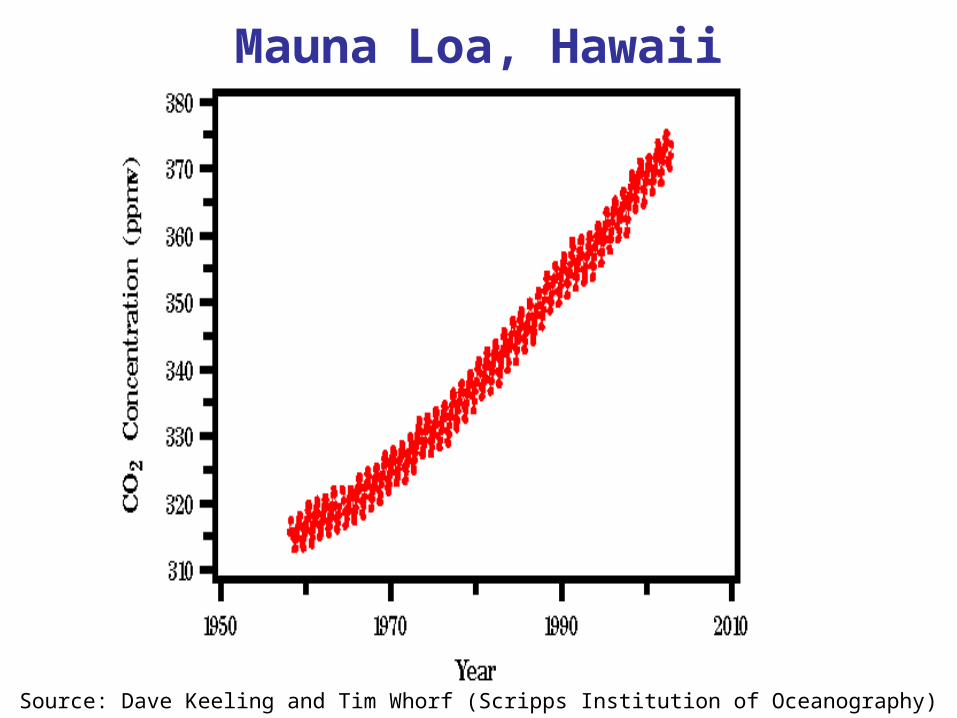
Removal Time and Percent Contribution to Climate Forcing
AgentRough Removal
Time
Approximate Contribution in
2006
Carbon Dioxide >100 years 60%
Methane 10 years 25%
Tropospheric Ozone 50 days 20%
Nitrous Oxide 100 years 5%
Fluorocarbons >1000 years <1%
Sulfate Aerosols 10 days -25%
Black Carbon 10 days +15%


IIASA Projection of Future Energy Demand Scenario A1
(High Growth)

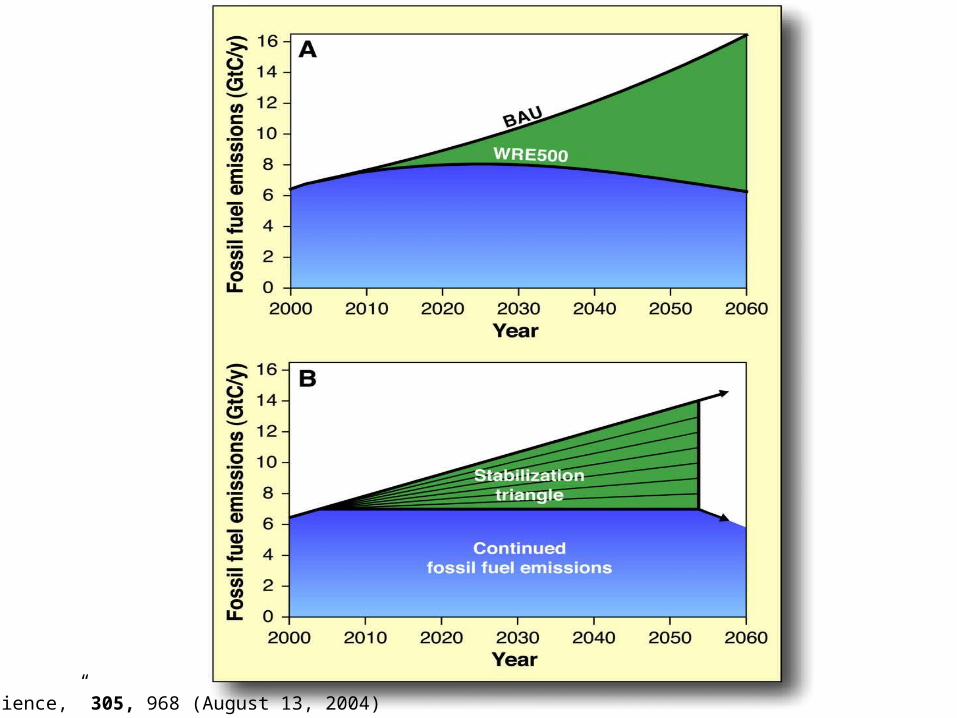
“Science,” 305, 968 (August 13, 2004)
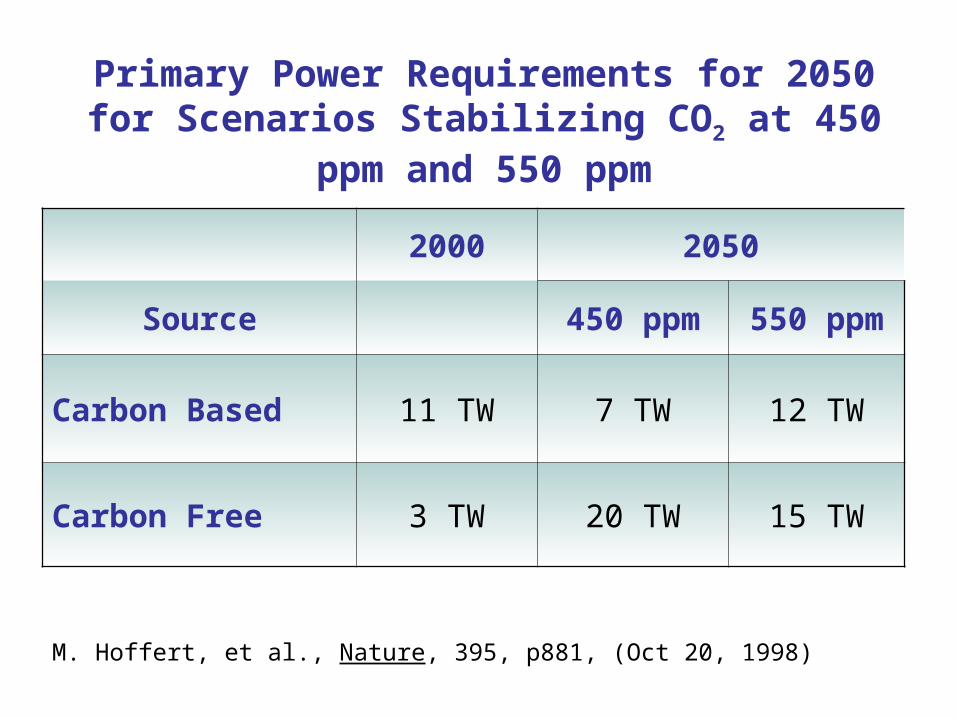
Primary Power Requirements for 2050 for Scenarios Stabilizing CO2 at 450
ppm and 550 ppm
2000 2050
Source 450 ppm 550 ppm
Carbon Based 11 TW 7 TW 12 TW
Carbon Free 3 TW 20 TW 15 TW
M. Hoffert, et al., Nature, 395, p881, (Oct 20, 1998)
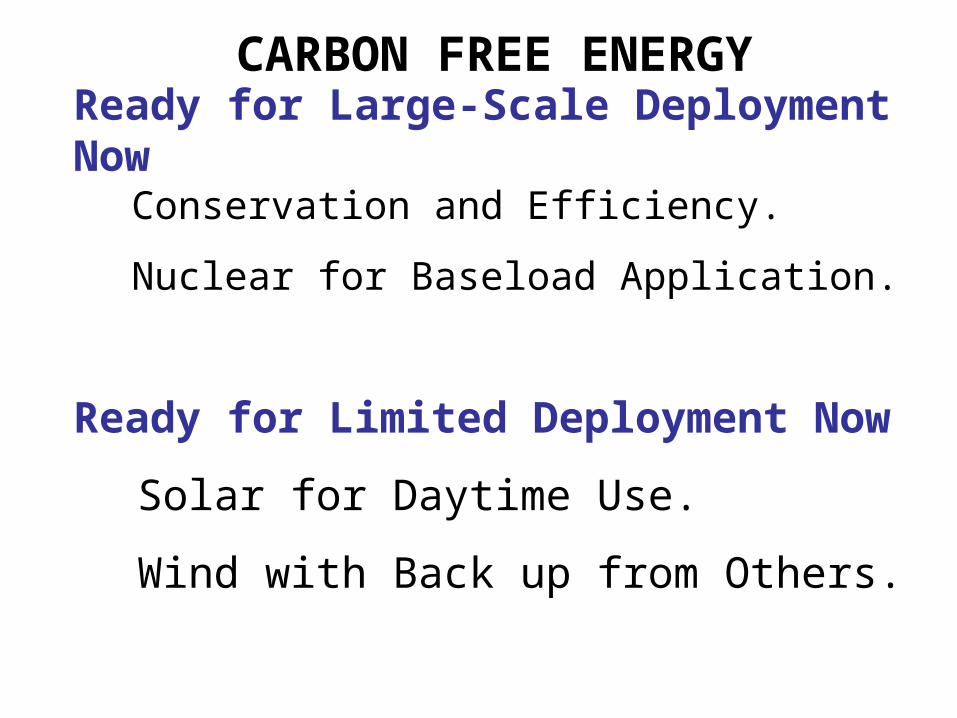
Ready for Large-Scale Deployment Now
Conservation and Efficiency.
Nuclear for Baseload Application.
Ready for Limited Deployment Now
Solar for Daytime Use.
Wind with Back up from Others.
CARBON FREE ENERGY

Energy Intensity and Composite Fuel Price in North America

Power (TW) Required in 2050 Versus Rate of Decline in Energy Intensity
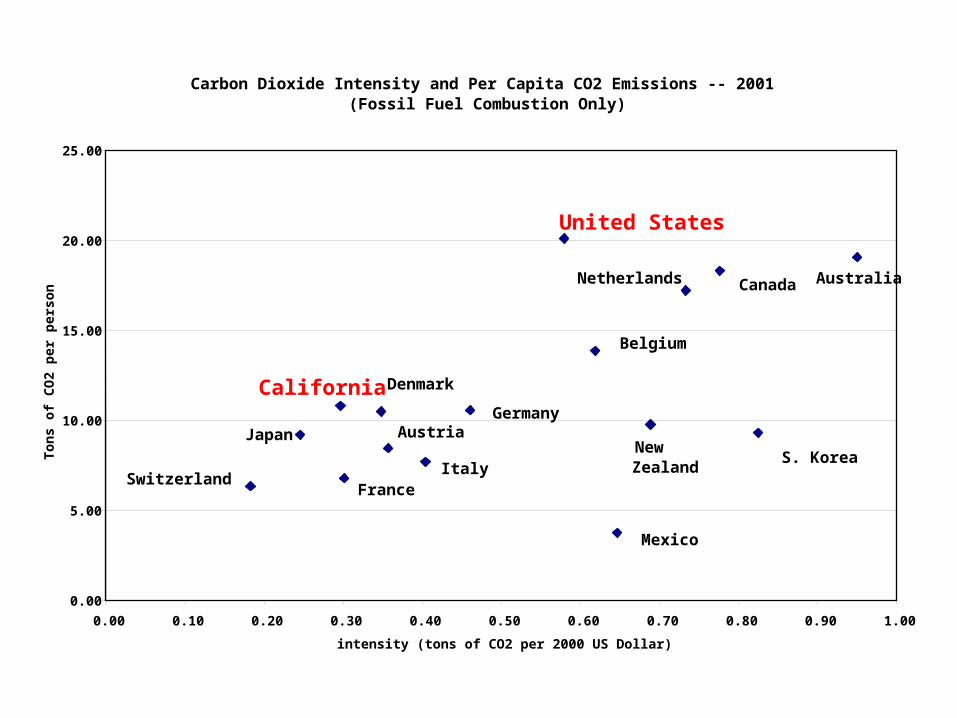
Carbon Dioxide Intensity and Per Capita CO2 Emissions -- 2001 (Fossil Fuel Combustion Only)
0.00
5.00
10.00
15.00
20.00
25.00
0.00 0.10 0.20 0.30 0.40 0.50 0.60 0.70 0.80 0.90 1.00
intensity (tons of CO2 per 2000 US Dollar)
To
ns
of
CO
2 p
er p
erso
n
Canada Australia
S. Korea
California
Mexico
United States
Austria
Belgium
Denmark
France
Germany
Italy
Netherlands
New Zealand
Switzerland
Japan

Per Capita Electricity Sales (not including self-generation)(kWh/person) (2005 to 2008 are forecast data)
0
2,000
4,000
6,000
8,000
10,000
12,000
14,000
19
60
19
62
19
64
19
66
19
68
19
70
19
72
19
74
19
76
19
78
19
80
19
82
19
84
19
86
19
88
19
90
199
2
19
94
19
96
19
98
20
00
20
02
20
04
20
06
20
08
California
United States
?= 4,000kWh/yr
= $400/capita
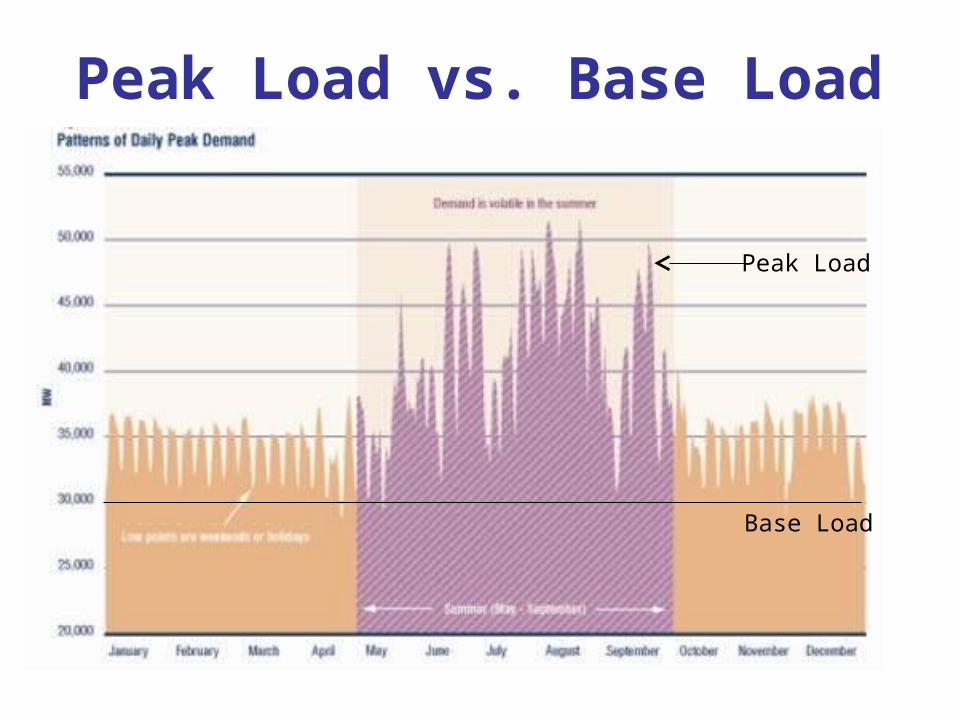
Peak Load vs. Base Load
Peak Load
Base Load

AreaGDP (ppp)
(Billions of U.S. Dollars)
CO2/GDP
Kg/$(ppp)
World 42,400 0.56
France 1,390 0.28
CO2 Intensity(IEA, Key World Energy Statistics 2003)

World Nuclear Expansion(as of January 2007)
Under construction 28
Approved and to be started 64
Under discussion 158
Total 250
The Nuclear Critics
It can’t compete in the market place.
It is too dangerous.We don’t know what to do with
spent fuel.Proliferation risk is too big to
accept.

Costs
Nuclear 1800 €≈$2500/KW (Areva)
Coal $1500 – 2000/KW (EIA)
Wind $1600/KW (peak) (NYT 5/1/07)
$8000/KW (avg.) (20% duty factor)
Solar $5000/KW (peak)(CA Energy
Commision)
$25,000/KW (avg.)

Radiation Exposures
SourceRadiation Dose
Millirem/year
Natural Radioactivity 240
Natural in Body (75kg)* 40
Medical (average) 60
Nuclear Plant (1GW electric) 0.004
Coal Plant (1GW electric) 0.003
*Included in the Natural Total
Nuclear Accidents
Chernobyl (1986) – World’s WorstReactor type not used outside of old Soviet bloc
(can become unstable)
Operators moved into unstable region and disabled all safety systems.
Three Mile Island (1979) – A Partial Core Meltdown
LWRs are not vulnerable to instabilities
All LWRs have containment building
Radiation in region near TMI about 10 mr.
New LWRs have even more safety systems.
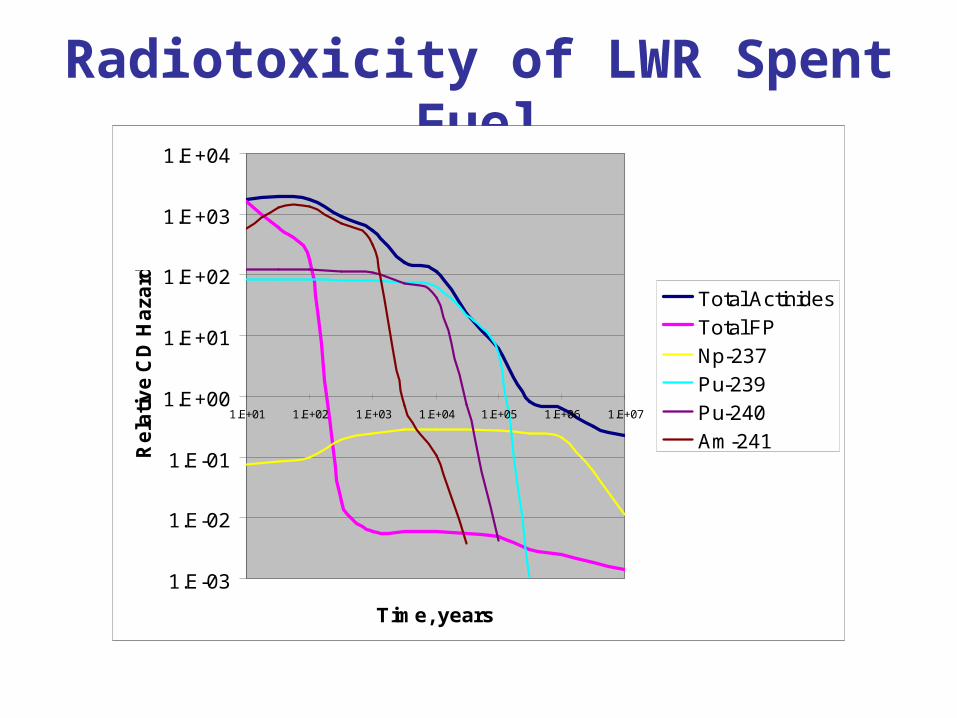
Radiotoxicity of LWR Spent Fuel
1.E-03
1.E-02
1.E-01
1.E+00
1.E+01
1.E+02
1.E+03
1.E+04
1.E+01 1.E+02 1.E+03 1.E+04 1.E+05 1.E+06 1.E+07
Time, years
Re
lati
ve
CD
Ha
zard
Total Actinides
Total FP
Np-237
Pu-239
Pu-240
Am-241
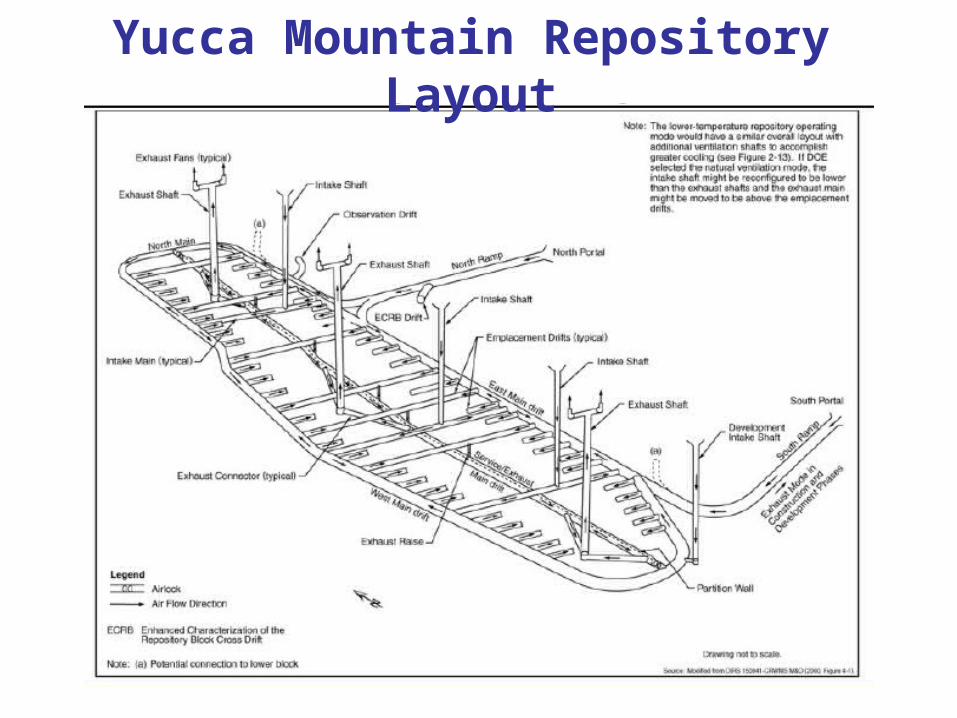
Yucca Mountain Repository Layout

Components of Spent Reactor Fuel
Component
Fission
Fragments Uranium
Long-Lived
Component
Per Cent
Of Total
4 95 1
Radioactivity Intense Negligible Medium
Untreated
required
isolation
time (years)
200 0 300,000
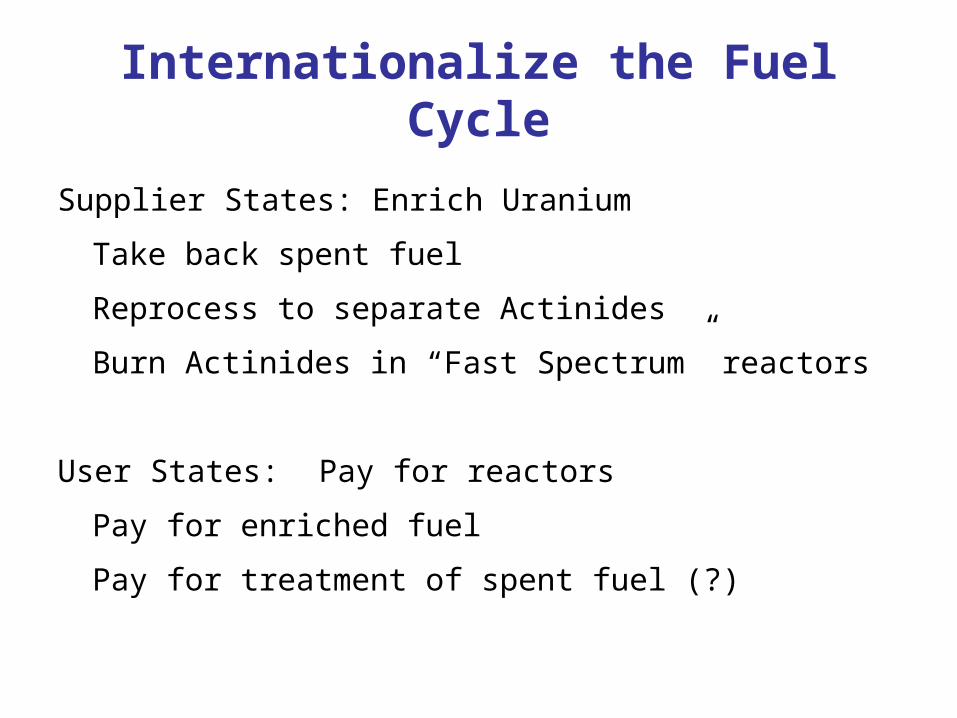
Internationalize the Fuel Cycle
Supplier States: Enrich Uranium
Take back spent fuel
Reprocess to separate Actinides
Burn Actinides in “Fast Spectrum”
reactors
User States: Pay for reactors
Pay for enriched fuel
Pay for treatment of spent fuel (?)
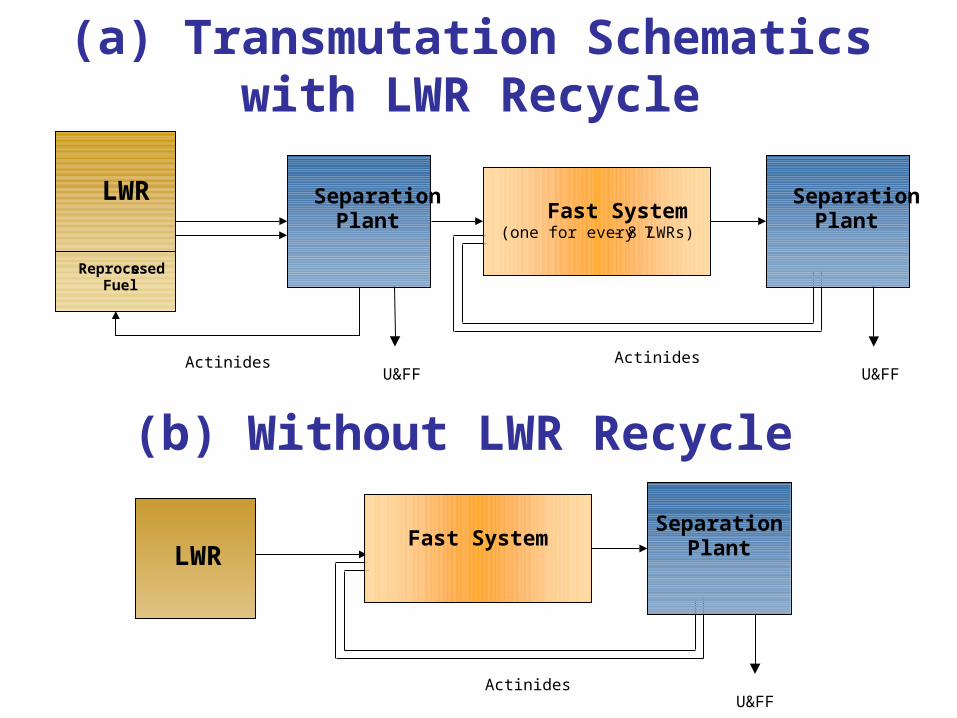
(a) Transmutation Schematics with LWR Recycle
(b) Without LWR Recycle
LWR
Reprocessed Fuel
Separation
Plant
Fast System
(one for every 7- 8 LWRs)
Actinides U&FF
Separation
Plant
U&FF Actinides
LWR
Fast System
Separation
Plant
U&FF Actinides
Coal
Largest Fossil Fuel Resource
US & China each have about 25% of world resources
IF CO2 emitted can be captured ad safely stored underground, problem of reducing Greenhouse Gas emissions is much easier.
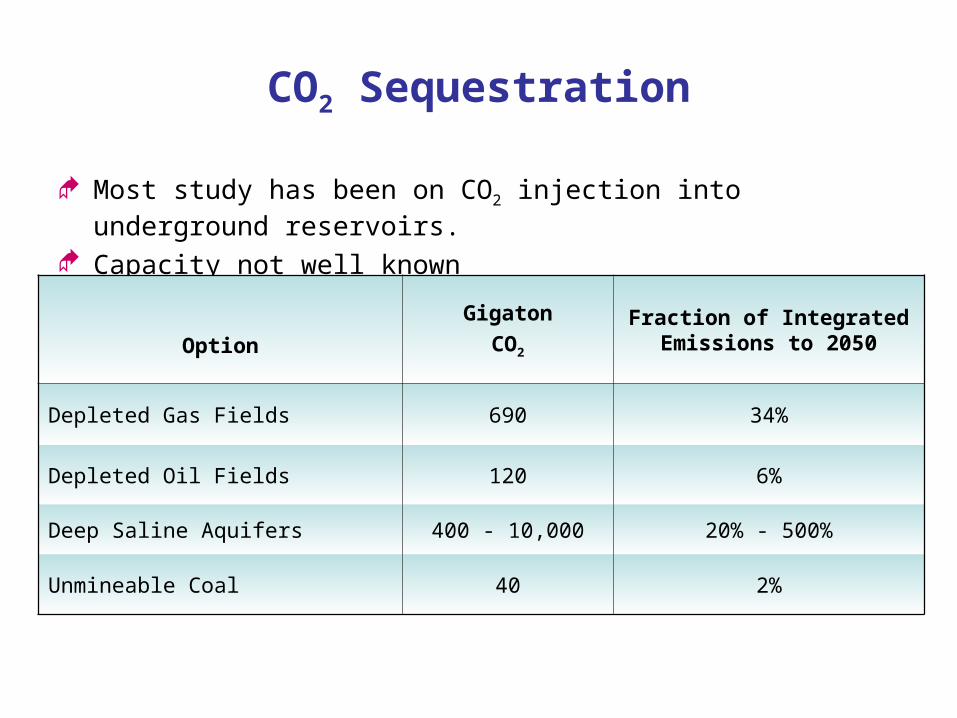
CO2 Sequestration
Most study has been on CO2 injection into underground reservoirs.
Capacity not well known
Option
Gigaton
CO2
Fraction of Integrated Emissions to 2050
Depleted Gas Fields 690 34%
Depleted Oil Fields 120 6%
Deep Saline Aquifers 400 - 10,000 20% - 500%
Unmineable Coal 40 2%
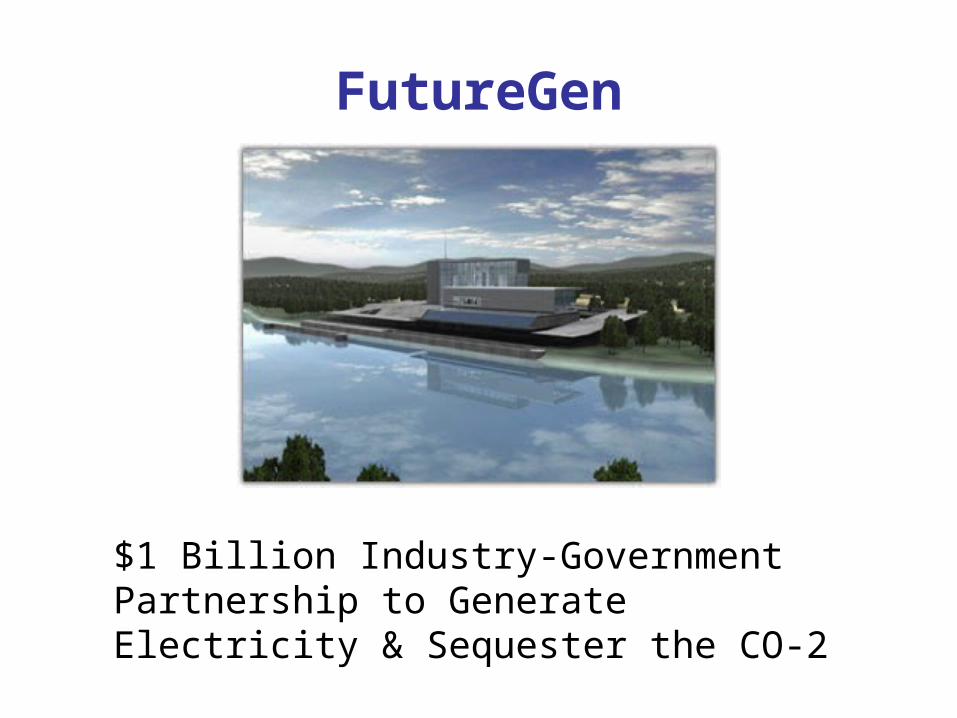
FutureGen
$1 Billion Industry-Government Partnership to Generate Electricity & Sequester the CO-2
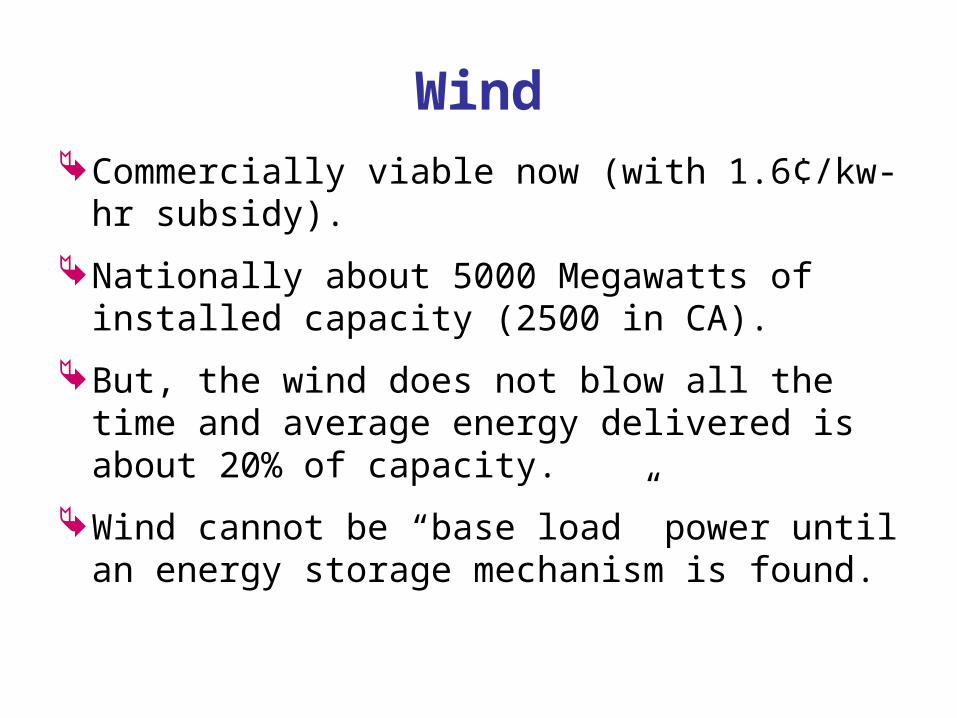
WindCommercially viable now (with 1.6¢/kw-hr
subsidy).
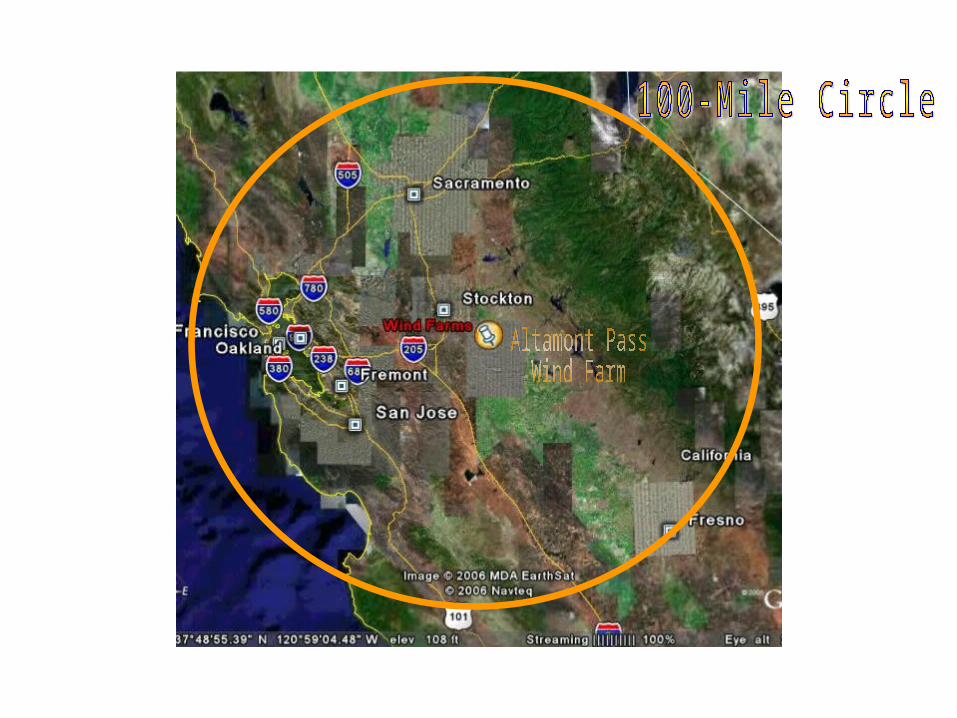
Nationally about 5000 Megawatts of installed capacity (2500 in CA).
But, the wind does not blow all the time and average energy delivered is about 20% of capacity.
Wind cannot be “base load” power until an energy storage mechanism is found.
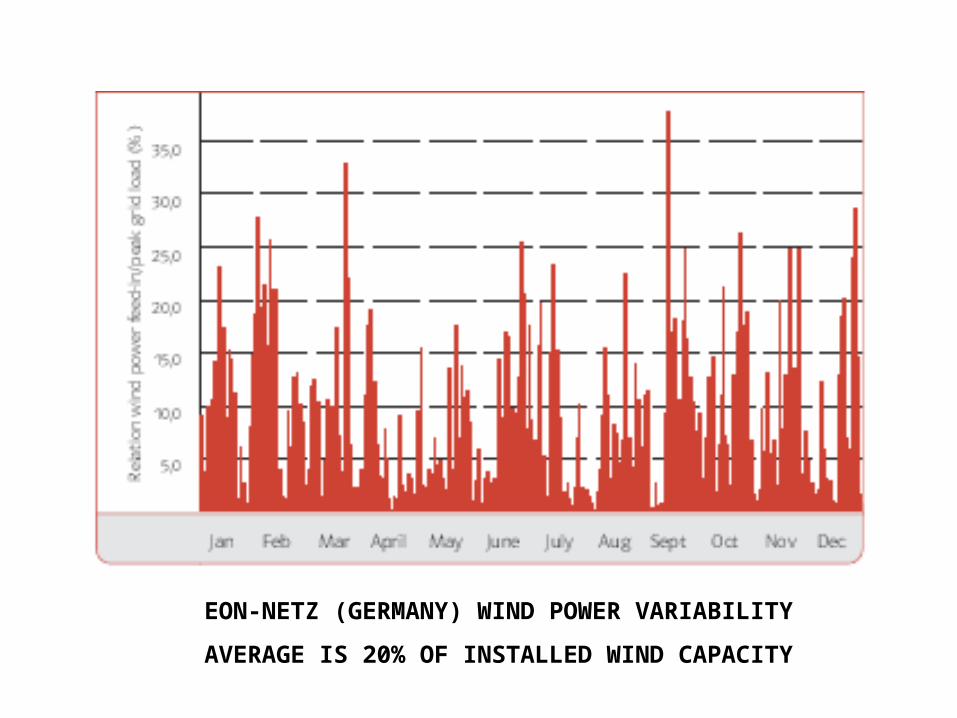
EON-NETZ (GERMANY) WIND POWER VARIABILITY
AVERAGE IS 20% OF INSTALLED WIND CAPACITY

Solar Photovoltaic
Expensive but costs are coming down.
Also has a storage problem (day-night, clouds, etc.)
Some places solar can be important.
In U.S. solar is negligible (less than 10% of wind, mostly in CA).
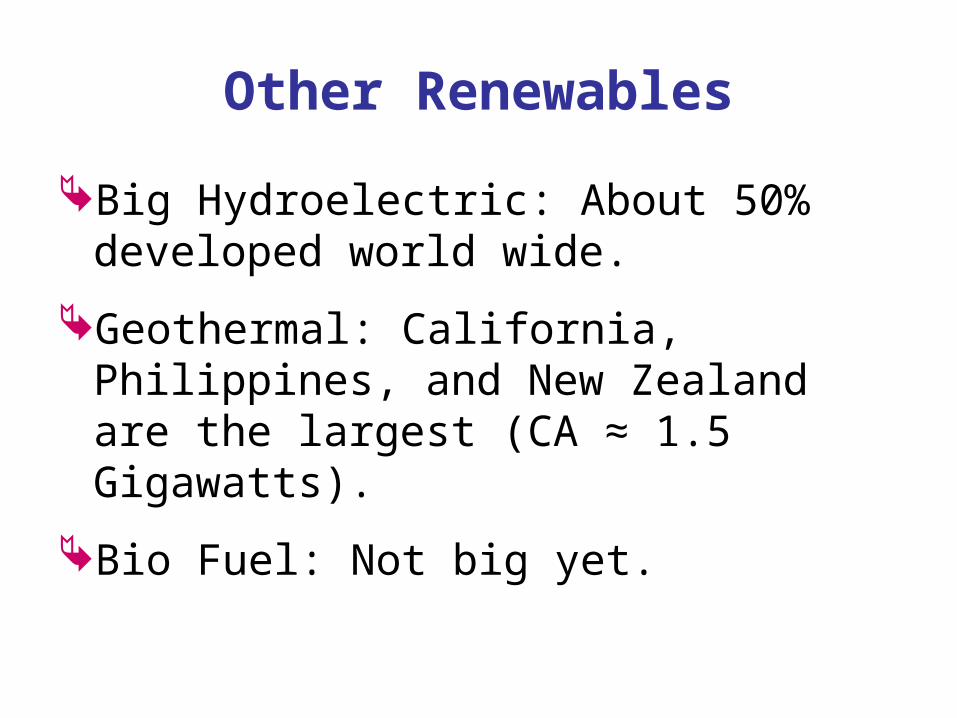
Other Renewables
Big Hydroelectric: About 50% developed world wide.
Geothermal: California, Philippines, and New Zealand are the largest (CA ≈ 1.5 Gigawatts).
Bio Fuel: Not big yet.
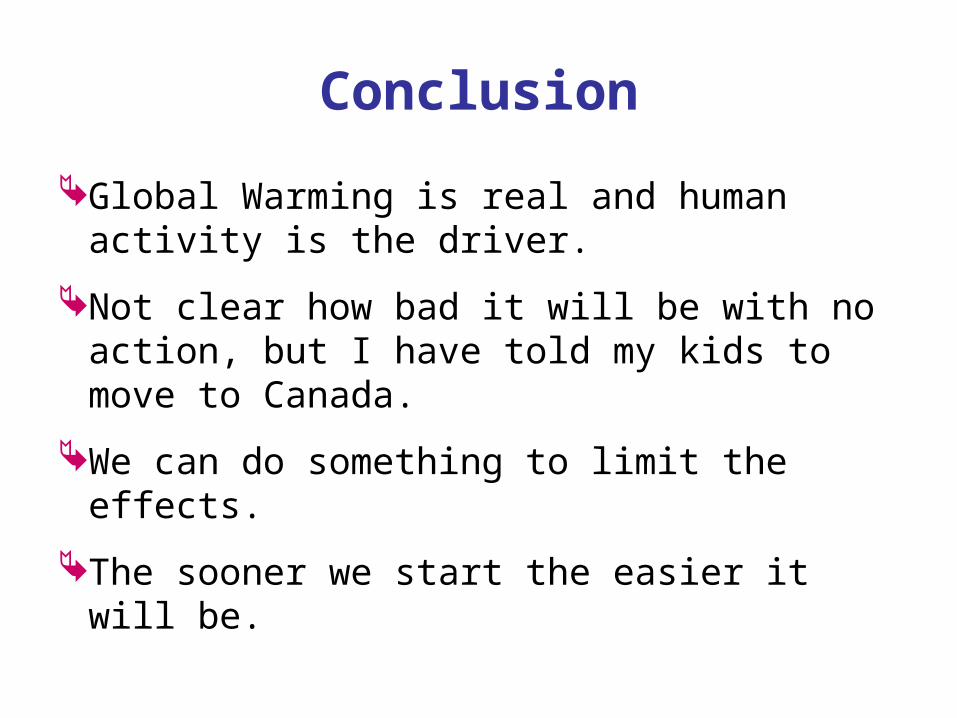
Conclusion
Global Warming is real and human activity is the driver.
Not clear how bad it will be with no action, but I have told my kids to move to Canada.
We can do something to limit the effects.
The sooner we start the easier it will be.

Conclusion
Best incentives for action are those that allow industry to make more money by doing the right thing.
Carrots and sticks in combination are required.
The economy as a whole will benefit, but some powerful interests will not.
It is not hard to know what to do, but very hard to get it done.

BACK-UP SLIDES

World Population GrowthFigure 7. World Population Growth.
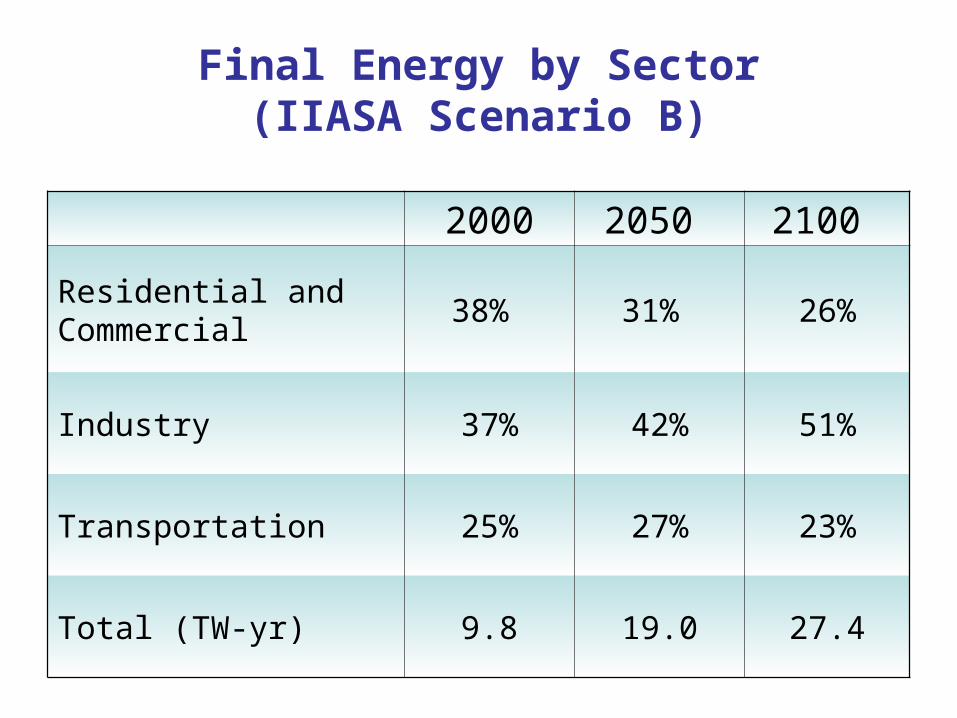
Final Energy by Sector(IIASA Scenario B)
2000 2050 2100
Residential and Commercial
38% 31% 26%
Industry 37% 42% 51%
Transportation 25% 27% 23%
Total (TW-yr) 9.8 19.0 27.4

Energy Intensity(Watt-year per dollar)
(IIASA Scenario B)
Watt-year per dollar 2000
2050 2100
Industrialized 0.30 0.18 0.11
Reforming 2.26 0.78 0.29
Developing 1.08 0.59 0.30
World 0.52 0.36 0.23

Source: "Life-Cycle Assessment of Electricity Generation Systems and Applications for Climate Change Policy Analysis," Paul J. Meier, University of Wisconsin-Madison, August, 2002.
Comparison of Life-Cycle Emissions
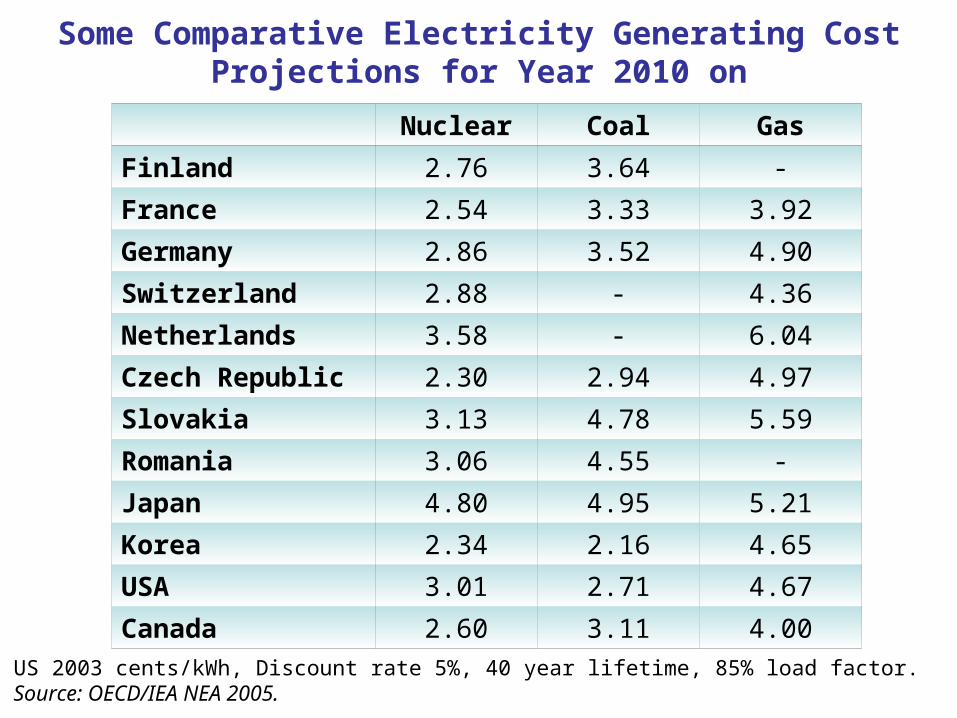
Some Comparative Electricity Generating Cost Projections for Year 2010 on
Nuclear Coal Gas
Finland 2.76 3.64 -
France 2.54 3.33 3.92
Germany 2.86 3.52 4.90
Switzerland 2.88 - 4.36
Netherlands 3.58 - 6.04
Czech Republic 2.30 2.94 4.97
Slovakia 3.13 4.78 5.59
Romania 3.06 4.55 -
Japan 4.80 4.95 5.21
Korea 2.34 2.16 4.65
USA 3.01 2.71 4.67
Canada 2.60 3.11 4.00
US 2003 cents/kWh, Discount rate 5%, 40 year lifetime, 85% load factor.Source: OECD/IEA NEA 2005.
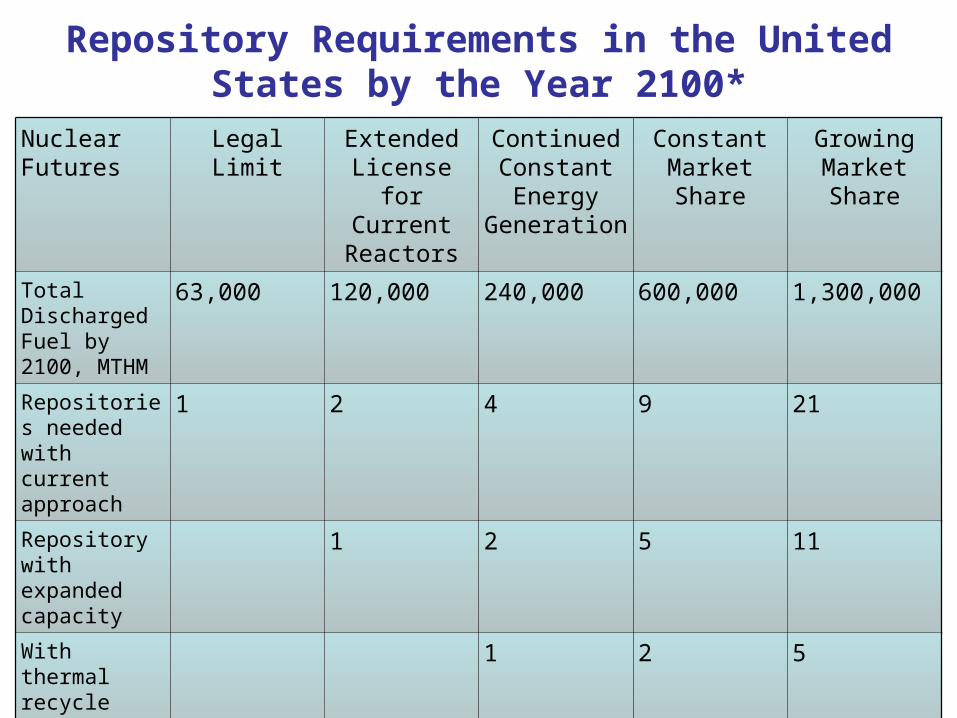
Repository Requirements in the United States by the Year 2100*
NuclearFutures
Legal Limit Extended License for
Current Reactors
Continued Constant Energy
Generation
Constant MarketShare
Growing MarketShare
Total Discharged Fuel by 2100, MTHM
63,000 120,000 240,000 600,000 1,300,000
Repositories needed with current approach
1 2 4 9 21
Repository with expanded capacity
1 2 5 11
With thermal recycle only
1 2 5
With thermal and fast
1

Public Health Impacts per TWh* Coal Lignite Oil Gas Nuclear PV Wind
Years of life lost:
Nonradiological effects
Radiological effects:
Normal operation
Accidents
138 167 359 42 9.1
160.015
58 2.7
Respiratory hospitaladmissions
0.69 0.72 1.8 0.21 0.05 0.29 0.01
Cerebrovascular hospital admissions
1.7 1.8 4.4 0.51 0.11 0.70 0.03
Congestive heart failure 0.80 0.84 2.1 0.24 0.05 0.33 0.02
Restricted activity days 4751 4976 12248
1446 314 1977 90
Days with bronchodilator usage
1303 1365 3361 397 86 543 25
Cough days in asthmatics 1492 1562 3846 454 98 621 28
Respiratory symptoms in asthmatics
693 726 1786 211 45 288 13
Chronic bronchitis in children 115 135 333 39 11 54 2.4
Chronic cough in children 148 174 428 51 14 69 3.2
Nonfatal cancer 2.4
*Kerwitt et al., “Risk Analysis” Vol. 18, No. 4 (1998).
Top Related