


Languages
Pages
Legal


1
Conquest: the Destruction of the American Indios
Massimo Livi-Bacci
University of Florence
British Society for Population Studies
University of Manchester, September 10-12, 2008

2

3
ESTIMATES OF AMERICA's POPULATION AT CONTACT (million)
Kroeber Steward Rosenblat Dobyns Denevan Denevan(1939) (1949) (1954) (1966) (1976) (1992)
Nort America 0,9 1,0 1,0 11,0 4,4 3,8Mexico 3,2 4,5 4,5 33,8 21,4 17,2
Central America 0,1 0,7 0,8 12,2 5,7 5,6Caribe 0,2 0,2 0,3 0,5 5,9 3,0Andes 3,0 6,1 4,8 33,8 11,5 15,7
Other South America 1,0 2,9 2,0 10,1 8,5 8,6
America 8,4 15,5 13,4 101,3 57,3 53,9
Source: Denevan (1992), pp. xviii e 3.
Estimates of America’s Population at Contact (million)
4
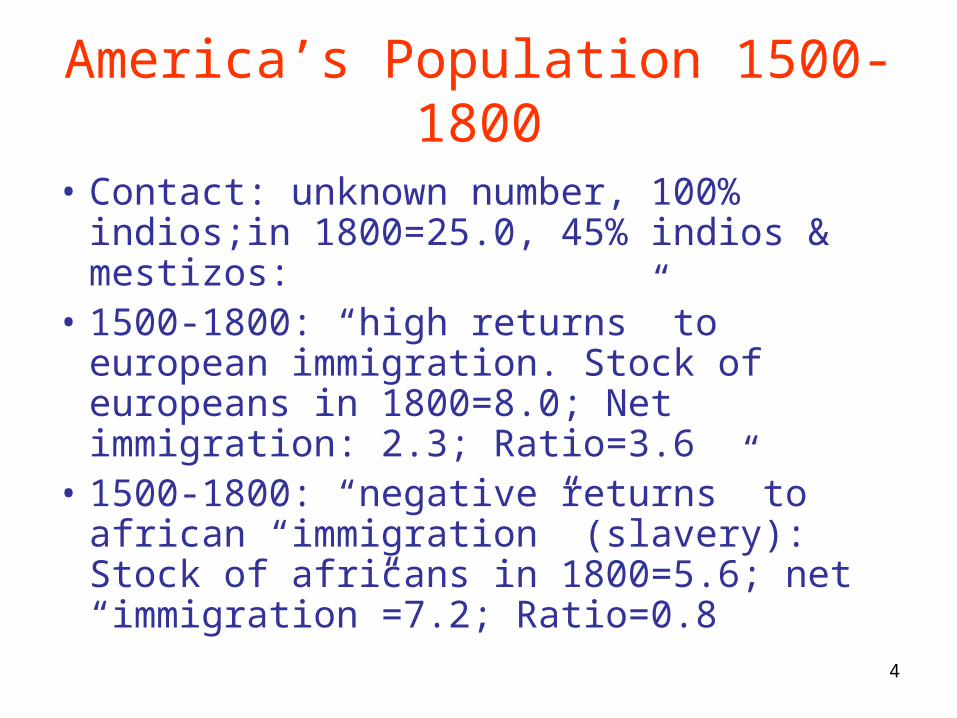
America’s Population 1500-1800
• Contact: unknown number, 100% indios;in 1800=25.0, 45% indios & mestizos:
• 1500-1800: “high returns” to european immigration. Stock of europeans in 1800=8.0; Net immigration: 2.3; Ratio=3.6
• 1500-1800: “negative returns” to african “immigration” (slavery): Stock of africans in 1800=5.6; net “immigration”=7.2; Ratio=0.8

5
The Catastrophe
• Population of America at contact: “high” and “low” counters (8 to 110 million);
• Hispaniola: 1492=0.2/0.3 (personal estimates: “modern” estimates ranging 0,06-8.0 !!); 1518=12,000; 1550=extinction (Epid. 1518-19)
• Mexico: 1519=(3.3/37.5): 1568= 3.0; 1608=1,1 (Epid: 1520-21; 1545-47; 1576-80).
• Peru: 1570=1.290; 1600=0,851 (Epid: 1520s, unlikely; 1558; 1585-91

6
Motolinia’s 10 Plagues(Mexico)
• (1) Smallpox; (2) War;
• (3) Famine as a consquence of war;
• (4) Cruelty, greed, oppression (calpixques);
• (5) Heavy tributes and services; (6) Gold;
• (7) Building Mexico city; (8) Enslavement;
• (9) Provisioning the mines;(10) factions among the Spaniards

7
Table 4: Infectious diseases among indigenous populations in Amazonia Introduced from elsewhere Zoonotic Endemic Smallpox Yellow fever Herpes type I Measles Mayaro fever Mononucleosis Chicken pox Oropouche fever Cytomegalovirus Mumps Toxoplasmosis Hepatitis B Influenza A and B Leismaniosis Ascaris Parainfluenza Trichinosis Amoebiasis Polio Tetanus (?) Treponematosis Malaria Malaria Syphihlis (?) Hepatitis A Several types of worms Dengue Common cold Rotavirus diarrhea Diphtheria Scarlet fever Whooping cough Source: Francis L. Black, “Infectious Diseases and Evolution of Human Populations. The Example of South American Forest Tribes,” in Alan C. Swedlund and George J. Armelagos, eds. Disease in Populations in Transition, New York, Bergin & Garvey, 1990.
Origin of infectious diseases in Amazonia

8
Smallpox: general characteristics
• Crowd disease: develops in animals living in close contact: flocks, herds (virus of smallpox, measles etc);
• Interaction, evolution, adaptation: virus migrates to humans; Eurasia, Africa;
• But not in America: no large mammals (but bison, turkeys, llamas, dogs); little opportunities for interaction; low human density; recent settlement of humans;
• Lack of immunity among Indios: everybody susceptible;• Latency: 12-14 days after infection: no symptoms;• Infectiousness: 12 day max: high fever, nausea, pains,
eruptions, eventually death • Mortality of the infected: 20 to 50% according to age.

9
Smallpox Pandemic of the 1520s

10
Smallpox: basic model I
• Interval among outbreaks: ca. 15 years;• 80% are infected;• 40% of the infected die; • No growth in the population between outbreaks;• Susceptible population after the first outbreak:
20% not infected; 60% of those infected who survived; newborn in the 15 years interval;
• Population of 1000 at first outbreak reduced to 600 after 15 years and to 423 after 30 years;
• Mortality rate: 40% f.o; 16% s.o.

11
Smallpox: basic model II
• Interval between outbreaks: ca. 15 years;• 70% are infected (population more dispersed;
learns to escape contagion etc;• 40% of the infected die at first outbreak, but 30%
at second, third… outbreaks (the sick are not abandoned etc;
• Population rebounds 15% between outbreaks; • Initial population of 1000, reduced to 901 after
30 years

12
Mines in Central America(A=Silver; O=Gold)
13
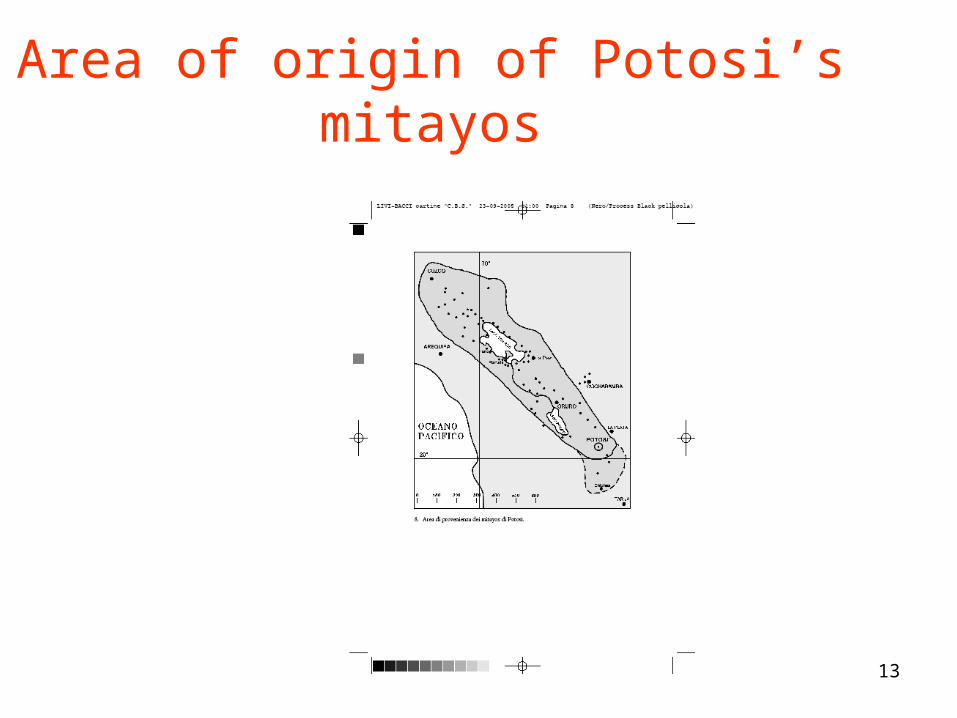
Area of origin of Potosi’s mitayos

14
Mines in South America

15
Four paradigms after ConquestParadigm I: Caribbean (destruction without
epidemics)
• Population disappears; catastrophic decline;• High ratio Europeans/Indios;• Enslavement and dislocation;destructuring of
communities;• Forced labor (gold mines); • “Appropriation” of young women (F/M=0,8);• Low fertility (Children/women ratio 0.3);• High mortality and low fertility: no rebound

16
Hispaniola in 1514(Alburquerque’s Repartimiento: first census of
America)

17
Table 6: Estimates for the population of Hispaniola at the moment of contact Author Year Population (in 1000s) 1 Verlinden 1973 60 2 Amiama 1959 100 3 Rosenblatt 1954, 1976 100 4 Mira Caballos 1997 100 5 Lipschutz 1966 100/500 6 Nabel Pérez 1992 250 7 Moya Pons 1987 378 8 Cordova 1968 500 9 N.D. Cook 1993 500/750 10 Moya Pons 1971 600 11 C.N. de Moya 1976 1,000 12 Zambardino 1978 1,000 13 Denevan 1992 1,000 14 Guerra 1988 1,100 15 Denevan 1976 1,950 16 Watts 1987 3-4,000 17 Borah and Cook 1971 7,975
Hispaniola’s Population at Contact(modern estimates)

18
Caciques by number of indios
0
5
10
15
20
25
30
35
0-4
5-9
10
-14
15
-19
20
-24
25
-29
30
-34
35
-39
40
-44
45
-49
50
-54
55
-59
60
-64
65
-69
70
-74
75
-79
80
-84
85
-89
90
-94
95
-99
10
0-1
04
10
5-1
09
11
0-1
14
11
5-1
19
12
0-1
24
12
5-1
29
1
30
-13
4
13
5-1
39
14
0-1
44
14
5-1
49
15
0-1
54
15
5-1
59
16
0-1
64
16
5-1
69
17
0-1
74
17
5-1
79
18
0-1
84
18
5 e
+
Indios
Ca
ciq
ue
s
Caciques by number of Indios, 1514

19
Paradigm II: Coastal lowlands, Gulf of Mexico, Peru (catastrophic)
• Higher pathological density; favorable environment for diffusion of new pathologies;
• Malaria & plasmodium: mortality and emigration;• Vulnerable environment (coastal valleys of
Peru): appropriation of best land and water resources;
• High impact of europeans (Peru);• General dislocation (Brazilian variant)

20
Paradigm III: highlands of Mexico, Peru (rapid decline and resilience)
• Lesser dislocation of society, but:• restructuring of settlements (much stronger in
Peru than Mexico);• Destructive impact of wars in Peru (1520s-
1540s);• Radial conformation of Mexican meseta, comb-
like conformation of Peru: possible impacts on diffusion of pathologies;
• Lesser impact of pathologies at high altitudes?

21
City of Mexico and Valley of Mexico

22
THE COLLAPSE OF MEXICO's POPULATIONACCORDING TO COOK AND BORAH
Coastal CentralMeseta regions Mexico
1519 15300 9900 252001532 11226 5645 168711548 4765 1535 63001568 2231 418 26491580 1631 260 18911595 1125 247 13721605 852 217 1069
Indici 1519 = 100
1519 100 100 1001532 73 57 671548 31 16 251568 15 4 111580 11 3 81595 7 2 51608 6 2 4
The Collapse of Mexico’s Population (according to Cook and Borah)

23
Table 9: Population of New Spain according to the Royal Cosmographer López de Velasco, c. 1570 Population Diocese of
México Diocese of Tlaxcala-Puebla
Diocese of Oaxaca
Diocese of Michoacán
Captaincy General of Yucatán
Audiencia of Nueva Galicia
TOTAL
Spanish families 2,794 400 420 1,000 300 1,500 6,414 Spanish Cities 9 2 4 7 4 8 34 Pueblos de indios 247 200 350 330 200 150 1,477 Indian tributaries 336,000 215,000 96,000 44,000 60,000 20,000 771,000 Confessing Indios 739,000 - - - - Repartimientos de encomederos
186 66 82 25 130 54 543
Repartimientos of the king
60 60 68 69 - 50 307
Blacks - 1,000 - - - - 1,000 Monasteries 90 30 - - 10 - 130 Source: Juan López de Velasco, Geografía y descripción universal de las Indias, Madrid, Atlas, 1971.
Population of New Spain, 1570(Royal Cosmographer Lopez de Velasco)

24
Travels of Cieza de Leon

25
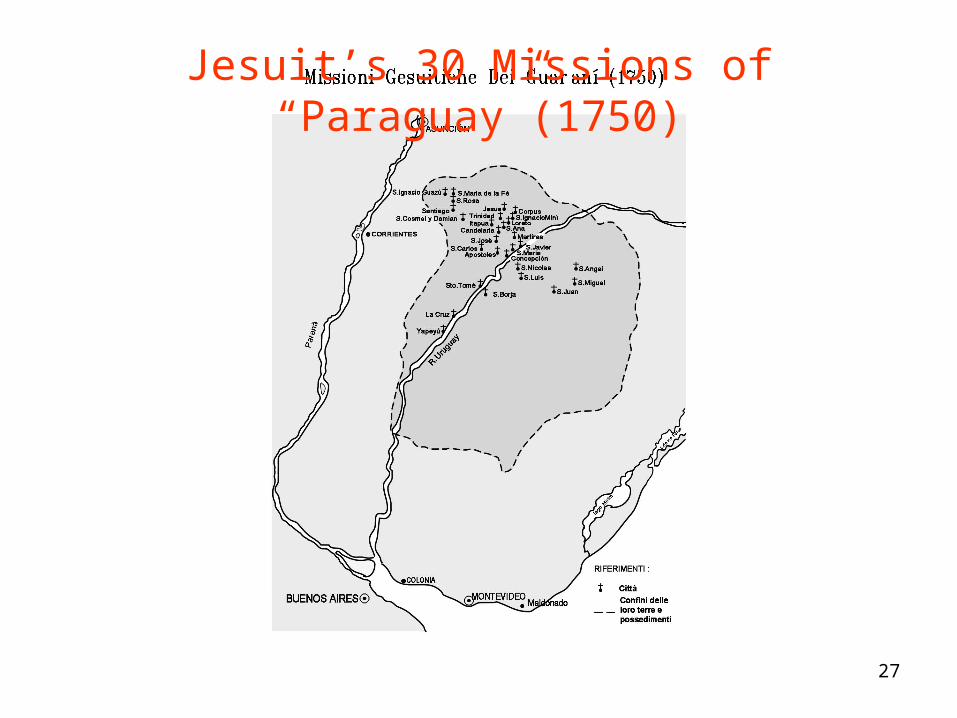
Paradigm IV: Paraguay(Expansion in spite of epidemics)
• Frequent epidemics, high epidemic mortality (young age structure);
• Very high fertility: Jesuits enforce early and universal marriage, high fertility;
• Strong rebounds after epidemics and high population growth in the interepidemic intervals;
• Preservation of Guaranì communities from dislocation, forced labor, enslavement

26
Jesuit Missions in South America
27
Jesuit’s 30 Missions of “Paraguay”(1750)

28
Popolazione delle Missioni, XVII-XIX secolo
0
20000
40000
60000
80000
100000
120000
140000
160000
1642 1649 1656 1663 1670 1677 1684 1691 1698 1705 1712 1719 1726 1733 1740 1747 1754 1761 1768 1775 1782 1789 1796 1803 1810
Population of Paraguay’s 30 Missions
Top Related