


Languages
Pages
Legal


1
Analysis of Airborne Microwave Analysis of Airborne Microwave Polarimetric Radiometer Polarimetric Radiometer
Measurements in the Presence of Measurements in the Presence of Dynamic Platform Attitude ErrorsDynamic Platform Attitude Errors
Jean Yves KaboreJean Yves KaboreCentral Florida Remote Sensing LaboratoryCentral Florida Remote Sensing Laboratory
University of Central FloridaUniversity of Central Florida
2
Presentation OutlinePresentation Outline
• Instrument Description and characteristics• Analysis of Attitude Errors on Measurement
Geometry • Experimental validation• Conclusions
3
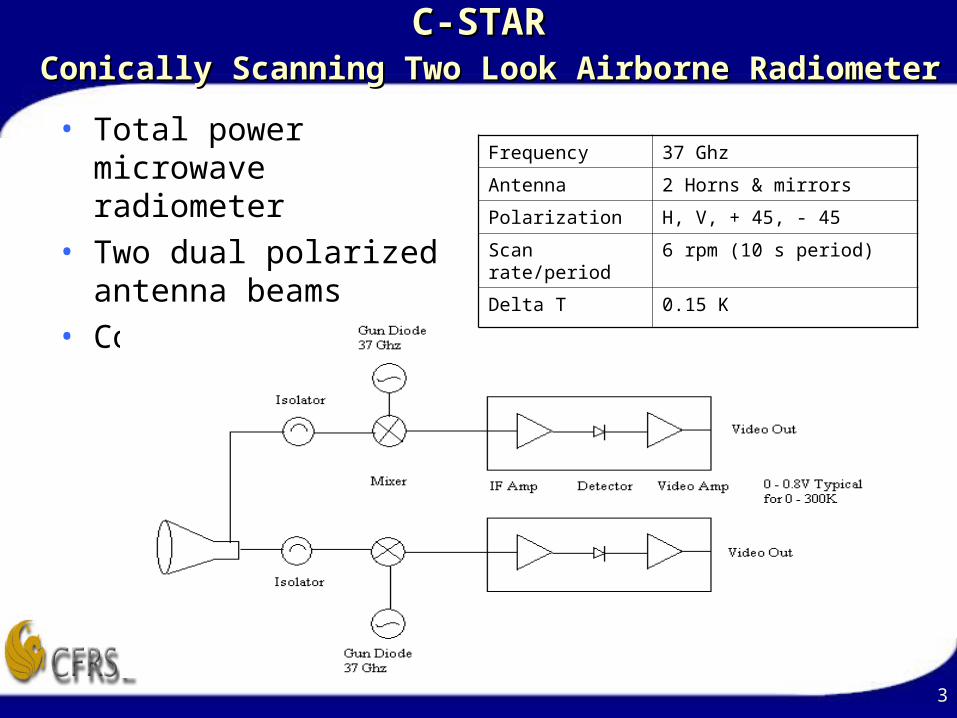
C-STARC-STAR Conically Scanning Two Look Airborne RadiometerConically Scanning Two Look Airborne Radiometer
• Total power microwave radiometer
• Two dual polarized antenna beams
• Conically scanning
Frequency 37 Ghz
Antenna 2 Horns & mirrors
Polarization H, V, + 45, - 45
Scan rate/period 6 rpm (10 s period)
Delta T 0.15 K
4
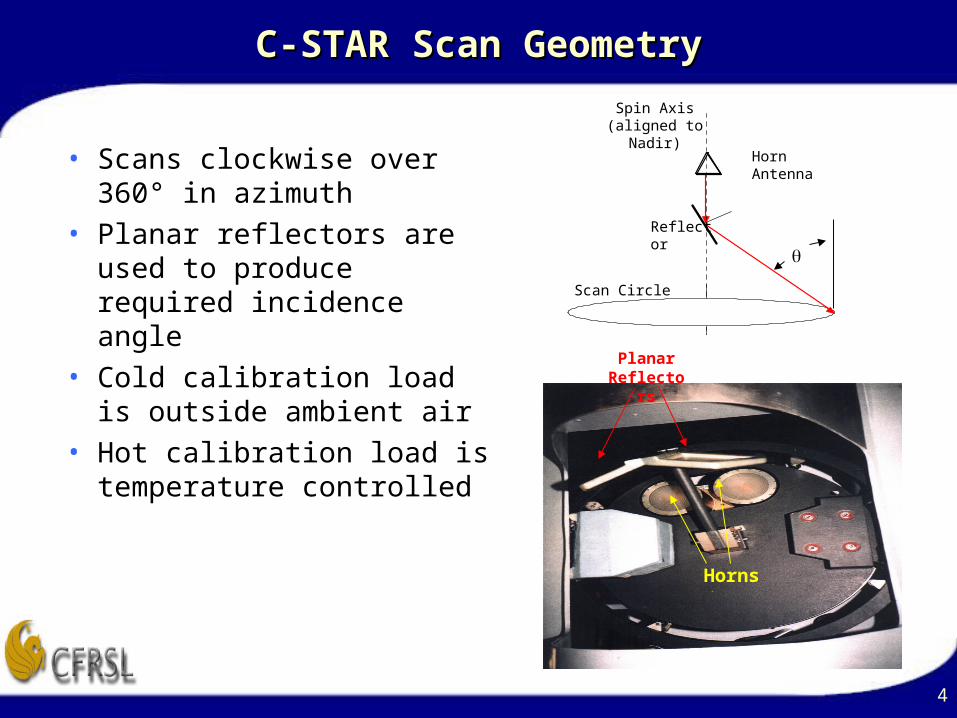
C-STAR Scan GeometryC-STAR Scan Geometry
• Scans clockwise over 360° in azimuth
• Planar reflectors are used to produce required incidence angle
• Cold calibration load is outside ambient air
• Hot calibration load is temperature controlled
Spin Axis(aligned to
Nadir)Horn Antenna
Reflector
Scan Circle
Horns
Planar Reflectors
5
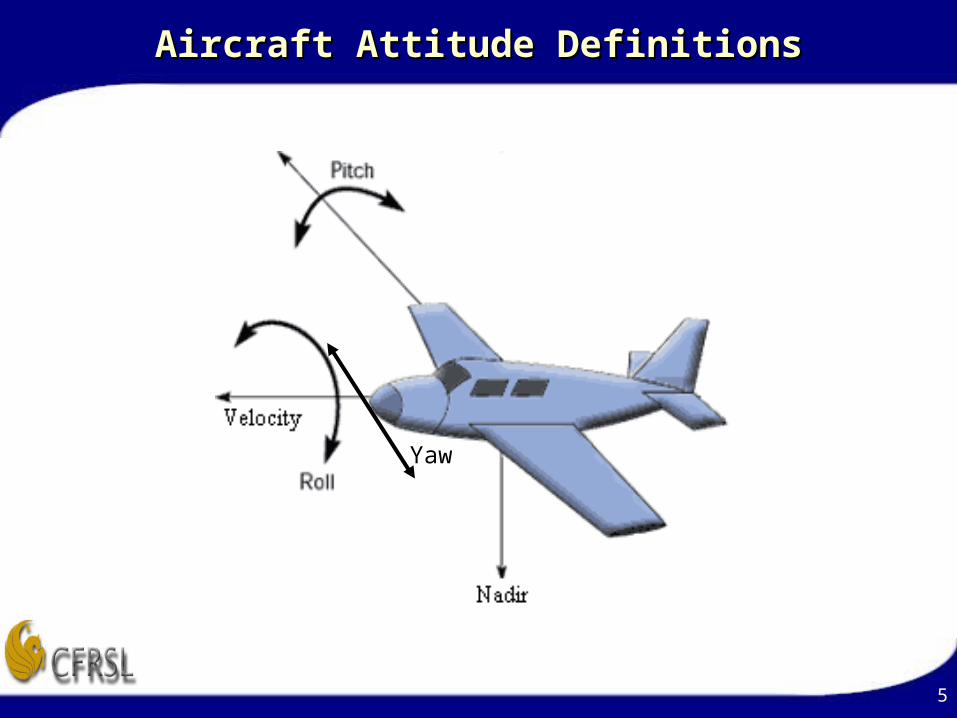
Aircraft Attitude DefinitionsAircraft Attitude Definitions
Yaw
6
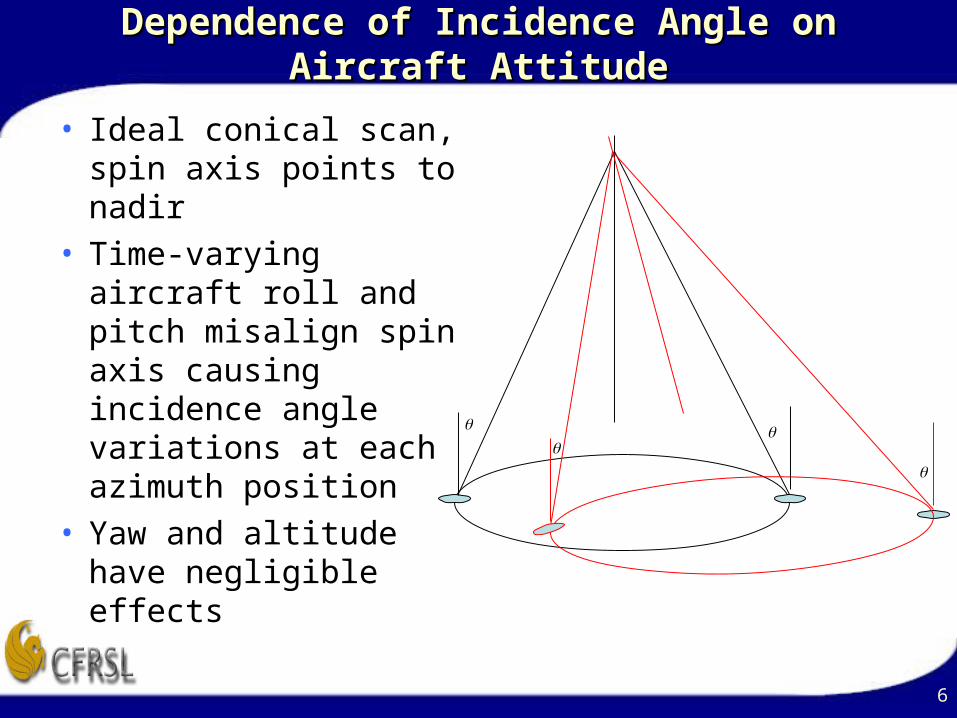
Dependence of Incidence Angle on Aircraft Dependence of Incidence Angle on Aircraft AttitudeAttitude
• Ideal conical scan, spin axis points to nadir
• Time-varying aircraft roll and pitch misalign spin axis causing incidence angle variations at each azimuth position
• Yaw and altitude have negligible effects
7
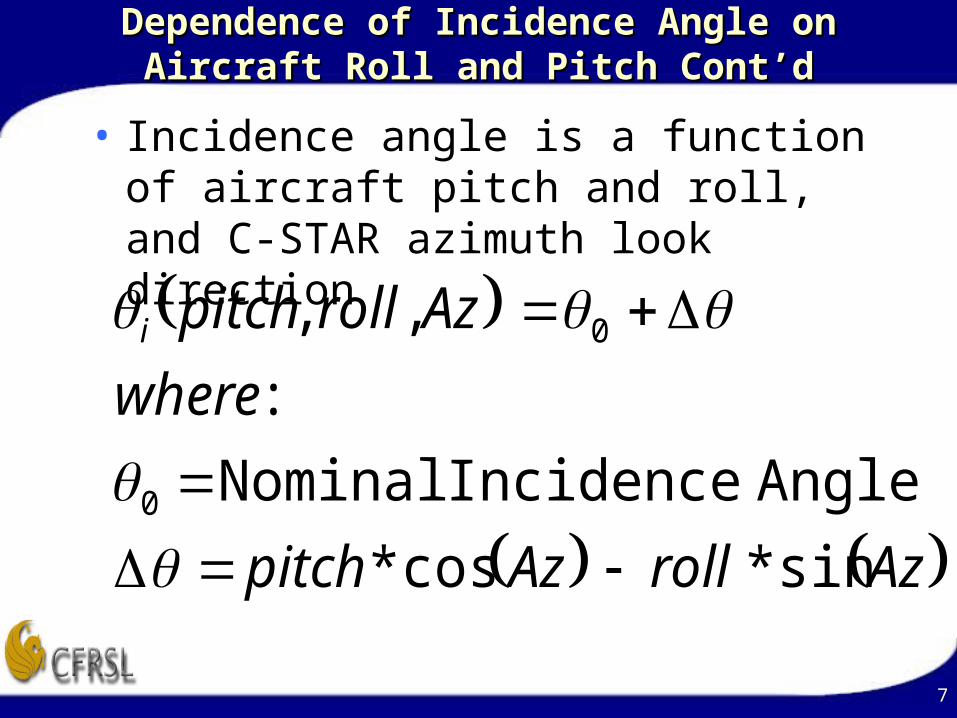
Dependence of Incidence Angle on Aircraft Roll Dependence of Incidence Angle on Aircraft Roll and Pitch Cont’dand Pitch Cont’d
• Incidence angle is a function of aircraft pitch and roll, and C-STAR azimuth look direction
AzrollAzpitch
where
Azrollpitchi
sin*cos*
AngleIncidence Nominal
:
,,
0
0

8
Incidence Angle Simulation - Pitch and RollIncidence Angle Simulation - Pitch and Roll
Incidence angle, Pitch = 1
50.00
50.50
51.00
51.50
52.00
52.50
53.00
53.50
54.00
54.50
55.00
0
20 40 60 80
100
120
140
160
180
200
220
240
260
280
300
320
340
360
Azimuth, deg
Inci
den
ce a
ng
le, d
eg Roll= 0 deg
Roll= 0.5 dge
Roll = 1 deg
Roll=-0.5 deg
Roll = -1 deg

9
Brightness Temperature NormalizationBrightness Temperature Normalization
• Equivalent Tb (incidence angle corrected) is:
where i is the instantaneous incidence angle
o is the mean incidence angle
dTb/d is change in Tb with respect to
incidence angle (from radiative transfer model)
oib
bnormb d
dii
*
Tb correction
{Measured Tb
V-pol or H-pol
{
10
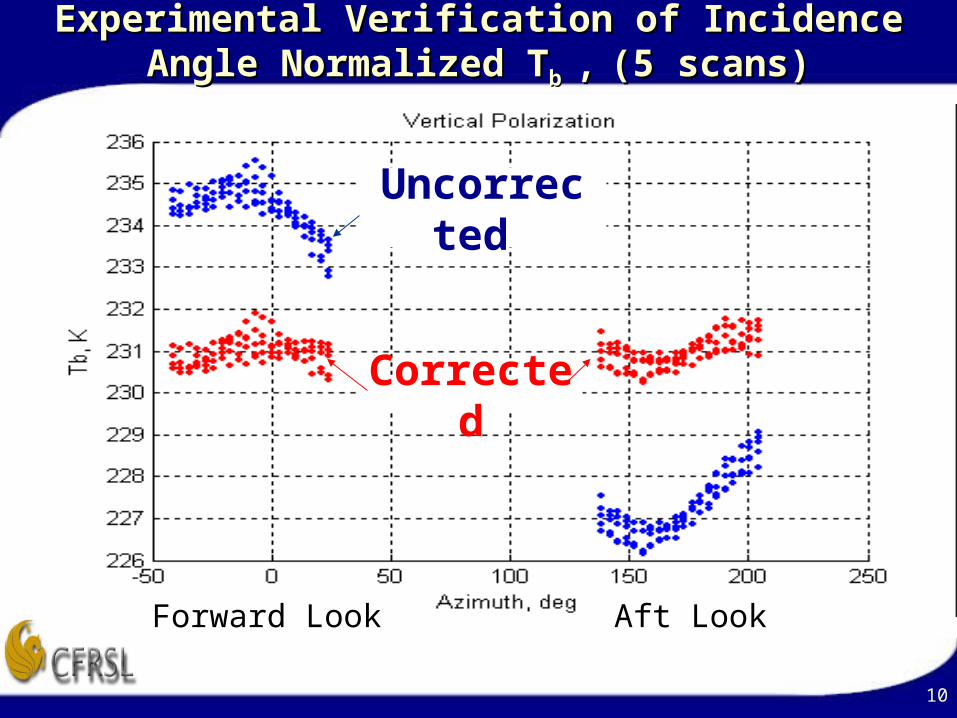
Experimental Verification of Incidence Angle Experimental Verification of Incidence Angle Normalized TNormalized Tb b ,, (5 scans)(5 scans)
Corrected
Uncorrected
Forward Look Aft Look

11
Polarization Rotation Caused by Mis-alignment Polarization Rotation Caused by Mis-alignment of Spin Axisof Spin Axis
)sin(*)cos(* AzpitchAzroll
• Alignment error caused by time varying A/C roll and pitch• Small effect (< 1 K) on V & H pols• Dominant effect for p & q-pols
Modelled by:
)(sin*)(cos* 22 surfacesurface TbVTbVTbV
)(cos*)(sin* 22 surfacesurface TbHTbHTbH
Where
V
H
P
Q
V’
H’
12
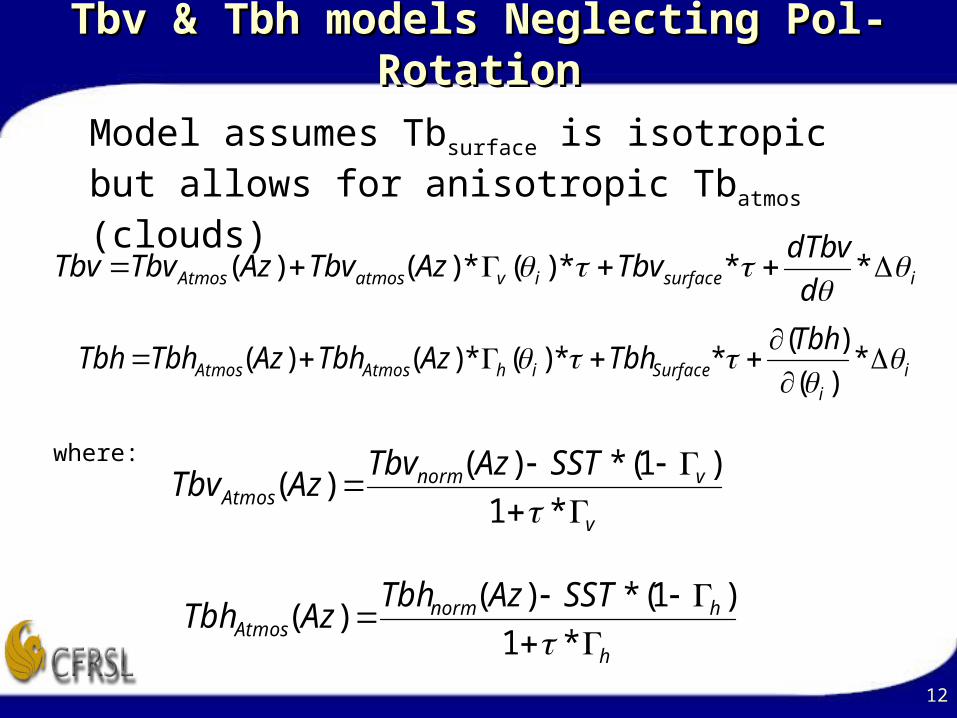
Tbv & Tbh models Neglecting Pol-RotationTbv & Tbh models Neglecting Pol-Rotation
isurfaceivatmosAtmos d
dTbvTbvAzTbvAzTbvTbv
***)(*)()(
ii
SurfaceihAtmosAtmos
TbhTbhAzTbhAzTbhTbh
*)(
)(**)(*)()(
v
vnormAtmos
SSTAzTbvAzTbv
*1
)1(*)()(
where:
h
hnormAtmos
SSTAzTbhAzTbh
*1
)1(*)()(
Model assumes Tbsurface is isotropic but allows for anisotropic Tbatmos (clouds)

13
Observed Problems with Tbv & Tbh modelObserved Problems with Tbv & Tbh model
• Could not obtain a consistent match between measured and modeled Tb’s
• Investigated possible causes– Cloud contamination
• Model updated to include this effect
– Instrument calibration drift– Antenna pattern interactions with AC fuselage
• Tb biases with azimuth position
– Improper sampling of AC roll & pitch• AC data smoothed and resampled
• Observed that the measured Tb’s and aircraft attitude were not synchronized

14
Prior to Time Bias AdjustmentPrior to Time Bias Adjustment

15
Tbv & Tbh model verificationTbv & Tbh model verification
• Isotropic surface brightness temperatures were assumed
• Anisotropic atmospheric Tb hypothesis:– Clouds can occur over portions of the scan; therefore,
Tb would be anisotropic
• Used differences between measured and modeled Tb’s to determine atmospheric contributions versus azimuth
• Checked reasonableness of clouds against radiative transfer model results– Similarity of V- and H-pol results

16
Tbv model verification, Low winds flightTbv model verification, Low winds flight
0 20 40 60 80 100 120 140 160229
230
231
232
233
234
235
236
237
238
239
240
Time series
TbV
,K
Modelled and Measured, Scan 173-180
Measured
Modelled
17
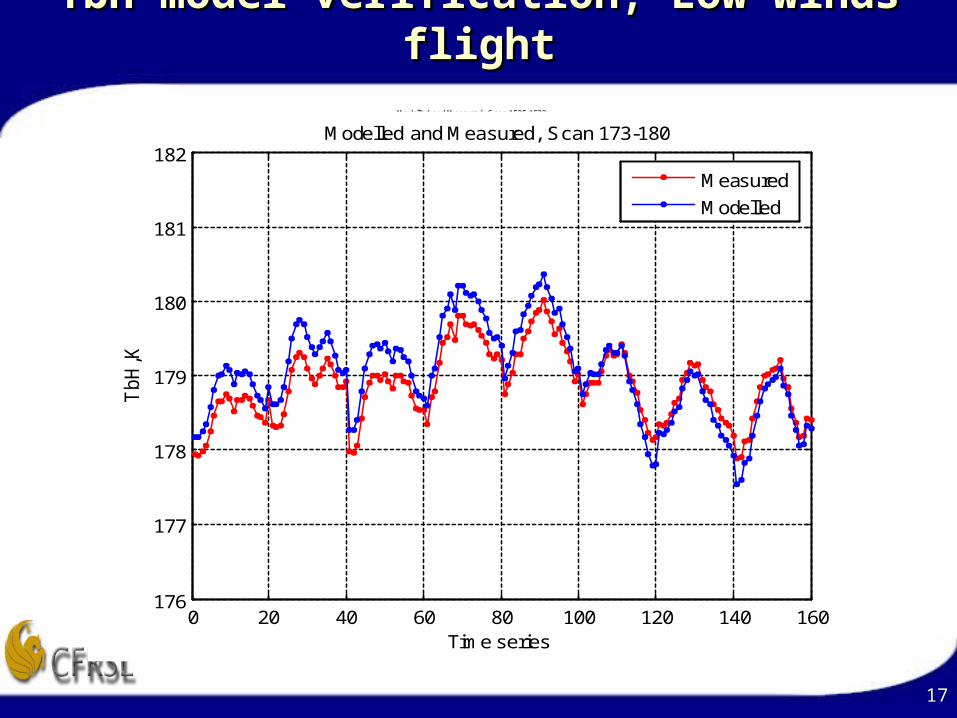
Tbh model verification, Low winds flightTbh model verification, Low winds flight
0 20 40 60 80 100 120 140 160176
177
178
179
180
181
182
Time series
TbH
,K
Modelled and Measured, Scan 1525-1532
Measured
Modelled
0 20 40 60 80 100 120 140 160176
177
178
179
180
181
182
Time series
TbH
,KModelled and Measured, Scan 173-180
Measured
Modelled
18
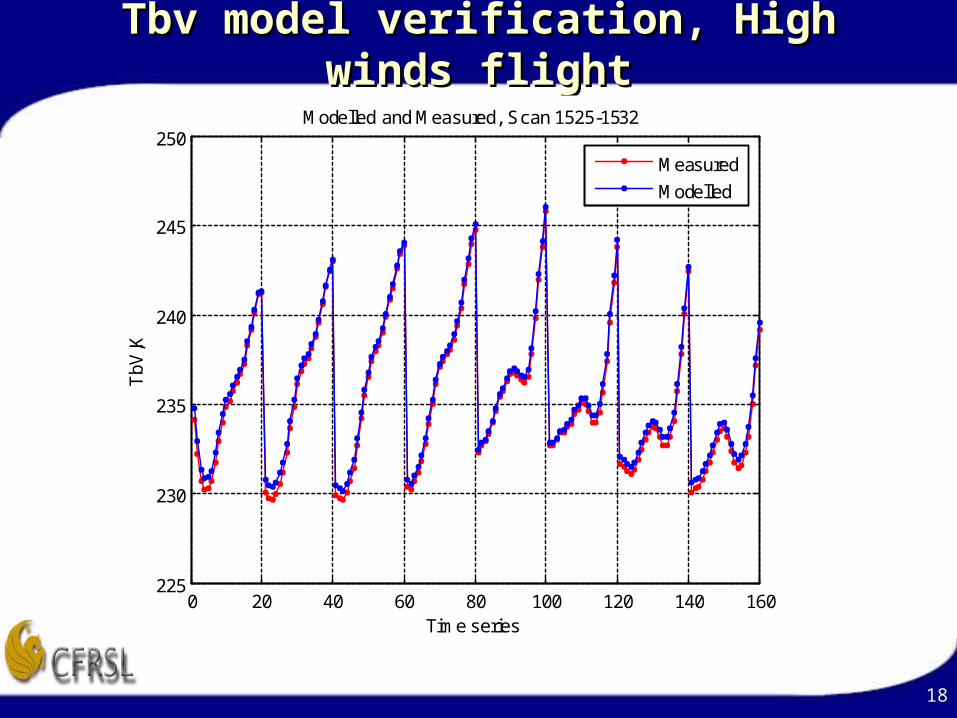
Tbv model verification, High winds flightTbv model verification, High winds flight
0 20 40 60 80 100 120 140 160225
230
235
240
245
250
Time series
TbV
,KModelled and Measured, Scan 1525-1532
Measured
Modelled

19
Tbh model verification, High winds flightTbh model verification, High winds flight
0 20 40 60 80 100 120 140 160180
185
190
195
200
205
210
215
220
225
Time series
TbH
,KModelled and Measured, Scan 1525-1532
Measured
Modelled

20
Tbp & Tbq model verificationTbp & Tbq model verification
)(sin*)()(cos*)( 452
452
ii TbVTbHTbp
)(sin*)()(cos*)( 452
452
ii TbVTbHTbq
)45(p
)45(q
**)(*)()()( surfaceivatmosAtmosi TbvAzTbvAzTbvTbV
**)(*)()()( surfaceihatmosAtmosi TbhAzTbhAzTbhTbH Where:
21
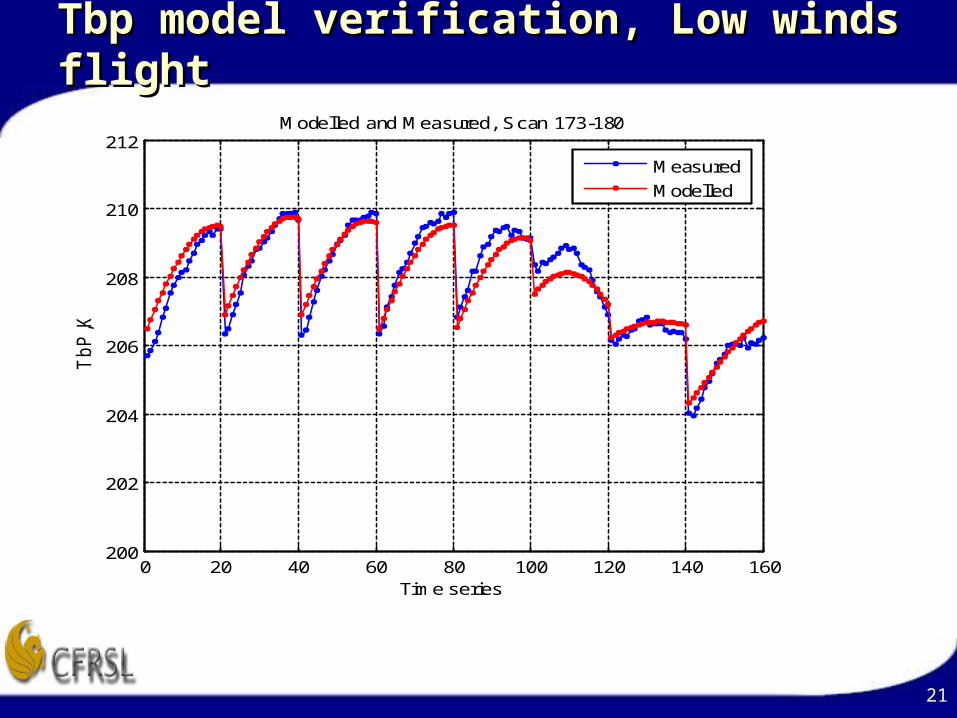
Tbp model verification, Low winds flightTbp model verification, Low winds flight
0 20 40 60 80 100 120 140 160200
202
204
206
208
210
212
Time series
TbP
,K
Modelled and Measured, Scan 173-180
Measured
Modelled

22
Tbq model verification, Low winds flightTbq model verification, Low winds flight
0 20 40 60 80 100 120 140 160200
202
204
206
208
210
212
Time series
TbQ
,K Modelled and Measured, Scan 173-180
Measured
Modelled

23
Tbp model verification, High winds flightTbp model verification, High winds flight
0 20 40 60 80 100 120 140 160200
205
210
215
220
225
230
235
Time series
TbP
,K Modelled and Measured,Scan 1525-1532
Measured
Modelled

24
Tbq model verification, High winds flightTbq model verification, High winds flight
0 20 40 60 80 100 120 140 160200
205
210
215
220
225
230
235
Time series
TbQ
,K Modelled and Measured,Scan 1525-1532
Measured
Modelled
25
ConclusionsConclusions
• Effectively characterized effects of a/c attitude variations on measured brightness
• Made adjustments to remove inconsistencies in A/C and radiometer data sets
• Accurately modeled TbV, TbH, TbP and TbQ using A/C roll and pitch
Top Related