


Languages
Pages
Legal

1
1996 NAEP Grade 4 Mathby Race/Ethnicity, Nation
73%61%
26%
24%
32%
49%
3%7%
26%
0%
20%
40%
60%
80%
100%
AfricanAmerican
Latino White
Percent of Students
Proficient/Advanced
Basic
Below Basic
Source: National Center for Education Statistics, NAEP Data Explorer, http://nces.ed.gov/nationsreportcard/nde/
2
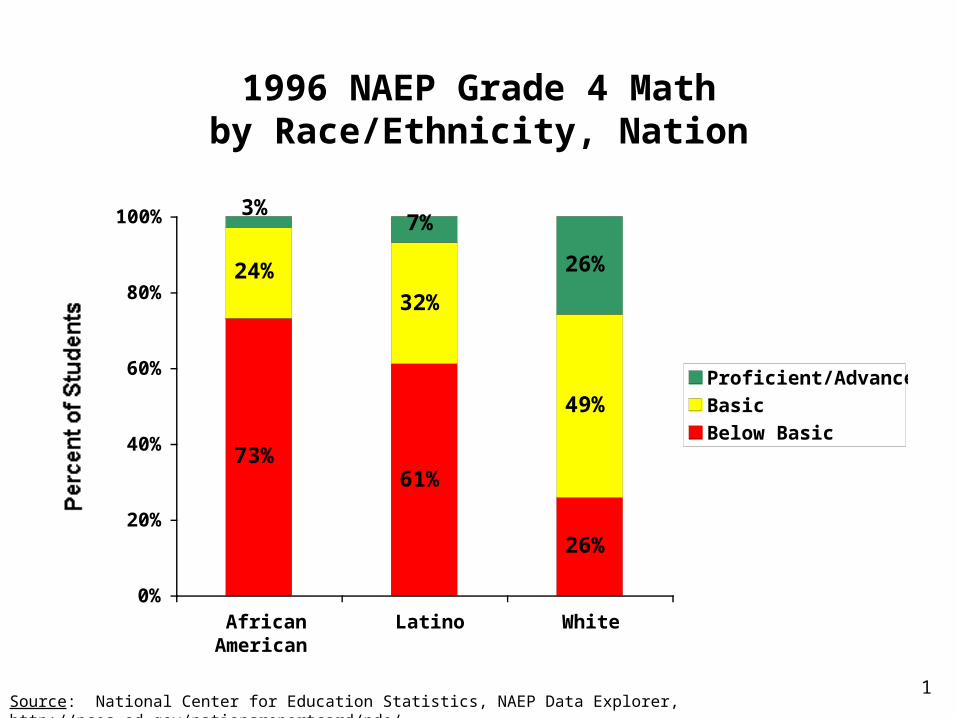
2007 NAEP Grade 4 Mathby Race/Ethnicity, Nation
37% 31%
9%
48%47%
40%
15%22%
51%
0%
20%
40%
60%
80%
100%
AfricanAmerican
Latino White
Percent of Students
Proficient/Advanced
Basic
Below Basic
Source: National Center for Education Statistics, NAEP Data Explorer, http://nces.ed.gov/nationsreportcard/nde/
3
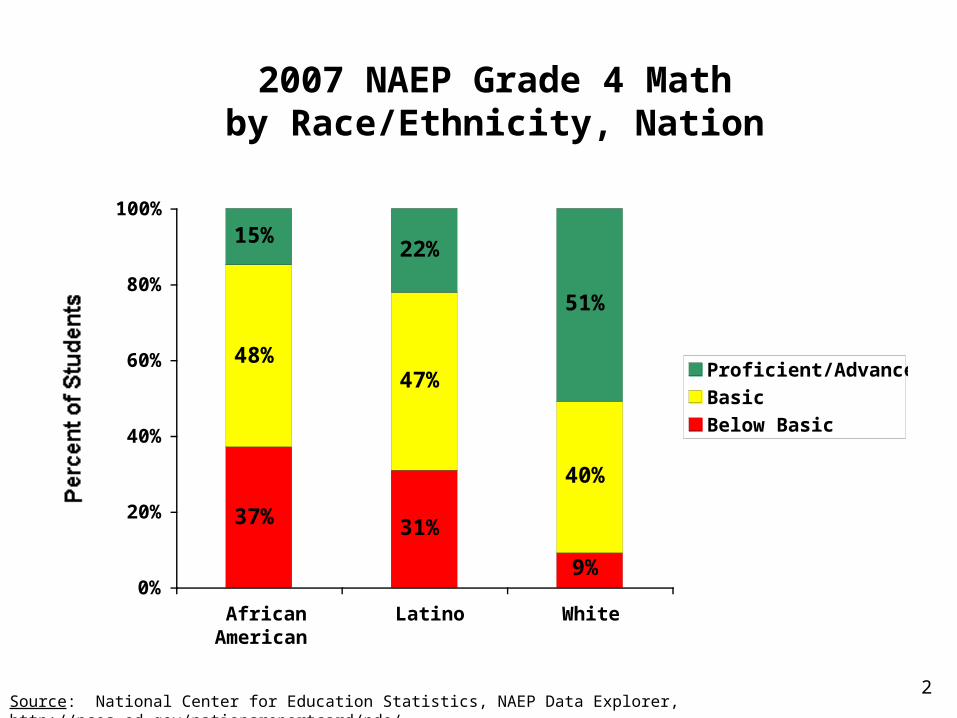
NAEP Grade 4 MathLow-Income Students, Nation
1996 compared to 2007
60%
30%
33%
48%
7%
22%
0%
20%
40%
60%
80%
100%
Low-Income Students 1996 Low-Income Students 2007
Percent of Students
Below Basic Basic Proficient/Advanced
Source: National Center for Education Statistics, NAEP Data Explorer, http://nces.ed.gov/nationsreportcard/nde/
4
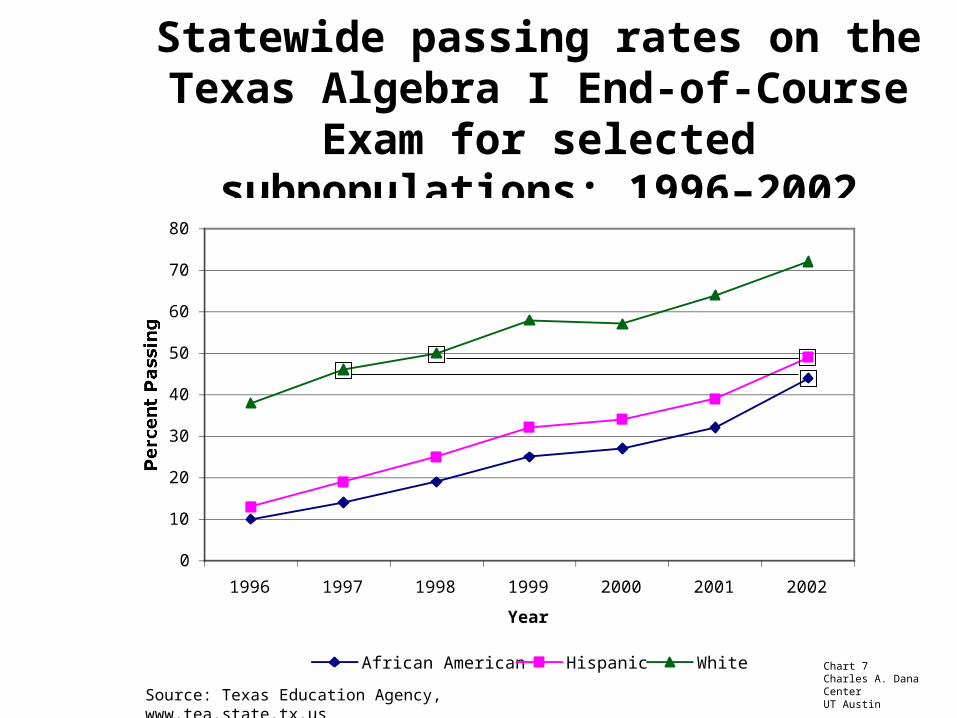
Source: Texas Education Agency, www.tea.state.tx.us
Statewide passing rates on the Texas Algebra I End-of-Course Exam for
selected subpopulations: 1996–2002
0
10
20
30
40
50
60
70
80
1996 1997 1998 1999 2000 2001 2002
Year
Percent Passing
African American Hispanic White Chart 7Charles A. Dana CenterUT Austin
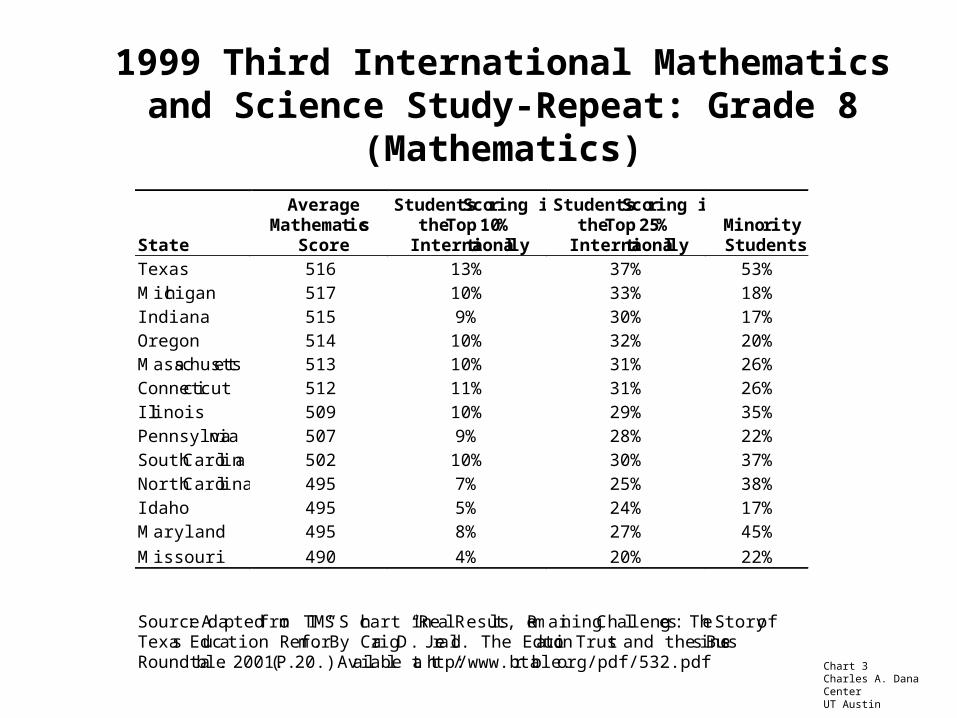
1999 Third International Mathematics and Science Study-Repeat: Grade 8 (Mathematics)
State
Average Mathematics
Score
Students Scoring in the Top 10%
Internationally
Students Scoring in the Top 25%
Internationally Minority Students
Texas 516 13% 37% 53%
Michigan 517 10% 33% 18%
Indiana 515 9% 30% 17%
Oregon 514 10% 32% 20% Massachusetts 513 10% 31% 26%
Connecticut 512 11% 31% 26%
Illinois 509 10% 29% 35%
Pennsylvania 507 9% 28% 22%
South Carolina 502 10% 30% 37%
North Carolina 495 7% 25% 38%
Idaho 495 5% 24% 17%
Maryland 495 8% 27% 45%
Missouri 490 4% 20% 22%
Source: Adapted from TIMSS chart in “Real Results, Remaining Challenges: The Story of Texas Education Reform.” By Craig D. Jerald. The Education Trust and the Business Roundtable. 2001. (P. 20.) Av ailable at http://www.brtable.org/pdf/532.pdf
Chart 3Charles A. Dana CenterUT Austin
7
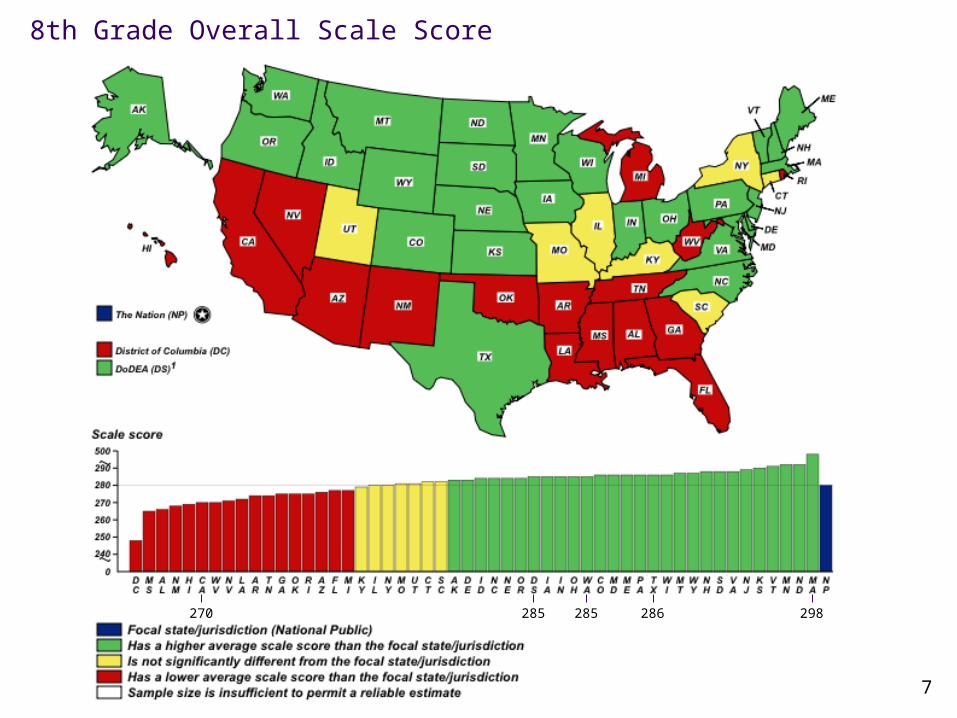
8th Grade Overall Scale Score
270 285 285 286 298

8
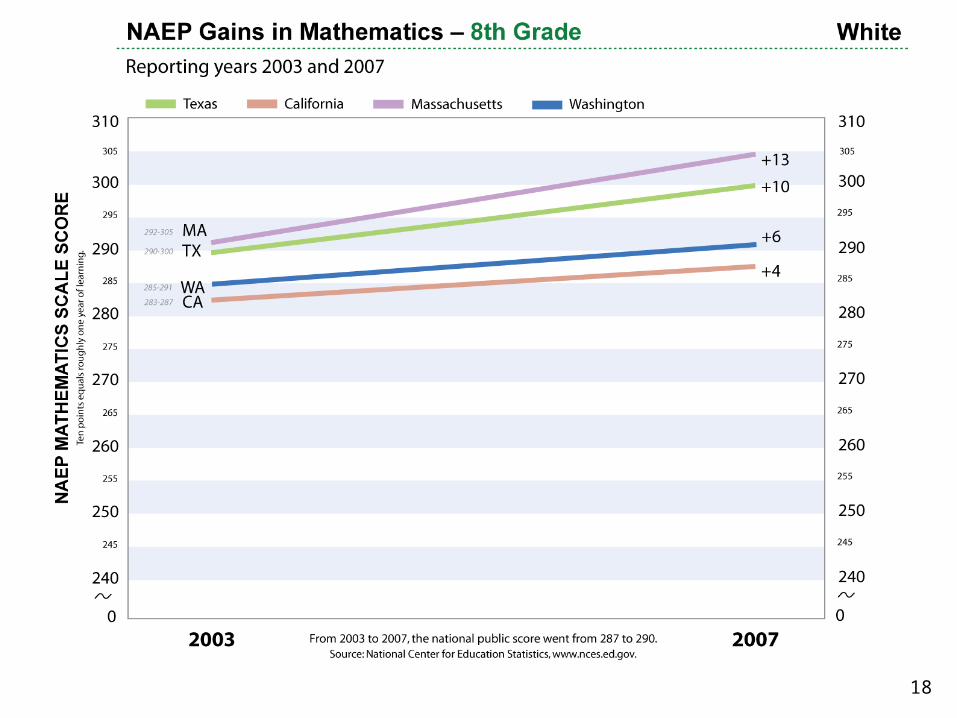
8th Grade White
287 291 291 300
305
9
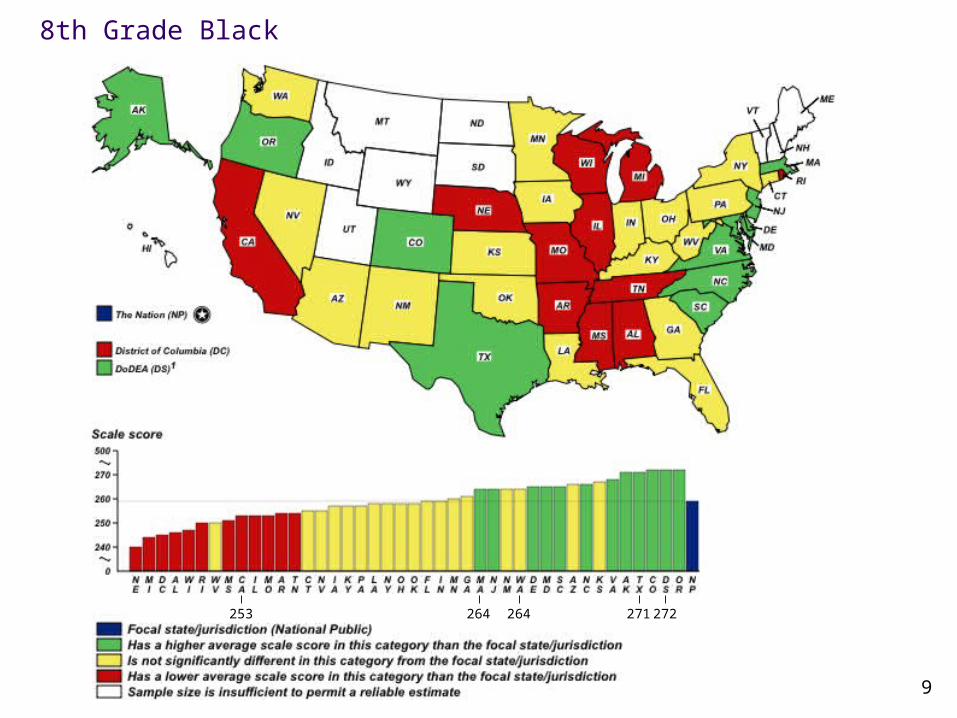
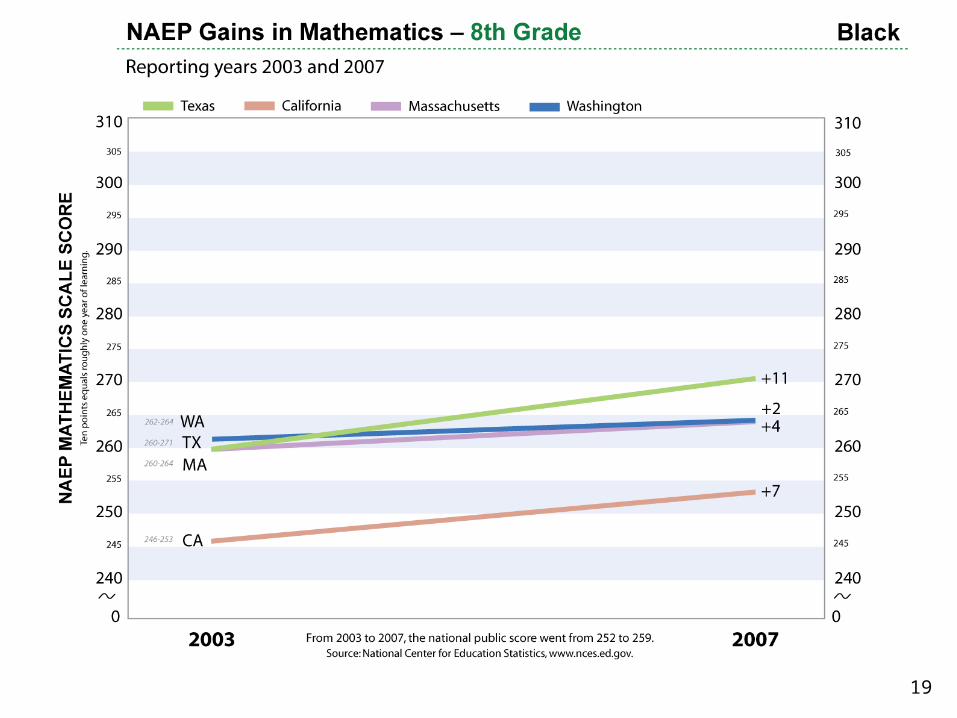
8th Grade Black
253 264 264 271 272
10
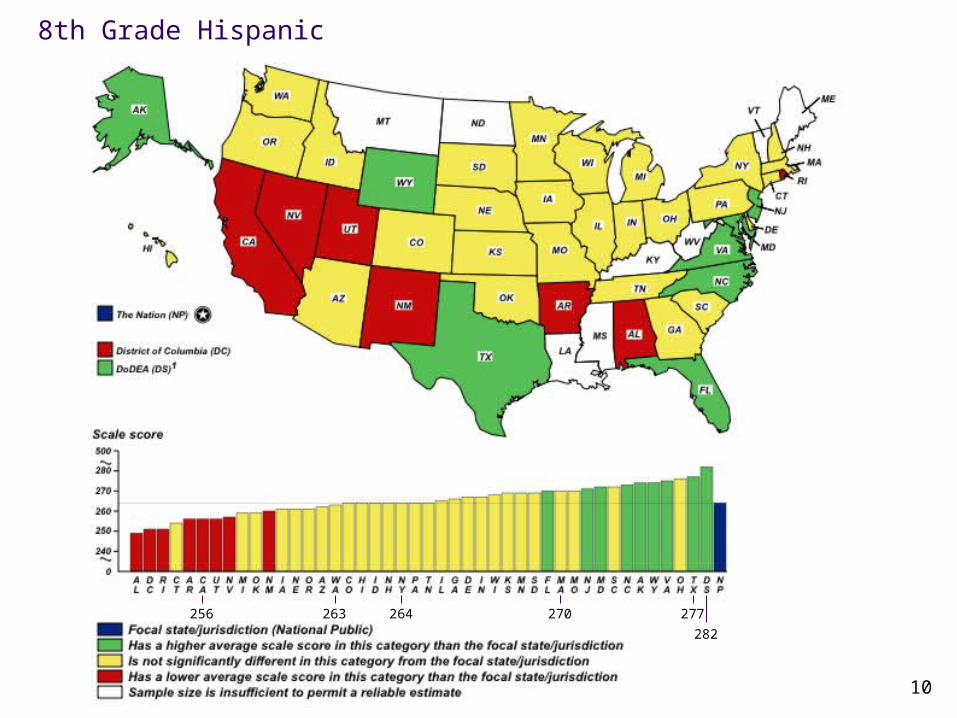
8th Grade Hispanic
256 263 264 270 277
282

11
8th Grade Eligible for National School Lunch Program
257 268 275 275 DS – reporting standards not met
12
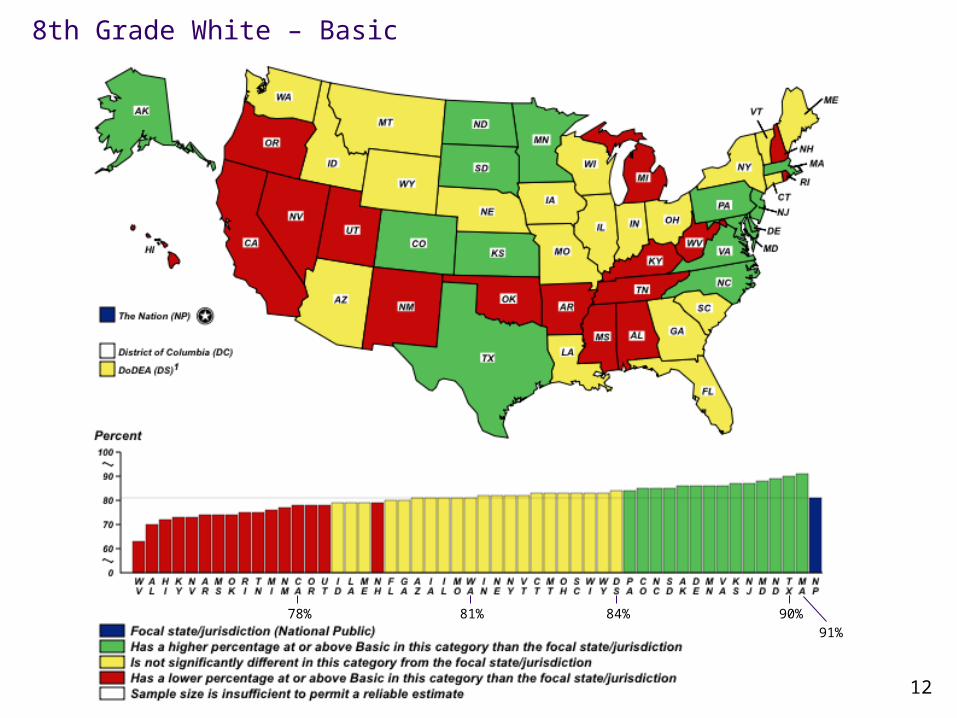
8th Grade White – Basic
78% 81% 90%84%
91%
13
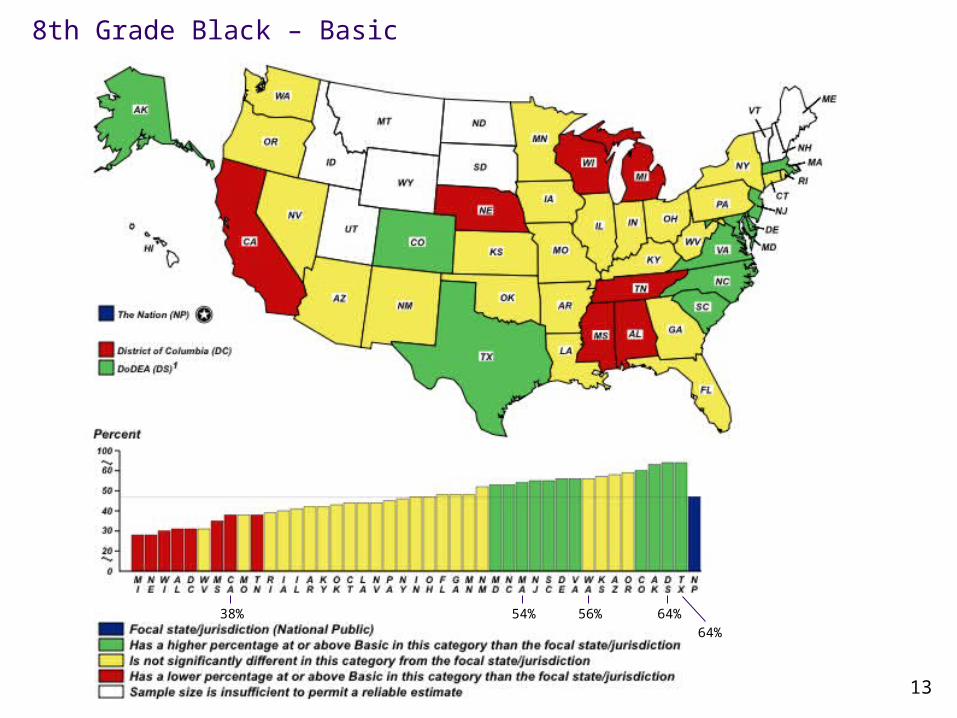
8th Grade Black – Basic
38% 54% 64%56%
64%
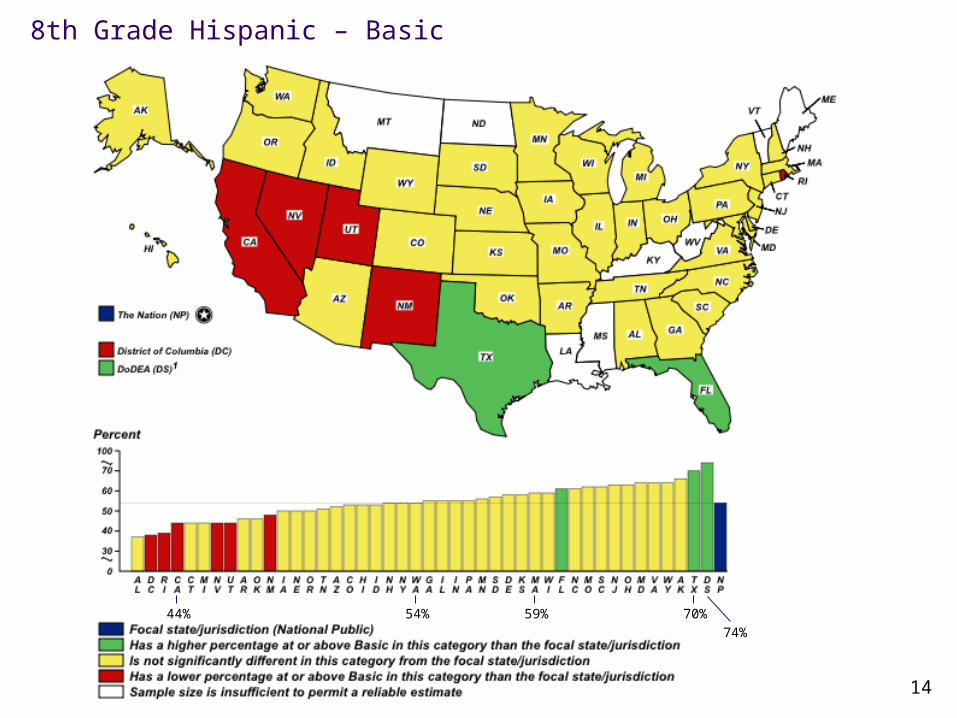
14
8th Grade Hispanic – Basic
44% 59% 70%
74%
54%
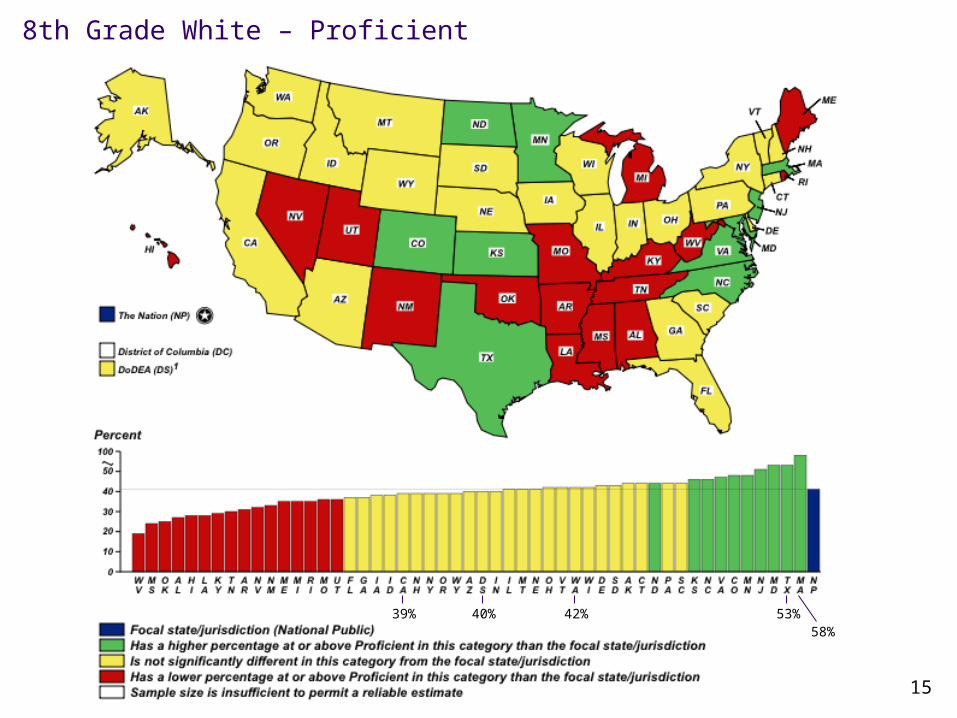
15
8th Grade White – Proficient
39%58%
42% 53%40%
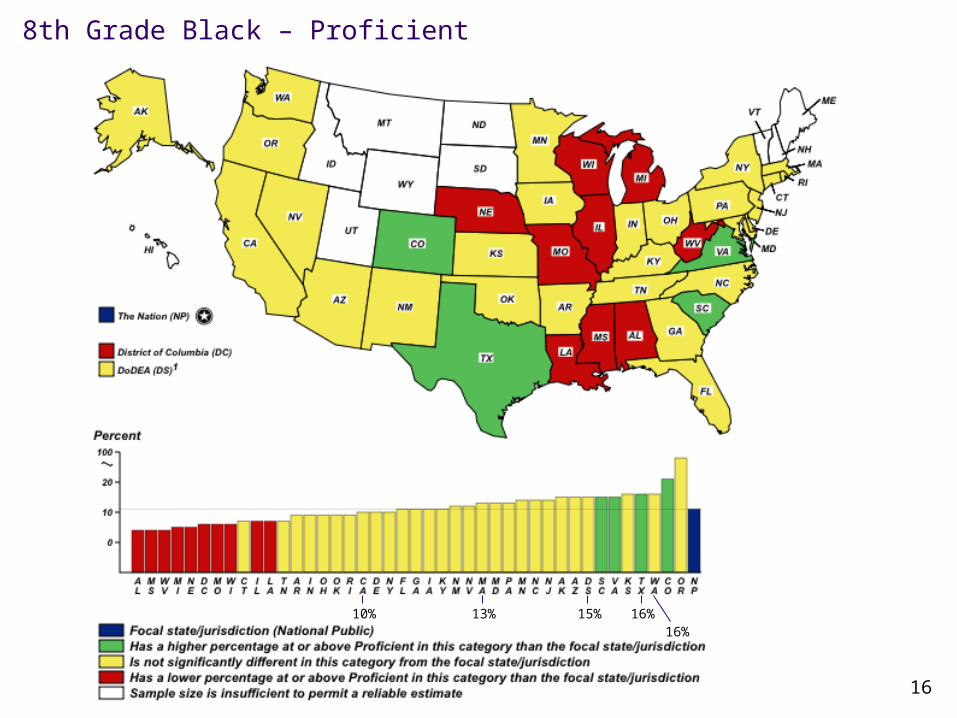
16
8th Grade Black – Proficient
10%16%
15% 16%13%

17
8th Grade Hispanic – Proficient
13% 28%19% 23%10%
18
19

20

21
22
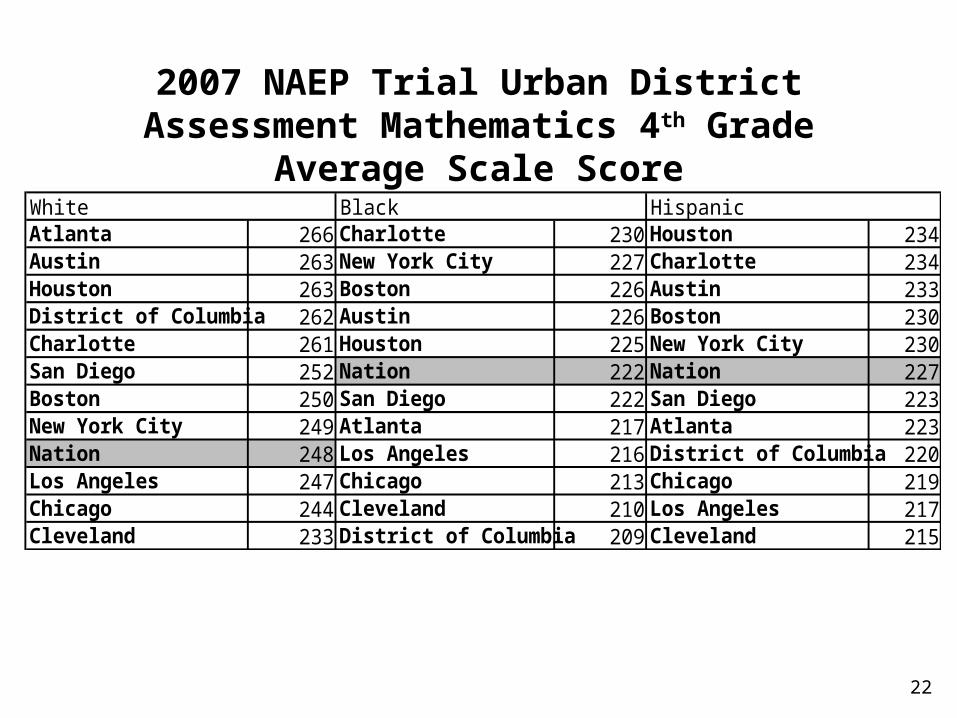
2007 NAEP Trial Urban District Assessment Mathematics 4th Grade Average Scale Score
Atlanta 266 Charlotte 230 Houston 234Austin 263 New York City 227 Charlotte 234Houston 263 Boston 226 Austin 233District of Columbia 262 Austin 226 Boston 230Charlotte 261 Houston 225 New York City 230San Diego 252 Nation 222 Nation 227Boston 250 San Diego 222 San Diego 223New York City 249 Atlanta 217 Atlanta 223Nation 248 Los Angeles 216 District of Columbia 220Los Angeles 247 Chicago 213 Chicago 219Chicago 244 Cleveland 210 Los Angeles 217Cleveland 233 District of Columbia 209 Cleveland 215
White Black Hispanic
23
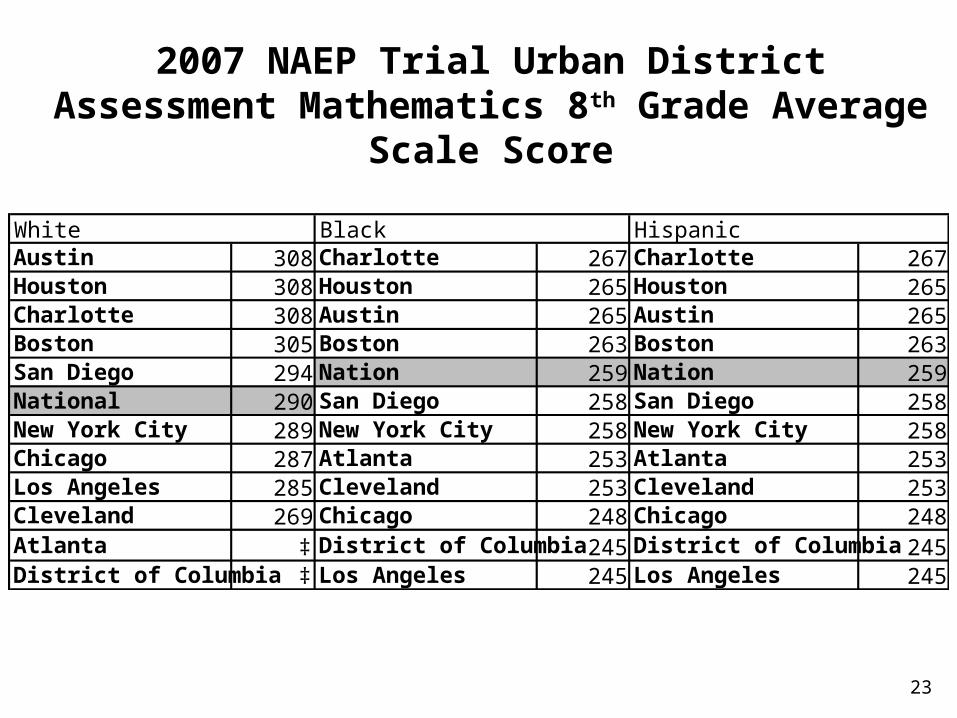
2007 NAEP Trial Urban District Assessment Mathematics 8th Grade Average Scale Score
Austin 308 Charlotte 267 Charlotte 267Houston 308 Houston 265 Houston 265Charlotte 308 Austin 265 Austin 265Boston 305 Boston 263 Boston 263San Diego 294 Nation 259 Nation 259National 290 San Diego 258 San Diego 258New York City 289 New York City 258 New York City 258Chicago 287 Atlanta 253 Atlanta 253Los Angeles 285 Cleveland 253 Cleveland 253Cleveland 269 Chicago 248 Chicago 248Atlanta ‡ District of Columbia 245 District of Columbia 245District of Columbia ‡ Los Angeles 245 Los Angeles 245
HispanicBlackWhite
24
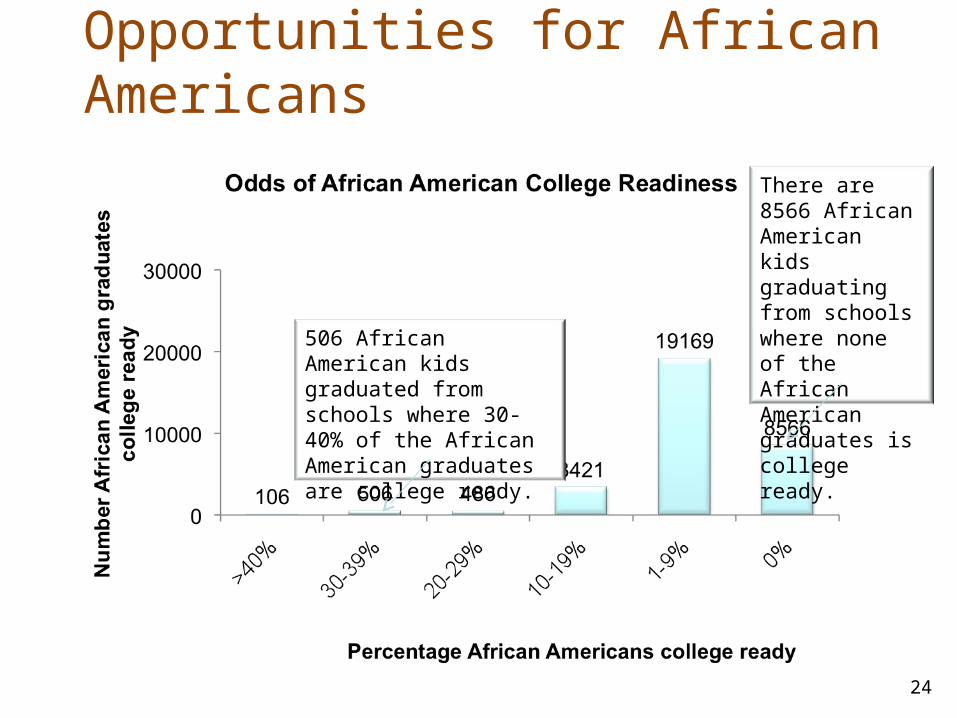
There are 8566 African American kids graduating from schools where none of the African American graduates is college ready.
506 African American kids graduated from schools where 30-40% of the African American graduates are college ready.
Opportunities for African Americans

25
Opportunities for Hispanics
26
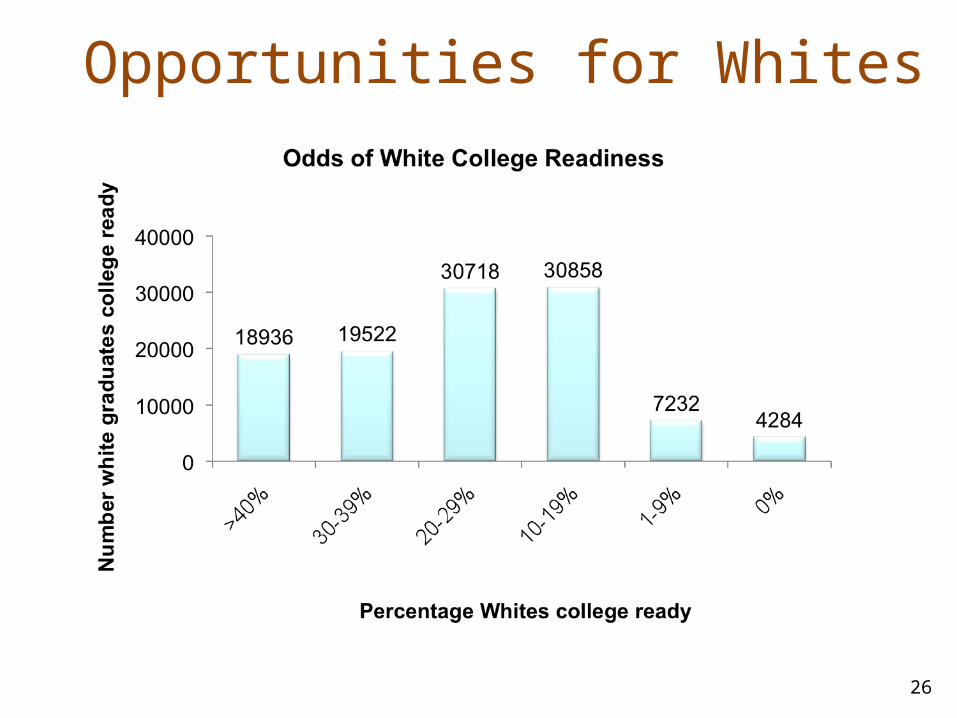
Opportunities for Whites
Aspects of Motivation
• A desire to be competent at math (as opposed to deidentification or divestment).
(Competence Valuation)• A belief that math competence can be developed over time (is malleable, not
fixed). (Implicit Theory)• An ascription of math success and failure to task-specific causes (e.g., effort),
rather than global causes (intelligence or lack thereof). (Attribution)• A perception that one’s competence at math is increasing (not necessarily that it
is high, which is clearly out of reach for many, and highlights a normative rather than an intrapersonal standard of evaluation). (Perceived Competence)
• A commitment to pursuing competence without trying to avoid incompetence (specifically, the pursuit of mastery-approach goals without the pursuit of mastery-avoidance or performance-avoidance goals). (Achievement Goal)
• A feeling of interest in and enjoyment of math (Intrinsic Motivation -- subjective).• A decision to continue in math (Intrinsic Motivation -- behavioral).
27
Top Related