


Languages
Pages
Legal


Dark Pools Stock Analysis
Carla JenkinsECON 643 Presentation

Definitions
• Dark pools: Private exchanges which trades are inaccessible to the public. – Investopedia• Algorithm Trading (High Frequency Trading)- A trading system that
utilizes very advanced mathematical models for making transaction decisions in the financial markets. - Investopedia

Dark Pools Features
• Little transparency of trade execution• Trades executed within the spread• Bid: A price someone is willing to buy a stock at• Offer: A price someone is willing to sell at
• Owned by a bank or broker• Tend to operate on the margins and at the penny and sub-penny
levels

Algorithm Trading Features
• Run by fast computer algorithms. These algorithms try to catch tiny differences in the price of the stock. It can be just a penny or even a fraction of a penny. • This very small fractions of pennies are why dark pools and algorithm trading
can very volatile.
• Fast computers are co-located with exchanges.• Use of special order types.• Special order types: Complex buy/sell orders used by algorithm trading
programs. –Dark Pools and High Frequency Trading for Dummies, 2015

Data Features
• Use Financial Industry Regulatory Authority (FINRA) Second Quarter 2014 through Fourth Quarter 2014• Tier 1: Standard & Poors 500, Russell 1000 exchanges• Tier 2: Non-exchange stocks (individual stocks)• Most quarterly data contain in between 43-45 observations
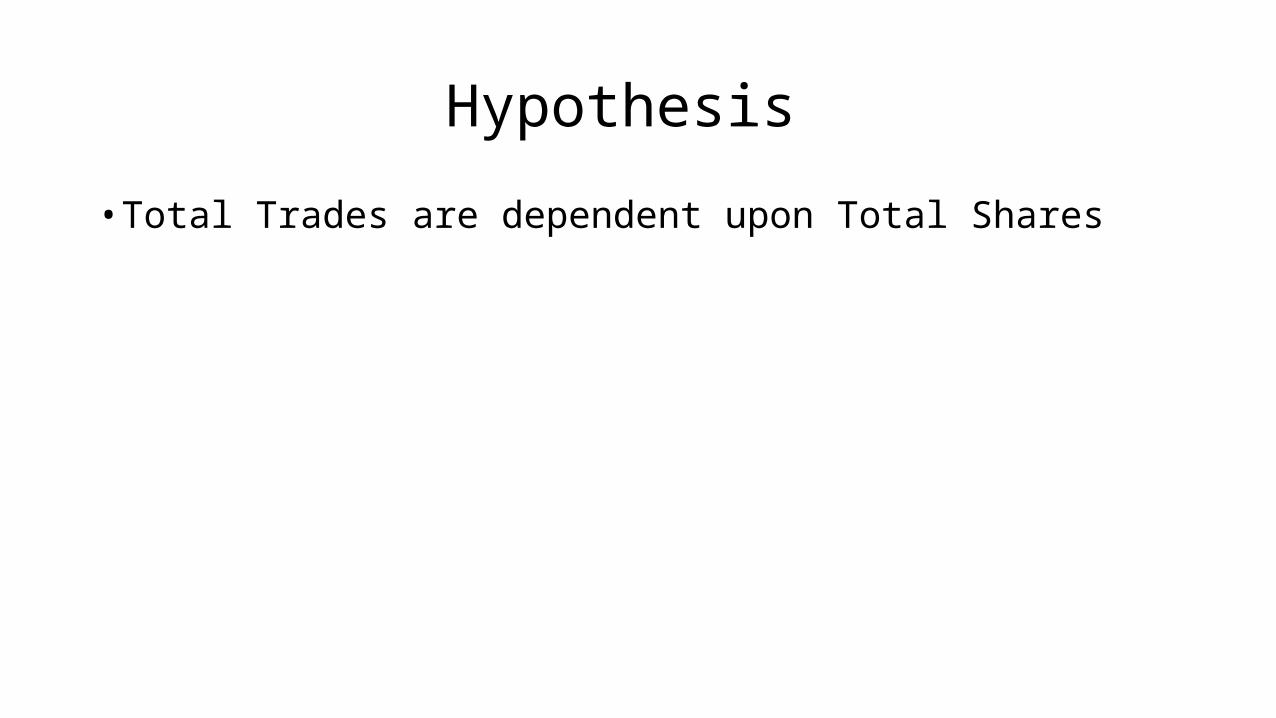
Hypothesis
• Total Trades are dependent upon Total Shares

Why Does This Project Interests Me?
• Dark pools are new and use algorithm trading (high frequency trading)• They aren’t regulated as lit exchanges (NYSE, NASDAQ, AMEX)• Lack of transparency• How machine learning and algorithm trading affect stock markets

Data Characteristics Summary
• TotalShares variable measures the total shares available for trade by a particular fund. • TotalTrades variable measures the total trades made by a particular
fund.• There is a lot of variation between companies.• Credit Suisse Tier 1 total shares are over 2 billion• TripleShot Tier 1 total shares are 50,000• Example of this variation is on the next page.

2nd Quarter 2014 Tier 1 TotalTrades Summary Statistics
Total Trades
-------------------------------------------------------------
Percentiles Smallest
1% 2 2
5% 430 214
10% 2678 430 Obs 45
25% 32709 1370 Sum of Wgt. 45
50% 659081 Mean 4512511
Largest Std. Dev. 1.52e+07
75% 2474388 1.02e+07
90% 7708805 1.35e+07 Variance 2.31e+14
95% 1.35e+07 1.42e+07 Skewness 5.971082
99% 1.02e+08 1.02e+08 Kurtosis 38.5594

Preview of Results
• All of my trade vs. shares regressions results are statistically significant
Results
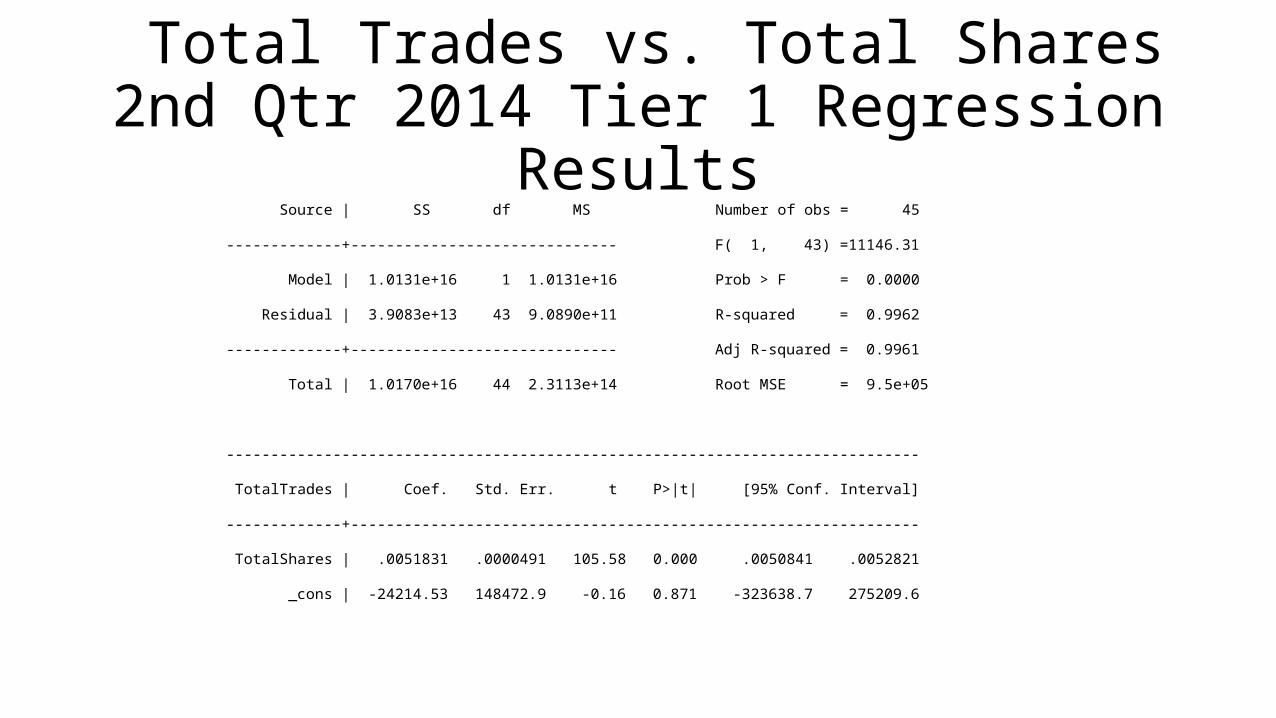
Total Trades vs. Total Shares 2nd Qtr 2014 Tier 1 Regression Results
Source | SS df MS Number of obs = 45
-------------+------------------------------ F( 1, 43) =11146.31
Model | 1.0131e+16 1 1.0131e+16 Prob > F = 0.0000
Residual | 3.9083e+13 43 9.0890e+11 R-squared = 0.9962
-------------+------------------------------ Adj R-squared = 0.9961
Total | 1.0170e+16 44 2.3113e+14 Root MSE = 9.5e+05
------------------------------------------------------------------------------
TotalTrades | Coef. Std. Err. t P>|t| [95% Conf. Interval]
-------------+----------------------------------------------------------------
TotalShares | .0051831 .0000491 105.58 0.000 .0050841 .0052821
_cons | -24214.53 148472.9 -0.16 0.871 -323638.7 275209.6
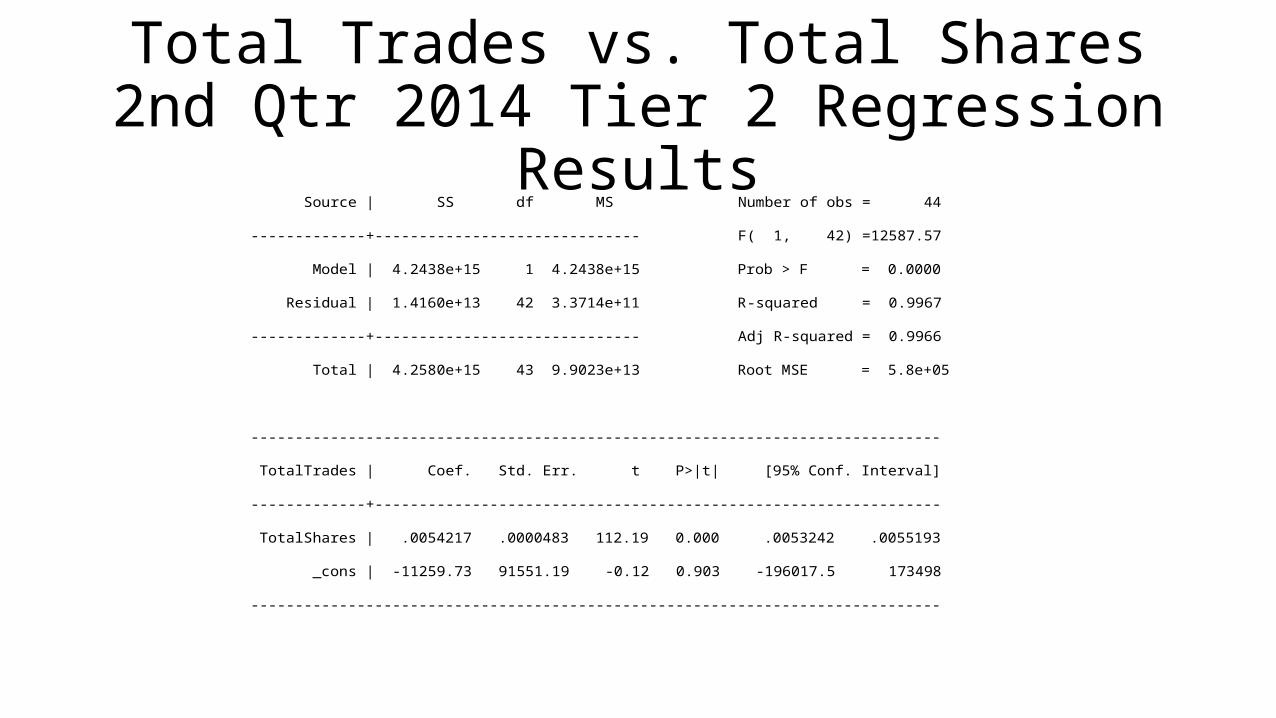
Total Trades vs. Total Shares 2nd Qtr 2014 Tier 2 Regression Results
Source | SS df MS Number of obs = 44
-------------+------------------------------ F( 1, 42) =12587.57
Model | 4.2438e+15 1 4.2438e+15 Prob > F = 0.0000
Residual | 1.4160e+13 42 3.3714e+11 R-squared = 0.9967
-------------+------------------------------ Adj R-squared = 0.9966
Total | 4.2580e+15 43 9.9023e+13 Root MSE = 5.8e+05
------------------------------------------------------------------------------
TotalTrades | Coef. Std. Err. t P>|t| [95% Conf. Interval]
-------------+----------------------------------------------------------------
TotalShares | .0054217 .0000483 112.19 0.000 .0053242 .0055193
_cons | -11259.73 91551.19 -0.12 0.903 -196017.5 173498
------------------------------------------------------------------------------
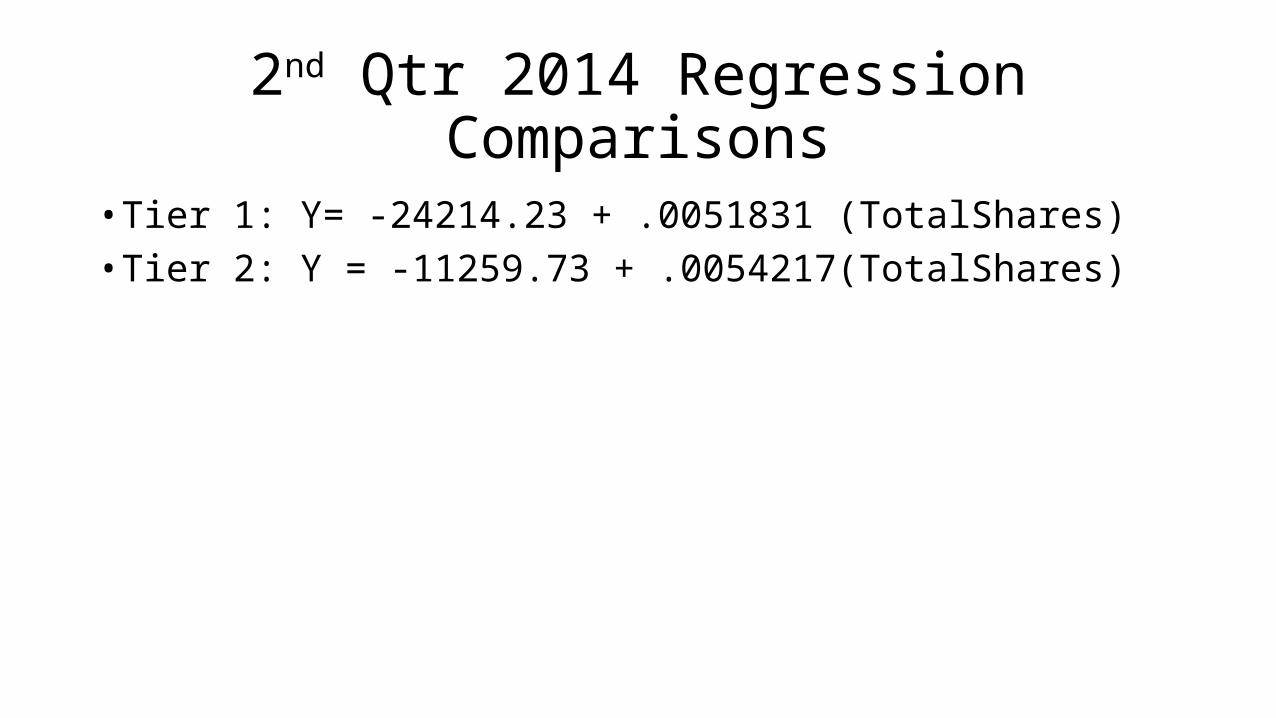
2nd Qtr 2014 Regression Comparisons
• Tier 1: Y= -24214.23 + .0051831 (TotalShares)• Tier 2: Y = -11259.73 + .0054217(TotalShares)

Total Trades vs. Total Shares 3rd Qtr 2014
Tier 1 Regression Results Source | SS df MS Number of obs = 43
-------------+------------------------------ F( 1, 41) = 8385.45
Model | 3.2401e+16 1 3.2401e+16 Prob > F = 0.0000
Residual | 1.5842e+14 41 3.8640e+12 R-squared = 0.9951
-------------+------------------------------ Adj R-squared = 0.9950
Total | 3.2560e+16 42 7.7524e+14 Root MSE = 2.0e+06
------------------------------------------------------------------------------
TotalTrades | Coef. Std. Err. t P>|t| [95% Conf. Interval]
-------------+----------------------------------------------------------------
TotalShares | .0049467 .000054 91.57 0.000 .0048376 .0050558
_cons | -54656.52 313844.3 -0.17 0.863 -688477.9 579164.9
------------------------------------------------------------------------------

Total Trades vs. Total Shares 3rd Qtr 2014
Tier 2 Regression Results Source | SS df MS Number of obs = 42
-------------+------------------------------ F( 1, 40) =10296.99
Model | 1.1391e+16 1 1.1391e+16 Prob > F = 0.0000
Residual | 4.4248e+13 40 1.1062e+12 R-squared = 0.9961
-------------+------------------------------ Adj R-squared = 0.9960
Total | 1.1435e+16 41 2.7890e+14 Root MSE = 1.1e+06
------------------------------------------------------------------------------
TotalTrades | Coef. Std. Err. t P>|t| [95% Conf. Interval]
-------------+----------------------------------------------------------------
TotalShares | .0051904 .0000511 101.47 0.000 .005087 .0052937
_cons | -23376.99 170117.5 -0.14 0.891 -367197.3 320443.3
------------------------------------------------------------------------------

3rd Qtr 2014 Regression Comparisons
• Tier 1: Y= -54656.52 + .0049467 (TotalShares)• Tier 2: Y = -23376.99 + .0051904(TotalShares)
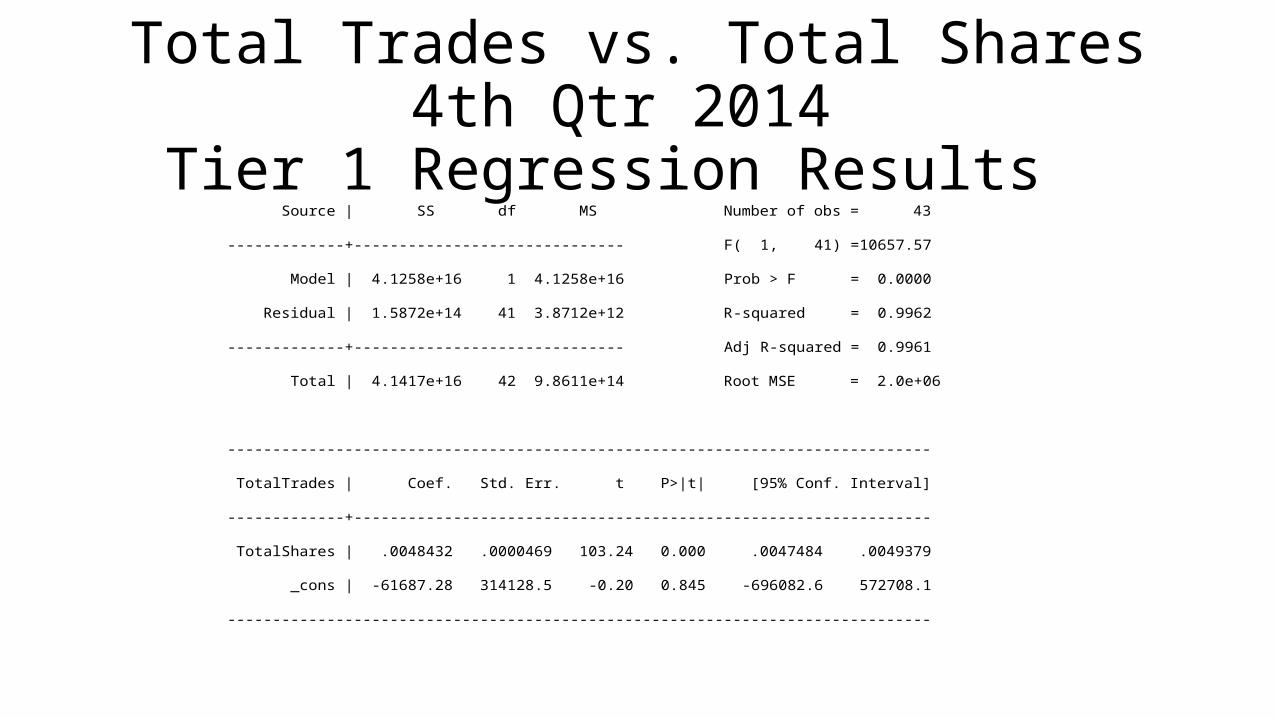
Total Trades vs. Total Shares 4th Qtr 2014
Tier 1 Regression Results Source | SS df MS Number of obs = 43
-------------+------------------------------ F( 1, 41) =10657.57
Model | 4.1258e+16 1 4.1258e+16 Prob > F = 0.0000
Residual | 1.5872e+14 41 3.8712e+12 R-squared = 0.9962
-------------+------------------------------ Adj R-squared = 0.9961
Total | 4.1417e+16 42 9.8611e+14 Root MSE = 2.0e+06
------------------------------------------------------------------------------
TotalTrades | Coef. Std. Err. t P>|t| [95% Conf. Interval]
-------------+----------------------------------------------------------------
TotalShares | .0048432 .0000469 103.24 0.000 .0047484 .0049379
_cons | -61687.28 314128.5 -0.20 0.845 -696082.6 572708.1
------------------------------------------------------------------------------

Total Trades vs. Total Shares 4th Qtr 2014
Tier 2 Regression Results Source | SS df MS Number of obs = 41
-------------+------------------------------ F( 1, 39) = 9509.05
Model | 1.3693e+16 1 1.3693e+16 Prob > F = 0.0000
Residual | 5.6162e+13 39 1.4400e+12 R-squared = 0.9959
-------------+------------------------------ Adj R-squared = 0.9958
Total | 1.3750e+16 40 3.4374e+14 Root MSE = 1.2e+06
------------------------------------------------------------------------------
TotalTrades | Coef. Std. Err. t P>|t| [95% Conf. Interval]
-------------+----------------------------------------------------------------
TotalShares | .0048551 .0000498 97.51 0.000 .0047544 .0049558
_cons | -24225.25 196691.4 -0.12 0.903 -422071.1 373620.6
------------------------------------------------------------------------------
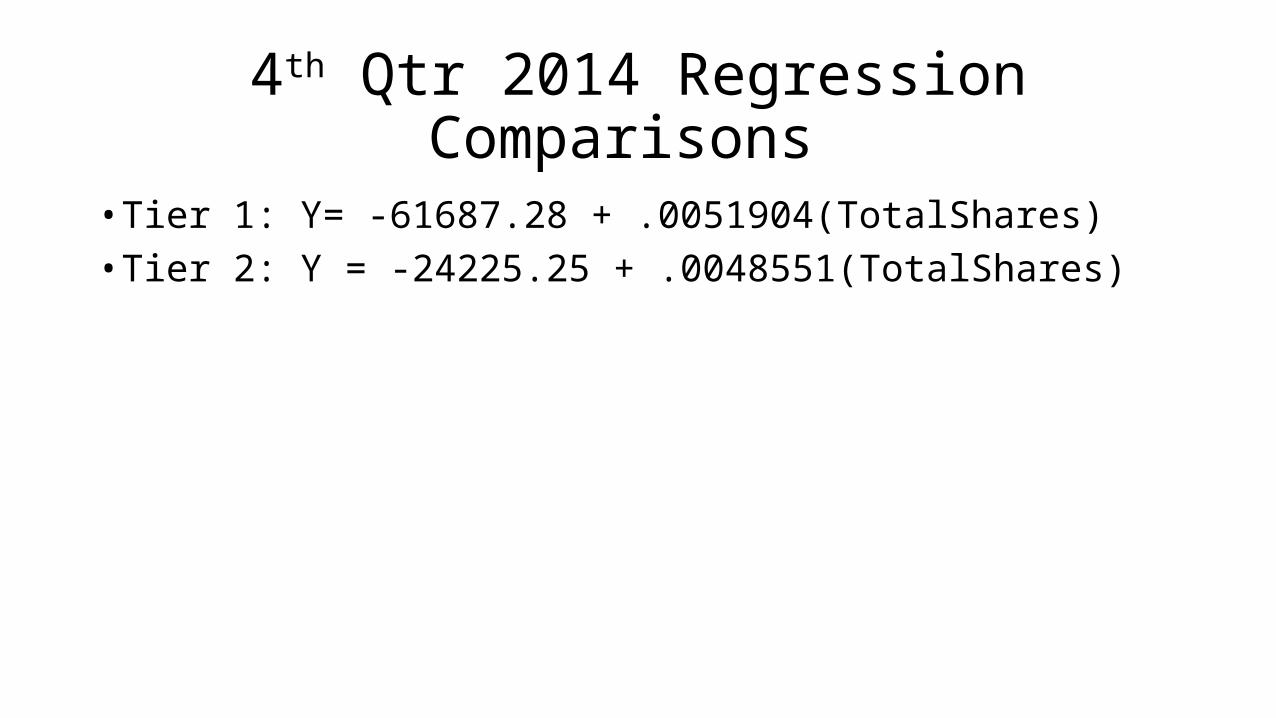
4th Qtr 2014 Regression Comparisons
• Tier 1: Y= -61687.28 + .0051904(TotalShares)• Tier 2: Y = -24225.25 + .0048551(TotalShares)

Observations
• Reject my first hypothesis that total trades variable is dependent upon total shares variable.• Wide variations resulting in outliers which can influence trends. • Tier 1’s beta with exchange stocks was higher than Tier 2’s beta with
individual stocks.
Top Related