


Languages
Pages
Legal


7/26/2019 033 Normal Distribution
http://slidepdf.com/reader/full/033-normal-distribution 1/21
با
قي ل ف و ت
وما
Normal Distribution“Awareness Program”
Dr. Att ia Hussi en Gom aa
Maintenance Engin eer ing Consultant
2008
Engin eer ing service - American Univers i ty in Cairo (AUC)

7/26/2019 033 Normal Distribution
http://slidepdf.com/reader/full/033-normal-distribution 2/21
Data Measurement
Lower SpecificationLimit
Upper SpecificationLimit
Histogram Plot
0$ 500$
N o .
o f M
i n o r M a i n t . W O s

7/26/2019 033 Normal Distribution
http://slidepdf.com/reader/full/033-normal-distribution 3/21
The Normal Distribution
By far the most important and widely used density curveis that describing the normal distribution. Thenormal distribution is the “bell curve” that is found in
many settings.
A normal distribution is symmetric, bell-shaped, and iscompletely defined by its mean, , and its standarddeviation, .
f( x) 1
2 e
1
2
x
2

7/26/2019 033 Normal Distribution
http://slidepdf.com/reader/full/033-normal-distribution 4/21
Mean & Standard Deviation
From:http://www.gifted.uconn.edu/siegle/research/Normal/instructornotes.html

7/26/2019 033 Normal Distribution
http://slidepdf.com/reader/full/033-normal-distribution 5/21
N(10,2)
N(12,2)
N(10,4)

7/26/2019 033 Normal Distribution
http://slidepdf.com/reader/full/033-normal-distribution 6/21
Process A B C
Mean 10 10 10
Range 6-14 8-12 9-11Variance 4 1 0.25
Sigma 2 1 0.50
7/26/2019 033 Normal Distribution
http://slidepdf.com/reader/full/033-normal-distribution 7/21
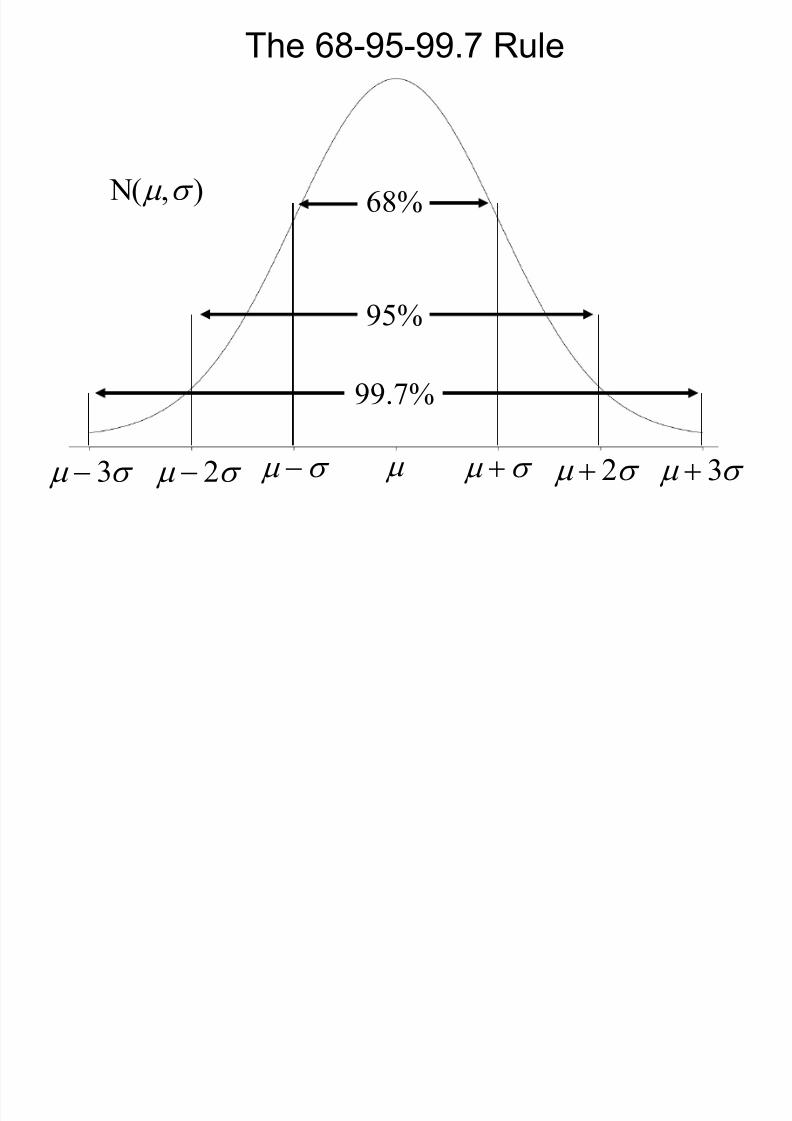
99.7%
95%
68%
2 3 2 3
The 68-95-99.7 Rule
N( , )
7/26/2019 033 Normal Distribution
http://slidepdf.com/reader/full/033-normal-distribution 8/21
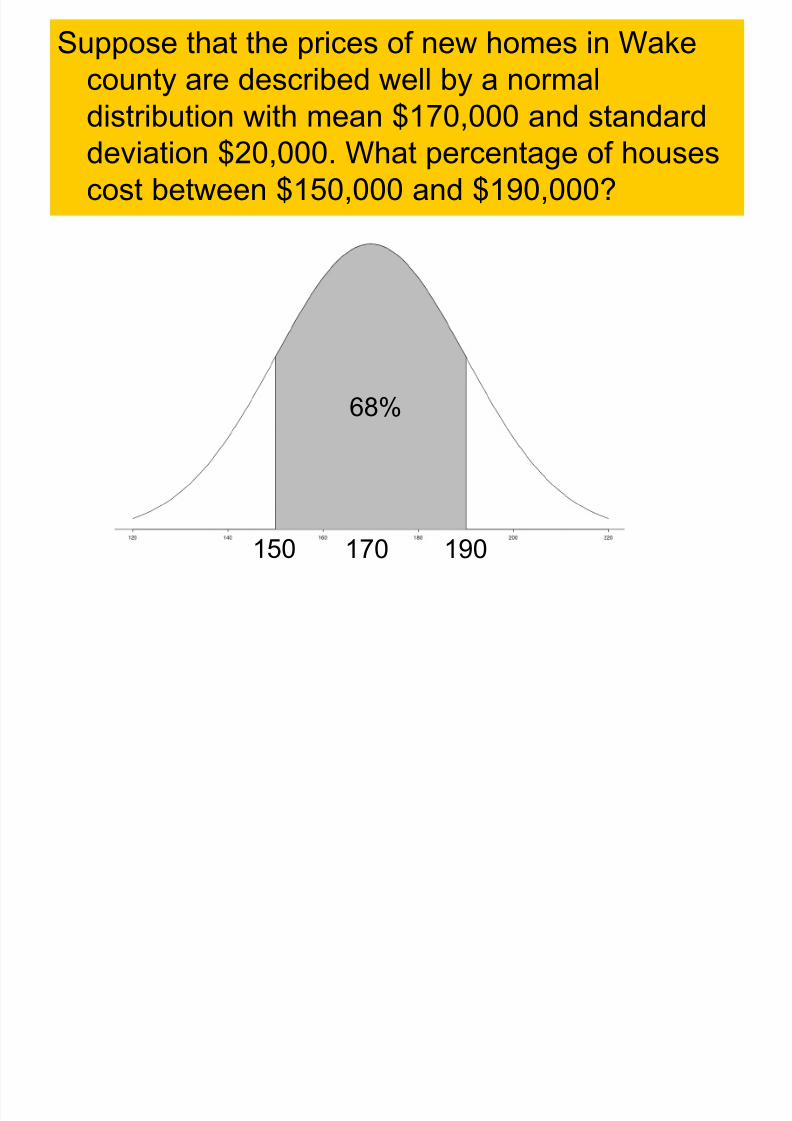
Suppose that the prices of new homes in Wakecounty are described well by a normaldistribution with mean $170,000 and standarddeviation $20,000. What percentage of housescost between $150,000 and $190,000?
150 190170
68%

7/26/2019 033 Normal Distribution
http://slidepdf.com/reader/full/033-normal-distribution 9/21
Suppose that the prices of new machines aredescribed well by a normal distribution withmean $170,000 and standard deviation$20,000. What percentage of machine cost lessthan $210,000?
170 210
50% 47.5%
50%+47.5%=97.5%
7/26/2019 033 Normal Distribution
http://slidepdf.com/reader/full/033-normal-distribution 10/21
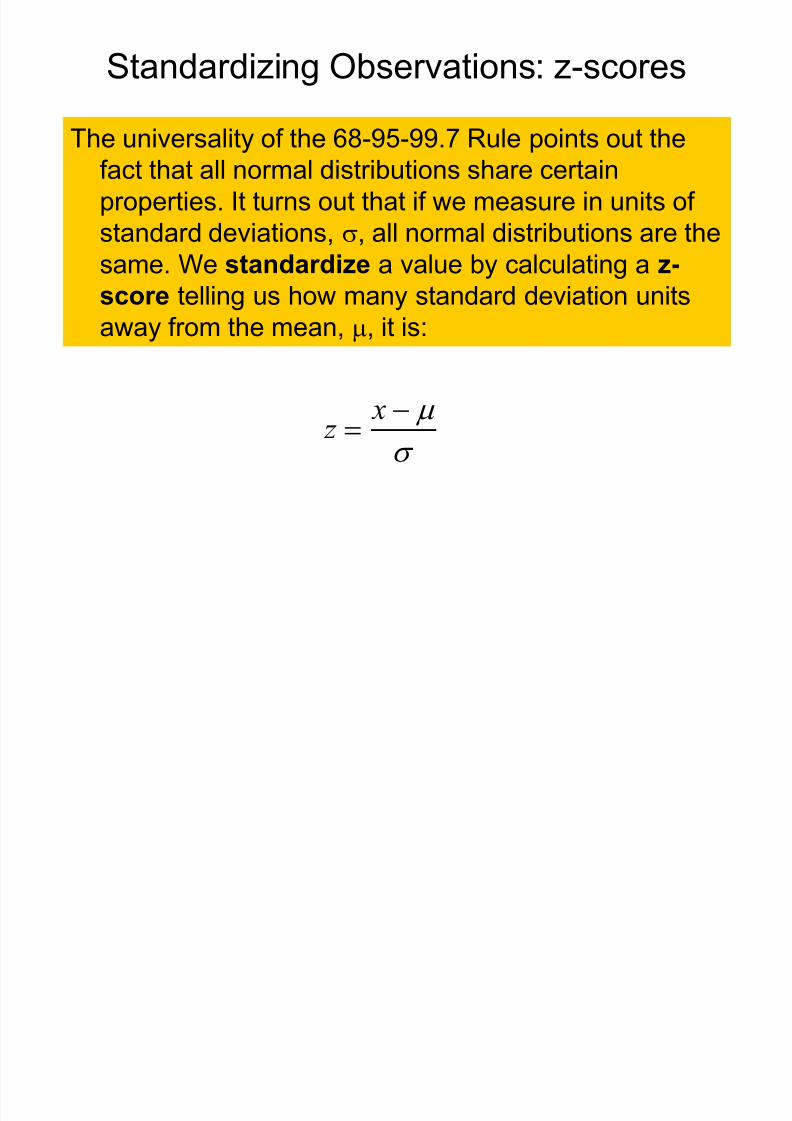
Standardizing Observations: z-scores
The universality of the 68-95-99.7 Rule points out thefact that all normal distributions share certainproperties. It turns out that if we measure in units ofstandard deviations, , all normal distributions are the
same. We standardize a value by calculating a z-score telling us how many standard deviation unitsaway from the mean, , it is:
z x

7/26/2019 033 Normal Distribution
http://slidepdf.com/reader/full/033-normal-distribution 11/21
Suppose that the prices of new machines aredescribed well by a normal distribution withmean $170,000 and standard deviation$20,000. What percentage of machine costbetween $150,000 and $190,000?
For $150,000: z
150,000 170,000
20,000 1
For $190,000: z
190,000 170,000
20,0001

7/26/2019 033 Normal Distribution
http://slidepdf.com/reader/full/033-normal-distribution 12/21
The Standard Normal Distribution
The N(0,1) distribution is called the standard normaldistribution. If a variable X has a N(, ) distribution,then the standardized variable
has a N(0,1) distribution. This property allows us tocarry out virtually all calculations involving normaldistributions by using the N(0,1) distribution.
Z X

7/26/2019 033 Normal Distribution
http://slidepdf.com/reader/full/033-normal-distribution 13/21

7/26/2019 033 Normal Distribution
http://slidepdf.com/reader/full/033-normal-distribution 14/21

7/26/2019 033 Normal Distribution
http://slidepdf.com/reader/full/033-normal-distribution 15/21
7/26/2019 033 Normal Distribution
http://slidepdf.com/reader/full/033-normal-distribution 16/21
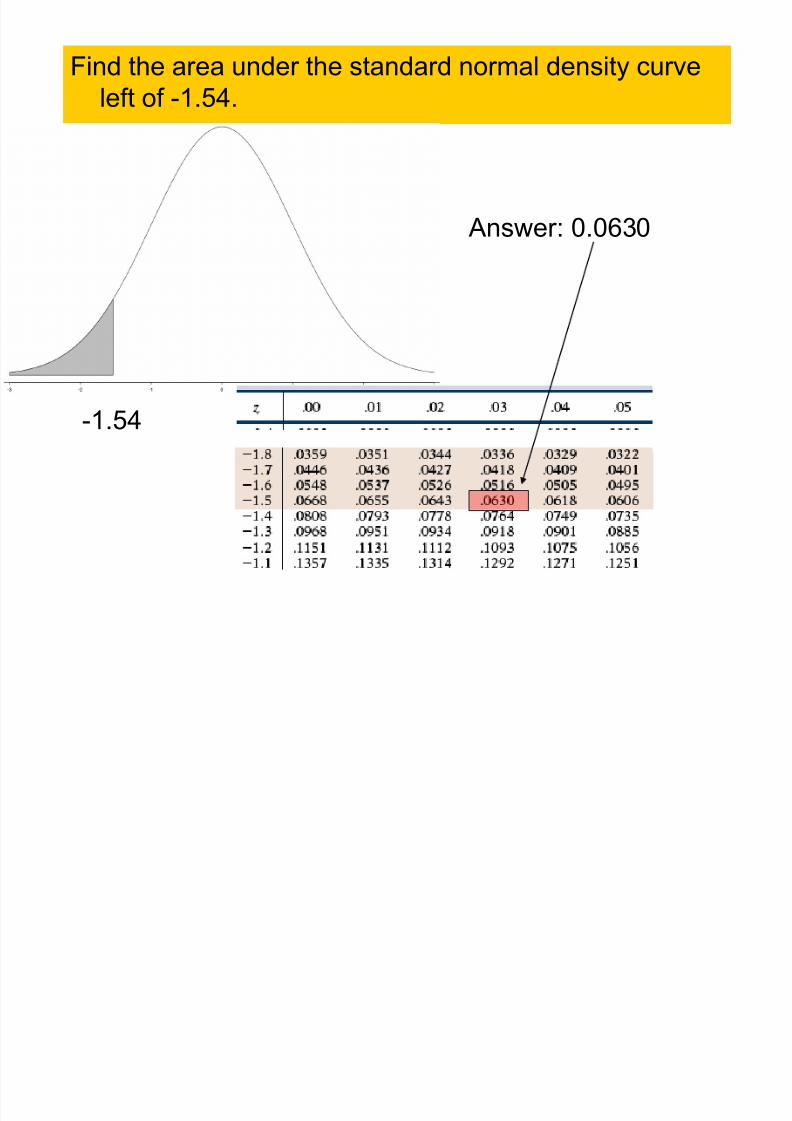
Find the area under the standard normal density curveleft of -1.54.
-1.54
Answer: 0.0630

7/26/2019 033 Normal Distribution
http://slidepdf.com/reader/full/033-normal-distribution 17/21
Weighting times on a customer service phone linefollow a normal distribution with mean 8 minutes andstandard deviation 2 minutes. What percentage of
callers wait more than 11 minutes?
z 1110
2
0.5
The area right of 11 is equal to 1minus the area left of 11, which isequal to 1 minus the area left of
0.5 under the N(0,1) curve. UsingTable A we find:
1 - 0.6915 = 0.3085
7/26/2019 033 Normal Distribution
http://slidepdf.com/reader/full/033-normal-distribution 18/21
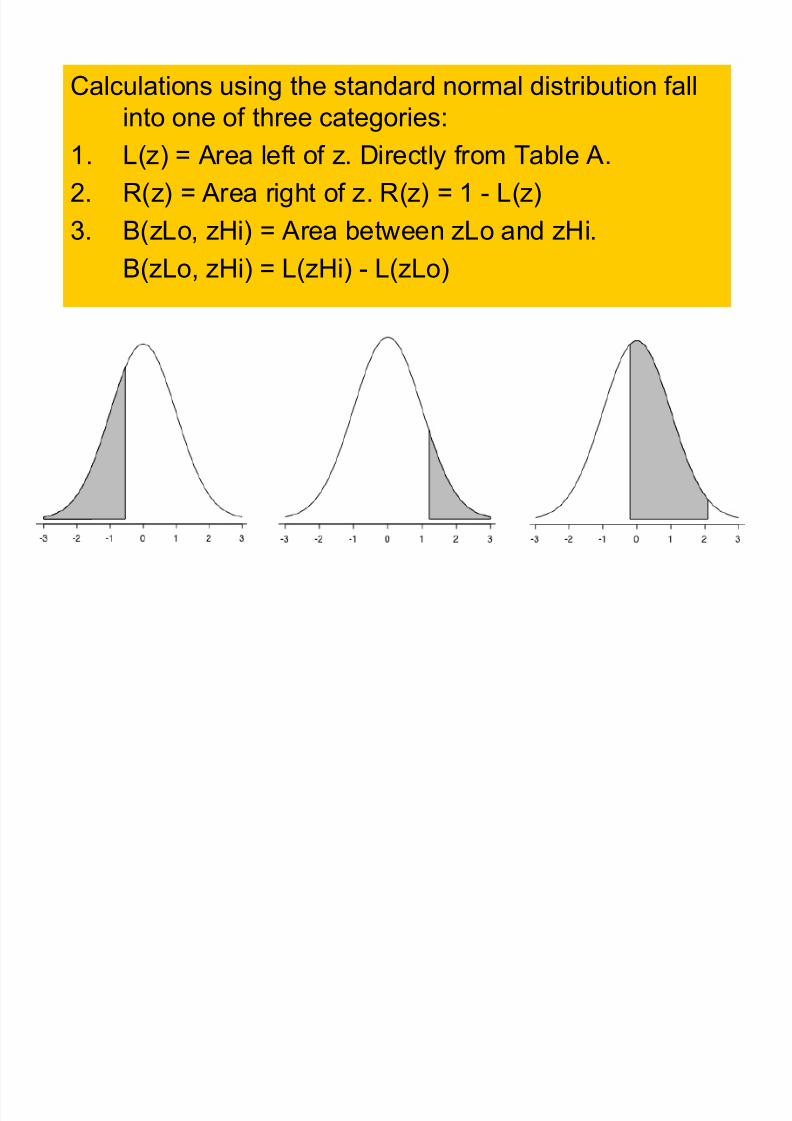
Calculations using the standard normal distribution fallinto one of three categories:
1. L(z) = Area left of z. Directly from Table A.
2. R(z) = Area right of z. R(z) = 1 - L(z)
3. B(zLo, zHi) = Area between zLo and zHi.
B(zLo, zHi) = L(zHi) - L(zLo)

7/26/2019 033 Normal Distribution
http://slidepdf.com/reader/full/033-normal-distribution 19/21
Weighting times on a customer service phone linefollow a normal distribution with mean 8 minutes andstandard deviation 2 minutes. Above what length are
the longest 25% of the calls?
0.25
?
Using Table A, we find that the z-scorecorresponding to R(z) = 0.25 is z=0.675.We can now invert the standardizationFormula to find the call length:
0.675 x 10
2
x 2 0.675 10 11.35
7/26/2019 033 Normal Distribution
http://slidepdf.com/reader/full/033-normal-distribution 20/21
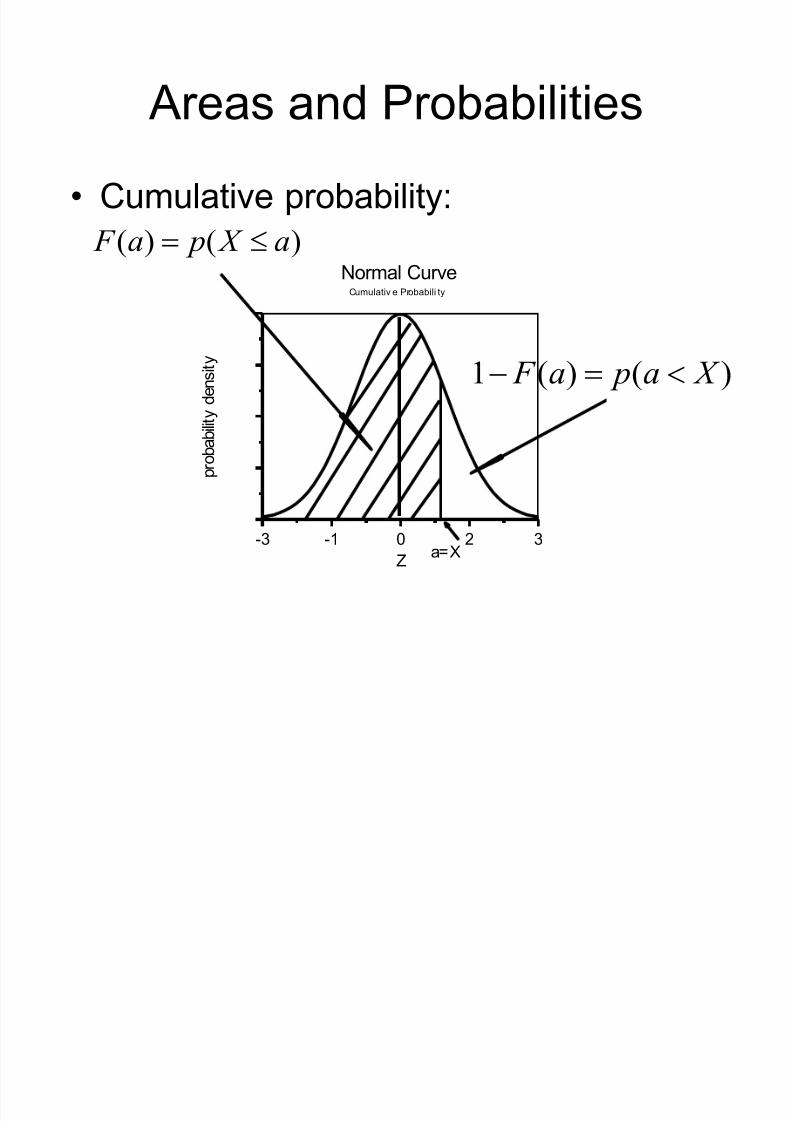
Areas and Probabilities
• Cumulative probability:)()( a X pa F
320-1-3
Z
p r o b a b i l i t y
d e n s i t y
Normal CurveCumulativ e Probabili ty
a=X
)()(1 X a pa F
7/26/2019 033 Normal Distribution
http://slidepdf.com/reader/full/033-normal-distribution 21/21
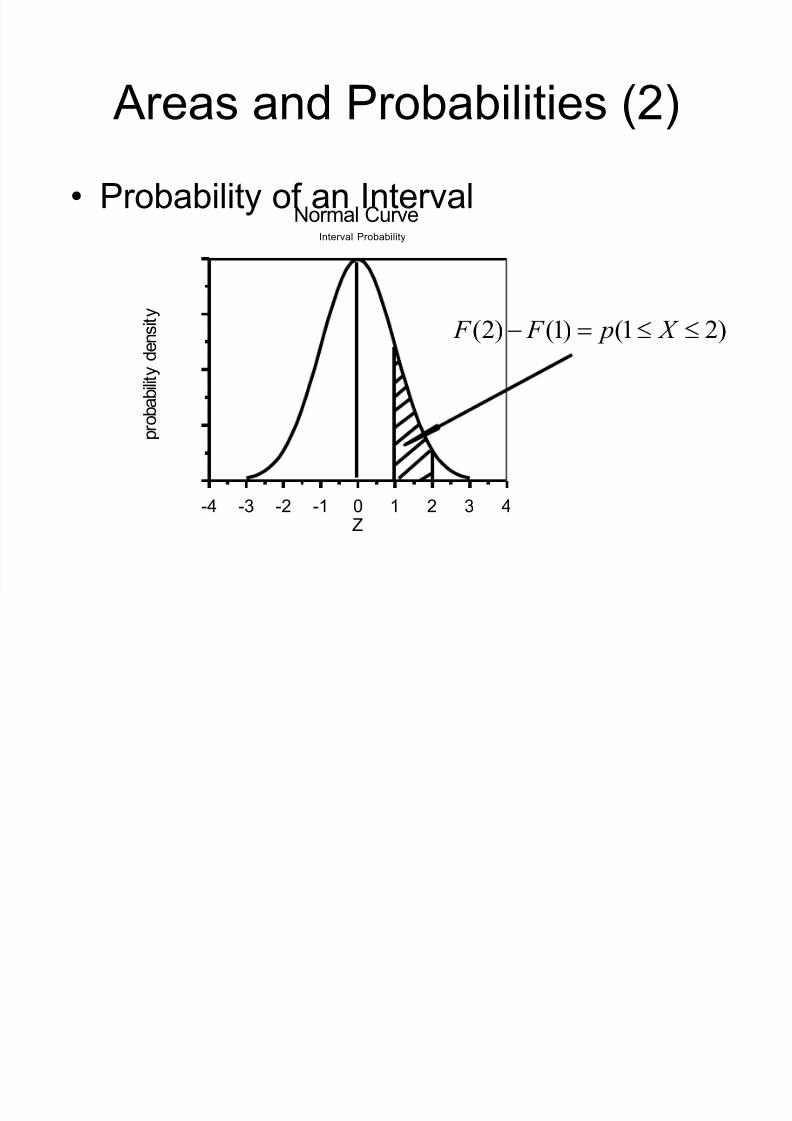
Areas and Probabilities (2)
• Probability of an Interval
43210-1-2-3-4Z
p r o b a b i l i t y
d e n s i t y
Normal CurveInterval Probability
)21()1()2( X p F F
Top Related