


Languages
Pages
Legal


0 Dhunseri 8 Dhunseri Petrochem Limited CIN : L15492WB1916PL0002697 Registered Office : Dhunseri House, 4A Woodburn Park, Kolkata 700020
Ref: DPL/AGM-10.08.2018
August 16, 2018
To, The Bombay Stock Exchange Limited (Scrip Code: 523736) Floor 25, P.J. Towers, Dalai Street, Mumbai - 400001
To, The National Stock Exchange of India Limited (Symbol: DPL) Exchange Plaza Plot No: C/1, G Block Bandra — Kurla Complex, Bandra (E) Mumbai — 400 051
Sub. : Annual Report for the FY 2017-18
Please find enclosed herewith Annual Report for FY 2017-18.
This is for your information and record.
Thanking You.
Yours faithfully, For Dhunseri Petrochem Limited
Simerpreet Gulati Company Secretary & Compliance Officer
Encl: As above
Ph : +91 33 2280 1950-54 I Fax : +91 33 2287 8995 E-mail : [email protected] I Website Address : www.aspetindia.com
DHUNSERIPETROCHEMLIMITED

Forward-looking statement
In this annual report, we have disclosed
investors to comprehend our prospects and take informed investment decisions.
and oral – that we periodically make, contain forward-looking statements that
performance.
We cannot guarantee that these forward-
Should known or unknown risks or
actual results could vary materially from
update any forward-looking statements,
future events or otherwise.
01Board's Report
31Corporate
Governance Report
51Auditors'
on Corporate Governance
52Independent
Auditors' Report on Standalone
Financial Statements
176Form
AOC-1
112Consolidated
Financials
107Independent
Auditors' Report on Consolidated
Financial Statements
58Standalone Financials

Annual Report 2017-18 | 1
The income of the Company during the year under review
lease rental income and royalty.
of this Report.
Dividend
Your Directors have recommended a dividend @ `3.50/- (Previous Year @ `2.00/-) per equity share of `10 /- each for the year ended
nd Annual Report of your Company together with the Audited Financial Statements for the year
Financial Results(` in Lakhs)
2017-18 2016-17
Turnover and other income 96,112.09 3,659.42
4,551.15 1,514.09
Interest 139.14 8.37
4,412.01 1,505.72
42.94 45.22
4,369.07 1,460.50
- (18,266.20)
4,369.07 (16,805.70)
539.19 1,465.65
169.08 (16,065.57)
- Adjustment for earlier years - -
3,660.80 (2,205.78)
33,828.05 37,703.05
3,660.80 (2,205.78)
Other Comprehensive Income (4.80) 17.97
Total Comprehensive Income for the Year 3,656.00 (2,187.81)
Dividends paid (700.50) (1400.99)
(142.60) (286.20)
Note: During the year there are no transfer to the General Reserve.

2 | Dhunseri Petrochem Limited
Director of your Company (in the category of Independent Director
Company recommend his appointment as the Independent Non-
CFO of the Company for a tenure of three years, w.e.f. April 1, 2018,
u/s 149(7) of the Companies Act, 2013 from all the Independent
directors of your Company specifying that they meet the criteria of
aligned as per IND AS and applied them consistently, made
the provisions of this Act for safeguarding the assets of the Company
(d) That the Directors prepared the annual accounts on a going
(e) That the Directors, had laid down Internal Financial Controls
for the Company and that such Internal Financial Controls are
(f) That the Directors had devised proper systems to ensure
Dhunseri Investments Limited is holding 55.79% of the equity
the said project is held up at present due to adverse market
Your Company has entered into a joint venture (“Agreement”)
making and selling the well known “UNO” Brand of Chicago
decided in future. The JV Company chosen for this purpose
is Tastetaria Private Limited “Tastetaria”, which was formed in
share capital of Tastetaria from your Company while your
Company would retain 25% of the share capital in Tastetaria.
Annual Report 2017-18 | 3
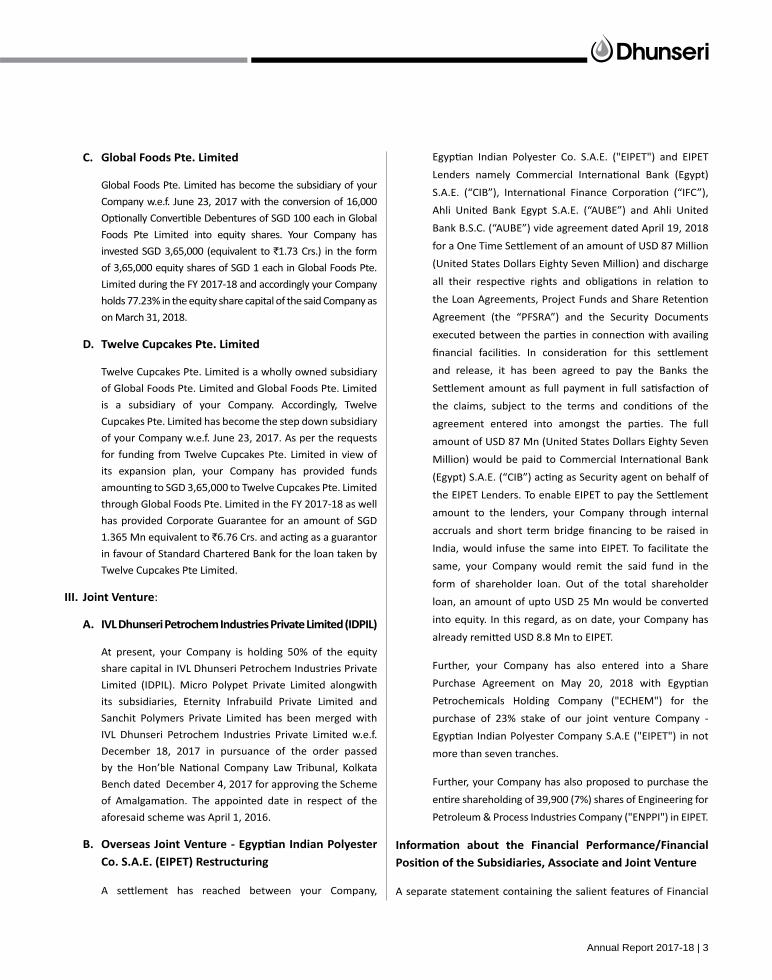
Company w.e.f. June 23, 2017 with the conversion of 16,000
Foods Pte Limited into equity shares. Your Company has
invested SGD 3,65,000 (equivalent to `1.73 Crs.) in the form
Limited during the FY 2017-18 and accordingly your Company
holds 77.23% in the equity share capital of the said Company as
of your Company w.e.f. June 23, 2017. As per the requests
for funding from Twelve Cupcakes Pte. Limited in view of
has provided Corporate Guarantee for an amount of SGD
`
Twelve Cupcakes Pte Limited.
:
At present, your Company is holding 50% of the equity
share capital in IVL Dhunseri Petrochem Industries Private
IVL Dhunseri Petrochem Industries Private Limited w.e.f.
aforesaid scheme was April 1, 2016.
Ahli United Bank Egypt S.A.E. (“AUBE”) and Ahli United
Bank B.S.C. (“AUBE”) vide agreement dated April 19, 2018
Agreement (the “PFSRA”) and the Security Documents
amount to the lenders, your Company through internal
India, would infuse the same into EIPET. To facilitate the
same, your Company would remit the said fund in the
form of shareholder loan. Out of the total shareholder
into equity. In this regard, as on date, your Company has
Further, your Company has also entered into a Share
purchase of 23% stake of our joint venture Company -
more than seven tranches.
Further, your Company has also proposed to purchase the
A separate statement containing the salient features of Financial

4 | Dhunseri Petrochem Limited
Company forms a part of consolidated Financial Statements in
any, of the Companies Act, 2013. Shareholders who wish to have a
Audited Consolidated Financial Statements of your Company are
Companies Act, 2013 read with the Companies (Accounts) Rules, 2014.
`6,896.16 Lakhs.
`80,515.20 Lakhs.
101248W/W-100022, the present Statutory Auditors of your th
The Auditors’ Report for the FY 2017-18 does not contain any
Auditor of your Company for the FY 2017-18.
required u/s 134(v)(e) of the Companies Act, 2013. Your Company
has adopted policies and procedures for ensuring the orderly

Annual Report 2017-18 | 5
with reference to Financial Statements and no material weakness
Details of Loans, Guarantees and Investments covered under the
the notes to the Financial Statements.
Risk Management
and Legal compliances.
(h) of the Companies Act and Rule 8(2) of the Companies (Accounts)
same forms part of this Report.
approval of the shareholders at the forthcoming Annual General
the notes to accounts.
The Company has also formulated a policy on dealing with the
accordance with the Policy.
The Independent Directors of your Company had reviewed the
performance of non-independent directors and the Board as
a whole along with the performance of the Chairman of your
to evaluate the performance of individual directors on parameters
Your Company has taken adequate steps to adhere to all the
part of this Report.

6 | Dhunseri Petrochem Limited
are covered in the Corporate Governance Report.
workplace for its employees.
Further, your Company has not accepted any deposits from the
who play a pivotal role in the growth of your Company.
suppliers, shareholders and all others associated with your
Company. The Board of Directors also thank the employees of the
The Board of Directors

Annual Report 2017-18 | 7
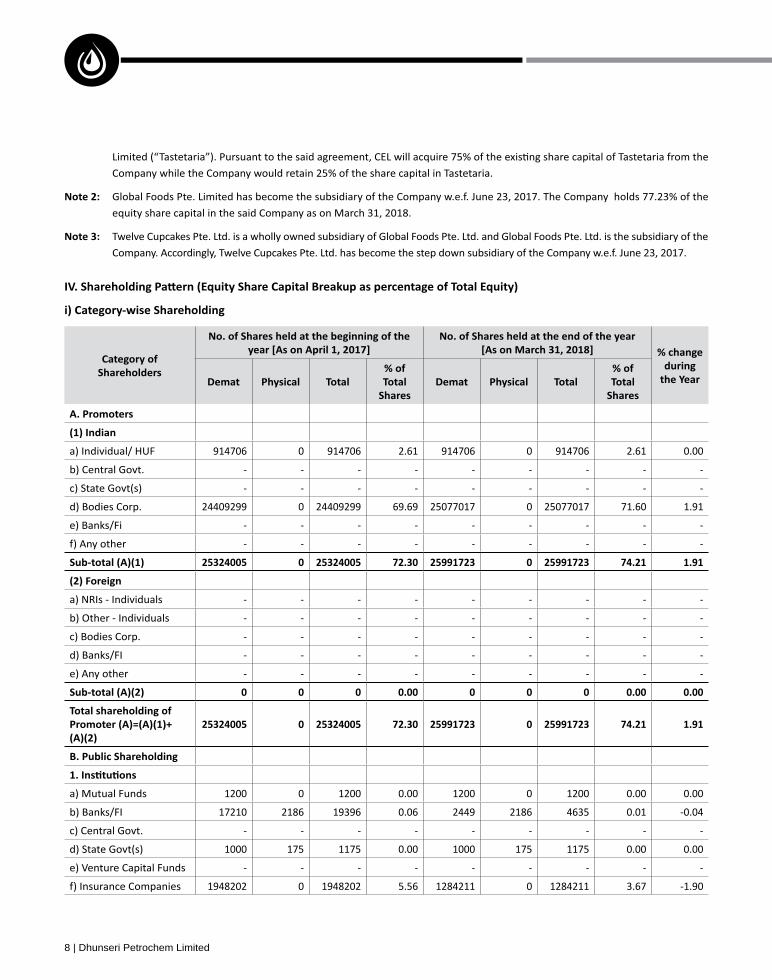
EXTRACT OF ANNUAL RETURN
(I) CIN L15492WB1916PLC002697
(II) 11.05.1916
(III) Name of the Company Dhunseri Petrochem Limited
(IV)
(V) Dhunseri
Tel: +91 33 22801950-54
(VI) Whether listed Company Yes
(VII) Name, address and contact details of Registrar and Trans-
fer Agent, if any
Phone: 91 33 22482248, 22435029
Email: [email protected]
(i) 649 4.53
(ii) 46693 95.47
held
(i) Dhunseri Investments Limited L15491WB1997PLC082808 55.79 2(46)
(ii) Dhunseri Infrastructure Limited U45400WB2013PLC190485 100 2(87)
(iii) Tastetaria Private Limited U15549WB2016PTC217591 100 2(87)
(iv) Limited #17-01 SBF Center, Singapore- 068914
77.23 2(87)
8 | Dhunseri Petrochem Limited
Company while the Company would retain 25% of the share capital in Tastetaria.
% change during
the YearDemat Demat
914706 0 914706 2.61 914706 0 914706 2.61 0.00
- - - - - - - - -
c) State Govt(s) - - - - - - - - -
d) Bodies Corp. 24409299 0 24409299 69.69 25077017 0 25077017 71.60 1.91
e) Banks/Fi - - - - - - - - -
f) Any other - - - - - - - - -
25324005 0 25324005 0
a) NRIs - Individuals - - - - - - - - -
- - - - - - - - -
c) Bodies Corp. - - - - - - - - -
d) Banks/FI - - - - - - - - -
e) Any other - - - - - - - - -
0 0 0 0 0 0
25324005 0 25324005 0
1200 0 1200 0.00 1200 0 1200 0.00 0.00
17210 2186 19396 0.06 2449 2186 4635 0.01 -0.04
c) Central Govt. - - - - - - - - -
d) State Govt(s) 1000 175 1175 0.00 1000 175 1175 0.00 0.00
e) Venture Capital Funds - - - - - - - - -
f) Insurance Companies 1948202 0 1948202 5.56 1284211 0 1284211 3.67 -1.90

Annual Report 2017-18 | 9
% change during
the YearDemat Demat
g) FIIs 15000 0 15000 0.04 0 0 0 0.00 -0.04
h) Foreign Venture Capital Funds
- - - - - - - - -
Investors0 0 0 0.00 75925 0 75925 0.22 0.22
2361 1364785 2361 1367146
i) Indian 1692050 10941 1702991 4.86 1472316 4587 1476903 4.22 -0.65
ii) Overseas - - - - - - - - -
i) Individual shareholders holding nominal share capital upto `1 lakh
4473829 340983 4814812 13.75 4506842 246438 4753280 13.57 -0.18
ii) Individual shareholders holding nominal share capital in
`1 lakh
910889 0 910889 2.60 941682 0 941682 2.69 0.09
Non Resident Individual 116515 3238 119753 0.34 130494 500 130994 0.37 0.03
1134 1348 2482 0.01 1134 0 1134 0.00 0.00
95622 0 95622 0.27 173229 0 173229 0.50 0.22
Trusts 1155 155 1310 0.00 300 155 455 0.00 0.00
NBFCs registered with RBI
5400 0 5400 0.02 25535 0 25535 0.07 0.06
Dhunseri Petrochem Limited- Unclaimed Suspense Account
62517 0 62517 0.18 29401 0 29401 0.08 -0.09
Authority0 0 0 0.00 133272 0 133272 0.38 0.38
356665 7715776 7414205 251680 7665885
254041
- - - - - - - - -
34665728 35024754 34770713 254041 35024754

10 | Dhunseri Petrochem Limited
as on March 31, 2018 % change in share holding
during the Year
encumbered to total shares
encumbered to total shares
1 Dhunseri Investments Limited 18872000 53.88 0.00 19539718 55.79 0.00 1.91
2 Naga Dhunseri Group Limited 3078759 8.79 0.00 3078759 8.79 0.00 0.00
3 2079414 5.94 0.00 2079414 5.94 0.00 0.00
4 288126 0.82 0.00 288126 0.82 0.00 0.00
5 91000 0.26 0.00 91000 0.26 0.00 0.00
6 45520 0.13 0.00 45520 0.13 0.00 0.00
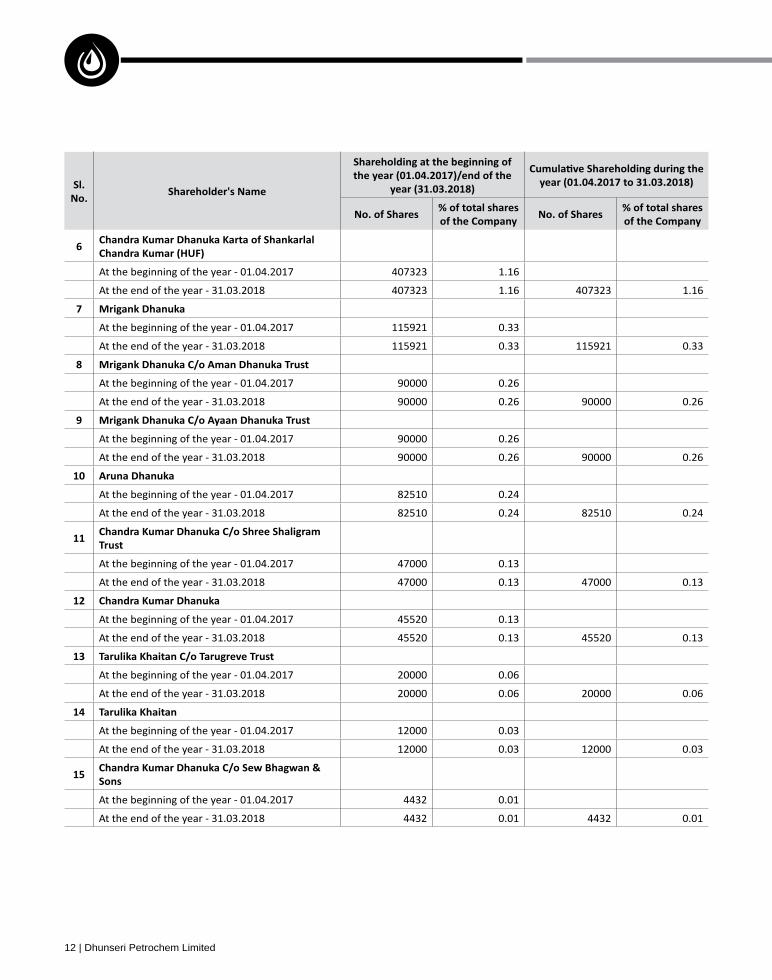
7 407323 1.16 0.00 407323 1.16 0.00 0.00
8Shree Shaligram Trust
47000 0.13 0.00 47000 0.13 0.00 0.00
9 4432 0.01 0.00 4432 0.01 0.00 0.00
10 115921 0.33 0.00 115921 0.33 0.00 0.00
11Dhanuka Trust
90000 0.26 0.00 90000 0.26 0.00 0.00
12Dhanuka Trust
90000 0.26 0.00 90000 0.26 0.00 0.00
13 Aruna Dhanuka 82510 0.24 0.00 82510 0.24 0.00 0.00
14Trust
20000 0.06 0.00 20000 0.06 0.00 0.00
15 12000 0.03 0.00 12000 0.03 0.00 0.00
25324005
1
18872000 53.88
As on 25.05.2017 - Transfer 102381 0.29 18974381 54.17
As on 31.05.2017 - Transfer 3932 0.01 18978313 54.18

Annual Report 2017-18 | 11
As on 01.06.2017 - Transfer 6068 0.02 18984381 54.20
As on 02.06.2017 - Transfer 3977 0.01 18988358 54.21
As on 05.06.2017 - Transfer 4633 0.01 18992991 54.22
As on 06.06.2017 - Transfer 3000 0.01 18995991 54.23
As on 07.06.2017 - Transfer 3043 0.01 18999034 54.24
As on 08.06.2017 - Transfer 12774 0.04 19011808 54.28
As on 09.06.2017 - Transfer 7022 0.02 19018830 54.30
As on 12.06.2017 - Transfer 225 0.00 19019055 54.30
As on 17.08.2017 - Transfer 75346 0.22 19094401 54.52
As on 24.08.2017 - Transfer 45000 0.13 19139401 54.65
As on 30.08.2017 - Transfer 80000 0.22 19219401 54.87
As on 01.09.2017 - Transfer 100693 0.29 19320094 55.16
As on 04.09.2017 - Transfer 38889 0.11 19358983 55.27
As on 05.09.2017 - Transfer 12410 0.04 19371393 55.31
As on 11.09.2017 - Transfer 50000 0.14 19421393 55.45
As on 12.09.2017 - Transfer 14356 0.04 19435749 55.49
As on 13.09.2017 - Transfer 18609 0.05 19454358 55.54
As on 19.09.2017 - Transfer 32000 0.10 19486358 55.64
As on 03.10.2017 - Transfer 30600 0.08 19516958 55.72
As on 04.10.2017 - Transfer 22760 0.07 19539718 55.79
At the end of the year - 31.03.2018 19539718 55.79 19539718 55.79
2
3078759 8.79
At the end of the year - 31.03.2018 3078759 8.79 3078759 8.79
3
2079414 5.94
At the end of the year - 31.03.2018 2079414 5.94 2079414 5.94
4
288126 0.82
At the end of the year - 31.03.2018 288126 0.82 288126 0.82
5
91000 0.26
At the end of the year - 31.03.2018 91000 0.26 91000 0.26
12 | Dhunseri Petrochem Limited
6
407323 1.16
At the end of the year - 31.03.2018 407323 1.16 407323 1.16
7 Mrigank Dhanuka
115921 0.33
At the end of the year - 31.03.2018 115921 0.33 115921 0.33
8
90000 0.26
At the end of the year - 31.03.2018 90000 0.26 90000 0.26
90000 0.26
At the end of the year - 31.03.2018 90000 0.26 90000 0.26
10
82510 0.24
At the end of the year - 31.03.2018 82510 0.24 82510 0.24
11
47000 0.13
At the end of the year - 31.03.2018 47000 0.13 47000 0.13
12
45520 0.13
At the end of the year - 31.03.2018 45520 0.13 45520 0.13
13
20000 0.06
At the end of the year - 31.03.2018 20000 0.06 20000 0.06
14
12000 0.03
At the end of the year - 31.03.2018 12000 0.03 12000 0.03
15
4432 0.01
At the end of the year - 31.03.2018 4432 0.01 4432 0.01

Annual Report 2017-18 | 13
Decrease in
beginning
1
500000 1.43
As on 15.09.2017- Transfer -37000 463000 1.32
As on 22.09.2017 - Transfer -13000 450000 1.28
As on 13.10.2017 - Transfer -30000 420000 1.20
As on 20.10.2017 - Transfer -72203 347797 0.99
As on 27.10.2017 - Transfer -7519 340278 0.97
As on 03.112017 - Transfer -15278 325000 0.93
As on 17.11.2017 - Transfer -32080 292920 0.84
As on 24.11.2017 - Transfer -67920 225000 0.64
As on 01.12.2017 - Transfer -108780 116220 0.33
As on 08.12.2017 - Transfer -98272 17948 0.05
As on 15.12.2017 - Transfer -17948 0 0.00
At the end of the year - 31.03.2018 0 0.00
2
127975 0.37
As on 21.04.2017 - Transfer -53679 74296 0.21
As on 19.05.2017 - Transfer -11990 62306 0.18
As on 02.06.2017 - Transfer -62306 0 0.00
At the end of the year - 31.03.2018 0 0.00
3
343028 0.98 Nil movement during the
yearAt the end of the year - 31.03.2018 343028 0.98 343028 0.98
4
941183 2.69 Nil movement during the
yearAt the end of the year - 31.03.2018 941183 2.69 941183 2.69
14 | Dhunseri Petrochem Limited
Decrease in
beginning
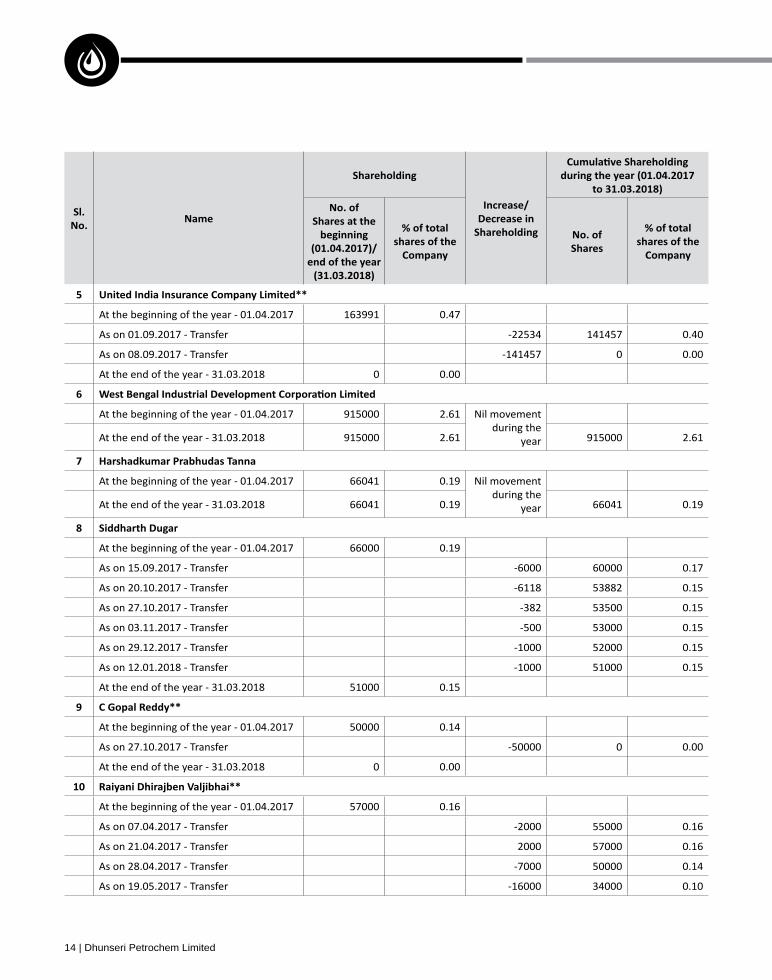
5
163991 0.47
As on 01.09.2017 - Transfer -22534 141457 0.40
As on 08.09.2017 - Transfer -141457 0 0.00
At the end of the year - 31.03.2018 0 0.00
6
915000 2.61 Nil movement during the
yearAt the end of the year - 31.03.2018 915000 2.61 915000 2.61
7
66041 0.19 Nil movement during the
yearAt the end of the year - 31.03.2018 66041 0.19 66041 0.19
8
66000 0.19
As on 15.09.2017 - Transfer -6000 60000 0.17
As on 20.10.2017 - Transfer -6118 53882 0.15
As on 27.10.2017 - Transfer -382 53500 0.15
As on 03.11.2017 - Transfer -500 53000 0.15
As on 29.12.2017 - Transfer -1000 52000 0.15
As on 12.01.2018 - Transfer -1000 51000 0.15
At the end of the year - 31.03.2018 51000 0.15
50000 0.14
As on 27.10.2017 - Transfer -50000 0 0.00
At the end of the year - 31.03.2018 0 0.00
10
57000 0.16
As on 07.04.2017 - Transfer -2000 55000 0.16
As on 21.04.2017 - Transfer 2000 57000 0.16
As on 28.04.2017 - Transfer -7000 50000 0.14
As on 19.05.2017 - Transfer -16000 34000 0.10

Annual Report 2017-18 | 15
Decrease in
beginning
As on 26.05.2017 - Transfer -34000 0 0.00
As on 24.11.2017 - Transfer 10100 10100 0.03
As on 01.12.2017 - Transfer 5000 15100 0.04
As on 08.12.2017 - Transfer 9900 25000 0.07
As on 15.12.2017 - Transfer 5000 30000 0.09
As on 22.12.2017 - Transfer 5000 35000 0.10
As on 29.12.2017 - Transfer -15000 20000 0.06
As on 05.01.2018 - Transfer -17000 3000 0.01
As on 12.01.2018 - Transfer -3000 0 0.00
At the end of the year - 31.03.2018 0 0.00
11
15949 0.05
As on 07.04.2017 - Transfer 1298 17247 0.05
As on 14.04.2017 - Transfer 3277 20524 0.06
As on 21.04.2017 - Transfer 405 20929 0.06
As on 28.04.2017 - Transfer 442 21371 0.06
As on 05.05.2017 - Transfer 11206 32577 0.09
As on 12.05.2017 - Transfer 4222 36799 0.11
As on 19.05.2017 - Transfer -8134 28665 0.08
As on 26.05.2017 - Transfer 6911 35576 0.10
As on 02.06.2017 - Transfer -7734 27842 0.08
As on 09.06.2017 - Transfer -4616 23226 0.07
As on 16.06.2017 - Transfer 4186 27412 0.08
As on 23.06.2017 - Transfer 1375 28787 0.08
As on 30.06.2017 - Transfer 765 29552 0.08
As on 07.07.2017 - Transfer -2453 27099 0.08
As on 14.07.2017 - Transfer -7600 19499 0.06
As on 21.07.2017 - Transfer -298 19201 0.05
As on 28.07.2017 - Transfer -418 18783 0.05
As on 04.08.2017 - Transfer 2164 20947 0.06
As on 11.08.2017 - Transfer 309 21256 0.06
As on 18.08.2017 - Transfer 4970 26226 0.07
As on 25.08.2017 - Transfer -4971 21255 0.06

16 | Dhunseri Petrochem Limited
Decrease in
beginning
As on 01.09.2017 - Transfer -361 20894 0.06
As on 08.09.2017 - Transfer -1623 19271 0.06
As on 15.09.2017 - Transfer 46360 65631 0.19
As on 22.09.2017 - Transfer 2904 68535 0.20
As on 30.09.2017 - Transfer -4659 63876 0.18
As on 06.10.2017 - Transfer 811 64687 0.18
As on 13.10.2017 - Transfer 26084 90771 0.26
As on 20.10.2017 - Transfer 1262 92033 0.26
As on 27.10.2017 - Transfer 3720 95753 0.27
As on 03.11.2017 - Transfer -7601 88152 0.25
As on 10.11.2017 - Transfer -16351 71801 0.21
As on 17.11.2017 - Transfer -6200 65601 0.19
As on 24.11.2017 - Transfer -14731 50870 0.15
As on 01.12.2017 - Transfer -1600 49270 0.14
As on 08.12.2017 - Transfer -6670 42600 0.12
As on 15.12.2017 - Transfer 10673 53273 0.15
As on 22.12.2017 - Transfer 3440 56713 0.16
As on 29.12.2017 - Transfer 9405 66118 0.19
As on 05.01.2018 - Transfer 4353 70471 0.20
As on 12.01.2018 - Transfer 12613 83084 0.24
As on 19.01.2018 - Transfer 5246 88330 0.25
As on 26.01.2018 - Transfer 2904 91234 0.26
As on 02.02.2018 - Transfer -22990 68244 0.19
As on 09.02.2018 - Transfer 2796 71040 0.20
As on 16.02.2018 - Transfer -2716 68324 0.20
As on 23.02.2018 - Transfer 1897 70221 0.20
As on 02.03.2018 - Transfer 5510 75731 0.22
As on 09.03.2018 - Transfer -8350 67381 0.19
As on 16.03.2018 - Transfer -4273 63108 0.18
As on 23.03.2018 - Transfer -3005 60103 0.17
As on 30.03.2018 - Transfer -170 59933 0.17
At the end of the year - 31.03.2018 59933 0.17

Annual Report 2017-18 | 17
Decrease in
beginning
1220578 0.06
As on 07.04.2017 - Transfer 470 21048 0.06As on 14.04.2017 - Transfer -1558 19490 0.06As on 21.04.2017 - Transfer -980 18510 0.05As on 28.04.2017 - Transfer -1647 16863 0.05As on 05.05.2017 - Transfer 930 17793 0.05As on 12.05.2017 - Transfer -647 17146 0.05As on 19.05.2017 - Transfer 7465 24611 0.07As on 26.05.2017 - Transfer 15073 39684 0.11As on 02.06.2017 - Transfer -5316 34368 0.10As on 09.06.2017 - Transfer -1560 32808 0.09As on 16.06.2017 - Transfer -1345 31463 0.09As on 23.06.2017 - Transfer 532 31995 0.09As on 30.06.2017 - Transfer -349 31646 0.09As on 07.07.2017 - Transfer 1395 33041 0.09As on 14.07.2017 - Transfer -90 32951 0.09As on 21.07.2017 - Transfer -1780 31171 0.09As on 28.07.2017 - Transfer 201 31372 0.09As on 04.08.2017 - Transfer 2264 33636 0.10As on 11.08.2017 - Transfer -926 32710 0.09As on 18.08.2017 - Transfer 20 32730 0.09As on 25.08.2017 - Transfer 459 33189 0.09As on 01.09.2017 - Transfer 1819 35008 0.10As on 08.09.2017 - Transfer 365 35373 0.10As on 15.09.2017 - Transfer 211 35584 0.10As on 22.09.2017 - Transfer 758 36342 0.10As on 30.09.2017 - Transfer 283 36625 0.10As on 06.10.2017 - Transfer -226 36399 0.10As on 13.10.2017 - Transfer 1926 38325 0.11As on 20.10.2017 - Transfer -1118 37207 0.11As on 27.10.2017 - Transfer -118 37089 0.11As on 03.11.2017 - Transfer 6070 43159 0.12As on 10.11.2017 - Transfer 1299 44458 0.13As on 17.11.2017 - Transfer -20814 23644 0.07As on 24.11.2017 - Transfer -108 23536 0.07As on 01.12.2017 - Transfer 163 23699 0.07As on 08.12.2017 - Transfer 10540 34239 0.10As on 15.12.2017 - Transfer -122 34117 0.10

18 | Dhunseri Petrochem Limited
Decrease in
beginning
As on 22.12.2017 - Transfer 1265 35382 0.10
As on 29.12.2017 - Transfer 4056 39438 0.11
As on 05.01.2018 - Transfer 3691 43129 0.12
As on 12.01.2018 - Transfer -2288 40841 0.12
As on 19.01.2018 - Transfer 5992 46833 0.13
As on 26.01.2018 - Transfer 947 47780 0.14
As on 02.02.2018 - Transfer 5948 53728 0.15
As on 09.02.2018 - Transfer 1728 55456 0.16
As on 16.02.2018 - Transfer -10665 44791 0.13
As on 23.02.2018 - Transfer 6918 51709 0.15
As on 02.03.2018 - Transfer -5154 46555 0.13
As on 09.03.2018 - Transfer 2639 49194 0.14
As on 16.03.2018 - Transfer -2087 47107 0.13
As on 23.03.2018 - Transfer -3309 43798 0.13
As on 30.03.2018 - Transfer -39 43759 0.12
At the end of the year - 31.03.2018 43759 0.12
13
0 0.00
As on 12.01.2018 - Transfer 59966 59966 0.17
At the end of the year - 31.03.2018 59966 0.17
14
46995 0.13 Nil movement during the
yearAt the end of the year - 31.03.2018 46995 0.13 46995 0.13
15
0 0.00
As on 19.01.2018 - Transfer 56844 56844 0.16
As on 16.03.2018 - Transfer -1157 55687 0.16
At the end of the year - 31.03.2018 55687 0.16
10 shareholders as on 31/03/2018.
10 shareholders as on 01/04/2017.

Annual Report 2017-18 | 19
Decrease in shareholding
Directors
1
45520 0.13 Nil movement during the yearAt the end of the year 45520 0.13 45520 0.13
2
82510 0.24 Nil movement during the yearAt the end of the year 82510 0.24 82510 0.24
3
115921 0.33 Nil movement during the yearAt the end of the year 115921 0.33 115921 0.33
4
500 0 Nil movement during the yearAt the end of the year 500 0 500 0.00
5
0 0 Nil movement during the yearAt the end of the year 0 0 0 0
6
0 0 Nil movement during the yearAt the end of the year 0 0 0 0
7
0 0 Nil movement during the yearAt the end of the year 0 0 0 0
8
0 0 Nil movement during the yearAt the end of the year 0 0 0 0
0 0 Nil movement during the yearAt the end of the year 0 0 0 0

20 | Dhunseri Petrochem Limited
Decrease in shareholding
10
0 0 Nil movement during the yearAt the end of the year 0 0 0 0
1
0 0 Nil movement during the yearAt the end of the year 0 0 0 0
(` in Lakhs)
depositsDeposits
i) Principal Amount - - - -
- - - -
- - - -
- - - -
- 10,646.09 - 10,646.09
- - - -
- 200.82 - 200.82
- -
i) Principal Amount - 10,846.91 - 10,846.91
- - - -
- - - -
- -

Annual Report 2017-18 | 21
(` in Lakhs)
1 Gross salary
22.31 46.80 90.27 159.38
1961- - 2.48 2.48
- - - -
2. - - - -
3. Sweat Equity - - - -
4. Commission
55.00 50.00 - 105.00
- others - - - -
5. Others, please specify - - - -
the ceiling computed in line with Schedule V to the Companies Act, 2013.
(` in Lakhs)
Kundra Khaitan
1
- 3.10 3.10 4.60 0.50 0.90 - 12.20
Commission - - - - - - - -
Others - - - - - - - -
- -
2Directors
1.50 - - - - - 1.50 3.00
Commission - - - - - - - -
Others - - - - - - - -
- - - - -
Overall Ceiling as per the Act

22 | Dhunseri Petrochem Limited
(` in Lakhs)
1 Gross salary
8.27 8.27
- -
- -
2 - -
3 Sweat Equity - -
4 Commission
- -
- Others, specify... - -
5 Others - -

Annual Report 2017-18 | 23
VII of the Companies Act, 2013 read with its rules.
http://aspetindia.com/wp-content/uploads/2018/03/
3. Dr. B.Sen
`4409.41 Lacs
`88.19 Lacs
`88.19 Lacs
NIL
is coveredor programs
was undertaken
programs wise
(`
spent on the
programs (`
upto the
period (`
or through implement-
1Financial Support to S.L.Dhanuka Girls’
women8.19 8.19 8.19
Implement-ing agency-
Dhanuka Dhunseri 2
centreincluding
health care
Bishnupur, District - South 24 Parganas, West
Bengal
80.00 80.00 80.00

24 | Dhunseri Petrochem Limited
Not

Annual Report 2017-18 | 25
(`
% age increase in
the FY 2017-18 as compared to the
2016-17
to median
2017-18
77.31 38% 8:1
96.80 (Note-3) 10:1
92.75 3% 10:1
Vice Chairman 1.50 N.A.(Note-1)
0:1
Director1.50 0:1
4.60 0:1
Dr. B.Sen 3.10 0:1
0.50 0:1
0.90 0:1
3.10 0:1
8.27 51% 1:1
`
Company.
2017-18 as compared to FY 2016-17.
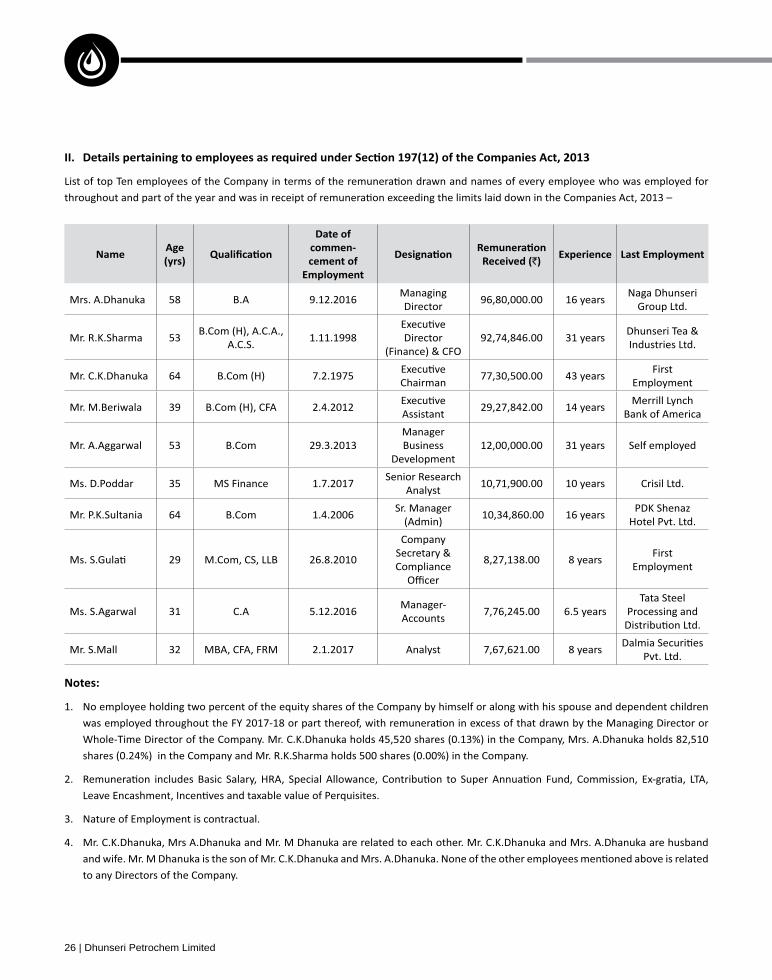
26 | Dhunseri Petrochem Limited
commen-Received (`
58 B.A 9.12.2016Director
96,80,000.00 16 yearsNaga Dhunseri
Group Ltd.
53A.C.S.
1.11.1998 Director 92,74,846.00 31 yearsIndustries Ltd.
64 7.2.1975Chairman
77,30,500.00 43 yearsFirst
Employment
39 2.4.2012Assistant
29,27,842.00 14 yearsBank of America
53 B.Com 29.3.2013 Business Development
12,00,000.00 31 years Self employed
35 1.7.2017Senior Research
Analyst 10,71,900.00 10 years Crisil Ltd.
64 B.Com 1.4.2006(Admin)
10,34,860.00 16 years
29 26.8.2010
Company
Compliance 8,27,138.00 8 years
First Employment
31 C.A 5.12.2016Accounts
7,76,245.00 6.5 yearsTata Steel
Processing and
32 2.1.2017 Analyst 7,67,621.00 8 yearsPvt. Ltd.
3. Nature of Employment is contractual.
to any Directors of the Company.

Annual Report 2017-18 | 27
For The Financial Year Ended 31.03.2018
To
Dhunseri Petrochem Limited
I have conducted the Secretarial Audit of the compliance of
Secretarial Audit was conducted in a manner that provided me a
listed hereunder and also that the Company has proper Board-
according to the provisions of:
(i) The Companies Act, 2013 (the Act) and the Rules made there
(iii) The Depositories Act, 199
(i) Secretarial Stand
Secretaries of India
28 | Dhunseri Petrochem Limited
During the period under review, the Company has complied with
I further report that:
Board of Directors that took place during the period under review
were carried out in compliance with the provisions of the Act.
views are captured and recorded as part of the minutes.
I further report that there are adequate systems and processes in
I further report that during the audit period there were a few
was the Joint Venture Company
making and selling the well known “UNO” Brand of Chicago
decided in future. The JV Company chosen for this purpose is
Tastetaria Private Limited (“JV Company” or “Tastetaria”), which
Pursuant to the said agreement, CEL will acquire 75% of the
om the Company while the
Company will retain 25% of the share capital in Tastetaria.
Mamta Binani
Date: 19.05.2018 CP No.: 2598

Annual Report 2017-18 | 29
of the Companies (Accounts) Rules, 2014)
proviso thereto
There were no contracts or arrangements
IVL Dhunseri Petrochem Industries Pvt. Ltd. (IDPIL) (Formerly Dhunseri
Purchase and Sale Agreement with IDPIL dated April 1, 2017 relating to
Order.
1 year on the same terms.
Pursuant to the said agreement, the
`90047.32 lakhs during the FY 2017-18.
For and on Behalf of
The Board of Directors

30 | Dhunseri Petrochem Limited
in Government policies.
the holding Company of Twelve Cupcakes Pte Ltd. engaged in the
The Company is also looking to tap such opportunity at the right
moment.
The Company at present operates under the two segment i.e.,
the Company’s performance.
ensure that all assets are safeguarded and adequately protected
against the chances of occurrences of any loss or damage whether
foreseen or unforeseen. Internal Control Systems in the Company
control system is commensurate with the size and nature of the
that any major discrepancies or lapse in controls are reported to
Annual Report 2017-18 | 31
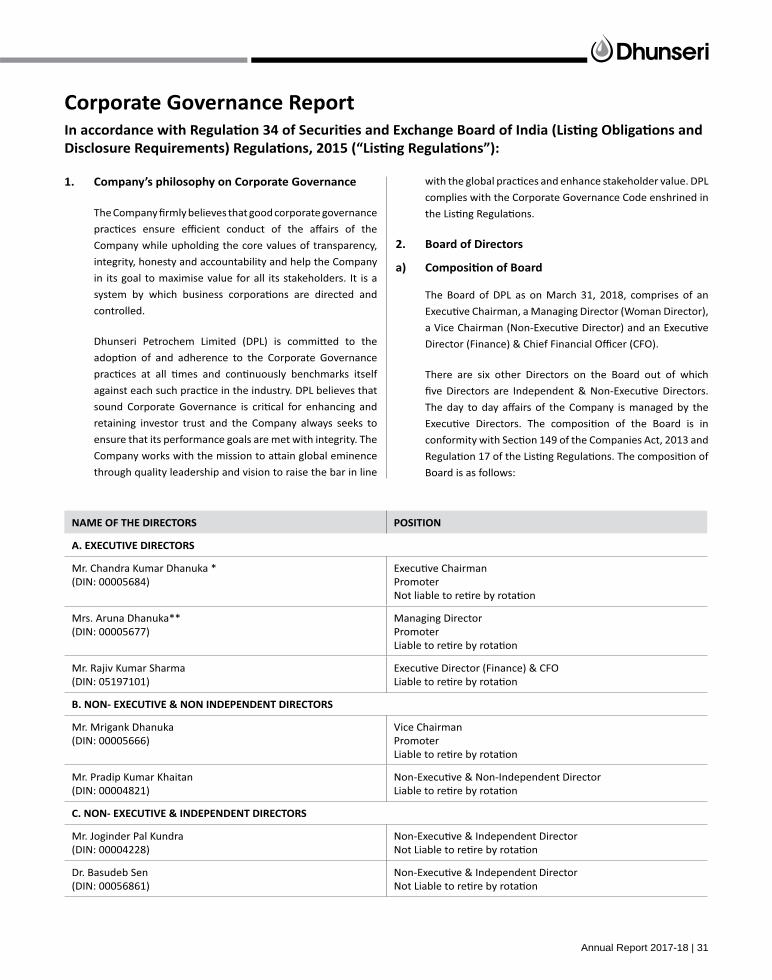
Company while upholding the core values of transparency,
controlled.
retaining investor trust and the Company always seeks to
ensure that its performance goals are met with integrity. The
complies with the Corporate Governance Code enshrined in
Board is as follows:
(DIN: 00005684) Promoter
(DIN: 00005677) Promoter
(DIN: 05197101)
(DIN: 00005666)Vice ChairmanPromoter
(DIN: 00004821)
(DIN: 00004228)
(DIN: 00056861)
32 | Dhunseri Petrochem Limited
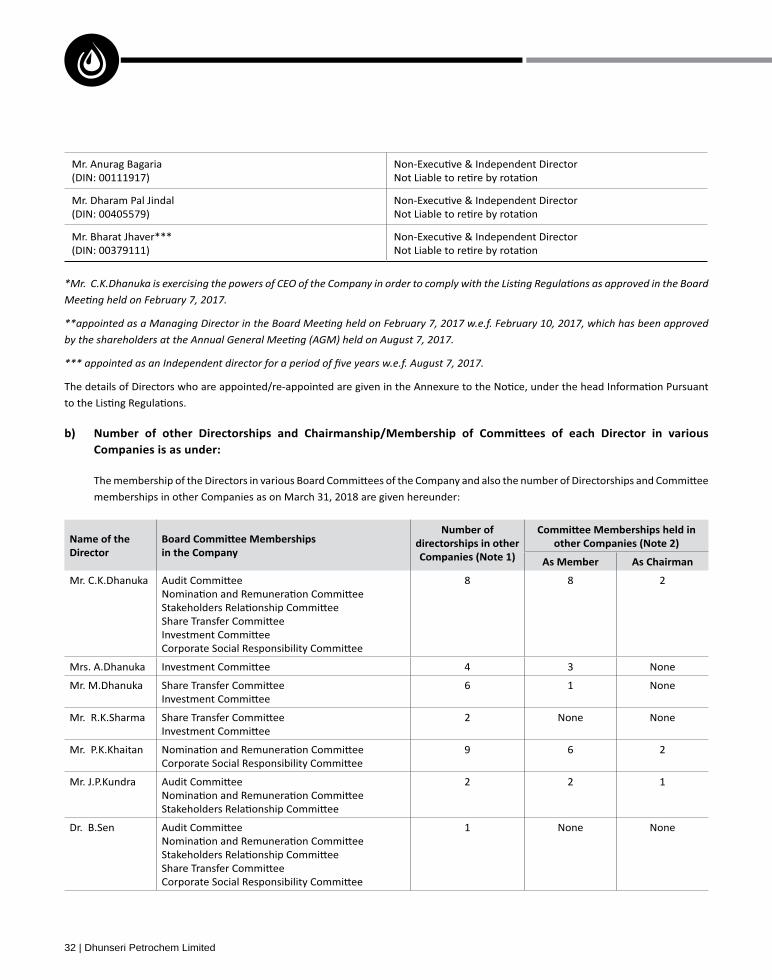
(DIN: 00111917)
(DIN: 00405579)
(DIN: 00379111)
Directordirectorships in other
8 8 2
4 3 None
6 1 None
2 None None
9 6 2
2 2 1
Dr. B.Sen 1 None None

Annual Report 2017-18 | 33
Directordirectorships in other
None None None
None 5 2 None
None None None
• none of the Independent Directors of the Company serve as an Independent Director in more than seven listed Companies and
Director in more than three listed Companies.
Board
Yes Yes Yes Yes Yes Yes
Yes Yes Yes Yes Yes Yes
Yes Yes No No Yes No
Yes Yes Yes Yes Yes Yes
No Yes Yes Yes No Yes
Yes Yes Yes Yes Yes No
Dr. B. Sen Yes No No Yes Yes No
No No No No Yes No
No No No Yes No No
No Yes Yes Yes Yes Yes
34 | Dhunseri Petrochem Limited
Management
The Board of DPL had laid down a Code of Conduct for all the
3. Approval of payment to statutory auditors for any other
4. Reviewing, with the management, the Annual Financial
6. Reviewing, with the management, the statement of uses/
7. Reviewing and monitoring the auditor’s independence and
the Company

Annual Report 2017-18 | 35
12. Reviewing, with the management, performance of statutory
including the structure of the internal audit department,
or irregularity or a failure of internal control systems of a
Companies Act, 2013.
2017 2017 2017 2018
Independent DirectorChairman of the
Yes Yes Yes Yes Yes
Promoter-DirectorIndustrialist
Yes Yes Yes Yes Yes
Dr. B.Sen,Independent Director
Professional and Business Economist
Yes No No Yes Yes
Independent Director Industrialist
No Yes Yes Yes Yes

36 | Dhunseri Petrochem Limited
Independent Directors.
with the criteria laid down, and recommend to the Board their
uploads/2017/05/Nomination-and-Remuneration-Policy.pdf).
of interest of all stakeholders, Independence and Independent views
Dr. B.Sen, Independent Director
and Business Economist
Chairman of the Yes Yes
Promoter-DirectorIndustrialist
Yes Yes
Non-Independent Director No No
Independent Director Yes Yes

Annual Report 2017-18 | 37
(in `)
(variable (variable
23,80,500 57,28,654 2,48,400 55,00,000 - 1,38,57,554
42,00,000 11,57,372 5,04,000 50,00,000 - 1,08,61,372
81,77,136 14,55,519 4,60,800 - 10,00,000 1,10,93,455
1,47,57,636 83,41,545 12,13,200 1,05,00,000 10,00,000 3,58,12,381
Company
form part of the contract with the Company.
performance of the Company.
45,520 shares
82,510 shares
500 shares
`
50,000
20,000
20,000
10,000
30,000

38 | Dhunseri Petrochem Limited
1,15,921 shares
Independent Directors:
`)
None 1,50,000
1,50,000
4,60,000
Dr. B.Sen 3,10,000
90,000
None 50,000
3,10,000
2017 2017 2017 2018
Chairman of the Yes Yes Yes Yes
Yes Yes Yes Yes

Annual Report 2017-18 | 39
2017 2017 2017 2018
Dr. B.Sen, Yes No Yes Yes
No No No Yes
NIL
2
2
NIL
Member Member Member
April 24, 2017 Yes Yes Yes Yes
Yes Yes Yes Yes
June 1, 2017 Yes No Yes Yes
July 31, 2017 Yes No Yes No
August 17, 2017 Yes Yes Yes No
Yes No Yes No
Yes No Yes Yes
No Yes Yes Yes
Yes Yes Yes Yes
Yes Yes Yes Yes
Yes Yes No Yes

40 | Dhunseri Petrochem Limited
Non-Independent DirectorNo No
Yes Yes
Dr. B.Sen,Independent Director
Yes Yes

Annual Report 2017-18 | 41
Financial Year ended
101st August 7, 2017Premises), 48, Shakespeare
Schedule V to the Companies Act, 2013
3) Approval for change of name of the Company
100th August 4, 2016Premises), 48, Shakespeare None
99th August 7, 2015Premises), 48, Shakespeare
Company
(Finance) of the Company
through Postal Ballot as on the date of this report.

42 | Dhunseri Petrochem Limited
1 Approval of related party
Dhunseri Petrochem Industries Private Limited
Polypet Private Ltd. under
Ordinary 86631 10063 64950 11618
Company with requisite majority.
appointment
Company at large.
of notes to the accounts in the Annual Report.
http://aspetindia.com/wp-content/uploads/2017/05/
RELATED-PARTY-TRANSACTION-POLICY.pdf).
related to the capital markets.
of the requirements of the Companies Act, 2013 to perform

Annual Report 2017-18 | 43
d) The Company has complied with all the mandatory
The Company
The Internal Auditors of
f) The Company has no commodity price risks and accordingly
has not entered into Commodity hedging.
such shares claim them.
Standard, Ei Samay and Aajkal. These results are also posted
requirements, quarterly and annual results of the Company
Disclosure in respect of equity shares transferred in “Dhunseri Petrochem Limited- Unclaimed Suspense Account” is as hereunder:
Unclaimed Suspense Account as on April 1, 2017
349 62517
Unclaimed Suspense Account during the year
NIL NIL
124 32016
and shares transferred from suspense account during the year
11 1100
214 29401

44 | Dhunseri Petrochem Limited
and
Annual Report containing, inter alia,
Audited Annual Accounts, Board’s Report, Auditors’ Report
(
The
complaints redress system.
com. Quarterly and annual results as well as shareholding
Yes
`3.50 per
The Company has transferred the unpaid dividend for the FY
2009-10 and the amount towards the sale proceeds of the
28, 2017, the Company had transferred 1,33,272 equity shares
NSDL in respect of which dividend had remained unclaimed/
nd Annual
nd
of the Company.
August 4, 2018 to August 10, 2018 (Both days inclusive)
Unaudited 1st quarter results August, 2018
Unaudited 2nd quarter results
Unaudited 3rd quarter results
Audited 4th quarterly results and annual results

Annual Report 2017-18 | 45
Phone: 91 33 2248-2248, 2243-5029,
Email: [email protected]
All queries of investors regarding your Company’s shares in
Transfer Agent of the Company.
Floor 25, P.J.Towers, Dalal Street,
523736
DPL
Demat ISIN No. for NSDL and CDSL INE 477B01010
`
Month High High High
Apr-17 96.10 74.50 96.00 74.85 30,184.22 29,241.48
103.95 76.40 103.95 76.50 31,255.28 29,804.12
Jun-17 95.00 77.65 95.00 79.00 31,522.87 30,680.66
Jul-17 90.90 80.00 88.75 80.00 32,672.66 31,017.11
Aug-17 89.40 75.10 89.80 71.25 32,686.48 31,128.02
Sep-17 109.95 84.05 109.55 84.00 32,524.11 31,081.83
Oct-17 142.85 99.60 143.00 100.05 33,340.17 31,440.48
Nov-17 153.80 125.30 153.65 124.25 33,865.95 32,683.59
Dec-17 173.00 123.10 172.90 127.00 34,137.97 32,565.16
Jan-18 197.00 147.50 196.00 148.60 36,443.98 33,703.37
175.00 122.25 177.50 122.30 36,256.83 33,482.81
162.00 126.50 162.40 127.10 34,278.63 32,483.84

46 | Dhunseri Petrochem Limited
shares in the normal course within 15 days from the date of
receipt, if the documents are valid and complete in all respects.
Limited (NSDL) and Central Depository Services India Limited
(CDSL) within 15 days.
Upto - 500 21,221 91.56 20,27,555 5.79
501 - 1000 953 4.11 7,65,946 2.19
1001 - 2000 479 2.07 7,30,734 2.09
2001 - 3000 174 0.75 4,43,238 1.26
3001 - 4000 77 0.33 2,75,654 0.79
4001 - 5000 83 0.36 3,89,360 1.11
5001 - 10000 98 0.42 7,24,917 2.07
92 0.40 2,96,67,350 84.70
23,177 3,50,24,754
Annual Report 2017-18 | 47
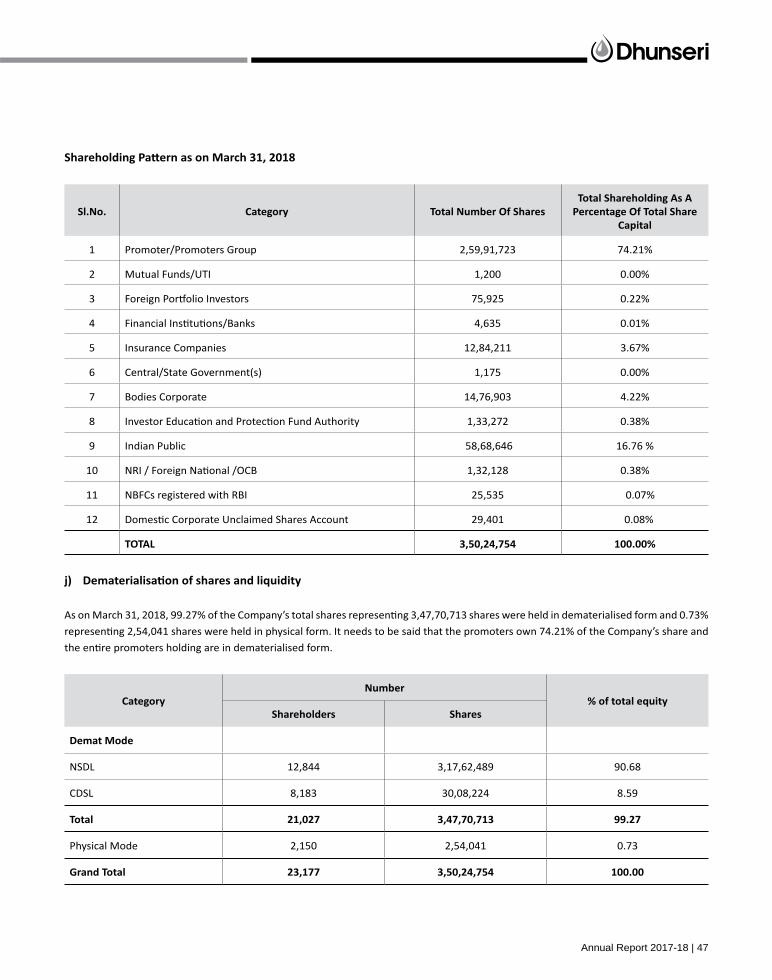
1 Promoter/Promoters Group 2,59,91,723 74.21%
2 1,200 0.00%
3 75,925 0.22%
4 4,635 0.01%
5 Insurance Companies 12,84,211 3.67%
6 Central/State Government(s) 1,175 0.00%
7 Bodies Corporate 14,76,903 4.22%
8 1,33,272 0.38%
9 58,68,646 16.76 %
10 1,32,128 0.38%
11 NBFCs registered with RBI 25,535 0.07%
12 29,401 0.08%
3,50,24,754
Demat Mode
NSDL 12,844 3,17,62,489 90.68
CDSL 8,183 30,08,224 8.59
21,027 3,47,70,713
2,150 2,54,041 0.73
23,177 3,50,24,754

48 | Dhunseri Petrochem Limited
The Company has not issued any GDRs, ADRs, Warrants or any
The Company adopted a code of internal procedures for
purpose.
Redressal Division
the Company and/or at the Company’s Registrar and Share
Transfer Agents. Shareholders holding shares in electronic
Dhunseri Petrochem Ltd.
Phone – 91 33 2280-1950-54
Annual Report.
The Board of Directors

Annual Report 2017-18 | 49
• We are not aware of any instance during the year of any fraud with involvement therein of the management or an employee
Date: 21st

50 | Dhunseri Petrochem Limited
Date: 21st

Annual Report 2017-18 | 51
To
statements of the Company.
(‘ICAI’). The Guidance Note requires that we comply with the
of the Standard on Quality Control (SQC) 1, Quality Control for
Engagements.
Opinion
9. We state that such compliance is neither an assurance as
or any duty of care for any other purpose or to any other
it may come withou
52 | Dhunseri Petrochem Limited
To
statements of (“the Company”),
and the Statement of Cash Flows for the year then ended, and
statements”).
statements that give a true and fair view and are free from material
misstatement, whether due to fraud or error.
We have taken into account the provisions of the Act, the
and the Rules made thereunder.
comply with ethical requirements and plan and perform the audit
the auditor's judgement, including the assessment of the risks
statements, whether due to fraud or error. In making those risk
audit procedures that are appropriate in the circumstances. An

Annual Report 2017-18 | 53
Opinion
the manner so required and give a true and fair view in conformity
for the year ended on that date.
the Order.
were necessary for the purposes of our audit.
Cash Flow Statement and Statement of Changes in Equity
account.
Auditor's Report in accordance with Rule 11 of the Companies
(Audit and Auditors) Rules, 2014, in our opinion and to the
given to us:
ii. The Company did not have any long term contracts including

54 | Dhunseri Petrochem Limited
The A
report that:
(i) (a) The Company has maintained proper records showing
the nature of its assets.
following:
(` in lakhs)
Three
located in
a
Buildings 1049.17 993.72
in the form of goods in transit only. Accordingly, the
provisions of paragraph 3(ii) of the Order are not
of the Company, the Company has not granted any
the Act. Accordingly, the provisions of paragraph 3 (iii) of
to us, the Company has complied with the provisions
in respect of the loans and investment made, and
other relevant provisions of the Act and the rules framed
thereunder. Accordingly, the provisions of paragraph 3(v)
of the Company, the amounts deducted / accrued in the
on account of employees’ state insurance, value added
al

Annual Report 2017-18 | 55
instruments) and term loans during the year. Accordingly,
during the year.
the Company has paid/provided for managerial
Schedule V to the Act.
standards.
Company.
Company, the Company has not entered into non-cash

56 | Dhunseri Petrochem Limited
ended on that date.
internal control stated in the Guidance Note on Audit of
the Guidance Note on Audit of Internal Financial Controls Over
require that we comply with ethical requirements and plan
on the assessed risk. The procedures selected depend on the
auditor’s judgement, including the assessment of the risks
whether due to fraud or error.
and procedures that (1) pertain to the maintenance of records

Annual Report 2017-18 | 57
statements.
controls, material misstatements due to error or fraud may
that the degree of compliance with the policies or procedures
may deteriorate.
Opinion
In our opinion, the Company has, in all material respects, an
Guidance Note on Audit of Internal Financial Controls Over
58 | Dhunseri Petrochem Limited
(` in lakhs)
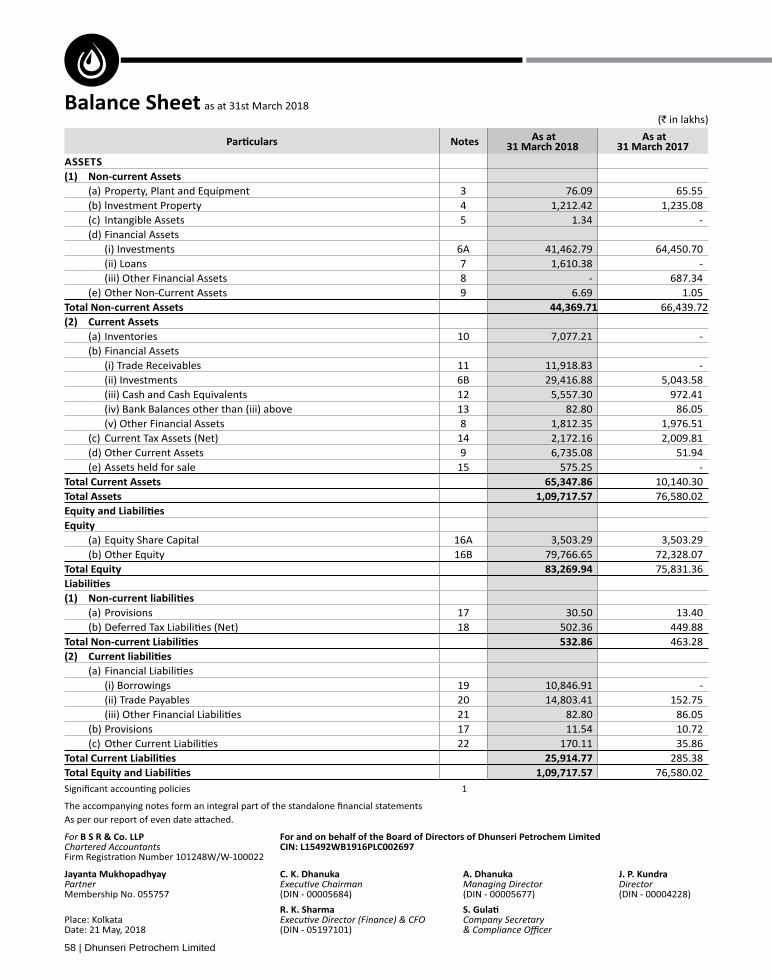
31 March 2018 31 March 2017
(a) Property, Plant and Equipment 3 76.09 65.55 lnvestment Property 4 1,212.42 1,235.08
(c) 5 1.34 - (d) Financial Assets
(i) Investments 6A 41,462.79 64,450.70 (ii) Loans 7 1,610.38 - (iii) Other Financial Assets 8 - 687.34
(e) Other Non-Current Assets 9 6.69 1.05 66,439.72
(a) Inventories 10 7,077.21 - Financial Assets
11 11,918.83 - (ii) Investments 6B 29,416.88 5,043.58 (iii) Cash and Cash Equivalents 12 5,557.30 972.41
13 82.80 86.05 (v) Other Financial Assets 8 1,812.35 1,976.51
(c) 14 2,172.16 2,009.81 (d) Other Current Assets 9 6,735.08 51.94 (e) Assets held for sale 15 575.25 -
10,140.30 76,580.02
(a) Equity Share Capital 16A 3,503.29 3,503.29 Other Equity 16B 79,766.65 72,328.07
75,831.36
(a) Provisions 17 30.50 13.40 18 502.36 449.88
463.28
(a) (i) Borrowings 19 10,846.91 -
20 14,803.41 152.75 21 82.80 86.05
Provisions 17 11.54 10.72 (c) 22 170.11 35.86
285.38 76,580.02

Annual Report 2017-18 | 59
(` in lakhs)
31 March 2018 31 March 2017
I 23 94,653.32 2,220.26
II Other Income 24 1,458.77 1,439.16
3,659.42
IV
Purchases of Stock -in-trade 90,047.32 -
Changes in Inventories of Stock-in-trade 25 (7,077.21) -
26 467.71 266.47
Finance Costs 27 139.14 8.37
28 42.94 45.22
29 8,123.12 1,878.86
2,198.92
V 1,460.50
VI 30 - (18,266.20)
VII (16,805.70)
VIII 31
539.19 1,465.65
169.08 (16,065.57)
IX (2,205.78)
X
(i) Equity investments through Other Comprehensive income- Net gain on disposal and change in fair value 5,622.92 2,583.10
(7.38) 22.47
(994.66) (4.50)
2,601.07
XI 395.29
XII 32
[Nominal value per share: ` 10/- each (Previous Year- `
(1) Basic 10.45 (6.30)
(2) Diluted 10.45 (6.30)

60 | Dhunseri Petrochem Limited
(` in lakhs)
Balance as at 01 April 2016 3,503.29
Changes in equity share capital during 2016-17 -
Balance as at 31 March 2017
Changes in equity share capital during 2017-18 -
Balance as at 31 March 2018
(` in lakhs)
Other Reserves
Reserve Reserve Reserve ReserveRetained
262.07 1,661.41 12.48 33,830.83 37,703.05 150.13 73,619.97
- - - - (2,205.78) - (2,205.78)
Other Comprehensive Income - - - - 17.97 2,583.10 2,601.07
- - - -
Dividend - - - - (1,400.99) - (1,400.99)
- - - - (286.20) - (286.20)
Balance as at 31 March 2017
- - - - 3,660.80 - 3,660.80
Other Comprehensive Income - - - - (4.80) 4,625.68 4,620.88
- - - -
Dividend - - - - (700.50) - (700.50)
- - - - (142.60) - (142.60)
Balance as at 31 March 2018

Annual Report 2017-18 | 61
(` in lakhs)
31 March 2018 31 March 2017
4,369.07 (16,805.70)
28 42.94 45.22
Loss on disposal of property, plant and equipment - 35.47
- 392.72
Loss on sale of Investments - 18,266.20
(422.53) 18.23
Financial instruments measured at FVTPL - net change in fair value (1,676.93) (752.78)
Net Gain on Disposal of Investments measured at FVTPL 23 (1,208.55) (253.66)
Interest Income 24 (33.29) (16.48)
Rent Income from Investment Property 24 (139.16) (139.16)
Dividend income from investment in Joint Venture 24 (400.00) (800.00)
Finance Costs 27 139.14 8.37
24 (12.19) (68.63)
29 233.00 -
(70.20)
(Increase)/ Decrease in Inventories (7,077.21) -
(11,295.49) -
(Increase)/ Decrease in Current Investments (21,621.07) 6,903.22
- 24,595.43
(Increase)/ Decrease in Financial Assets and Other assets (7,452.83) (2,646.89)
14,807.65 (68.09)
28,713.47
(1,812.80) (2,421.83)
26,291.64
(32.31) (6.67)
Proceeds on disposal of Property, Plant and Equipment 0.15 9.32
Rental Income from Investment Property 24 139.16 139.16
(1,196.79) (4.98)
Investment in Joint Venture - (12,462.95)
Investment in Associate - (926.71)
(Purchase)/ Sale of Non-current Investments 29,132.63 (40,960.74)
Proceeds from sale of undertaking - 28,475.00
- 1,262.42
Dividend received from Investment in a Joint Venture 24 400.00 800.00
Interest Received 38.45 -

62 | Dhunseri Petrochem Limited
(` in lakhs)
31 March 2018 31 March 2017
(23,676.15)
` 142.60 lakhs (Previous Year- ` 40 (843.10) (1,676.57)
Finance Costs paid 27 (139.14) (8.37)
Current Borrowings-Receipts 19 10,646.09 -
(1,684.94)
Net increase/(decrease) in Cash and Cash Equivalents (A+B+C) 4,584.89 930.55
Opening Cash and Cash Equivalents 12 972.41 3,365.53
Less: Cash and Cash Equivalents transferred as per Scheme of Arrangement 33 - (3,323.67)
12 972.41
Annual Report 2017-18 | 63
2018.
` 5000 are fully depreciated in the year of purchase. In respect of the following

64 | Dhunseri Petrochem Limited
the carrying amount of the replaced part is derecognised.
Non-Factory Building 60 years
loss, if any.
assets or CGUs.
amount of any goodwill allocated to the CGU, and then to reduce the carrying amounts of the other assets of the CGU (or Company of

Annual Report 2017-18 | 65
costs necessary to make the sale.
Financial assets
• FVTPL
on the principal amount outstanding.
mismatch that would otherwise arise.

66 | Dhunseri Petrochem Limited
Financial assets at FVTPL
Equity investments at FVOCI
or loss.
Financial assets
all of the risks and rewards of the transferred assets, the transferred assets are not derecognised.
is recognised in profit or loss.

Annual Report 2017-18 | 67
in which they are incurred.
rupee (`
period in which they occur, directly in Other Comprehensive Income. They are included in retained earnings in the statement of changes in Equity.
in which the employee has rendered the service.

68 | Dhunseri Petrochem Limited
or to an item recognised directly in equity or in other comprehensive income.

Annual Report 2017-18 | 69
Such assets, or disposal groups, are generally measured at the lower of their carrying amount and fair value less costs to sell. Any resultant
depreciated, and any equity-accounted investee is no longer equity accounted.

70 | Dhunseri Petrochem Limited
in a foreign currency.
impact is not material.
rd.

Annual Report 2017-18 | 71
(` in lakhs)
BuildingsFurniture
and
Balance at 01 April 2016 1,290.11 38.92 13.96 41.51 51.23 1,435.73
- 4.66 2.01 - - 6.67
Disposals / Adjustments (1.40) (20.57) - (13.18) (36.50) (71.65)
Transfer to Investment Property 4 (1,280.33) - - - - (1,280.33)
8.38 23.01 15.97 28.33 14.73 90.42
8.38 23.01 15.97 28.33 14.73 90.42
- - 7.95 16.51 6.07 30.53
- - (0.30) - - (0.30)
Adjustments during the year - (23.01) 23.50 (0.49) - -
Balance at 31 March 2018 -
Balance at 01 April 2016 22.76 - 0.77 5.18 23.06 51.77
0.17 3.60 2.06 6.54 10.19 22.56
Disposals / Adjustments - - - (3.01) (23.86) (26.87)
Transfer to Investment Property 4 (22.59) - - - - (22.59)
0.34 3.60 2.83 8.71 9.39 24.87
0.34 3.60 2.83 8.71 9.39 24.87
0.17 - 12.46 6.85 0.36 19.84
- - (0.15) - - (0.15)
Adjustments during the year - (3.60) 3.87 (0.27) - -
Balance at 31 March 2018 -
8.04 19.41 13.14 19.62 5.34 65.55
-
(a) Adjustments represent regrouping of the assets during the year.

72 | Dhunseri Petrochem Limited
(` in lakhs)
Buildings
Balance at 01 April 2016 -
Transfer from Property, Plant and Equipment 3 1,280.33
1,280.33
-
Balance at 31 March 2018
Balance at 01 April 2016 -
Transfer from Property, Plant and Equipment 3 22.59
22.66
45.25
22.66
Balance at 31 March 2018
1,235.08
` `1049.17 lakhs) and ` `
(` in lakhs)
March 2018 March 2017
Rental Income 139.16 139.16
- -
139.16
22.66 22.66
116.50
`2017- `

Annual Report 2017-18 | 73
(` in lakhs)
March 2018 March 2017
3,200.00
(` in lakhs)
Balance at 01 April 2016 -
-
-
-
1.78
Balance at 31 March 2018
Balance at 01 April 2016 -
-
-
-
0.44
Balance at 31 March 2018
-

74 | Dhunseri Petrochem Limited
(` in lakhs)
31 March 2018 31 March 2017
value of ` 10/- each 4,883.00 4,883.00
value of SGD1 each 1,099.95 157.27
value of ` 10/- each 1,000.00 (233.00)
4.98 -
value of ` 10/- each 35 3,812.00 2,000.00
` 10/- each 35 - 1,812.00
US$ 100 each 93.61 97.11
8,954.36
15 -
8,954.36
` 10/- each 744.29 537.89
` 5/- each 41.88 -
` 10/- each 250.12 -
` 10/- each - 895.15
` 1/- each - 1,005.72
` 5/- each 595.19 -
` 1/- each - 290.70
` 2/- each - 712.21
` 10/- each - 220.52

Annual Report 2017-18 | 75
(` in lakhs)
31 March 2018 31 March 2017
` 10/- each 695.01 -
` 10/- each - 1,512.96
` 2/- each - 779.39
` 10/- each - 35.21
` 2/- each 329.48 140.19
` 10/- each 739.02 -
` 2/- each - 1,494.64
` 10/- each 108.19 -
` 10/- each - 1,100.52
` 10/- each 809.97 796.86
` 2/- each - 528.09
` 1/- each - 335.27
` 10/- each - 789.19
` 10/- each 741.80 -
` 5/- each 863.01 -
` 1/- each 1,339.65 -
` 5/- each - 517.71
` 10/- each 363.95 -
` 2/- each 1,470.20 2,232.33
` 10/- each - 118.60
` 10/- each - 154.67
` 10/- each 2,074.28 1,168.62
` 5/- each - 1,101.63

76 | Dhunseri Petrochem Limited
(` in lakhs)
31 March 2018 31 March 2017
` 1/- each - 574.05
` 2/- each 256.92 -
` 10/- each - 1,380.04
` 1/- each - 229.64
` 5/- each 755.46 935.87
` 10/- each - 1,238.97
` 10/- each 974.32 -
` 5/- each - 2,116.26
` 2/- each - 204.82
` 1/- each 502.14 577.56
` 10/- each - 1,773.95
` 2/- each 422.26 590.47
` 1/- each 289.03 642.74
` 2/- each - 837.20
` 10/- each - 1,438.34
` 1/- each 113.36 -
` 10/- each - 241.88
` 2/- each - 284.14
` 10/- each - 1,350.62
` 10/- each - 2,063.65
` 10/- each 1,091.62 -
` 10/- each - 307.16
` 10/- each - 142.49

Annual Report 2017-18 | 77
(` in lakhs)
31 March 2018 31 March 2017
` 1/- each - 347.09
` 10/- each - 131.41
` 2/- each 237.11 -
` 1/- each - 344.08
` 1/- each - 125.83
` 10/- each - 1,129.84
` 10/- each 1,034.62 1,467.90
` 2/- each - 820.83
` 2/- each - 561.90
` 1/- each 1,453.38 -
` 5/- each - 1,127.50
` 10/- each 962.86 -
` 10/- each - 646.75
` 10/- each 538.28 45.74
` 1/- each - 1,840.99
` 10/- each - 1,409.64
` 10/- each 33.18 -
` 10/- each 1,014.89 954.26

78 | Dhunseri Petrochem Limited
(` in lakhs)
31 March 2018 31 March 2017
Pte. Ltd. - 740.90
`Polypet Pvt Ltd. 35 - 10,403.76
` 1,000/- each of IVL Dhunseri Petrochem Industries Pvt Ltd 35 10,537.01 -
11,144.66
64,450.70
20,845.47 44,351.68
Aggregate market value of quoted investments 20,845.47 44,351.68
Aggregate value of unquoted investments 20,617.32 20,099.02
Aggregate amount of impairment in value of investments 58.25 -
(` in lakhs)
31 March 2018 31 March 2017
` 10/- each 128.71 -
` 5/- each 716.13 -
` 10/- each 880.87 -
` 5/- each 198.38 -
` 10/- each 231.67 -
` 2/- each 242.46 -
` 10/- each 246.34 -
` 10/- each 36.06 -
` 10/- each 26.06 -
` 10/- each 761.13 -

Annual Report 2017-18 | 79
(` in lakhs)
31 March 2018 31 March 2017
` 10/- each 247.28 -
` 5/- each 287.81 -
` 1/- each 446.55 -
` 5/- each 427.78 -
` 10/- each 112.28 -
` 2/- each 85.64 -
` 10/- each 324.78 -
` 1/- each 73.42 -
` 2/- each 301.54 -
` 1/- each 95.20 -
` 1/- each 37.79 -
` 10/- each 363.87 -
` 2/- each 678.85 -
` 1/- each 484.46 -
` 10/- each 604.14 -
` 10/- each 11.06 -
` 10/- each 7.01 -
-
- 0.14
` 1000/- each 199.49 -
` 1,000/- each 577.98 -
` 1,000/- each 1,111.35 1,036.04
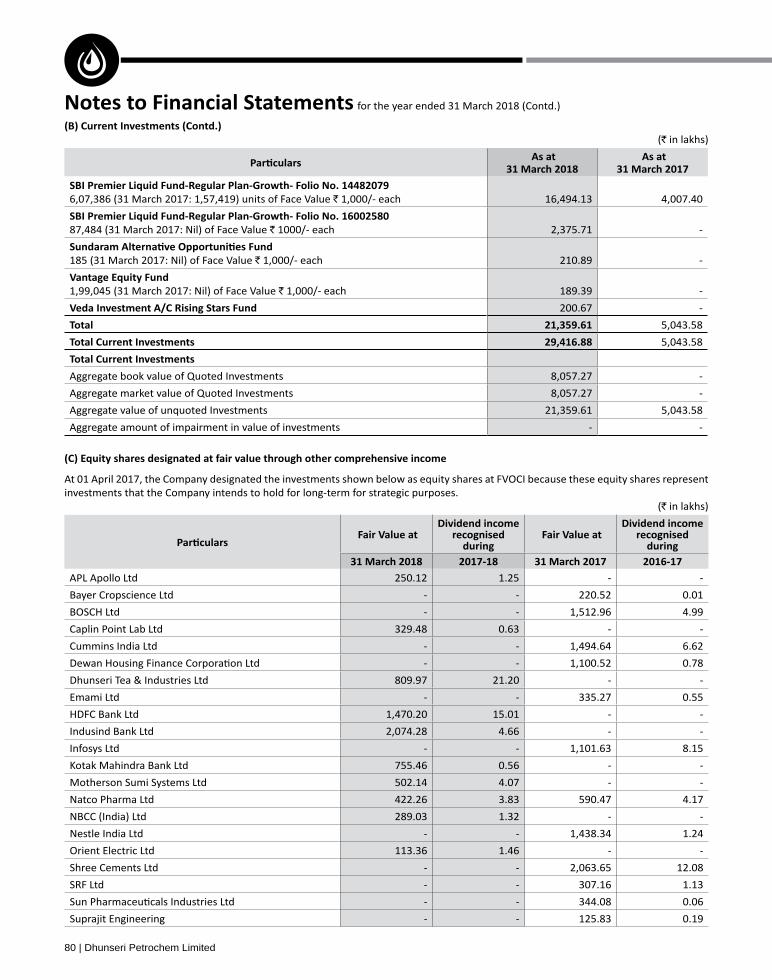
80 | Dhunseri Petrochem Limited
(` in lakhs)
31 March 2018 31 March 2017
` 1,000/- each 16,494.13 4,007.40
` 1000/- each 2,375.71 -
` 1,000/- each 210.89 -
` 1,000/- each 189.39 -
200.67 -
5,043.58
5,043.58
8,057.27 -
Aggregate market value of Quoted Investments 8,057.27 -
Aggregate value of unquoted Investments 21,359.61 5,043.58
Aggregate amount of impairment in value of investments - -
investments that the Company intends to hold for long-term for strategic purposes.(` in lakhs)
Dividend income recognised
during
Dividend income recognised
during 31 March 2018 2017-18 31 March 2017 2016-17
APL Apollo Ltd 250.12 1.25 - -
Bayer Cropscience Ltd - - 220.52 0.01
- - 1,512.96 4.99
329.48 0.63 - -
Cummins India Ltd - - 1,494.64 6.62
- - 1,100.52 0.78
809.97 21.20 - -
Emami Ltd - - 335.27 0.55
1,470.20 15.01 - -
Indusind Bank Ltd 2,074.28 4.66 - -
Infosys Ltd - - 1,101.63 8.15
755.46 0.56 - -
502.14 4.07 - -
Natco Pharma Ltd 422.26 3.83 590.47 4.17
NBCC (India) Ltd 289.03 1.32 - -
Nestle India Ltd - - 1,438.34 1.24
Orient Electric Ltd 113.36 1.46 - -
Shree Cements Ltd - - 2,063.65 12.08
SRF Ltd - - 307.16 1.13
- - 344.08 0.06
Suprajit Engineering - - 125.83 0.19

Annual Report 2017-18 | 81
(` in lakhs)
Dividend income recognised
during
Dividend income recognised
during
31 March 2018 2017-18 31 March 2017 2016-17
1,034.62 16.03 - -
- - 1,127.50 1.95
Whirlpool of India Ltd 1,014.89 2.22 - -
11,762.57 41.92
investments derecognised during the period 2.23
(` in lakhs)
31 March 2018 31 March 2017
Loans - 1,610.38 - -
- - -
It represents loan provided to Assam Company India Limited for its working capital requirements. Total Loan outstanding as at the ` Nil lakhs, Loan provided during the year ` ` Nil lakhs), Total Loan
outstanding as at the end of the year amounts to ` ` Nil lakhs)
(` in lakhs)
Advance for purchase of investments - - 700.00 670.86
- - - 16.48
Interest accrued on Deposits 6.06 - - -
Interest accrued on Loan 5.26 - - -
- - 0.78 -
- - 1.98 -
1,801.03 - 1,178.46 -
- - 95.29 -
- 1,976.51 687.34
(` in lakhs)
5,311.25 - 49.46 -
Other Advances
Advance to suppliers/ service providers 37.92 - - -
186.15 - 2.12 -
Advances to employees 2.18 6.69 0.36 1.05
Others
1,197.58 - - -
51.94 1.05
82 | Dhunseri Petrochem Limited
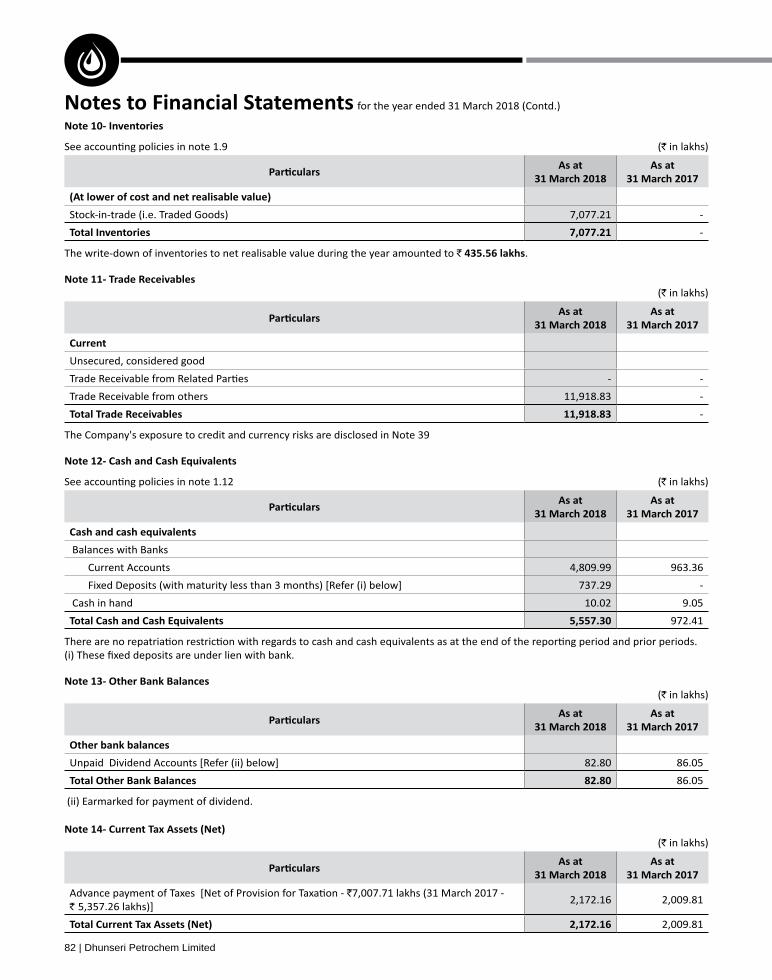
` in lakhs)
31 March 2018
31 March 2017
Stock-in-trade (i.e. Traded Goods) 7,077.21 -
-
` .
(` in lakhs)
31 March 2018
31 March 2017
Unsecured, considered good
- -
11,918.83 -
-
` in lakhs)
31 March 2018
31 March 2017
Balances with Banks
Current Accounts 4,809.99 963.36
737.29 -
Cash in hand 10.02 9.05
972.41
(` in lakhs)
31 March 2018
31 March 2017
Other bank balances
82.80 86.05
86.05
(ii) Earmarked for payment of dividend.
(` in lakhs)
31 March 2018
31 March 2017
` `
2,172.16 2,009.81
2,009.81

Annual Report 2017-18 | 83
for this purpose is Tastetaria Private Limited (“JV Company” or “Tastetaria”), which was formed in 2016 and was already pursuing such
share capital of Tastetaria from the Company while the Company will retain 25% of the share capital in Tastetaria.
(` in lakhs)
31 March 2018
6A 750.00
Less: Loss recognised during the year 174.75
(` in lakhs)
31 March 2018
31 March 2017
` 10/- each 35,122.00 35,122.00
` 10 each fully paid up 3,502.48 3,502.48
Add : Shares Forfeited 0.81 0.81
3,503.29
(` (`
3,50,24,754 3,502.48 3,50,24,754 3,502.48
3,50,24,754 3,50,24,754 3,502.48
The Company has one class of equity share having a par value of `
31 March 2018
31 March 2017
Dhunseri Investments Limited 1,95,39,718 1,88,72,000

84 | Dhunseri Petrochem Limited
31 March 2018
31 March 2017
Dhunseri Investments Limited 1,95,39,718 1,88,72,000
55.79% 53.88%
Naga Dhunseri Group Limited 30,78,759 30,78,759
8.79% 8.79%
20,79,414 20,79,414
5.94% 5.94%
(` in lakhs)
31 March 2018
31 March 2017
262.07 262.07
12.48 12.48
1,661.41 1,661.41
33,830.83 33,830.83
36,640.95 33,828.05
69,594.84
(` in lakhs)
31 March 2018
31 March 2017
7,358.91 2,733.23
2,733.23
72,328.07
(` in lakhs)
31 March 2018
31 March 2017
262.07 262.07
12.48 12.48
1,661.41 1,661.41
provisions of the Act.
33,830.83 33,830.83

Annual Report 2017-18 | 85
(` in lakhs)
31 March 2018
31 March 2017
33,828.05 37,703.05
3,660.80 (2,205.78)
(4.80) 17.97
(700.50) (1,400.99)
(142.60) (286.20)
33,828.05
(` in lakhs)
31 March 2018
31 March 2017
2,733.23 150.13
Add: Equity investments through Other Comprehensive income- Net gain on disposal and 4,625.68 2,583.10
2,733.23
(` in lakhs)
31 March 2018
31 March 2017
13.91 2.38
28.13 21.74
24.12
Non current 30.50 13.40
Current 11.54 10.72
24.12
(investment) risk.
` `

86 | Dhunseri Petrochem Limited
(` in lakhs)
Funded
31 March 2018 31 March 2017
419.65
Transferred pursuant to Scheme of Arrangement 33 - (240.34)
- (68.63)
- (27.83)
Current service cost 3.98 3.93
Interest cost 5.76 8.35
adjustments 7.38 (18.70)
76.43
(` in lakhs)
Funded
31 March 2018 31 March 2017
173.27
Transferred pursuant to Scheme of Arrangement - (173.27)
- 97.79
- (27.83)
Interest income 5.59 4.09
Actuarial gain on plan assets recognised in other comprehensive income - -
74.05
2.38
(` in lakhs)
Funded
31 March 2018 31 March 2017
Current service cost 3.98 3.93
Interest cost 5.76 8.35
Interest Income (5.59) -
12.28
(` in lakhs)
Funded
31 March 2018 31 March 2017
7.38 (18.70)
- (4.09)
(22.79)
Funded
31 March 2018 31 March 2017
100.00% 100.00%

Annual Report 2017-18 | 87
Funded
31 March 2018 31 March 2017
Discount rate 7.73% 7.54%
Future salary growth 7.50% 5.00%
(` in lakhs)
31 March 2018 31 March 2017
Decrease Decrease
Discount Rate (0.50% movement) (1.17) 1.23 (0.93) 0.96
Future salary growth (0.50% movement) 1.23 (1.18) 0.98 (0.95)
(` in lakhs)
Year 31 March 2018 31 March 2017
a) 0 to 1 Year 48.84 44.69
0.73 0.49
c) 2 to 3 Year 0.75 0.50
d) 3 to 4 Year 0.76 0.53
e) 4 to 5 Year 2.92 0.54
f) 5 to 6 Year 36.00 0.55
g) 6 Year onwards 3.56 29.12
` `10.25 lakhs) on account of the Company's ` ` 11.69 lakhs) on account of the Company's Provident Fund
(` in lakhs)
31 March 2018
31 March 2017
517.05 458.23
14.69 8.35
449.88

88 | Dhunseri Petrochem Limited
(` in lakhs)
31 March 2018
31 March 2017
10,846.91 -
-
(` in lakhs)
31 March 2018
31 March 2017
- -
13,409.37 -
1,394.04 152.75
152.75
(` in lakhs)
31 March 2018 31 March 2017
- Principal - -
- Interest - -
- -
- -
- -
- -
(` in lakhs)
31 March 2018
31 March 2017
Unpaid Dividends 82.80 86.05
86.05
(` in lakhs)
31 March 2018
31 March 2017
57.46 35.86
112.65 -
35.86
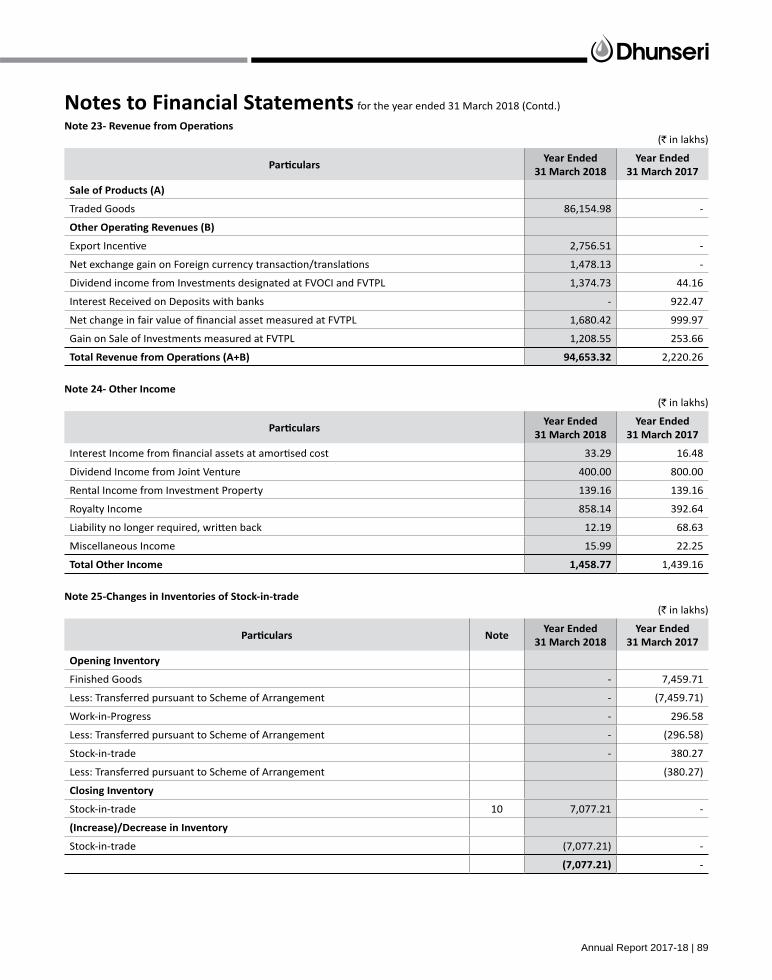
Annual Report 2017-18 | 89
(` in lakhs)
31 March 2018
31 March 2017
Traded Goods 86,154.98 -
2,756.51 -
1,478.13 -
Dividend income from Investments designated at FVOCI and FVTPL 1,374.73 44.16
- 922.47
1,680.42 999.97
Gain on Sale of Investments measured at FVTPL 1,208.55 253.66
2,220.26
(` in lakhs)
31 March 2018
31 March 2017
33.29 16.48
Dividend Income from Joint Venture 400.00 800.00
Rental Income from Investment Property 139.16 139.16
Royalty Income 858.14 392.64
12.19 68.63
15.99 22.25
1,439.16
(` in lakhs)
31 March 2018
31 March 2017
Finished Goods - 7,459.71
Less: Transferred pursuant to Scheme of Arrangement - (7,459.71)
Work-in-Progress - 296.58
Less: Transferred pursuant to Scheme of Arrangement - (296.58)
Stock-in-trade - 380.27
Less: Transferred pursuant to Scheme of Arrangement (380.27)
Stock-in-trade 10 7,077.21 -
Stock-in-trade (7,077.21) -
-

90 | Dhunseri Petrochem Limited
` in lakhs)
31 March 2018
31 March 2017
Salaries, Wages and Bonus 369.15 231.15
33.71 21.94
4.15 12.28
60.70 1.10
266.47
(` in lakhs)
31 March 2018
31 March 2017
139.14 8.37
8.37
` in lakhs)
31 March 2018
31 March 2017
3 19.84 22.56
4 22.66 22.66
5 0.44 -
45.22
(` in lakhs)
31 March 2018
31 March 2017
Clearing and Forwarding Charges 477.40 -
Freight, Delivery and Shipping charges 5,624.83 -
Brokerage and Commission on Sales 570.44 -
Loss on sale of Property, Plant and Equipment - 1.50
- 17.99
Rent 38 39.13 60.89
5.79 4.87
Insurance - 4.99
- 0.54
- 4.89
- 392.72
88.29 130.30
- 50.00
Financial Assets-mandatorily measured at FVTPL- net change in fair value 3.49 247.19
233.00 -
Professional Charges 483.70 679.00
111.94 145.49
485.11 138.49
1,878.86

Annual Report 2017-18 | 91
(` in lakhs)
31 March 2018
31 March 2017
88.19 130.30
Others 0.10 -
130.30
88.19 130.30
Amount spent during the year on
- 130.30
88.29 -
(` in lakhs)
31 March 2018
31 March 2017
As auditor
Statutory audit 12.00 25.00
Limited Review of quarterly results 6.00 8.25
- 5.00
In other capacity
9.75 2.25
1.08 0.88
41.38
`
`18,266.20 lakhs.
(` in lakhs)
31 March 2018
31 March 2017
Current period 539.19 1,465.65
169.08 (16,061.07)
169.08 (16,061.07)
(14,595.42)

92 | Dhunseri Petrochem Limited
(` in lakhs)
Year ended 31 March 2018
(7.38) 2.58 (4.80)
5,622.92 (997.24) 4,625.68
Year ended 31 March 2017
22.47 4.50 17.97
2,583.10 - 2,583.10
2,605.57 4.50 2,601.07
(` in lakhs)
Year ended 31 March 2018
4,369.07
34.61% 1,512.05
-14.39% (628.65)
0.82% 35.65
-10.30% (449.82)
5.47% 239.04
Year ended 31 March 2017
(16,805.70)
34.61% (5,816.12)
1.82% (306.59)
-1.08% 181.02
14.84% (2,494.52)
36.65% (6,159.21)
86.84% (14,595.42)

Annual Report 2017-18 | 93
(` in lakhs)
Balance as at
2017
Recognised
loss during 2017-18
Recognised
2017-18
Balance as at
31 March 2018
equipment (450.13) (0.59) - (450.72)
(8.10) (174.83) 116.60 (66.33)
8.35 6.34 - 14.69
Balance as at
2016
Recognised
loss during 2016-17
Recognised
2016-17
Balance as at
31 March 2017
equipment (16,314.35) 15,864.22 - (450.13)
(228.24) 220.14 - (8.10)
Instrument (2.11) 2.11 - -
(140.67) 140.67 - -
8.10 (8.10) - -
(7.70) 7.70 - -
174.02 (161.17) (4.50) 8.35
`
(` in lakhs)
31 March 2018
31 March 2017
` in lakhs) 3,660.80 (2,205.78)
3,50,24,754 3,50,24,754
(iii) Face value of each Equity Shares (`) 10.00 10.00
- -
(vii) Basic and Diluted earnings per share (`) 10.45 (6.30)

94 | Dhunseri Petrochem Limited
(` in lakhs)
Opening balance as at
changesbalance as
at 31 March 2018
Borrowings - 10,646.09 200.82 10,846.91
-
Private Limited (the “Transferor Companies”) with IVL Dhunseri Petrochem Industries Private Limited (formerly known as Dhunseri
230 to 232 of the Companies Act, 2013.
Company.
The Company held 50,00,000 equity shares of Face value of ` ` 1,000 each
Face value of ` ` 1,000 each in IVL Dhunseri Petrochem Industries Private Limited.
(` in lakhs)
31 March 2018
31 March 2017
(a) Bank Guarantee * 675.91 -
` 675.91 lakhs to Standard Chartered Bank in respect of the loan
` Nil lakhs, Guarantee given during the year ` 675.91 lakhs ` Nil lakhs), Total Guarantee given outstanding as at the end of the year amounts to ` ` Nil

Annual Report 2017-18 | 95
(` in lakhs)
31 March 2018
31 March 2017
- -
`2,753.12 lakhs pertaining to 2,753.12 2,753.12
(` in lakhs)
`
31 March 2018
31 March 2017
Lease rent 39.13 60.89
loss or gain.

96 | Dhunseri Petrochem Limited
Revenue from 1 customer of the Company is ` ` Nil lakhs) which is more than 10% of the total revenue of the Company.
6(B), 7, 8, 9, 10, 11.
`` 1,058.46 lakhs.
(` in lakhs)
More than More than
10,846.91 - - -
14,803.41 - 152.75 -
82.80 - 86.05 -
- 238.80 -
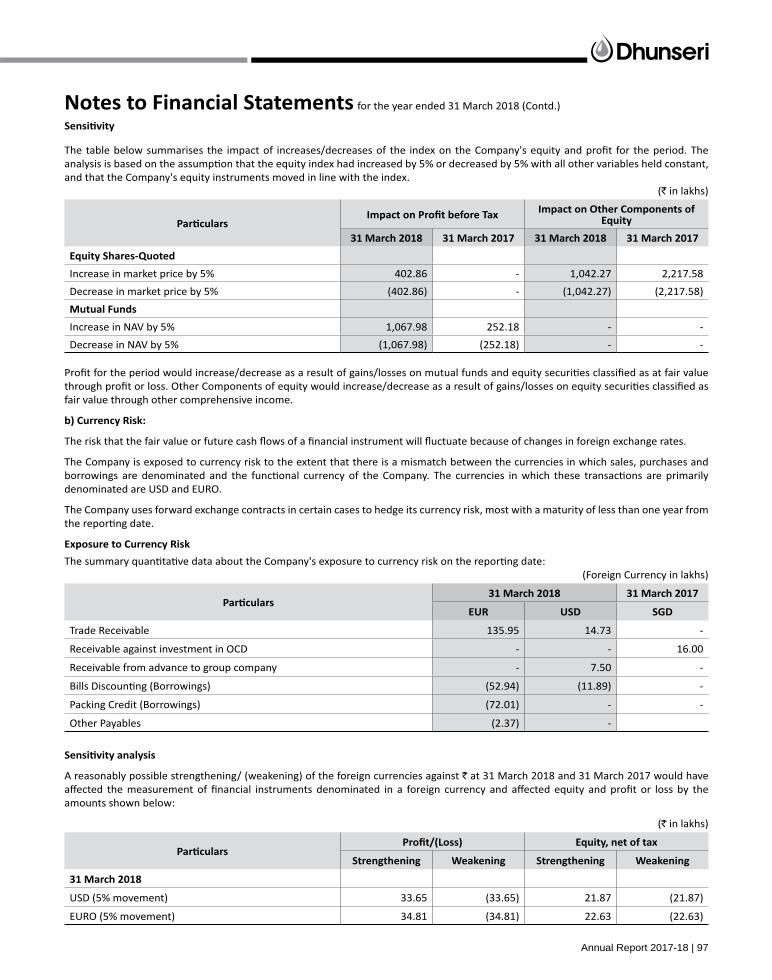
Annual Report 2017-18 | 97
(` in lakhs)
31 March 2018 31 March 2017 31 March 2018 31 March 2017
402.86 - 1,042.27 2,217.58
(402.86) - (1,042.27) (2,217.58)
Mutual Funds
1,067.98 252.18 - -
(1,067.98) (252.18) - -
fair value through other comprehensive income.
denominated are USD and EURO.
(Foreign Currency in lakhs)
31 March 2018 31 March 2017
135.95 14.73 -
- - 16.00
- 7.50 -
(52.94) (11.89) -
Packing Credit (Borrowings) (72.01) - -
(2.37) -
`
(` in lakhs)
Weakening Weakening
31 March 2018
USD (5% movement) 33.65 (33.65) 21.87 (21.87)
EURO (5% movement) 34.81 (34.81) 22.63 (22.63)

98 | Dhunseri Petrochem Limited
(` in lakhs)
Weakening Weakening
- -
SGD 38.47 (38.47) 25.01 (25.01)
our shareholders.
the Company may adjust the amount of dividends paid to shareholders, return capital to shareholders or issue new shares.
to maintain, or if necessary adjust, its capital structure.
(` in lakhs)
31 March 2018
31 March 2017
(i) Dividend on Equity Shares paid during the year
` ` 4.00) per fully paid share of `10 each
700.50 1,400.99
142.60 286.20
` 3.50 per fully paid equity share of face value of ` 1,225.87 -
249.56 -

Annual Report 2017-18 | 99
` in
lakh
s)
Fair
valu
e
othe
rs
Oth
er
asse
ts -
in
stru
men
ts
Oth
er
amou
nt
6A 1
0,53
7.01
-
- -
10,
537.
01
- -
10,
537.
01
10,
537.
01
Inve
stm
ent i
n Q
uote
d Eq
uity
Inst
rum
ents
8,0
57.2
7 -
20,
845.
47
- 2
8,90
2.74
2
8,90
2.74
-
- 2
8,90
2.74
Inve
stm
ent i
n un
quot
ed E
quity
Inst
rum
ents
6A -
- 9
3.61
-
93.
61
- -
93.
61
93.
61
6B 2
1,35
9.61
-
- -
21,
359.
61
- 2
1,35
9.61
-
21,
359.
61
- -
11 -
11,
918.
83
- -
11,
918.
83
Cash
and
Cas
h Eq
uiva
lent
s (a
)12
- 5
,557
.30
- -
5,5
57.3
0
13 -
82.
80
- -
82.
80
Loan
s7
- 1
,610
.38
- -
1,6
10.3
8
8 -
1,8
12.3
5 -
- 1
,812
.35
- -
-
Borr
owin
gs19
- -
- 1
0,84
6.91
1
0,84
6.91
20 -
- -
14,
803.
41
14,
803.
41
21 -
- -
82.
80
82.
80
- -
-

100 | Dhunseri Petrochem Limited
` in
lakh
s)
Fair
valu
e
othe
rs
Oth
er
asse
ts -
in
stru
men
ts
Oth
er
amou
nt
6A 1
0,40
3.76
-
- -
10,
403.
76
- -
10,
403.
76
10,
403.
76
Inve
stm
ent i
n Q
uote
d Eq
uity
Inst
rum
ents
6A -
- 4
4,35
1.68
-
44,
351.
68
44,
351.
68
- -
44,
351.
68
Inve
stm
ent i
n un
quot
ed E
quity
Inst
rum
ents
6A -
- 9
7.11
-
97.
11
- -
97.
11
97.
11
6B 5
,043
.58
- -
- 5
,043
.58
- 5
,043
.58
- 5
,043
.58
- -
6A -
740
.90
- -
740
.90
Cash
and
Cas
h Eq
uiva
lent
s (a
)12
- 9
72.4
1 -
- 9
72.4
1
13 -
86.
05
- -
86.
05
Loan
s7
- 1
.41
- -
1.4
1
8 -
2,6
63.8
5 -
- 2
,663
.85
- -
-
20 -
- -
152
.75
152
.75
21 -
- -
86.
05
86.
05
- -
-

Annual Report 2017-18 | 101
` in
lakh
s)
Deb
entu
res
Deb
entu
res
Valu
e as
at c
omm
ence
men
t of t
he y
ear
10,
403.
76
97.
11
- -
- -
10,
650.
95
97.1
1
durin
g th
e ye
ar13
3.25
(3.5
0)(2
47.1
9)-
Valu
e as
at e
nd o
f the
yea
r 1
0,40
3.76
9
7.11
mea
sure
men
t
scen
ario
-For
ecas
t ann
ual r
even
ue g
row
th ra
te (3
1
2018
: 11.
5%)
(dec
reas
e) if
:- t
he a
nnua
l rev
enue
gro
wth
wer
e hi
gher
-the
risk
adj
uste
d di
scou
nt ra
te w
ere
low
er
(hig
her)
102 | Dhunseri Petrochem Limited
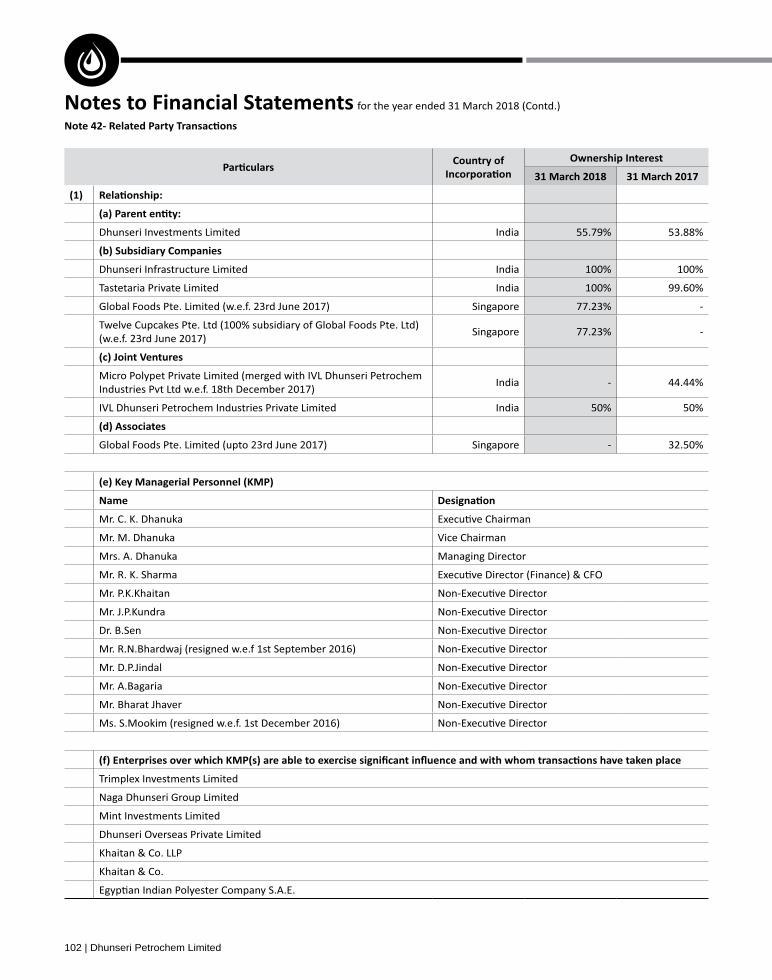
31 March 2018 31 March 2017
Dhunseri Investments Limited India 55.79% 53.88%
Dhunseri Infrastructure Limited India 100% 100%
Tastetaria Private Limited India 100% 99.60%
Singapore 77.23% -
(w.e.f. 23rd June 2017)Singapore 77.23% -
India - 44.44%
IVL Dhunseri Petrochem Industries Private Limited India 50% 50%
Singapore - 32.50%
Vice Chairman
Dr. B.Sen
Naga Dhunseri Group Limited
Dhunseri Overseas Private Limited

Annual Report 2017-18 | 103
(` in lakhs)
31 March 2018 31 March 2017
Dividend Paid 380.38 686.60
1.16
- 392.72
Investment in Shares* 995.00 4.98
11.18
2.39
Investment in Shares - 1,812.00
- 10,650.95
Investment in Shares - 0.01
Rental Income and other service charges 157.14 146.38
Dividend Received 400.00 800.00
Royalty Income 858.14 392.64
Purchase of PET Resin (90,047.32) -
(367.17) -
(12,097.21) 1,178.46
Investment in Shares 173.24 157.27
- 769.44
- -
Rent and Service Charges 43.76 53.41
Refund of Security Deposit - (66.00)
Dividend Paid 5.76 11.53

104 | Dhunseri Petrochem Limited
(` in lakhs)
31 March 2018 31 March 2017
Rent and Service Charges - 6.50
Dividend Paid 41.59 81.42
Dividend Paid 61.58 123.15
Advance given* 486.47 -
486.47 -
- 1,262.42
- -
157.55 92.60
2.39 2.28
0.06 -
Dhunseri Petrochem Limited Employees Gratuity Fund - 97.79
Purchase of 100 equity shares of Tastetaria Pvt Ltd of FV ` 10 each 0.01 -
Purchase of 100 equity shares of Tastetaria Pvt Ltd of FV ` 10 each 0.01 -
(h) The Company has given a Corporate Guarantee amounting to ` 675.91 lakhs to Standard
Pte Ltd.*
(` in lakhs)
31 March 2018 31 March 2017
312.90 165.45
30.14 18.45
15.08 6.49
15.20 24.80

Annual Report 2017-18 | 105
(` in lakhs)
Fees
132.11 6.15 0.32 - 138.58
88.72 10.37 11.84 - 110.93
92.07 13.62 2.92 - 108.61
- - - 1.50 1.50
- - - 1.50 1.50
- - - 4.60 4.60
- - - 3.10 3.10
- - - 0.50 0.50
- - - 0.90 0.90
- - - 3.10 3.10
(` in lakhs)
Fees
54.79 5.27 3.26 - 63.32
92.47 9.07 3.23 - 104.77
12.31 2.52 - 3.00 17.83
5.88 1.59 - 1.00 8.47
- - - 3.30 3.30
- - - 6.40 6.40
- - - 4.70 4.70
- - - 1.00 1.00
- - - 0.80 0.80
- - - 1.50 1.50
- - - 1.70 1.70
- - - 1.40 1.40
(` in lakhs)
31 March 2018 31 March 2017
(55.00) (35.00)
(10.00) (10.00)
(50.00) -

106 | Dhunseri Petrochem Limited
` - absolute amountOther
notes
- - -
- 1,20,000 1,20,000
- - -
- - -
- 29,984 29,984
- - -
(-) Amount deposited in Banks - - -
- 90,016 90,016
of 65% shares of EIPET from Dhunseri Overseas Private Limited.

Annual Report 2017-18 | 107
To
We have audited the accompanying consolidated
together referred to as “the Group”), its associate and its joint venture, which comprise the Consolidated Balance
the Consolidated Statement of Cash Flows for the year then
for the preparation of these consolidated Ind AS financial statements in terms of the requirements of the Companies Act, 2013 (hereinafter referred to as “the Act”) that give a true and fair view of the consolidated state of affairs, consolidated profit/loss and other comprehensive income, consolidated statement of changes in equity and consolidated cash flows of the Group including its associate and joint venture in accordance with the accounting principles generally accepted in India, including the Indian
of the Act.
with the provisions of the Act for safeguarding the assets of the
fair view and are free from material misstatement, whether
We have taken into account the provisions of the Act, the
of the Act and the Rules made thereunder.
require that we comply with ethical requirements and plan
from material misstatement.
selected depend on the auditor's judgement, including the assessment of the risks of material misstatement of the
fraud or error. In making those risk assessments, the auditor

108 | Dhunseri Petrochem Limited
statements that give a true and fair view in order to design audit procedures that are appropriate in the circumstances.
statements or, if such disclosures are inadequate, to modify
statements.
Opinion
the consideration of reports of other auditors on separate financial statements and on the other financial information
aforesaid consolidated Ind AS financial statements give
required and give a true and fair view in conformity with the accounting principles generally accepted in India, of the consolidated state of affairs of the Group, its associate and
profit and other comprehensive income, consolidated statement of changes in equity and consolidated cash flows for the year ended on that date.
1.
2017 prepared in accordance with Ind AS included
periods. The report of the predecessor auditor on the
`
of `
to ` 169.59 lakhs for the year ended on that date, as
Group's share of net loss of ` 52.85 lakhs for the year
statements, in so far as it relates to the amounts and
joint ventures and associate and our report in terms
auditors.
statements, and our report on Other Legal and
reliance on the work done and the report of the other auditors.
1.
Annual Report 2017-18 | 109
c) The Consolidated Balance Sheet, the Consolidated
Flow Statement and Consolidated Statement of Changes
statements.
d) In our opinion, the aforesaid consolidated Ind AS
the Auditor's Report in accordance with Rule 11 of
the Companies (Audit and Auditors) Rules, 2014, in
venture. Refer Note 41 to the Ind AS consolidated
ii. The Group, its associate and joint venture did not have
statements regarding holdings as well as dealings in

110 | Dhunseri Petrochem Limited
statements of
company, and joint venture, which are companies incorporated
in India as of that date.
control stated in the Guidance Note on Audit of Internal
on our audit. We conducted our audit in accordance with the
Guidance Note on Audit of Internal Financial Controls Over
Note require that we comply with ethical requirements and plan
assessed risk. The procedures selected depend on the auditor’s
judgement, including the assessment of the risks of material
whether due to fraud or error.
and procedures that (1) pertain to the maintenance of records

Annual Report 2017-18 | 111
controls, material misstatements due to error or fraud may
that the degree of compliance with the policies or procedures
may deteriorate.
Opinion
and joint venture has, in all material respects, an adequate
components of internal control stated in the Guidance Note on
Other M
incorporated in India.

112 | Dhunseri Petrochem Limited
(` in lakhs)
31 March 2018 31 March 2017
(a) Property, Plant and Equipment 3 893.13 315.94 Capital Work in Progress 3 4,582.55 4,574.34
(c) lnvestment Property 4 1,212.42 1,235.08 (d) 5 1.34 - (e) Goodwill 51 776.75 - (f) Equity accounted investees 6 51,685.41 47,379.13 (g) Financial Assets
(i) Investments 7A 31,474.71 55,593.46 (ii) Loans 8 1,610.38 - (iii) Other Financial Assets 9 - 687.34
(h) Other Non-Current Assets 10 474.54 2.25 1,09,787.54
(a) Inventories 11 7,103.06 - Financial Assets
12 11,968.49 - (ii) Investments 7B 29,416.88 5,043.58 (iii) Cash and Cash Equivalents 13 5,832.05 1,012.98
14 82.80 86.05 (v) Other Financial Assets 9 1,811.63 1,976.51
(c) 15 2,172.16 2,009.81 (d) Other Current Assets 10 6,751.50 57.53 (e) Disposal Group - assets held for sale 16 761.08 -
10,186.46 1,19,974.00
(a) Equity Share Capital 17A 3,503.29 3,503.29 Other Equity 17B 1,15,846.13 1,06,509.67
1,10,012.96 (c) Non Controlling Interest 178.97 0.02
1,10,012.98
(a)(i) Borrowings 18 153.50 -
19 - - Provisions 20 182.02 13.40
(c) 21 11,755.39 9,659.32 9,672.72
(a) (i) Borrowings 22 11,496.56 -
23 15,099.33 152.75 24 84.61 86.41
Provisions 20 11.54 10.72 (c) 25 170.11 38.42 (d) 26 2.27 - (e) 16 127.16 -
288.30 1,19,974.00

Annual Report 2017-18 | 113
(` in lakhs)
31 March 2018 31 March 20171
27 96,979.82 2,220.26
Other Income 28 1,100.17 584.11
2,804.37
2
Purchases of Stock -in-trade 90,047.32 -
Cost of materials consumed 29 555.47 -
Changes in Inventories of Stock-in-trade 30 (7,077.21) -
31 1,625.38 266.47
Finance Costs 32 155.46 8.37
33 206.59 48.35
34 9,159.65 1,880.19
2,203.38
3 600.99
4 - -
5 600.99
6 52 4,350.06 4,338.86
7 4,939.85
8 35
539.19 1,465.65
2,066.95 (6,856.14)
10,330.34
10 - 46,588.48
11 - 1,782.00
12 - 44,806.48
13 55,136.82
14
(i) Equity investments through Other Comprehensive income- Net gain on disposal and change in fair value 5,622.92 2,583.10
(7.38) 22.47
(iii) Share of Other Comprehensive Income from Associate and Joint Venture accounted using equity method - (5.00)
- (4.00)
(994.66) (3.50)
62.88 (244.57)
2,348.50
15 57,485.32
16
- Owner of the Company 5,235.57 59,909.75
- Non-controlling interest (84.32) (4,772.93)
55,136.82
17
- Owner of the Company 4,683.76 2,348.50
- Non-controlling interest - -
2,348.50

114 | Dhunseri Petrochem Limited
(` in lakhs)
Notes Year Ended Year Ended
18
- Owner of the Company 9,919.33 62,258.25
- Non-controlling interest (84.32) (4,772.93)
57,485.32
5,235.57 10,330.34
- 49,579.41
59,909.75
20 36
[Nominal value per share: ` 10/- each (Previous Year- `
(1) Basic 14.95 29.49
(2) Diluted 14.95 29.49
21 36
[Nominal value per share: ` 10/- each (Previous Year- `
(1) Basic - 141.55
(2) Diluted - 141.55
22 36
[Nominal value per share: ` 10/- each (Previous Year- `
(1) Basic 14.95 171.04
(2) Diluted 14.95 171.04

Annual Report 2017-18 | 115
(` in
lakh
s)
Am
ount 3
,503
.29
Chan
ges
in e
quity
sha
re c
apita
l dur
ing
2016
-17
-
Bala
nce
as a
t 31
Mar
ch 2
017
Chan
ges
in e
quity
sha
re c
apita
l dur
ing
2017
-18
-
Bala
nce
as a
t 31
Mar
ch 2
018
(` in
lakh
s)
cont
rolli
ng
inte
rest
Oth
er R
eser
ves
to o
wne
rs
Rese
rve
Rese
rve
Rese
rve
Rese
rve
Reta
ined
Fo
reig
n
Rese
rve
Tota
l com
preh
ensi
ve in
com
e fo
r
- -
- -
59,
909.
75
- -
59,
909.
75
(4,7
72.9
3) 5
5,13
6.82
Oth
er C
ompr
ehen
sive
Inco
me
- -
- -
9.9
7 2
,583
.10
(244
.57)
2,3
48.5
0 -
2,3
48.5
0
- -
- -
- -
- -
(826
.82)
- 8
26.8
2 -
8,2
40.5
0 8
,240
.50
Div
iden
d -
- -
- (1
,400
.99)
- -
(1,4
00.9
9) -
(1,4
00.9
9)
- -
- -
(286
.20)
- -
(286
.20)
- (2
86.2
0)
Bala
nce
as a
t 31
Mar
ch 2
017
-

116 | Dhunseri Petrochem Limited
(` in
lakh
s)
cont
rolli
ng
inte
rest
Oth
er R
eser
ves
to o
wne
rs
Rese
rve
Rese
rve
Rese
rve
Rese
rve
Reta
ined
Fo
reig
n
Rese
rve
-
- -
- -
5,2
35.5
7 -
- 5
,235
.57
(84.
32)
5,1
51.2
5
Oth
er C
ompr
ehen
sive
Inco
me
- -
- -
(4.8
0) 4
,625
.68
62.
88
4,6
83.7
6 -
4,6
83.7
6
- -
- -
to o
wne
rs
Div
iden
d -
- -
- (7
00.5
0) -
- (7
00.5
0) -
(700
.50)
- -
- -
(142
.60)
- -
(142
.60)
- (1
42.6
0)
- -
- -
- -
- -
256
.07
256
.07
Chan
ges
in o
wne
rshi
p in
tere
st th
at
do n
ot re
sult
in lo
ss o
f con
trol
- -
- -
- -
- -
- 7
.20
7.2
0
Oth
ers
- -
- 2
60.2
3 -
- -
260
.23
- 2
60.2
3
Bala
nce
as a
t 31
Mar
ch 2
018

Annual Report 2017-18 | 117
(` in lakhs)
31 March 2018 31 March 2017
7,757.39 51,528.33
33 206.59 7,065.51
52 (4,350.06) (4,338.86)
Loss on disposal of property, plant and equipment - 6.39
- 392.72
- (57,065.29)
(422.53) (3,140.73)
Financial instruments measured at FVTPL - net change in fair value (1,676.93) (752.78)
Net Gain on Disposal of Investments measured at FVTPL (1,208.55) -
Interest Income 28 (34.97) (617.41)
Rent Income from Investment Property 28 (139.16) (81.18)
Finance Costs 32 155.46 10,106.45
28 (12.19) (68.63)
3,034.52
(Increase)/ Decrease in Inventories (7,103.06) (5,712.19)
(11,172.39) (7,710.84)
(Increase)/ Decrease in Current Investments (21,601.73) 6,649.57
- 19,793.71
(Increase)/ Decrease in Financial Assets and Other assets (7,761.40) (2,331.35)
15,026.18 24,256.44
37,979.86
(1,813.77) (2,580.76)
35,399.10
(984.30) (320.48)
Proceeds on disposal of Property, Plant and Equipment 0.15 14.32
Rental Income from Investment Property 28 139.16 81.18
(94.50) -
Investment in Joint Venture and Associate - (13,389.66)
(Purchase)/ Sale of Non-current Investments 29,132.64 (40,960.74)
Proceeds from sale of undertaking - 28,475.00
- 1,262.42
Dividend from joint venture 400.00 -
Interest Received 24.66 697.66
(24,140.30)

118 | Dhunseri Petrochem Limited
(` in lakhs)
31 March 2018 31 March 2017
` 142.60 lakhs (Previous Year- ` 285.21 (843.10) (1,687.19)
Finance Costs paid (155.46) (14,827.46)
Current Borrowings-Receipts 11,394.27 2,445.80
(14,068.85)
(2,810.05)
Opening Cash and Cash Equivalents 1,012.98 7,014.34
51 100.46 -
- (3,230.72)
(30.87) 39.41
1,012.98
16 -
13 1,012.98
Annual Report 2017-18 | 119
2018.
'Group') and the Group's interest in associates and joint ventures.
the Act.
carrying amount of any component accounted for as a separate asset is derecognised when replaced. All other repairs and maintenance
` 5000 are fully depreciated in the year of purchase. In respect of the following

120 | Dhunseri Petrochem Limited
carrying amount of the replaced part is derecognised.
Non-Factory Building 60 years
• Franchise Fees 30 Years
assets or CGUs.
amount of any goodwill allocated to the CGU, and then to reduce the carrying amounts of the other assets of the CGU (or Company of

Annual Report 2017-18 | 121
necessary to make the sale.
Financial assets
• FVTPL
interest on the principal amount outstanding.
mismatch that would otherwise arise.
122 | Dhunseri Petrochem Limited
Financial assets at FVTPL
Equity investments at FVOCI
Financial assets
of the risks and rewards of the transferred assets, the transferred assets are not derecognised.

Annual Report 2017-18 | 123
incurred.
(`
``

124 | Dhunseri Petrochem Limited
in which they occur, directly in Other Comprehensive Income. They are included in retained earnings in the statement of changes in Equity.
in which the employee has rendered the service.
or to an item recognised directly in equity or in other comprehensive income.
Annual Report 2017-18 | 125
depreciated, and any equity-accounted investee is no longer equity accounted.
126 | Dhunseri Petrochem Limited
or loss or other comprehensive income, as appropriate.
control ceases.
The Group's interests in equity accounted investees comprise interest in associates and joint ventures.
policies. A joint venture is an arrangement in which the Group has joint control and has rights to the net assets of the arrangement, rather
Annual Report 2017-18 | 127
evidence of impairment.
incurred (Refer Note 20).
currency.
impact is not material.

128 | Dhunseri Petrochem Limited
(` in lakhs)
BuildingsFurniture
and Work-in-
Balance at 01 April 2016 2,592.49 25,227.92 71,750.73 162.93 86.10 138.59 99,958.76 4554.32
- - 63.47 2.01 - 125.00 190.48 150.29
Transfer on disposal of 49 (2,335.82) (23,937.81) (71,770.62) (148.97) (44.59) (212.34) (98,450.15) (127.15)
Disposals / Adjustments - (1.40) (20.57) - (13.18) (36.52) (71.67) (3.12)
Transfer to Investment Property
4 - (1,280.33) - - - - (1,280.33) -
Balance at 31 March 2017
256.67 8.38 23.01 15.97 28.33 14.73 347.09 4,574.34
51 - - 139.27 - - 11.25 150.52 -
- - 541.92 18.08 23.03 29.52 612.55 23.74
- - - (0.30) - - (0.30) -
held for sale as part of disposal group
16 - - (8.89) (6.52) (23.45) (38.86) (15.53)
- - 26.84 0.79 - - 27.63 -
Adjustments during the year - - (23.01) 23.50 (0.49) - - -
Balance at 31 March 2018
Balance at 01 April 2016 3.14 821.03 4,042.40 37.89 23.28 50.46 4,978.20 -
62.14 1,105.01 5,725.25 44.74 22.47 83.24 7,042.85 -
Transfer on disposal of 49 (59.00) (1,903.11) (9,764.05) (79.80) (34.03) (100.45) (11,940.44) -
Disposals / Adjustments - - - - (3.01) (23.86) (26.87) -
Transfer to Investment Property
4 - (22.59) - - - - (22.59) -
Balance at 31 March 2017 -
6.28 0.34 3.60 2.83 8.71 9.39 31.15 -
3.14 0.17 143.79 16.74 7.01 1.47 172.32 -
- - - (0.15) - - (0.15) -

Annual Report 2017-18 | 129
(` in lakhs)
BuildingsFurniture
and Work-in-
held for sale as part of disposal group
16 - - - (1.29) (0.16) (1.11) (2.56) -
- - 4.65 0.09 - - 4.74
Adjustments during the year - (3.60) 3.87 (0.27) - - -
Balance at 31 March 2018 -
250.39 8.04 19.41 13.14 19.62 5.34 315.94 4,574.34
(a) Adjustments represent regrouping of the assets during the year.`
conveyance- ` `
(` in lakhs)
Buildings
Balance at 01 April 2016 -
Transfer from Property, Plant and Equipment 3 1,280.33
1,280.33
-
Balance at 31 March 2018
Balance at 01 April 2016 -
Transfer from Property, Plant and Equipment 3 22.59
22.66
45.25
22.66
Balance at 31 March 2018
1,235.08
` (31 ` 1049.17 lakhs) and ` `

130 | Dhunseri Petrochem Limited
(` in lakhs)
31 March 2018 31 March 2017
Rental Income 139.16 81.18
- -
81.18
22.66 22.66
58.52
`2017- `
(` in lakhs)
31 March 2018 31 March 2017
3,200.00
(` in lakhs)
Franchise Fee
Balance at 01 April 2016 - - -
- - -
- - -
- - -
3.12 363.08 366.20
16 (1.34) (363.08) (364.42)
Balance at 31 March 2018 -
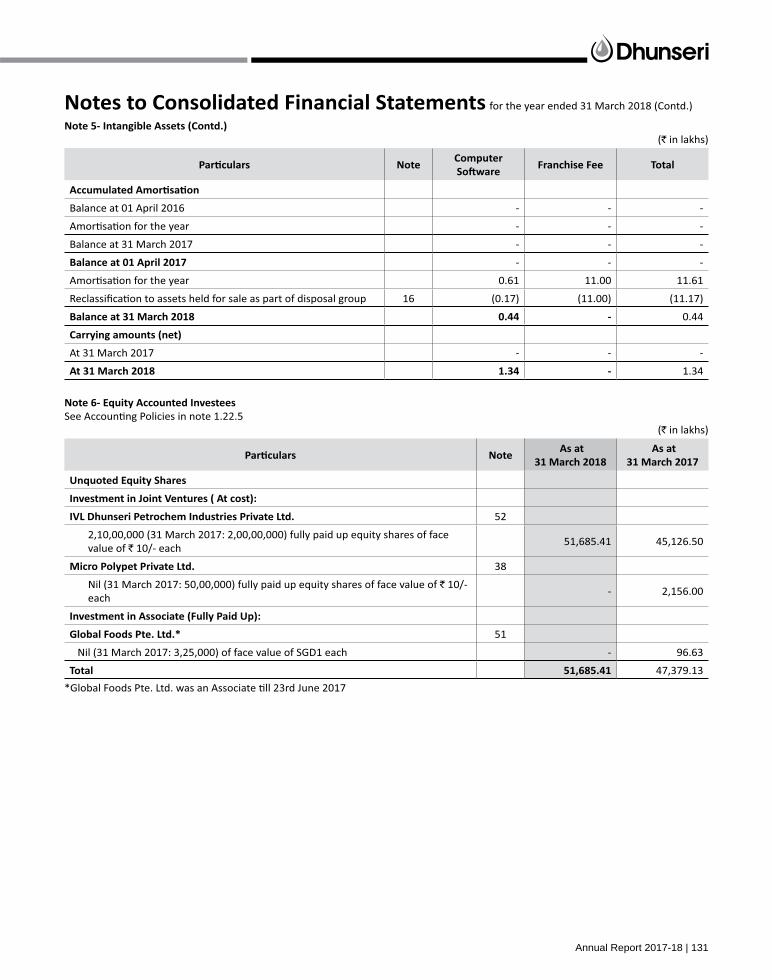
Annual Report 2017-18 | 131
(` in lakhs)
Franchise Fee
Balance at 01 April 2016 - - -
- - -
- - -
- - -
0.61 11.00 11.61
16 (0.17) (11.00) (11.17)
Balance at 31 March 2018 - 0.44
- - -
- 1.34
(` in lakhs)
31 March 2018 31 March 2017
52
value of ` 10/- each 51,685.41 45,126.50
38
` 10/- each
- 2,156.00
51
- 96.63
47,379.13

132 | Dhunseri Petrochem Limited
(` in lakhs)
31 March 2018 31 March 2017
` 10/- each 744.29 537.89
` 5/- each 41.88 -
` 10/- each 250.12 -
` 10/- each - 895.15
` 1/- each - 1,005.72
` 5/- each 595.19 -
` 1/- each - 290.70
` 2/- each - 712.21
` 10/- each - 220.52
` 10/- each 695.01 -
` 10/- each - 1,512.96
` 2/- each - 779.39
` 10/- each - 35.21
` 2/- each 329.48 140.19
` 10/- each 739.02 -
` 2/- each - 1,494.64
` 10/- each 108.19 -
` 10/- each - 1,100.52
` 10/- each 809.97 796.86

Annual Report 2017-18 | 133
(` in lakhs)
31 March 2018 31 March 2017
` 2/- each - 528.09
` 1/- each - 335.27
` 10/- each - 789.19
` 10/- each 741.80 -
` 5/- each 863.01 -
` 1/- each 1,339.65 -
` 5/- each - 517.71
` 10/- each 363.95 -
` 2/- each 1,470.20 2,232.33
` 10/- each - 118.60
` 10/- each - 154.67
` 10/- each 2,074.28 1,168.62
` 5/- each - 1,101.63
` 1/- each - 574.05
` 2/- each 256.92 -
` 10/- each - 1,380.04
` 1/- each - 229.64
` 5/- each 755.46 935.87
` 10/- each - 1,238.98

134 | Dhunseri Petrochem Limited
(` in lakhs)
31 March 2018 31 March 2017
` 10/- each 974.32 -
` 5/- each - 2,116.26
` 2/- each - 204.82
` 1/- each 502.14 577.56
` 10/- each - 1,773.95
` 2/- each 422.26 590.47
` 1/- each 289.03 642.74
` 2/- each - 837.20
` 10/- each - 1,438.34
` 1/- each 113.36 -
` 10/- each - 241.88
` 2/- each - 284.14
` 10/- each - 1,350.62
` 10/- each - 2,063.65
` 10/- each 1,091.62 -
` 10/- each - 307.16
` 10/- each - 142.49
` 1/- each - 347.09
` 10/- each - 131.41

Annual Report 2017-18 | 135
(` in lakhs)
31 March 2018 31 March 2017
` 2/- each 237.11 -
` 1/- each - 344.08
` 1/- each - 125.83
` 10/- each - 1,129.84
` 10/- each 1,034.62 1,467.90
` 2/- each - 820.83
` 2/- each - 561.90
` 1/- each 1,453.38 -
` 5/- each - 1,127.50
` 10/- each 962.86 -
` 10/- each - 646.75
` 10/- each 538.28 45.74
` 1/- each - 1,840.99
` 10/- each - 1,409.64
` 10/- each 33.18 -
` 10/- each 1,014.89 954.26
44,351.69

136 | Dhunseri Petrochem Limited
(` in lakhs)
31 March 2018 31 March 2017
each 93.61 97.11
- 740.90
`Ltd
38 - 10,403.76
` 1000/- each of IVL Dhunseri Petrochem Industries Pvt Ltd
38 10,535.63 -
11,241.77
55,593.46
20,845.47 44,351.68
Aggregate market value of quoted investments 20,845.47 44,351.68
Aggregate value of unquoted investments 62,314.65 58,620.90
Aggregate amount of impairment in value of investments 58.25 -
(` in lakhs)
31 March 2018 31 March 2017
` 10/- each 128.71 -
` 5/- each 716.13 -
` 10/- each 880.87 -
` 5/- each 198.38 -
` 10/- each 231.67 -
` 2/- each 242.46 -
` 10/- each 246.34 -
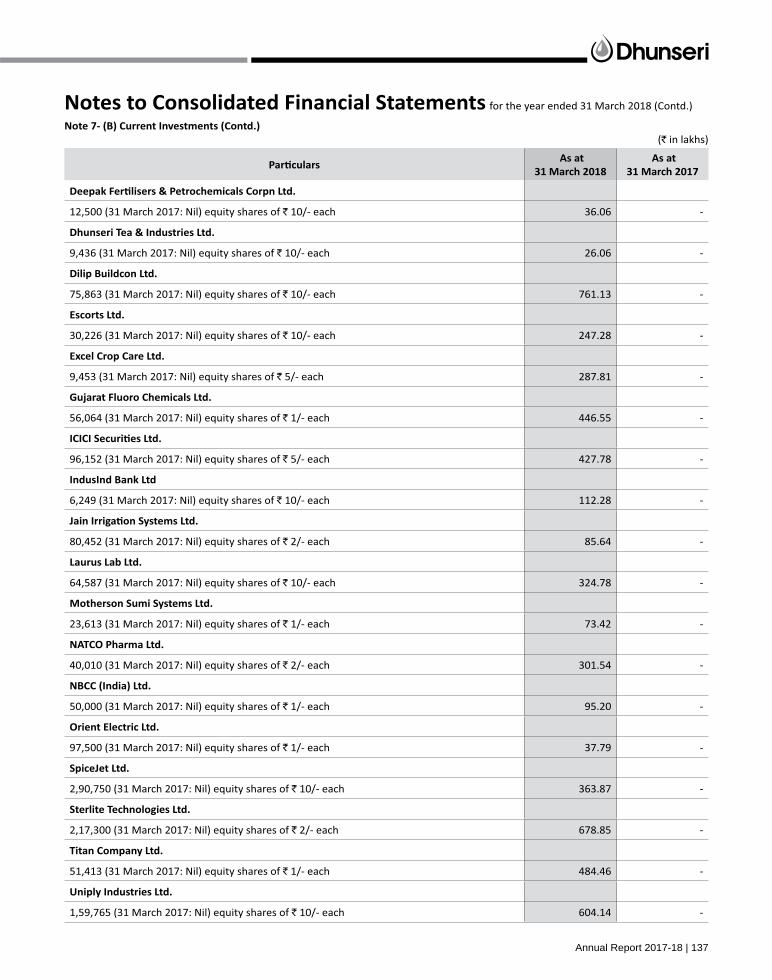
Annual Report 2017-18 | 137
(` in lakhs)
31 March 2018 31 March 2017
` 10/- each 36.06 -
` 10/- each 26.06 -
` 10/- each 761.13 -
` 10/- each 247.28 -
` 5/- each 287.81 -
` 1/- each 446.55 -
` 5/- each 427.78 -
` 10/- each 112.28 -
` 2/- each 85.64 -
` 10/- each 324.78 -
` 1/- each 73.42 -
` 2/- each 301.54 -
` 1/- each 95.20 -
` 1/- each 37.79 -
` 10/- each 363.87 -
` 2/- each 678.85 -
` 1/- each 484.46 -
` 10/- each 604.14 -

138 | Dhunseri Petrochem Limited
(` in lakhs)
31 March 2018 31 March 2017
` 10/- each 11.06 -
` 10/- each 7.01 -
-
- 0.14
` 1000/- each 199.49 -
` 1,000/- each 577.98 -
` 1000/- each 1,111.35 1,036.04
` 1,000/- each 16,494.13 4,007.40
` 1000/- each 2,375.71 -
` 1000/- each 77.33 -
` 1000/- each 210.89 -
` 1000/- each 189.39 -
200.67 -
5,043.58
16 (77.33) -
5,043.58
8,057.27 -
Aggregate market value of Quoted Investments 8,057.27 -
Aggregate value of unquoted Investments 21,436.94 5,043.58
Aggregate amount of impairment in value of investments - -
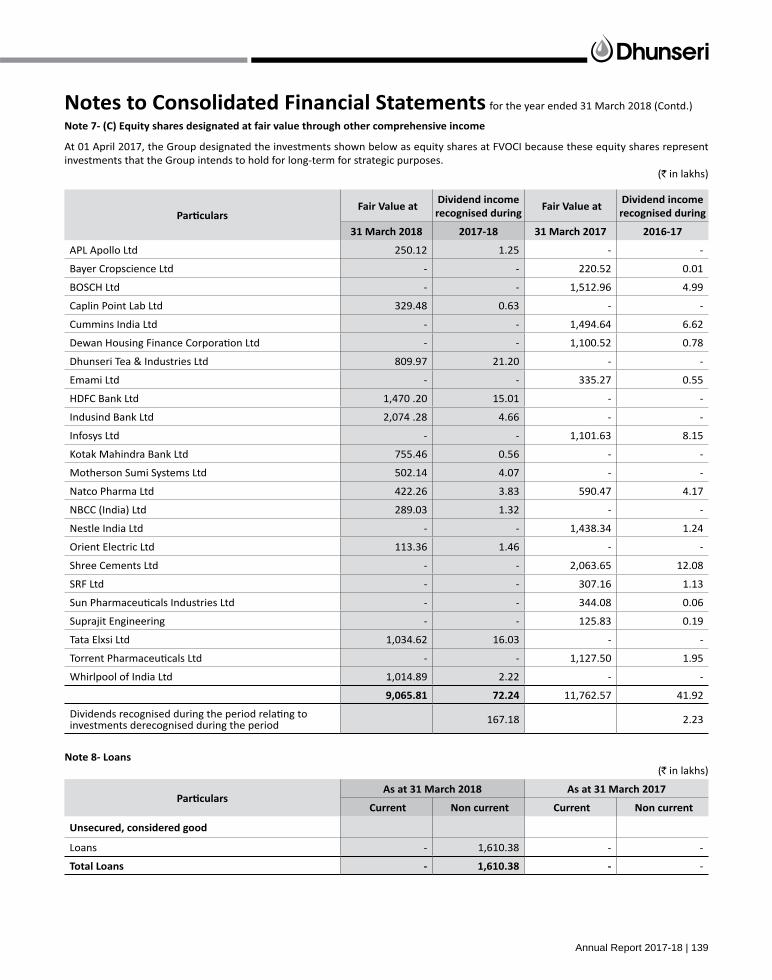
Annual Report 2017-18 | 139
investments that the Group intends to hold for long-term for strategic purposes. (` in lakhs)
Dividend income recognised during
Dividend income recognised during
31 March 2018 2017-18 31 March 2017 2016-17
APL Apollo Ltd 250.12 1.25 - -
Bayer Cropscience Ltd - - 220.52 0.01
- - 1,512.96 4.99
329.48 0.63 - -
Cummins India Ltd - - 1,494.64 6.62
- - 1,100.52 0.78
809.97 21.20 - -
Emami Ltd - - 335.27 0.55
1,470 .20 15.01 - -
Indusind Bank Ltd 2,074 .28 4.66 - -
Infosys Ltd - - 1,101.63 8.15
755.46 0.56 - -
502.14 4.07 - -
Natco Pharma Ltd 422.26 3.83 590.47 4.17
NBCC (India) Ltd 289.03 1.32 - -
Nestle India Ltd - - 1,438.34 1.24
Orient Electric Ltd 113.36 1.46 - -
Shree Cements Ltd - - 2,063.65 12.08
SRF Ltd - - 307.16 1.13
- - 344.08 0.06
Suprajit Engineering - - 125.83 0.19
1,034.62 16.03 - -
- - 1,127.50 1.95
Whirlpool of India Ltd 1,014.89 2.22 - -
11,762.57 41.92
investments derecognised during the period 167.18 2.23
(` in lakhs)
Loans - 1,610.38 - -
- - -

140 | Dhunseri Petrochem Limited
(` in lakhs)
Advance for purchase of investments - - 700.00 670.86
- - - 16.48
Interest accrued on Deposits 6.06 - - -
Interest accrued on Loan 5.26 - - -
1.67 - - -
- - 0.78 -
- - 1.98 -
47 1,798.64 - 1,178.46 -
- - 95.29 -
- 1,976.51 687.34
(` in lakhs)
5,353.06 - 49.73 -
Other Advances
Advance to suppliers/ service providers 42.43 - 4.31 -
198.18 - 2.12 -
Advances to employees 2.18 6.69 0.36 1.05
Capital Advance - 69.97 - -
Security Deposits 51.02 470.68 - 1.20
Others
Interest accrued on deposit - - 1.01 -
1,197.58 - - -
16 (92.95) (72.80) - -
57.53 2.25
(` in lakhs)
31 March 2018
31 March 2017
Stock-in-trade (i.e. Traded Goods) 7,077.21 -
25.85
-
` ` Nil Lakhs)

Annual Report 2017-18 | 141
(` in lakhs)
31 March 2018
31 March 2017
Unsecured, considered good
- -
11,968.49 -
-
(` in lakhs)
31 March 2018
31 March 2017
Balances with Banks
Current Accounts 5,084.08 968.93
845.29 35.00
Cash in hand 15.60 9.05
16 (112.92) -
1,012.98
(` in lakhs)
31 March 2018
31 March 2017
Other bank balances
82.80 86.05
86.05
(ii) Earmarked for payment of dividend.
(` in lakhs)
31 March 2018
31 March 2017
`2017 - `
2,172.16 2,009.81
2,009.81

142 | Dhunseri Petrochem Limited
for this purpose is Tastetaria Private Limited (“JV Company” or “Tastetaria”), which was formed in 2016 and was already pursuing
(` in lakhs)
31 March 2018
31 March 2017
(a) Property, Plant and Equipment 36.30 -
15.53 -
353.25 -
(d) Other Non-Current Assets 72.80 -
-
(a) Financial Assets -
(i) Investments 77.33 -
(iii) Cash and Cash Equivalents 112.92 -
92.95 -
-
(i) Borrowings 14.65 -
88.17 -
7.51 -
-
-
(i) Borrowings - -
7.43 -
4.72 -
0.12 -
4.56 -
-

Annual Report 2017-18 | 143
(` in lakhs)
31 March 2018
31 March 2017
35,122.00 35,122.00
3,502.48 3,502.48
Add : Shares Forfeited 0.81 0.81
3,503.29
(` (`
3,50,24,754 3,502.48 3,50,24,754 3,502.48
3,50,24,754 3,50,24,754 3,502.48
The Group has one class of equity share having a par value of `
31 March 2018
31 March 2017
Dhunseri Investments Limited 1,95,39,718 1,88,72,000
31 March 2018
31 March 2017
Dhunseri Investments Limited 1,95,39,718 1,88,72,000
55.79% 53.88%
Naga Dhunseri Group Limited 30,78,759 30,78,759
8.79% 8.79%
20,79,414 20,79,414
5.94% 5.94%
(` in lakhs)
31 March 2018
31 March 2017
262.07 262.07
12.48 12.48
1,661.41 1,661.41
34,091.06 33,830.83
72,397.32 68,009.65
1,03,776.44

144 | Dhunseri Petrochem Limited
(` in lakhs)
31 March 2018
31 March 2017
7,358.91 2,733.23
62.88 -
2,733.23
1,06,509.67
(` in lakhs)
31 March 2018
31 March 2017
262.07 262.07
Represents the amount transferred from the transferor company pursuant to Scheme of
12.48 12.48
1,661.41 1,661.41
33,830.83 33,830.83
260.23 -
33,830.83
(` in lakhs)
31 March 2018
31 March 2017
68,009.65 10,603.94
5,235.57 59,909.75
Add: Other Comprehensive Income (4.80) 9.97
- (826.82)
(700.50) (1,400.99)
(142.60) (286.20)
68,009.65

Annual Report 2017-18 | 145
(` in lakhs)
31 March 2018
31 March 2017
2,733.23 150.13
Add: Equity investments through Other Comprehensive income- Net gain on disposal and 4,625.68 2,583.10
2,733.23
(` in lakhs)
31 March 2018
31 March 2017
- (582.25)
62.88 (244.57)
- 826.82
-
These changes are accumulated within the FVOCI equity investments reserves within equity. The Group will transfer amount from this
(` in lakhs)
31 March 2018
31 March 2017
168.15 -
16 (14.65) -
-
` 4.43 lakhs.
Borrowings include ` ` 19.79 lakhs (Previous year `
`
holder.
(` in lakhs)
31 March 2018
31 March 2017
Creditor for capital goods 88.17
16 (88.17) -
- -

146 | Dhunseri Petrochem Limited
(` in lakhs)
31 March 2018
31 March 2017
31 16.47
31 33.20
151.52 -
16 (7.63) -
Non current 182.02
Current 11.54
(` in lakhs)
31 March 2018
31 March 2017
Opening Balance - -
69.39 -
83.94 -
(8.87) -
7.06 -
-
concerned.
(investment) risk.
` `

Annual Report 2017-18 | 147
(` in lakhs)
Funded
31 March 2018 31 March 2018 31 March 2017
- 76.43 419.65
Transferred pursuant to Scheme of Arrangement 49 - - (240.34)
- - (68.63)
- - (27.83)
Current service cost 2.56 3.98 3.93
Interest cost - 5.76 8.35
Actuarial losses recognised in other comprehensive income - - 7.38 (18.70)
76.43
(` in lakhs)
Funded
31 March 2018 31 March 2018 31 March 2017
- 74.05 173.27
Transferred pursuant to Scheme of Arrangement - - (173.27)
- - 97.79
- - (27.83)
Interest income - 5.59 4.09
Actuarial gain on plan assets recognised in other comprehensive income - - -
- 74.05
2.38
(` in lakhs)
Funded
31 March 2018 31 March 2018 31 March 2017
Current service cost 2.56 3.98 3.93
Interest cost - 5.76 8.35
Interest Income - (5.59) -
12.28
(` in lakhs)
Funded
31 March 2018 31 March 2018 31 March 2017
- 7.38 (18.70)
- - (4.09)
- (22.79)
Funded
31 March 2018 31 March 2018 31 March 2017
- 100.00%

148 | Dhunseri Petrochem Limited
Funded
31 March 2018 31 March 2018 31 March 2017
Discount rate 7.73% 7.73% 7.54%
Future salary growth 7.50% 7.50% 5.00%
(` in lakhs)
Funded
31 March 2018 31 March 2018 31 March 2017
Decrease Decrease Decrease
Discount Rate (0.50% movement) (0.17) 0.19 (1.17) 1.23 (0.93) 0.96
Future salary growth (0.50% movement) 0.19 (0.18) 1.23 (1.18) 0.98 (0.95)
(` in lakhs)
YearFunded
31 March 2018 31 March 2018 31 March 2017
a) 0 to 1 Year 0.01 48.84 44.69
0.01 0.73 0.49
c) 2 to 3 Year 0.01 0.75 0.50
d) 3 to 4 Year 0.04 0.76 0.53
e) 4 to 5 Year 0.06 2.92 0.54
f) 5 to 6 Year 0.06 36.00 0.55
g) 6 Year onwards 2.37 3.56 29.12
(` in lakhs)
31 March 2018
31 March 2017
35 11,770.58 9,659.32
35 15.19 -
9,659.32
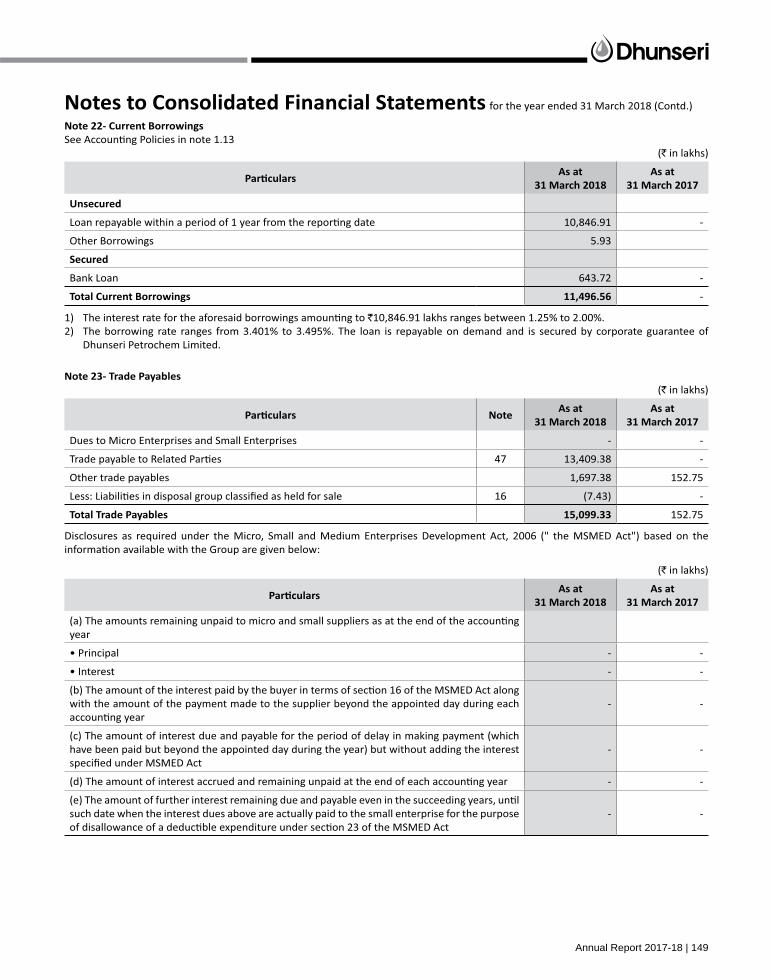
Annual Report 2017-18 | 149
(` in lakhs)
31 March 2018
31 March 2017
10,846.91 -
Other Borrowings 5.93
Bank Loan 643.72 -
-
`
Dhunseri Petrochem Limited.
(` in lakhs)
31 March 2018
31 March 2017
- -
47 13,409.38 -
1,697.38 152.75
16 (7.43) -
152.75
(` in lakhs)
31 March 2018
31 March 2017
year
• Principal - -
• Interest - -
- -
- -
- -
- -

150 | Dhunseri Petrochem Limited
(` in lakhs)
31 March 2018
31 March 2017
Unpaid Dividends 82.80 86.05
4.43 -
2.10 0.36
16 (4.72) -
86.41
(` in lakhs)
31 March 2018
31 March 2017
62.02 35.95
112.65 2.47
16 (4.56) -
38.42
(` in lakhs)
31 March 2018
31 March 2017
2.27 -
-
(` in lakhs)
31 March 2018
31 March 2017
2,326.49 1,22,217.39
Traded Goods 86,154.99 96.00
Scrap Sale - 27.00
2,756.51 1,909.96
1,478.13 -
Service Fee - 374.00
Dividend income from Investments 1,374.73 44.16
- 922.47
1,680.42 999.97
Gain on Sale of Investments measured at FVTPL 1,208.55 253.66
49 - 1,24,624.35
2,220.26
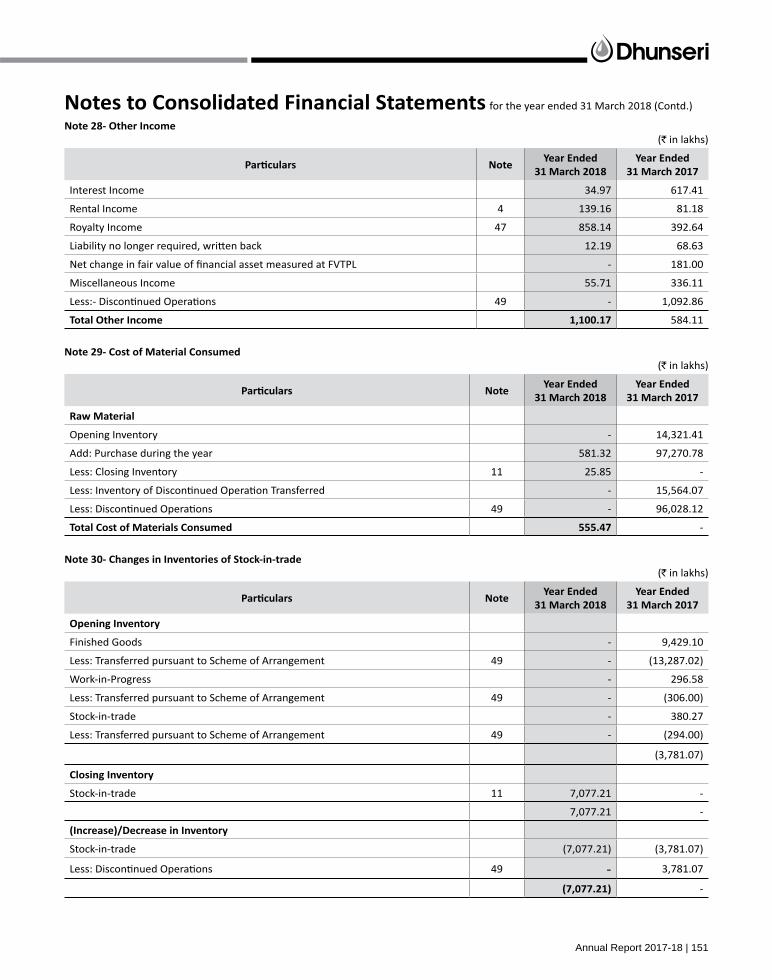
Annual Report 2017-18 | 151
(` in lakhs)
31 March 2018
31 March 2017
Interest Income 34.97 617.41
Rental Income 4 139.16 81.18
Royalty Income 47 858.14 392.64
12.19 68.63
- 181.00
55.71 336.11
49 - 1,092.86
584.11
(` in lakhs)
31 March 2018
31 March 2017
Raw Material
Opening Inventory - 14,321.41
Add: Purchase during the year 581.32 97,270.78
Less: Closing Inventory 11 25.85 -
- 15,564.07
49 - 96,028.12
-
(` in lakhs)
31 March 2018
31 March 2017
Finished Goods - 9,429.10
Less: Transferred pursuant to Scheme of Arrangement 49 - (13,287.02)
Work-in-Progress - 296.58
Less: Transferred pursuant to Scheme of Arrangement 49 - (306.00)
Stock-in-trade - 380.27
Less: Transferred pursuant to Scheme of Arrangement 49 - (294.00)
(3,781.07)
Stock-in-trade 11 7,077.21 -
7,077.21 -
Stock-in-trade (7,077.21) (3,781.07)
49 - 3,781.07
-
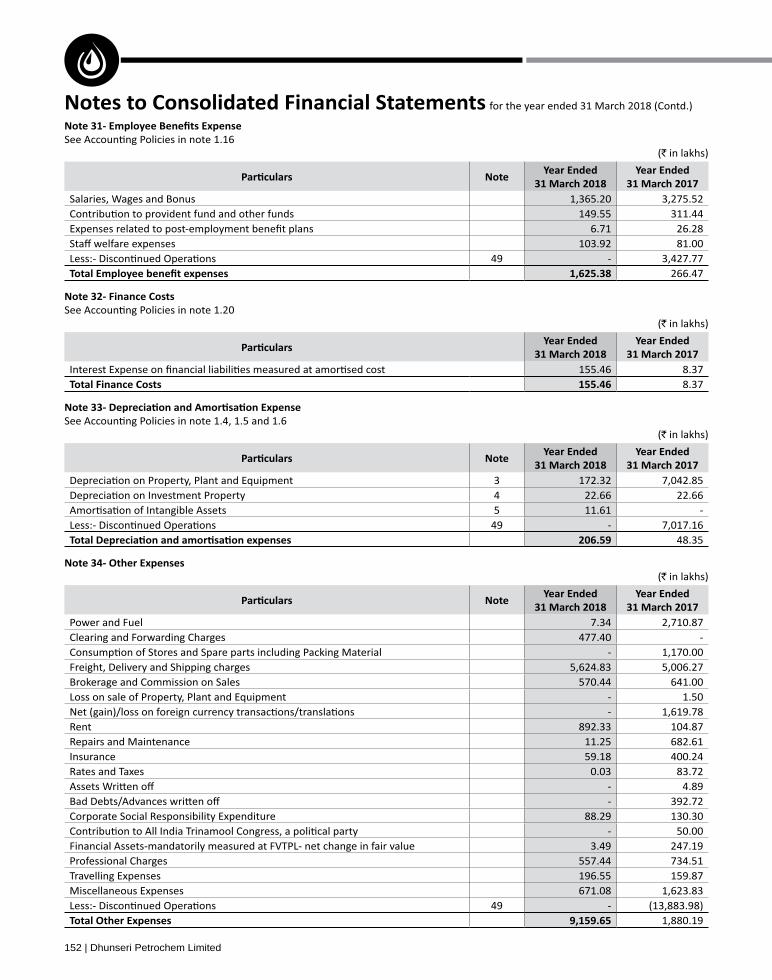
152 | Dhunseri Petrochem Limited
(` in lakhs)
31 March 2018
31 March 2017
Salaries, Wages and Bonus 1,365.20 3,275.52 149.55 311.44
6.71 26.28 103.92 81.00
49 - 3,427.77 266.47
(` in lakhs)
31 March 2018
31 March 2017
155.46 8.37 8.37
(` in lakhs)
31 March 2018
31 March 2017
3 172.32 7,042.85 4 22.66 22.66 5 11.61 -
49 - 7,017.16 48.35
(` in lakhs)
31 March 2018
31 March 2017
Power and Fuel 7.34 2,710.87 Clearing and Forwarding Charges 477.40 -
- 1,170.00 Freight, Delivery and Shipping charges 5,624.83 5,006.27 Brokerage and Commission on Sales 570.44 641.00 Loss on sale of Property, Plant and Equipment - 1.50
- 1,619.78 Rent 892.33 104.87
11.25 682.61Insurance 59.18 400.24
0.03 83.72 - 4.89 - 392.72
88.29 130.30 - 50.00
Financial Assets-mandatorily measured at FVTPL- net change in fair value 3.49 247.19 Professional Charges 557.44 734.51
196.55 159.87 671.08 1,623.83
49 - (13,883.98) 1,880.19

Annual Report 2017-18 | 153
(` in lakhs)
31 March 2018
31 March 2017
Current period 539.19 2,782.65
2,066.95 (6,387.64)
(6,387.64)
(3,604.99)
(` in lakhs)
Year ended 31 March 2018
(7.38) 2.58 (4.80)
62.88 - 62.88
5,622.92 (997.24) 4,625.68
(` in lakhs)
Year ended 31 March 2017
22.47 3.50 18.97
(244.57) - (244.57)
Share of OCI from Associate and Joint Venture accounted using equity method
(5.00) - (5.00)
(4.00) - (4.00)
2,583.10 - 2,583.10
(` in lakhs)
Year ended 31 March 2018

154 | Dhunseri Petrochem Limited
(` in lakhs)
Year ended 31 March 2018
7,757.39
34.61% 2,684.68
-6.13% (475.91)
0.72% 55.54
-5.80% (449.82)
3.24% 251.26
3.08% 239.04
Others 3.88% 301.35
(` in lakhs)
Year ended 31 March 2017
51,528.33
34.61% 17,832.92
-0.90% (465.59)
-2.91% (1,501.59)
10.69% 5,506.06
0.35% 181.02
-26.22% (13,508.66)
-10.89% (5,611.32)
0.58% 296.93
-11.95% (6,159.21)
Others -0.34% (175.55)
(` in lakhs)
Balance as at
2017
Recognised
during 2017-18
Recognised
loss during 2017-18
Recognised
2017-18
Balance as at
31 March 2018
plant and equipment (450.13) - (0.59) - (450.72)
(8.10) - (256.25) 114.02 (150.33)
in joint venture (9,209.94) (139.77) (1,816.45) - (11,166.16)
8.85 - 6.34 2.58 17.77
(9,659.32) (139.77) (2,066.95) 116.60 (11,749.44)
(5.95)

Annual Report 2017-18 | 155
(` in lakhs)
Balance as at
2016
Recognised
loss during 2016-17
Recognised
2016-17
Balance as at
31 March 2017
equipment (16,314.35) 15,864.22 - (450.13)
(228.24) (8,980.56) - (9,208.80)
Instrument (2.11) 2.11 - -
(140.67) 140.67 - -
8.10 (8.10) - -
(7.70) 7.70 - -
- (9.24) - (9.24)
174.02 (161.67) (3.50) 8.85
(16,510.95) 6,855.13 (3.50) (9,659.32)
`
`
(` in lakhs)
31 March 2018
31 March 2017
5,235.57 10,330.34
- 49,579.41
5,235.57 59,909.75
3,50,24,754 3,50,24,754
(iii) Face value of each Equity Shares (`) 10.00 10.00
- -
`) 14.95 29.49
`) - 141.55
`) 14.95 171.04

156 | Dhunseri Petrochem Limited
`
Polymers Private Limited (the “Transferor Companies”) with IVL Dhunseri Petrochem Industries Private Limited (formerly
Transferee Company.
The Company held 50,00,000 equity shares of Face value of `of `10,00,000 equity shares of Face value of ` ` 1,000 each in IVL Dhunseri Petrochem Industries Private Limited.

Annual Report 2017-18 | 157
` in
lakh
s)
Fair
valu
e
othe
rs
Oth
er
asse
ts -
in
stru
men
ts
Oth
er
amou
nt
7A 1
0,53
5.63
-
- -
10,
535.
63
- -
10,
535.
63
10,
535.
63
Inve
stm
ent i
n Q
uote
d Eq
uity
Inst
rum
ents
7B 8
,057
.27
- 2
0,84
5.47
-
28,
902.
74
28,
902.
74
- -
28,
902.
74
Inve
stm
ent i
n un
quot
ed E
quity
Inst
rum
ents
7A -
- 9
3.61
-
93.
61
- -
93.
61
93.
61
7B 2
1,43
6.94
-
- -
21,
436.
94
- 2
1,43
6.94
-
21,
436.
94
- -
12 -
11,
968.
49
- -
11,
968.
49
Cash
and
Cas
h Eq
uiva
lent
s (a
)13
- 5
,832
.05
- -
5,8
32.0
5
14 -
82.
80
- -
82.
80
Loan
s8
- 1
,610
.38
- -
1,6
10.3
8
Oth
ers
9 -
1,8
11.6
3 -
- 1
,811
.63
- -
-
valu
e
Borr
owin
gs22
- -
- 1
1,65
0.06
1
1,65
0.06
23 -
- -
15,
099.
33
15,
099.
33
Oth
ers
24 -
- -
84.
61
84.
61
- -
-

158 | Dhunseri Petrochem Limited
` in
lakh
s)
Fair
valu
e
othe
rs
Oth
er
asse
ts -
in
stru
men
ts
Oth
er
amou
nt
7A 1
0,40
3.76
-
- -
10,
403.
76
- -
10,
403.
76
10,
403.
76
Inve
stm
ent i
n Q
uote
d Eq
uity
Inst
rum
ents
7A -
- 4
4,35
1.69
-
44,
351.
69
44,
351.
69
- -
44,
351.
69
Inve
stm
ent i
n un
quot
ed E
quity
Inst
rum
ents
7A -
- 9
7.11
-
97.
11
- -
97.
11
97.
11
7B 5
,043
.58
- -
- 5
,043
.58
- 5
,043
.58
- 5
,043
.58
- -
7A -
740
.90
- -
740
.90
Cash
and
Cas
h Eq
uiva
lent
s (a
)13
- 1
,012
.98
- -
1,0
12.9
8
14 -
86.
05
- -
86.
05
9 -
2,6
63.8
5 -
- 2
,663
.85
- -
-
valu
e
23 -
- -
152
.75
152
.75
24 -
- -
86.
41
86.
41
- -
-

Annual Report 2017-18 | 159
( `
in la
khs)
Debe
ntur
esDe
bent
ures
Valu
e as
at c
omm
ence
men
t of t
he y
ear
10,
403.
76
97.
11
- -
- -
10,
650.
95
97.1
1
131
.87
(3.5
0) (2
47.1
9) -
10,
403.
76
97.
11
mea
sure
men
t
Dis
coun
ted
Cash
Flo
ws:
scen
ario
• F
orec
ast a
nnua
l rev
enue
gro
wth
rate
(31
2018
: 11.
5%)
incr
ease
(dec
reas
e) if
:
• th
e an
nual
reve
nue
grow
th w
ere
• th
e ris
k ad
just
ed d
isco
unt r
ate
wer
e lo
wer
(hig
her)

160 | Dhunseri Petrochem Limited
(` in lakhs)
31 March 2018
31 March 2017
(a) Bank Guarantee * 675.91 -
418.00 -
- -
` Nil lakhs, Guarantee given during the year ` ` Nil lakhs), Total Guarantee given outstanding as at the end of the year amounts to ` ` Nil lakhs)
(` in lakhs)
31 March 2018
31 March 2017
- -
`company to IVLDPIL w.e.f 01 April 2016
2,753.12
68.00
the terms of the agreement.
(` in lakhs)
31 March 2018
31 March 2017
Not later than 1 year 992.74 -
Later than 1 year and not later than 5 years 688.57 -
Later than 5 years - -
(` in lakhs)
31 March 2018
31 March 2017
Lease rent 892.33 104.87
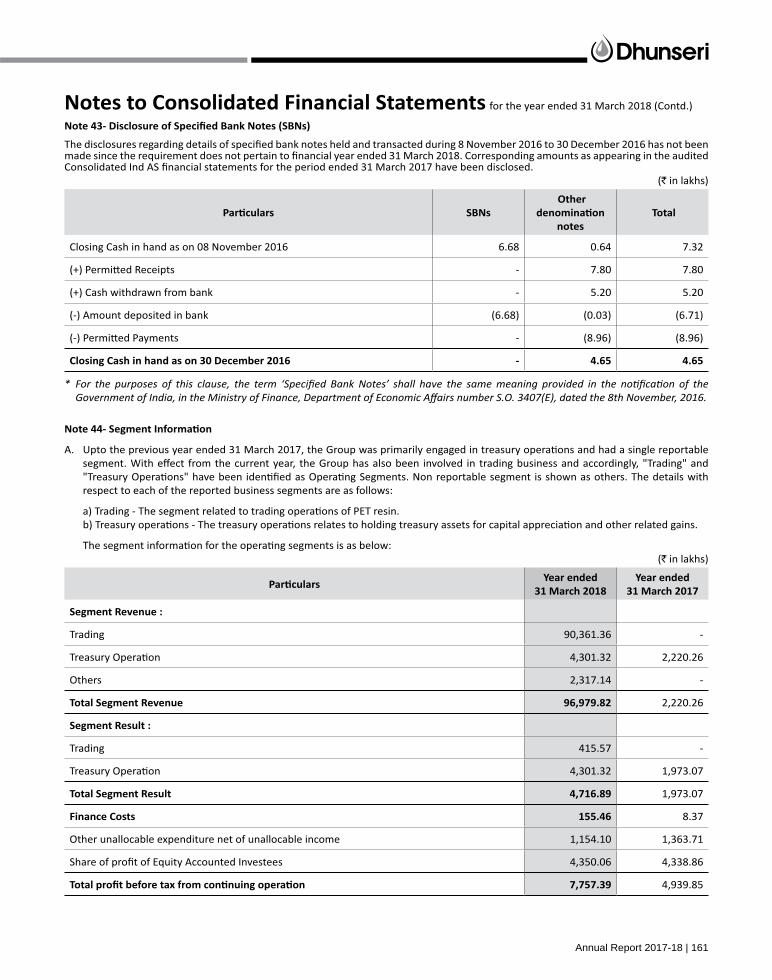
Annual Report 2017-18 | 161
(` in lakhs)
Other
notes
6.68 0.64 7.32
- 7.80 7.80
- 5.20 5.20
(6.68) (0.03) (6.71)
- (8.96) (8.96)
-
(` in lakhs)
Year ended 31 March 2018
Year ended 31 March 2017
Trading 90,361.36 -
4,301.32 2,220.26
Others 2,317.14 -
2,220.26
Trading 415.57 -
4,301.32 1,973.07
1,973.07
8.37
1,154.10 1,363.71
4,350.06 4,338.86
4,939.85

162 | Dhunseri Petrochem Limited
(Contd.)
(` in lakhs)
Year ended 31 March 2018
Year ended 31 March 2017
Trading 25,905.54 -
50,339.68 50,861.42
82,365.66 69,112.58
1,19,974.00
Trading 25,620.68 -
- -
13,461.81 9,961.02
9,961.02
(` in lakhs)
31 March 2018 31 March 2017
Revenue from sale of products and services
• Italy 49,332.93 -
• Other countries 36,822.06 -
-
• India 6,127.54 6,127.61
• Singapore 1,813.19 -
6,127.61

Annual Report 2017-18 | 163
Revenue from 2 customers of the Group is ` ` Nil lakhs) which is more than 10% of the total revenue of the Group.
7(B), 8, 9, 12, 13, 14.
`` 1,012.98 lakhs.
agreements:(` in lakhs)
More than More than
Non Current Borrowings - 153.50 - -
Current Borrowings 11,496.56 - - -
15,099.33 - 152.75 -
84.61 - 86.05 -
238.80 -

164 | Dhunseri Petrochem Limited
(` in lakhs)
31 March 2018 31 March 2017 31 March 2018 31 March 2017
402.86 - 1,042.27 2,217.58
(402.86) - (1,042.27) (2,217.58)
Mutual Funds
1,071.85 252.18 - -
(1,071.85) (252.18) - -
fair value through other comprehensive income.
denominated are USD and EURO.
(Foreign Currency in lakhs)
31 March 2018 31 March 2017
135.95 14.73 -
- - 16.00
- 7.50 -
(52.94) (11.89) -
Packing Credit (Borrowings) (72.01) - -
(2.37) - -

Annual Report 2017-18 | 165
`
(` in lakhs)
Weakening Weakening
31 March 2018
USD (5% movement) 33.65 (33.65) 21.87 (21.87)
EURO (5% movement) 34.81 (34.81) 22.63 (22.63)
(` in lakhs)
Weakening Weakening
31 March 2017
SGD 38.47 (38.47) 25.01 (25.01)
our shareholders.
the Group may adjust the amount of dividends paid to shareholders, return capital to shareholders or issue new shares.
maintain, or if necessary adjust, its capital structure.
(` in lakhs)
31 March 2018 31 March 2017
(i) Dividend on Equity Shares paid during the year
` ` 4.00) per fully paid share of `10 each
700.50 1,400.99
142.60 286.20
` 3.50 per fully paid equity share of face value of ` 1,225.87 700.50
249.56 142.60
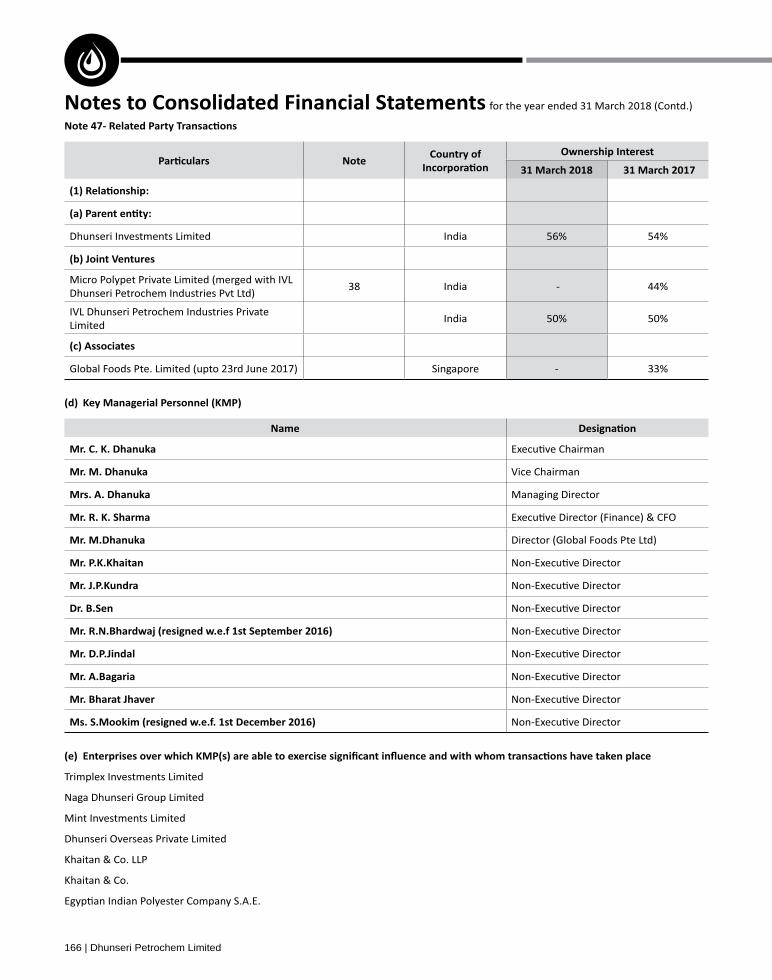
166 | Dhunseri Petrochem Limited
31 March 2018 31 March 2017
Dhunseri Investments Limited India 56% 54%
Dhunseri Petrochem Industries Pvt Ltd)38 India - 44%
IVL Dhunseri Petrochem Industries Private Limited
India 50% 50%
Singapore - 33%
Vice Chairman
Naga Dhunseri Group Limited
Dhunseri Overseas Private Limited

Annual Report 2017-18 | 167
(` in lakhs)
31 March 2018 31 March 2017
Dividend Paid 380.38 686.60
1.16 -
Investment in Shares - 1,812.00
- 10,650.95
Rental Income and other service charges 157.14 146.38
Dividend Received 400.00 800.00
Royalty Income 858.14 392.64
Purchase of PET Resin (90,047.32) -
Investment in Shares - 0.01
(367.17) -
(12,097.21) 1,178.46
Investment in Shares 173.24 157.27
- 769.44
- -
Rent and Service Charges 43.76 53.41
Refund of Security Deposit - (66.00)
Dividend Paid 5.76 11.53
Rent and Service Charges - 6.50
Dividend Paid 41.59 81.42
Dividend Paid 61.58 123.15
Advance given * 486.47
486.47 -
- 1,262.42
- -
Legal and Professional Fees 2.39 2.28
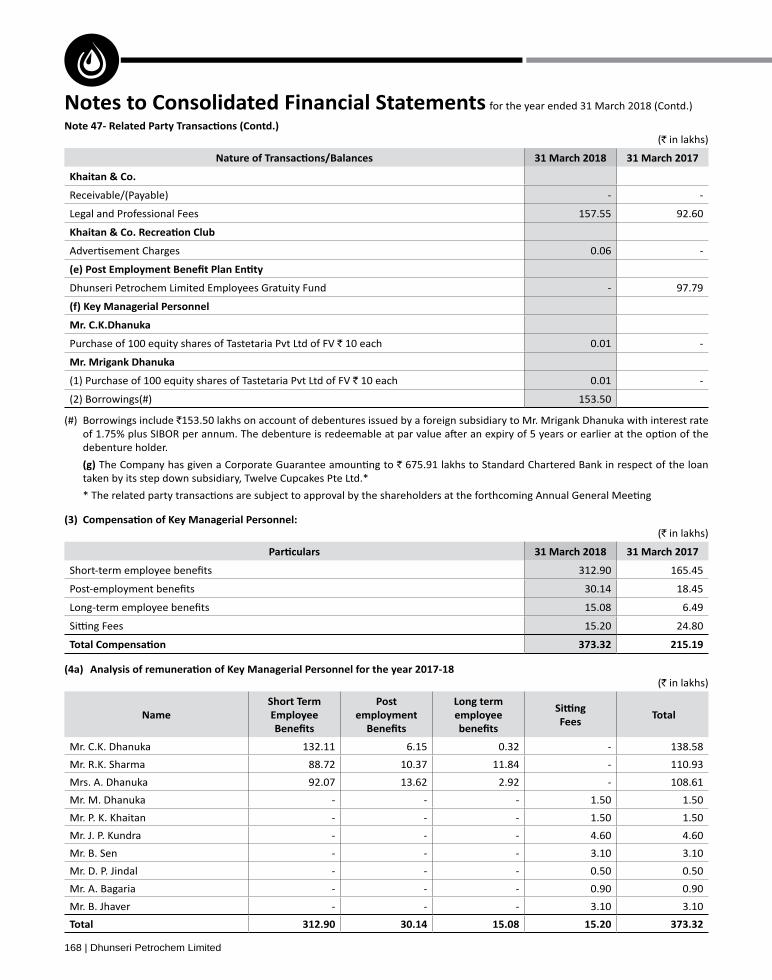
168 | Dhunseri Petrochem Limited
(` in lakhs)
31 March 2018 31 March 2017
- -
Legal and Professional Fees 157.55 92.60
0.06 -
Dhunseri Petrochem Limited Employees Gratuity Fund - 97.79
Purchase of 100 equity shares of Tastetaria Pvt Ltd of FV ` 10 each 0.01 -
(1) Purchase of 100 equity shares of Tastetaria Pvt Ltd of FV ` 10 each 0.01 -
(2) Borrowings(#) 153.50
(#) Borrowings include `
` 675.91 lakhs to Standard Chartered Bank in respect of the loan
(` in lakhs)
31 March 2018 31 March 2017
312.90 165.45
30.14 18.45
15.08 6.49
15.20 24.80
(` in lakhs)
Fees
132.11 6.15 0.32 - 138.58
88.72 10.37 11.84 - 110.93
92.07 13.62 2.92 - 108.61
- - - 1.50 1.50
- - - 1.50 1.50
- - - 4.60 4.60
- - - 3.10 3.10
- - - 0.50 0.50
- - - 0.90 0.90
- - - 3.10 3.10

Annual Report 2017-18 | 169
(` in lakhs)
Fees
54.79 5.27 3.26 - 63.32
92.47 9.07 3.23 - 104.77
12.31 2.52 - 3.00 17.83
5.88 1.59 - 1.00 8.47
- - - 3.30 3.30
- - - 6.40 6.40
- - - 4.70 4.70
- - - 1.00 1.00
- - - 0.80 0.80
- - - 1.50 1.50
- - - 1.70 1.70
- - - 1.40 1.40
(` in lakhs)
31 March 2018 31 March 2017
(55.00) (35.00)
(10.00) (10.00)
(50.00) -
of 65% shares of EIPET from Dhunseri Overseas Private Limited.
the Group has fair valued its remaining interest in IVLDPIL and recognised a resultant gain of `
`
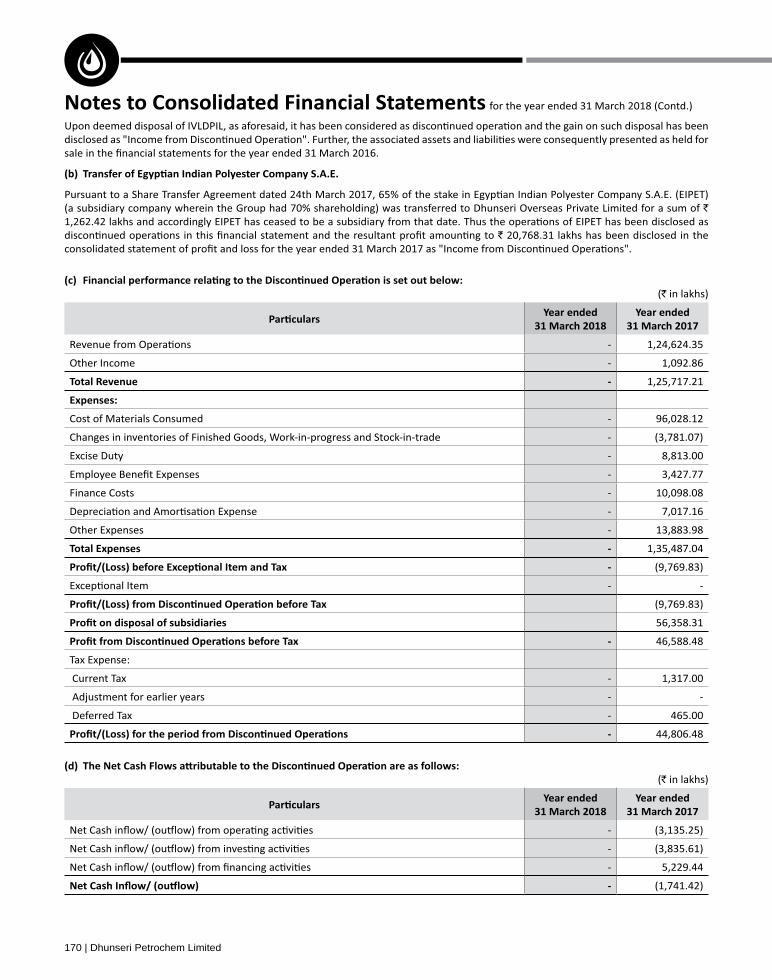
170 | Dhunseri Petrochem Limited
`
`
(` in lakhs)
Year ended 31 March 2018
Year ended 31 March 2017
- 1,24,624.35
Other Income - 1,092.86
- 1,25,717.21
- 96,028.12
Changes in inventories of Finished Goods, Work-in-progress and Stock-in-trade - (3,781.07)
- 8,813.00
- 3,427.77
Finance Costs - 10,098.08
- 7,017.16
- 13,883.98
- 1,35,487.04
- (9,769.83)
- -
(9,769.83)
56,358.31
- 46,588.48
- 1,317.00
Adjustment for earlier years - -
- 465.00
- 44,806.48
(` in lakhs)
Year ended 31 March 2018
Year ended 31 March 2017
- (3,135.25)
- (3,835.61)
- 5,229.44
- (1,741.42)

Annual Report 2017-18 | 171
(` in lakhs)
Opening balance as
2017
changesbalance as
at 31 March 2018
- 69.62 11,394.27 205.25 11,669.14
-
` 2,326.49 Lakhs and consolidated loss of `
` 97,719.45 lakhs and `
(` in lakhs)
Cash 94.50
740.90
(` in lakhs)
Property, plant and equipment 150.52
Cash and cash equivalents 100.46
343.80
172.76
(164.75)
Provisions (69.39)
(5.11)
(3.24)
(18.01)
Borrowings (69.62)
Goodwill 624.82
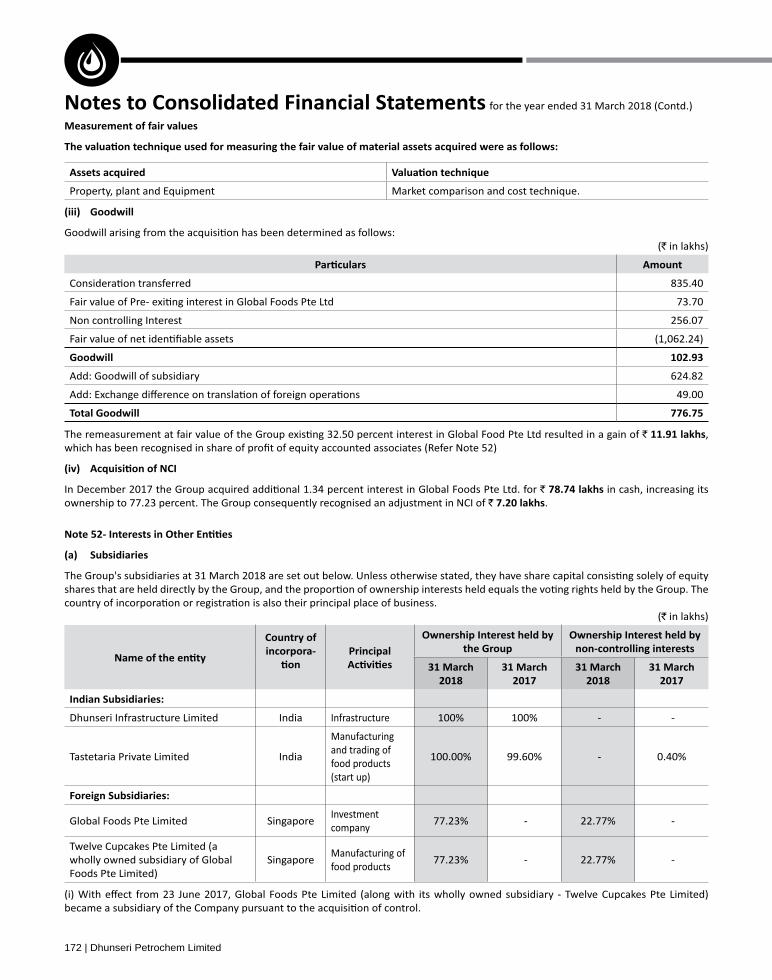
172 | Dhunseri Petrochem Limited
Property, plant and Equipment
(` in lakhs)
835.40
73.70
Non controlling Interest 256.07
(1,062.24)
624.82
49.00
` ,
` in cash, increasing its ownership to 77.23 percent. The Group consequently recognised an adjustment in NCI of ` .
(` in lakhs)
incorpora- non-controlling interests
31 March 2018
31 March 2017
31 March 2018
31 March 2017
Dhunseri Infrastructure Limited India Infrastructure 100% 100% - -
Tastetaria Private Limited Indiaand trading of food products (start up)
100.00% 99.60% - 0.40%
SingaporeInvestment company
77.23% - 22.77% -
Twelve Cupcakes Pte Limited (a
Foods Pte Limited)Singapore
food products 77.23% - 22.77% -
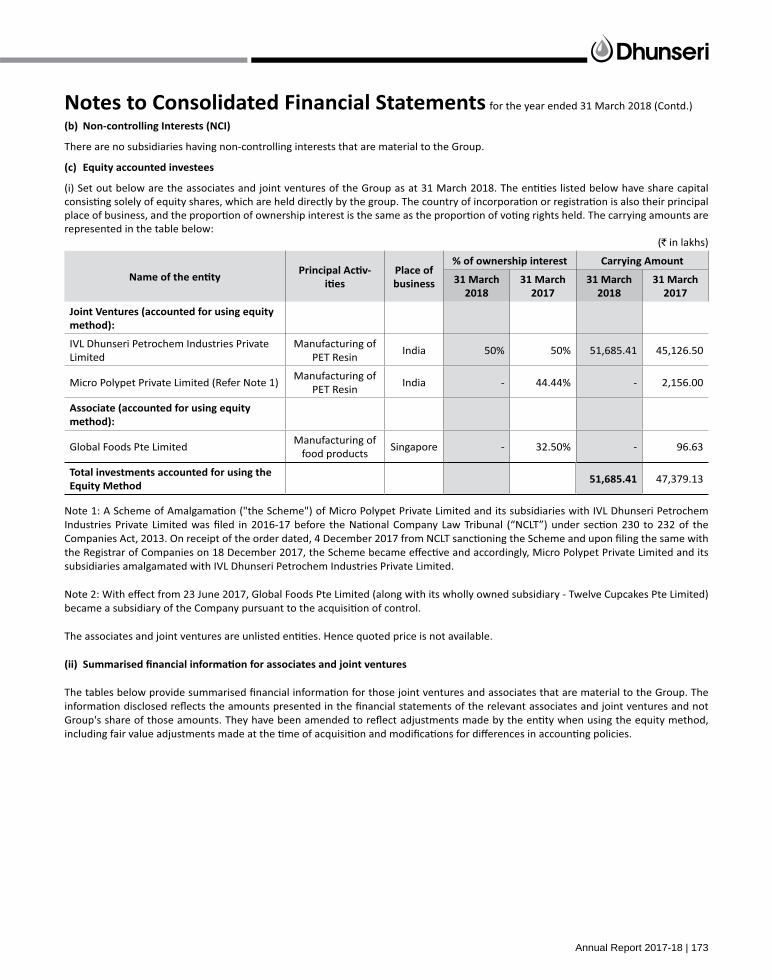
Annual Report 2017-18 | 173
(` in lakhs)
-business 31 March
201831 March
201731 March
201831 March
2017
IVL Dhunseri Petrochem Industries Private Limited PET Resin
India 50% 50% 51,685.41 45,126.50
PET ResinIndia - 44.44% - 2,156.00
food productsSingapore - 32.50% - 96.63
47,379.13
N
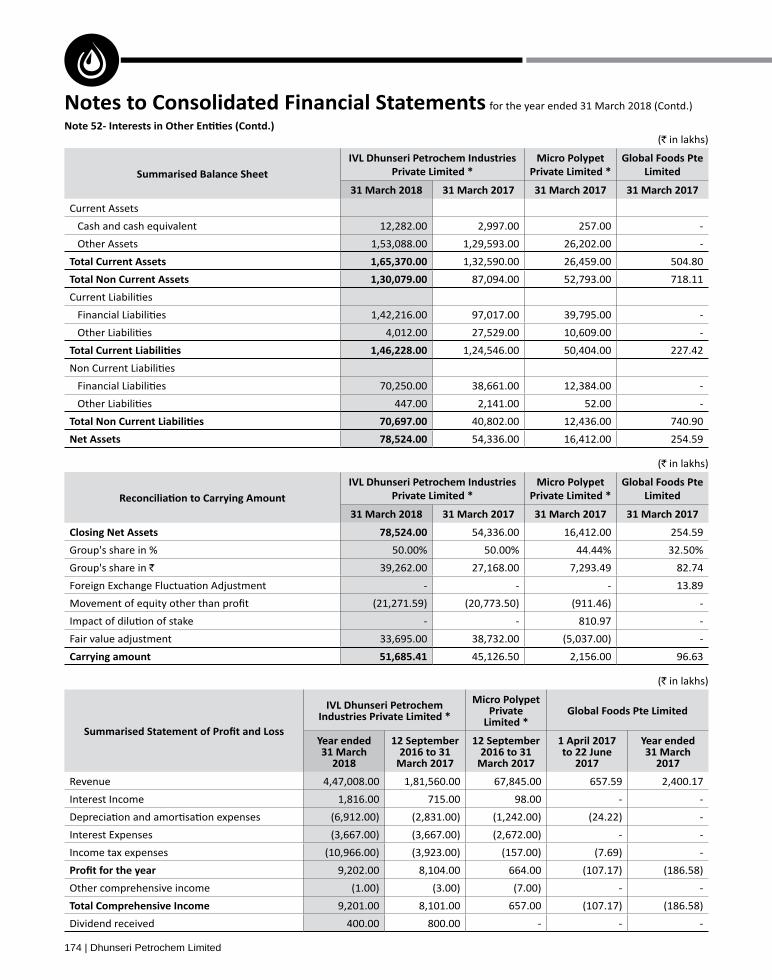
174 | Dhunseri Petrochem Limited
(` in lakhs)
31 March 2018 31 March 2017 31 March 2017 31 March 2017
Current Assets
Cash and cash equivalent 12,282.00 2,997.00 257.00 -
Other Assets 1,53,088.00 1,29,593.00 26,202.00 -
1,32,590.00 26,459.00 504.80
87,094.00 52,793.00 718.11
1,42,216.00 97,017.00 39,795.00 -
4,012.00 27,529.00 10,609.00 -
1,24,546.00 50,404.00 227.42
70,250.00 38,661.00 12,384.00 -
447.00 2,141.00 52.00 -
40,802.00 12,436.00 740.90
54,336.00 16,412.00 254.59
(` in lakhs)
31 March 2018 31 March 2017 31 March 2017 31 March 2017
54,336.00 16,412.00 254.59
Group's share in % 50.00% 50.00% 44.44% 32.50%
Group's share in ` 39,262.00 27,168.00 7,293.49 82.74
- - - 13.89
(21,271.59) (20,773.50) (911.46) -
- - 810.97 -
Fair value adjustment 33,695.00 38,732.00 (5,037.00) -
45,126.50 2,156.00 96.63
(` in lakhs)
Year ended 31 March
20182016 to 31
March 20172016 to 31
March 2017 2017
Year ended 31 March
2017
Revenue 4,47,008.00 1,81,560.00 67,845.00 657.59 2,400.17
Interest Income 1,816.00 715.00 98.00 - -
(6,912.00) (2,831.00) (1,242.00) (24.22) -
(3,667.00) (3,667.00) (2,672.00) - -
(10,966.00) (3,923.00) (157.00) (7.69) -
9,202.00 8,104.00 664.00 (107.17) (186.58)
Other comprehensive income (1.00) (3.00) (7.00) - -
9,201.00 8,101.00 657.00 (107.17) (186.58)
Dividend received 400.00 800.00 - - -

Annual Report 2017-18 | 175
(` in lakhs)
Year ended 31 March 2018
Year ended 31 March 2017
Associate (52.85) (60.64)
Joint Ventures 4,402.91 4,399.50
4,338.86
* Refer note 1 of Note 52c(i)
(` in lakhs)
2017-18
comprehensive income comprehensive income
-solidated net assets
(`
-solidated
(`
consolidated other com-prehensive
income
(`
-solidated total com-prehensive
income
(`
Dhunseri Petrochem Limited 51.37% 61,387.82 29.36% 1,511.62 100.00% 4,683.76 62.98% 6,195.38
Dhunseri Infrastructure Ltd. 4.06% 4,856.08 -0.22% (11.31) - - -0.11% (11.31)
Tastetaria Private Limited 0.53% 633.93 -7.15% (368.11) - - -3.74% (368.11)
Foreign
June 2017) 0.56% 673.37 -0.39% (19.89) - - -0.20% (19.89)
Twelve Cupcakes Pte Limited (from 23 June 2017) 0.09% 112.81 -7.68% (395.44) - - -4.02% (395.44)
subsidiaries 0.15% 178.97 1.64% 84.32 - - 0.86% 84.32
IVL Dhunseri Petrochem Industries Private Limited 43.24% 51,685.41 85.47% 4,402.91 - - 44.77% 4,402.91
2017) - - -1.03% (52.85) - - -0.54% (52.85)

176 | Dhunseri Petrochem Limited
( ` a
nd S
GD
in L
akhs
)
Rate
Rese
rves
-
-m
ents
-Di
vide
nd-
hold
ing
1IN
FRAS
TRU
CTU
RE LT
D
31
2018
` -
995
.00
3,86
1.08
4,
857.
89
1.8
1 -
2.0
4 (1
1.31
) -
(11.
31)
- 10
0IN
DIA
2TA
STET
ARIA
PVT
LTD
31
2018
` -
1,00
0.00
(3
68.4
6) 7
61.0
8 1
29.5
5 7
7.33
9
.36
(368
.11)
-
(368
.11)
- 10
0IN
DIA
3G
LOBA
L FO
ODS
PTE
LT
D.
31
2018
SGD
49.
517
29.
65
(1.8
6) 2
7.86
0
.07
26.
65
0.0
3 (1
.86)
- (1
.86)
- 77
.23
SING
APO
RE
` -
1,46
8.17
(9
2.25
)1,
379.
34
3.4
2 1,
319.
62
1.6
7 (9
2.25
) -
(92.
25)
-
4PT
E LT
D.
31
2018
SGD
49.
517
15.
15
(13.
87)
27.
62
26.
34
- 6
2.67
(9
.86)
- (9
.86)
- No
te 3
SING
APO
RE
` -
750
.18
(686
.89)
1,36
7.65
1,
304.
36
- 3,
103.
35
(488
.28)
- (4
88.2
8) -

Annual Report 2017-18 | 177
(` and SGD in Lakhs)
1. Latest audited Balance Sheet Date 31.03.2018
2.
2,10,00,000
Amount of Investment in Associates/Joint Venture (` In lakhs) ` 3,812.00 Lakhs
50.00%
Joint Venture
4. Reason why the associate/joint venture is not consolidated Consolidated
5. ` 78,524.00 Lakhs
` 4,600.50 Lakhs
` 4,600.50 Lakhs
(DIN - 00005684) (DIN - 00005677) (DIN - 00004228)

Dhunseri Petrochem LimitedCIN L15492WB1916PLC002697
ORDINARY BUSINESS
SPECIAL BUSINESS


`

A.
`
B.
`
C.
`

D.
`
Dhunseri Petrochem Limited
Dhunseri House
Company Secretary

NOTES:

`

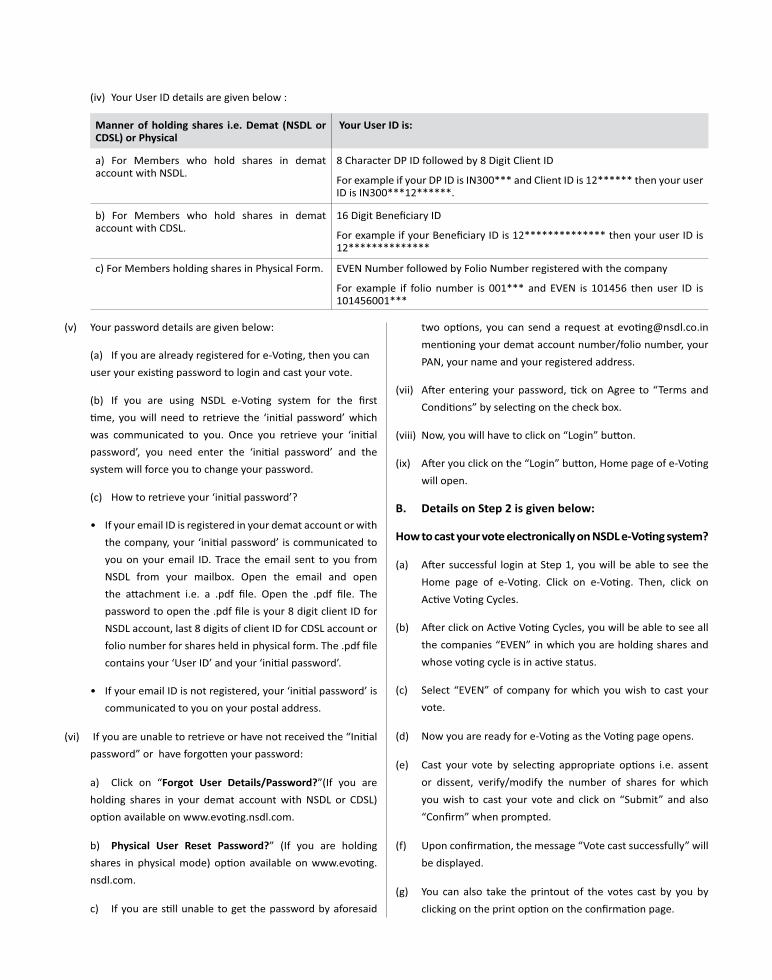
Your User ID is:


Item No. 4 –
`
`
`
`
`
`
`
`
`
ANNEXURE TO THE NOTICE
Item No. 5 – Item No. 6 –

Item No. 7 –

Item No. 8 –
`
Item No. 9 -
No.
1
2

4
5
`
No.
1
2
4
5
Item No. 11 -
`
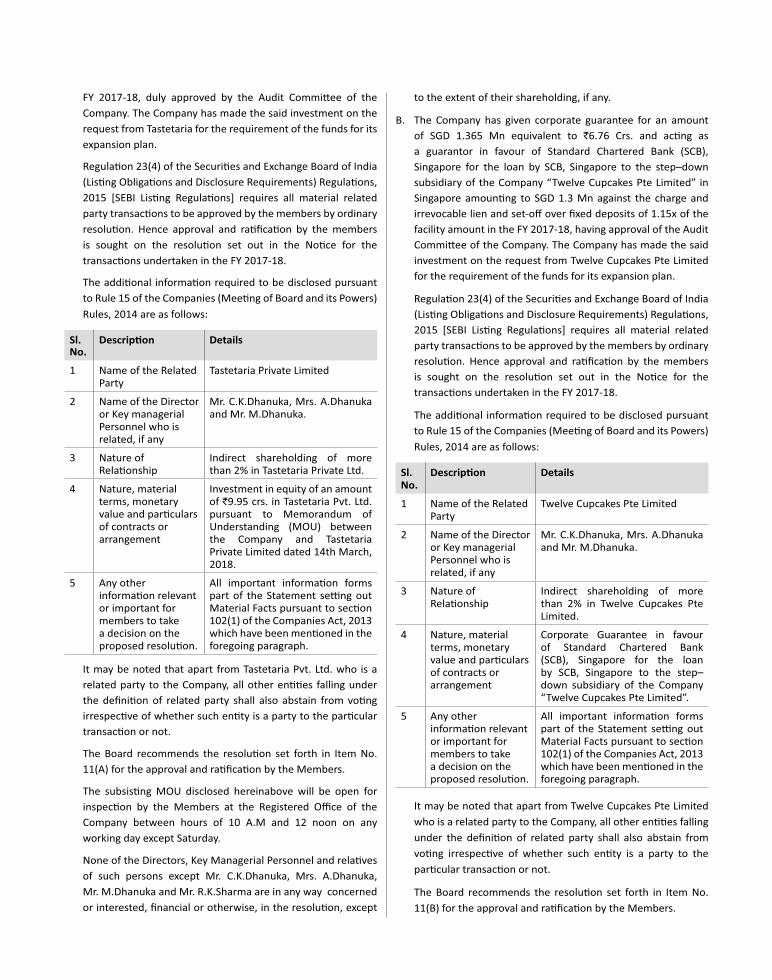
No.
1
2
4`
5
`
No.
1
2
4
5

`
No.
1
2
4
`
5
`
No.
1
2
4
`
5

Director
05197101
500 NIL NIL NIL
NIL
Limited
Limited
NIL
ANNEXURE TO THE NOTICE

Director
NIL
Limited
Limited
Limited
NIL
`
` ` `

Item No. 4
(`
`

Dhunseri Petrochem Limited
Dhunseri House
Company Secretary
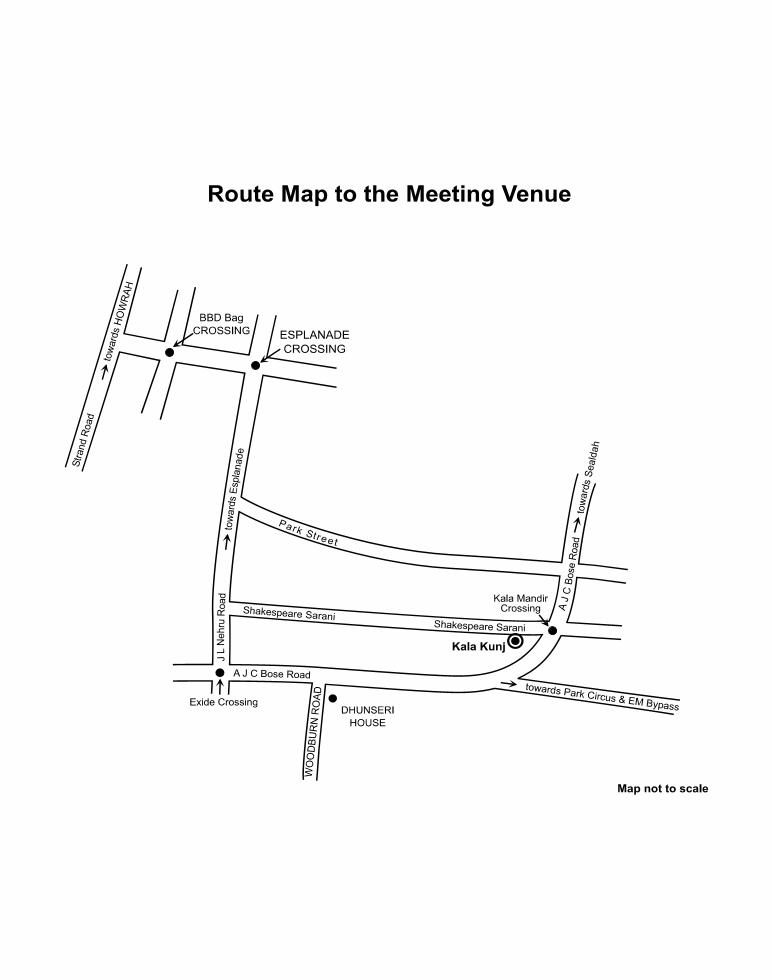

�������������� �������������������� ����� ����� ����� ������� ��������
������� ���������������������� !"#$�!�%���&&"%!'
(���������)**������+, �����-�,��.� /.�#���0,� ����1.�2��1���3�'&&�&"&�+� ����4!��55�""6&�!�&3� .��7�8���4!��55�""6'�6!!�.���9��������:�;��"��� �� ��� .��#�0������������:�� �����9
������������������������ !����"#�� �$���#���%
����&'��&(&
������� ���������������������� !"#$�!�%���&&"%!'
(���������)**������+, �����-�,��.� /.�#���0,� ����1.�2��1���3�'&&�&"&�+� ����4!��55�""6&�!�&3� .��7�8���4!��55�""6'�6!!�.���9��������:�;��"��� �� ��� .��#�0������������:�� �����9
��<�#��+���0=�������9=�<��,��:���� ���� +���&" ��/ ,���>� �����?��� ���*� +����9:� =�+����� �7����=.�/,�,���&.�"&�6.����&�5&���9����2����2, @.�A� ���2����?� ����B�,�. 6.�A+�1��:�����A��� �.�2��1���3�'&&�&�'�
����������������������������������������������������������������������������������������������A�� �,����*�A+���+������<����8=������
�������,�+����� ��0�� ��+��/� �� ��A��:��,�=���� ��.���+��9��� ��� ��+� �����������+��� �� ����,:���������:������� ��0�����,�����+���� ,���*�+��?��� ��
�������������
���9=�<��,��:��8=����� ��� �������� ���:�����*���9��<�,��� ��� �9=�<��,��0�+��*���+���&" ��/ ,���>� �����?��� ���*�+����9:� =�+����� �7����=.�/,�,���&.�"&�6.����&�5&���9����2����2, @.A� ���2����?� ����B�,�.� 6.�A+�1��:�����A��� �.�2��1���3�'&&�&�'�� ����� =���@�,� 9� �+����*�� ����:���*��,+������,�� ���������� ������0������
���� �� B+���*��9��*�:��8=�� ���������0���**������+�,���0���,�=��9:������ ����:��������+��(���������)**����*�+����9:� =.� �������+� � 6�+�,���0�*����+���99� �9� ��*�+��?��� ��"� 7���+��(����,�� �.��8:�� ���=�A��9� �� ������.�:��������*�����+��������*�+���&" ��/ ,���>� �����?��� ��C5� ������:�� �����:,���DED�� �+���::��:�������,9 ����� ��+��(����,�� ��� ������� �+��$�8���*�=�,�������+��D7��D����D/��� �D���,9 ��0�� 1����� ��� =��������(����,�� �.�=�,��:��8=������0�
� ������������ �+��9� ������+�<�+��+� 1���::��:�����
�<#�.�0�� ��+��9�90�����.�+���� �������������������������������������������������������������������������������������������������������+������*���+, ���������+�9���9����+���0=��::�� ����� ��9����������������������������������������������������������������������������������������������������������������������������������������� /������������������������������������������������������������������������������������������������������������������������������������������������������
�39����������������������������������������������������������������������������������������������������������������������������������������� A�� �,����������������������������������������������������������������������������������������������������������������������*���� ��+�9<+���"� ��9����������������������������������������������������������������������������������������������������������������������������������������� /�����������������������������������������������������������������������������������������������������������������������������������������������������
�39����������������������������������������������������������������������������������������������������������������������������������������� A�� �,���������������������������������������������������������������������������������������������������������������������*���� ��+�9<+��.�5� ��9����������������������������������������������������������������������������������������������������������������������������������������� /�����������������������������������������������������������������������������������������������������������������������������������������������������
�39����������������������������������������������������������������������������������������������������������������������������������������� A�� �,����������������������������������������������������������������������������������������������������������������������������������������������
A�� ���+��������������������������������������������������������������=��*�����������������������������������"&�6
?�90��D��7����<�����3���� ��������������������������������������������������������������������������������������������A�� �,����*�A+���+����������������������������������������������������������������������������������������������������������������
A�� �,����*����8=�+�����������������������������������������������������������������������������������������������������������������������������������������������������������������������������������������������������������������������������������������������������������
/**�8(��� ,�A�9:
� ������ �
������������������������������������������������������������������������������������������������9���*����8=��� �$�)�2���BB�(A�
���������*�����+��/>?������*����3��� ��� ��,�� ��
��$)����)� ��$)����)�$�)&�� /��:�� ��*�7� � ����A��9� �"� �������� ��*������� ��� ��F,�=�A+����5� (�3�::�� 9� ��*�?���(�@���2,9���A+��9�.��+���������0=������ � (�3�::�� 9� ��*�?���(�@���2,9���A+��9�����+���8�,������������7� � ���G��7)�� �� � ,��� ��*��������+�:��*�?��������:�2,9���2+��� ������ 3�8�,������ 3� ��:� �� �������%� �� � ,��� ��*��������+�:��*�?���H��� ��������2, ��������� 3�8�,����� ��:� �� �������'� /::�� 9� ��*�?���A���+��+��(�9:,�������� �� ��:� �� �������6� � ���9� ���.���� �.�>,��� ����� ����,��=�� ��8�����*���9����:��*����, �������� ��6%��*���9:� ����/.�"&�5��������+���9:� �����/9� �9� ��/.�"&�'!� /::�������*��������:��=��� ���� ���+�I��=:�� �� ��� ����=���������A�/���J������B��, ����+��A���9� �/����9� �&� �,�+�����*�%�K��+���+���� ���*��+, �����)���������������������)����� ���=:�� �� ��� ����=���������A�/���������B��0=�+����9:� =��� /::�������*�?�������(���������=�B�� ���� ��:���� � ����+��7L�"&�'3�6
������������������������ !����"#�� �$���#���%
����&'��&(&
!)�� ���$�
M�,��,� ���A��� ��&��%���*�+����9:� ����/.�"&�5�� ���,����!�5���*�+����9:� �����?� ���9� �� ��/�9� ������ ��(,��.�"&� 37��9�����?>B3��N
�*��)���+
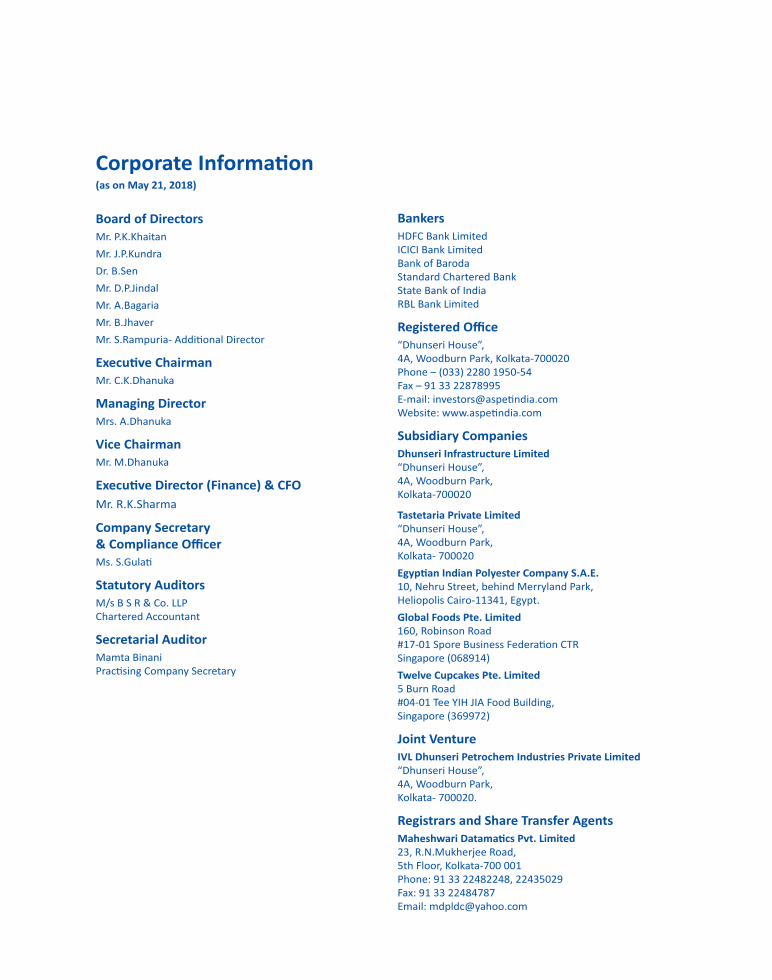
(as on May 21, 2018)
Board of DirectorsMr. P.K.Khaitan
Mr. J.P.Kundra
Dr. B.Sen
Mr. D.P.Jindal
Mr. A.Bagaria
Mr. B.Jhaver
Mr. C.K.Dhanuka
Managing DirectorMrs. A.Dhanuka
Mr. M.Dhanuka
Mr. R.K.Sharma
Company Secretary
Statutory AuditorsM/s B S R & Co. LLPChartered Accountant
Secretarial AuditorMamta Binani
Bankers HDFC Bank Limited ICICI Bank Limited Bank of BarodaStandard Chartered Bank State Bank of India RBL Bank Limited
“Dhunseri House”,
Phone – (033) 2280 1950-54
Subsidiary Companies
“Dhunseri House”,
Kolkata-700020
“Dhunseri House”,
Kolkata- 700020
Heliopolis Cairo-11341, Egypt.
Singapore (068914)
5 Burn Road #04-01 Tee YIH JIA Food Building, Singapore (369972)
Joint Venture
“Dhunseri House”,
Kolkata- 700020.
23, R.N.Mukherjee Road, 5th Floor, Kolkata-700 001Phone: 91 33 22482248, 22435029
Email: [email protected]

Top Related