


Languages
Pages
Legal


The Need for Carnegie-designated “Very High” Research
Universities in Nevada
Kevin R. Carman, UNRJohn Valery White, UNLV
Joint Presentation to WRED CommitteeJune 5, 2014
*

I. Why does a “Very High” Research University designation matter?
prestige with employers value for students, graduates credibility to funding agencies
› akin to high grade from financial analysts› increased eligibility for major federal
grants essential to state economic
development strategy
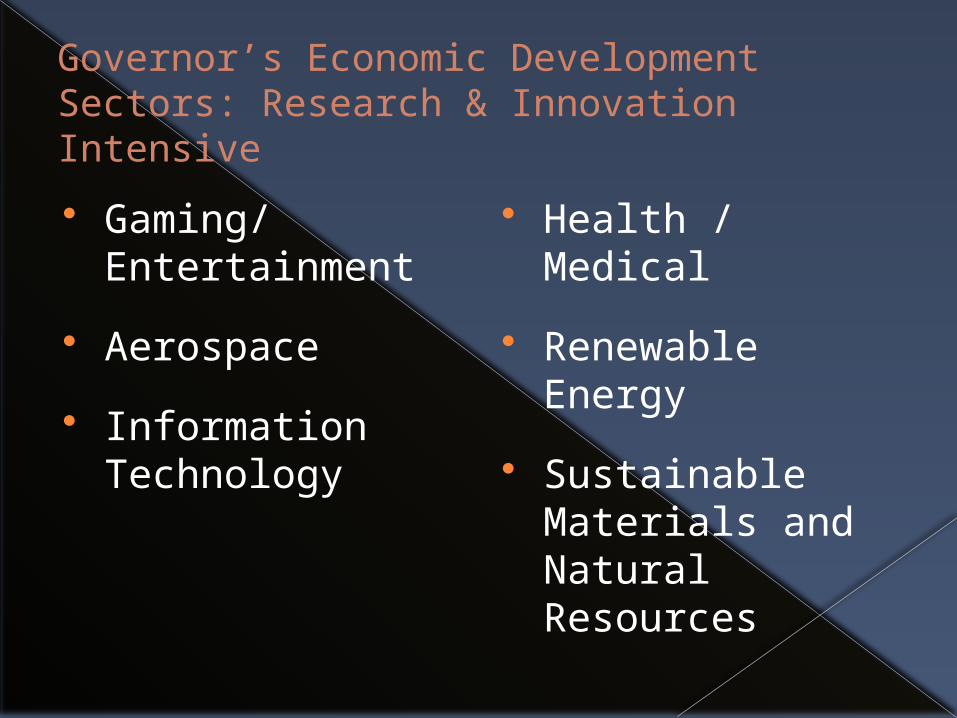
Governor’s Economic Development Sectors: Research & Innovation Intensive
Gaming/ Entertainment
Aerospace
Information Technology
Health / Medical
Renewable Energy
Sustainable Materials and Natural Resources

Governor’s Economic Development Plan: Enhance R&D activity
“…Nevada lags behind other states and the nation on every indicator of innovation and Research & Development activity”
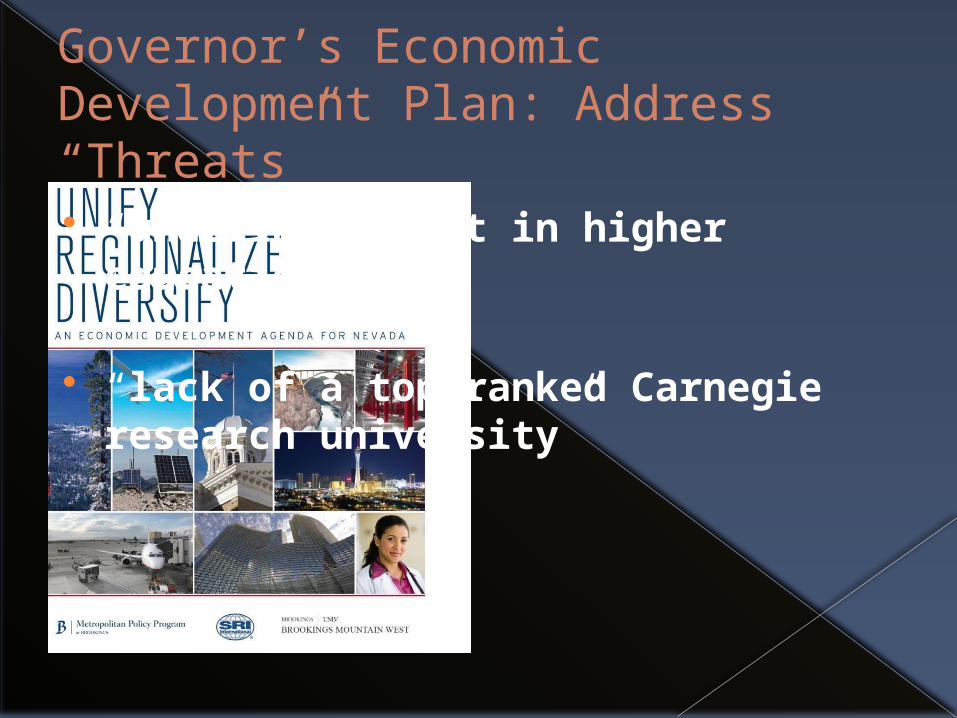
Governor’s Economic Development Plan: Address “Threats” “underinvestment in higher
education”
“lack of a top-ranked Carnegie research university”

Governor’s Economic Development Plan: Recommendation for Action
expand role of research universities:
› Research & Innovation
› Workforce Development through advanced degrees

Public Investment in R&D Capacity
Utah “U-STARS” (2006)
Texas “Tier 1” Bill (2009)
Florida “Pre-eminence” Bill (2013)
Significant, multi-year enhancement of universities’ operating budgets
› hire clusters of faculty in key research areas
› address research capital needs

II. How is a university designated “Research University/ Very High”?
UNM

Carnegie “Correlates”
PhDs› Humanities› Social Sciences› STEM› Other Professional
Non-Faculty Research Staff and Postdocs
Research Expenditures› S&E› Non S&E

III. Where are we now ?How do we get there?
> Different histories> Different capacities, needs
> Different plans > Common goal

UNR assessment of RU/VH

UNR Capacity Study: 22,000 by 2021
Analysis of faculty and staff needed to support 22,000 students› 18:1 Student: Faculty ratio
272 Faculty (39/year) 167 Staff (24/year) 121 GTA (17/year)
Results are similar to the R-VH analysis…
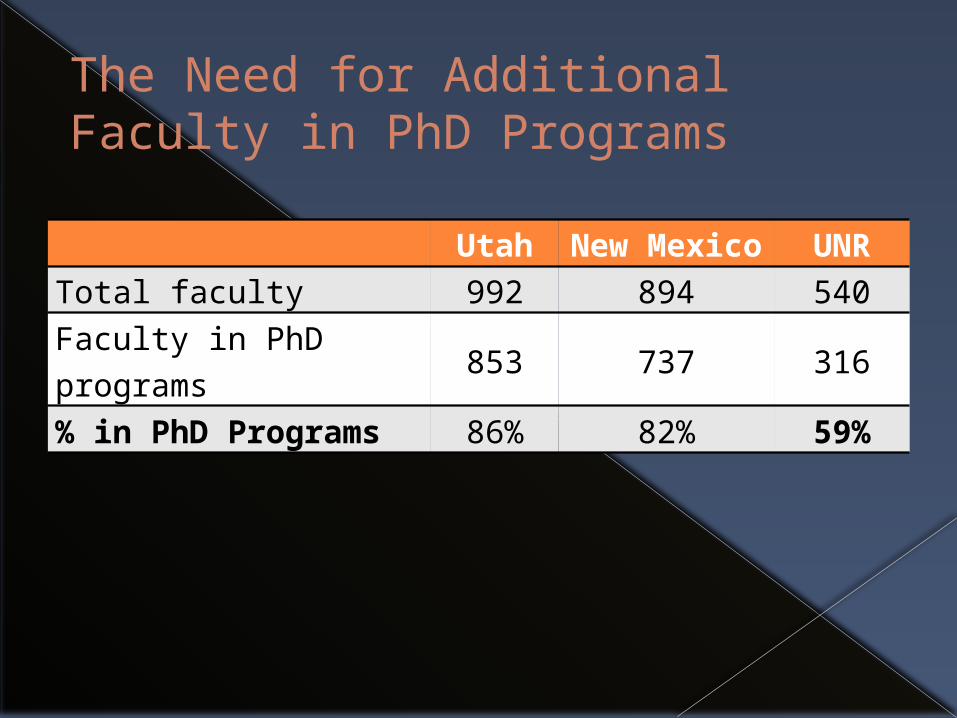
The Need for Additional Faculty in PhD Programs
UtahNew
MexicoUNR
Total faculty 992 894 540Faculty in PhD programs
853 737 316
% in PhD Programs 86% 82% 59%
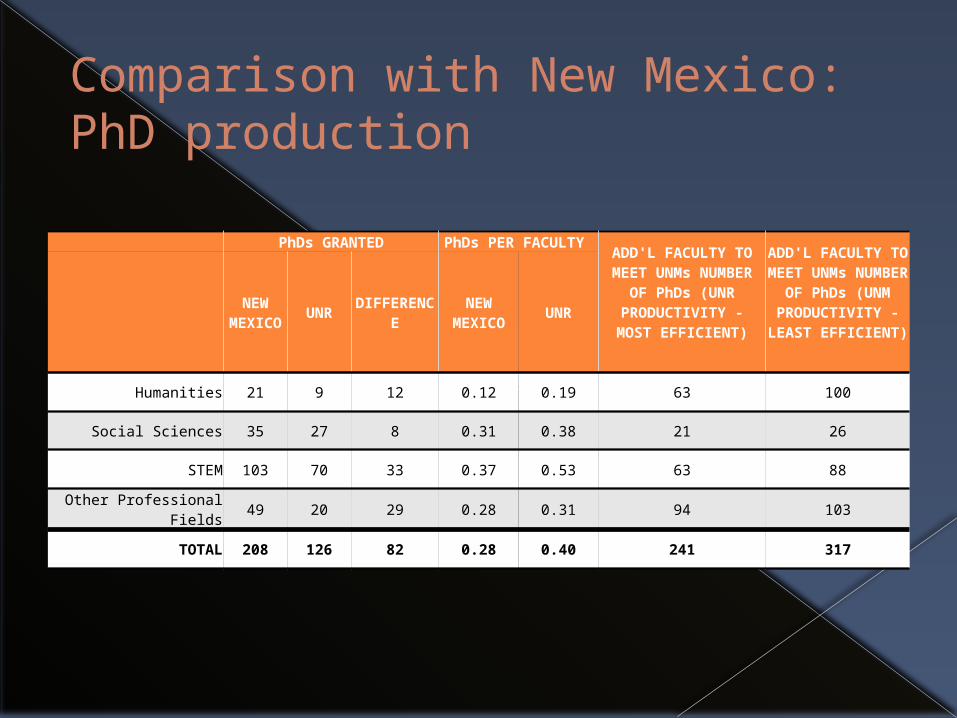
Comparison with New Mexico: PhD production
PhDs GRANTED PhDs PER FACULTY ADD'L FACULTY TO
MEET UNMs NUMBER OF PhDs
(UNR PRODUCTIVITY - MOST EFFICIENT)
ADD'L FACULTY TO MEET UNMs
NUMBER OF PhDs (UNM
PRODUCTIVITY - LEAST
EFFICIENT)
NEW
MEXICO
UNRDIFFEREN
CENEW
MEXICOUNR
Humanities 21 9 12 0.12 0.19 63 100
Social Sciences 35 27 8 0.31 0.38 21 26
STEM 103 70 33 0.37 0.53 63 88
Other Professional Fields
49 20 29 0.28 0.31 94 103
TOTAL 208 126 82 0.28 0.40 241 317
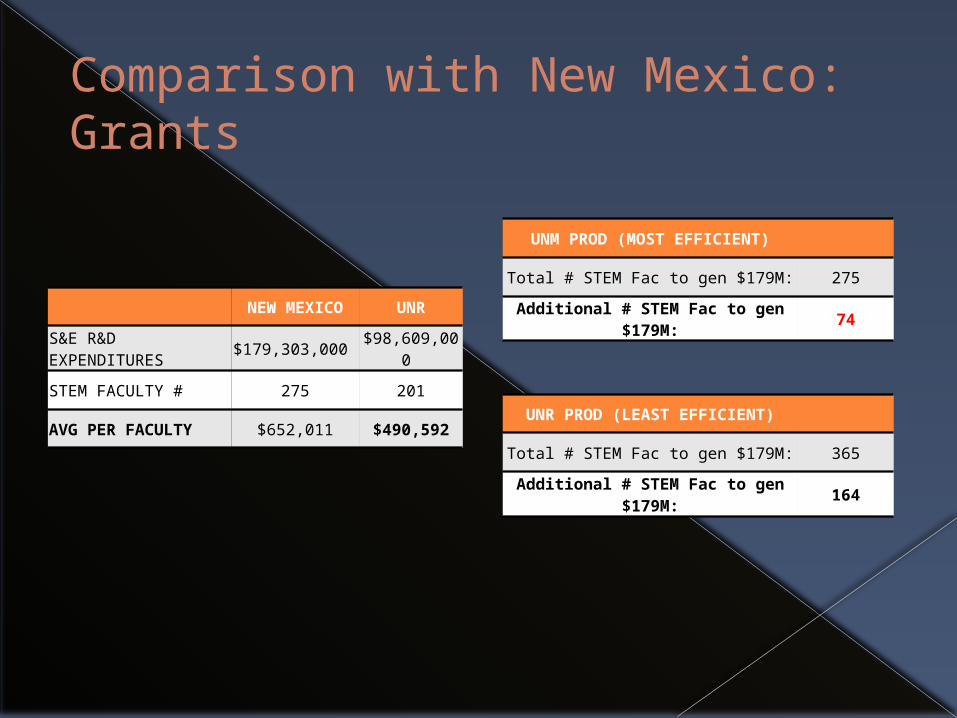
Comparison with New Mexico: Grants
NEW MEXICO UNR
S&E R&D EXPENDITURES
$179,303,000 $98,609,00
0
STEM FACULTY # 275 201
AVG PER FACULTY $652,011 $490,592
UNM PROD (MOST EFFICIENT)
Total # STEM Fac to gen $179M: 275
Additional # STEM Fac to gen $179M:
74
UNR PROD (LEAST EFFICIENT)
Total # STEM Fac to gen $179M: 365
Additional # STEM Fac to gen $179M:
164

Comparison with New Mexico: PhD production + grants
PhDs GRANTED PhDs PER FACULTY ADD'L FACULTY TO
MEET UNMs NUMBER OF PhDs
(UNR PRODUCTIVITY - MOST EFFICIENT)
ADD'L FACULTY TO MEET UNMs
NUMBER OF PhDs (UNM
PRODUCTIVITY - LEAST
EFFICIENT)
NEW
MEXICO
UNRDIFFEREN
CENEW
MEXICOUNR
Humanities 21 9 12 0.12 0.19 63 100
Social Sicences 35 27 8 0.31 0.38 21 26
STEM 103 70 33 0.37 0.53 74 88
Other Professional Fields
49 20 29 0.28 0.31 94 103
TOTAL 208 126 82 0.28 0.40 252 317

Cost projectionsYRS FAC $100K/FAC Staff
$77,471/Position
GRAD ASST.
$23K (2.5%/YEA
R)
OPERATING & TRAVEL
($2,500/YR/FAC)
START-UP COSTS
TOTAL
1 36 $3,600,000 24 $1,859,318 36 $828,000 $630,000 $1,500,000 $8,417,318
2 36 $3,690,000 24 $1,901,864 36 $848,700 $630,000 $1,500,000 $8,570,564
3 36 $3,782,250 24 $1,945,473 36 $869,918 $630,000 $1,500,000 $8,727,640
4 36 $3,876,806 24 $1,990,172 36 $891,665 $630,000 $7,388,644
5 36 $3,973,726 24 $2,035,989 36 $913,957 $630,000 $7,553,672
6 36 $4,073,070 24 $2,082,951 36 $936,806 $630,000 $7,722,827
7 36 $4,174,896 24 $2,131,087 36 $960,226 $630,000 $7,896,210
252 $27,170,749 168 $13,946,854 252 $6,249,272 $4,410,000 $4,500,000 $56,276,87
5
OFFICE SPACE
REPURPOSE EXISTING SPACE FOR OFFICES $15,000,00
0
RESEARCH SPACE
80,000 SQ. FT $52,000,00
0$123,276,8
75
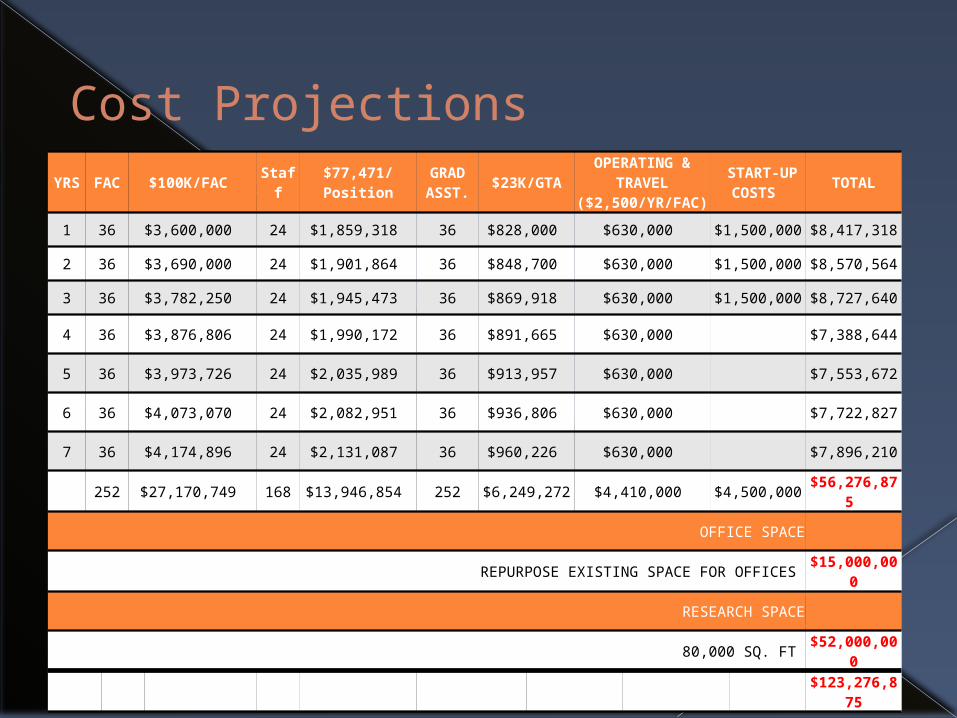
Cost ProjectionsYRS FAC $100K/FAC Staff
$77,471/Position
GRAD ASST.
$23K/GTAOPERATING &
TRAVEL ($2,500/YR/FAC)
START-UP COSTS
TOTAL
1 36 $3,600,000 24 $1,859,318 36 $828,000 $630,000 $1,500,000 $8,417,318
2 36 $3,690,000 24 $1,901,864 36 $848,700 $630,000 $1,500,000 $8,570,564
3 36 $3,782,250 24 $1,945,473 36 $869,918 $630,000 $1,500,000 $8,727,640
4 36 $3,876,806 24 $1,990,172 36 $891,665 $630,000 $7,388,644
5 36 $3,973,726 24 $2,035,989 36 $913,957 $630,000 $7,553,672
6 36 $4,073,070 24 $2,082,951 36 $936,806 $630,000 $7,722,827
7 36 $4,174,896 24 $2,131,087 36 $960,226 $630,000 $7,896,210
252 $27,170,749 168 $13,946,854 252 $6,249,272 $4,410,000 $4,500,000 $56,276,87
5
OFFICE SPACE
REPURPOSE EXISTING SPACE FOR OFFICES $15,000,00
0
RESEARCH SPACE
80,000 SQ. FT $52,000,00
0$123,276,8
75

Funding Analysis
~ $8M/year: additional required for personnel and operating expense
~$5M/year: Enrollment growth + Fee increase ~$3M/year: Gap
Potential sources of funds to bridge gap:› Increased $/WSCH› General fund
~$67M: New/renovated facilities› Philanthropy› State
UNLV analysis for Carnegie RU/ VH

RU/VH sets the bar high for UNLV
Benchmarking through comparison› Oregon, Colorado, Utah, Arizona State› performance in each Carnegie correlate
Need to increase :› $80 million in research expenditures per
year› 100 doctoral degrees awarded per year› 100 post-doctoral scholars, research
faculty
UG Education Remains a Priority
Retention/ Progression / Completion › more full-time UG students (15 to Finish)› R/P/C: improve 6-year grad rate, meet CCA › student completion drives formula funding› smaller sections taught by f/t instructors
(block scheduling) drives student success
To meet these goals, F/T faculty instructional capacity must increase
Starting Point: c. 2012
Challenge: Limited faculty size (780)› Increased course loads, larger classes› More doctoral committees per faculty member
Challenge: Low point of research ($30 m)› Decline in grant proposals, grant funding› Almost no patent, tech transfer activity
Challenge: Insufficient space (Master Plan)

Strategic Thinking Process
Vision/ Mission is clear: RU/ VH Significant analysis to be done
› Goals/ Objectives/ Metrics› Tactics & Strategies› Organization & Structure› People› Support Structures› Results/ Assessment of Performance
Current estimate of what we need
Expand “bandwidth” for instruction, research Target: > 1200 faculty, > 800 grad assistants
› 900 tenure-eligible active-research faculty › 50 non-tenured research / clinical faculty › 250 lecturers (focused on UG education)
Faculty count not goal - means to ends› Research productivity/ economic development› Degree productivity/ workforce development

Estimated need: 900 active researchers on faculty
625 current tenure-eligible lines› many recruited from Tier 1 universities› heavy instructional load for RU/ VH
assigned 4 - 6 credit hours per semester limited research leave opportunities
› capable of higher productivity, need support
› need increase of $50,000 research activity per line per year to attain RU/VH designation
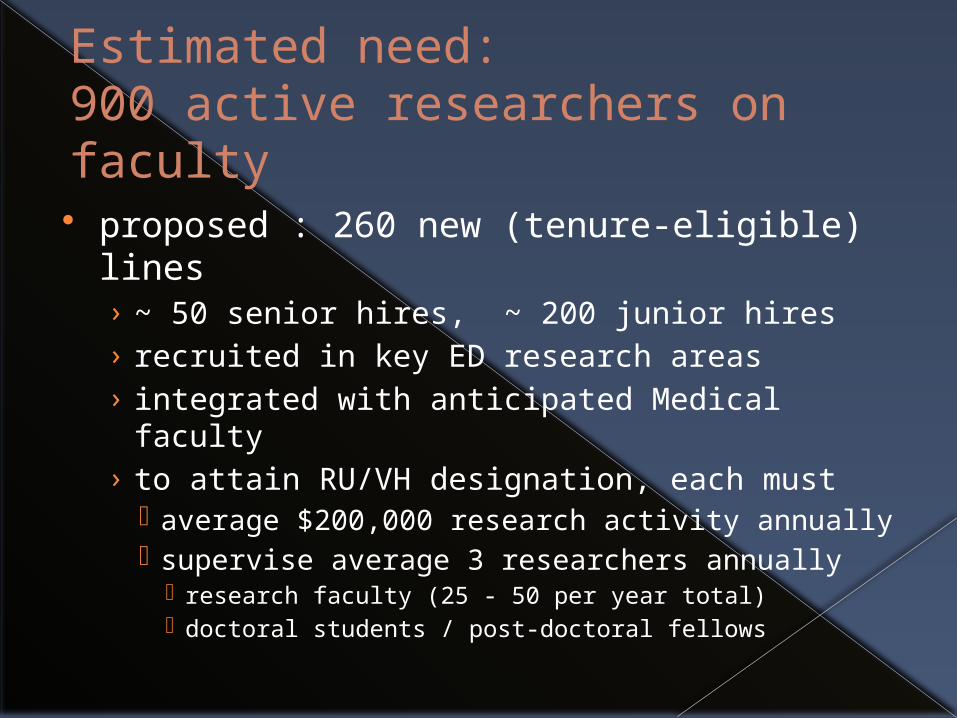
Estimated need:900 active researchers on faculty
proposed : 260 new (tenure-eligible) lines› ~ 50 senior hires, ~ 200 junior hires › recruited in key ED research areas› integrated with anticipated Medical faculty› to attain RU/VH designation, each must
average $200,000 research activity annually supervise average 3 researchers annually
research faculty (25 - 50 per year total) doctoral students / post-doctoral fellows
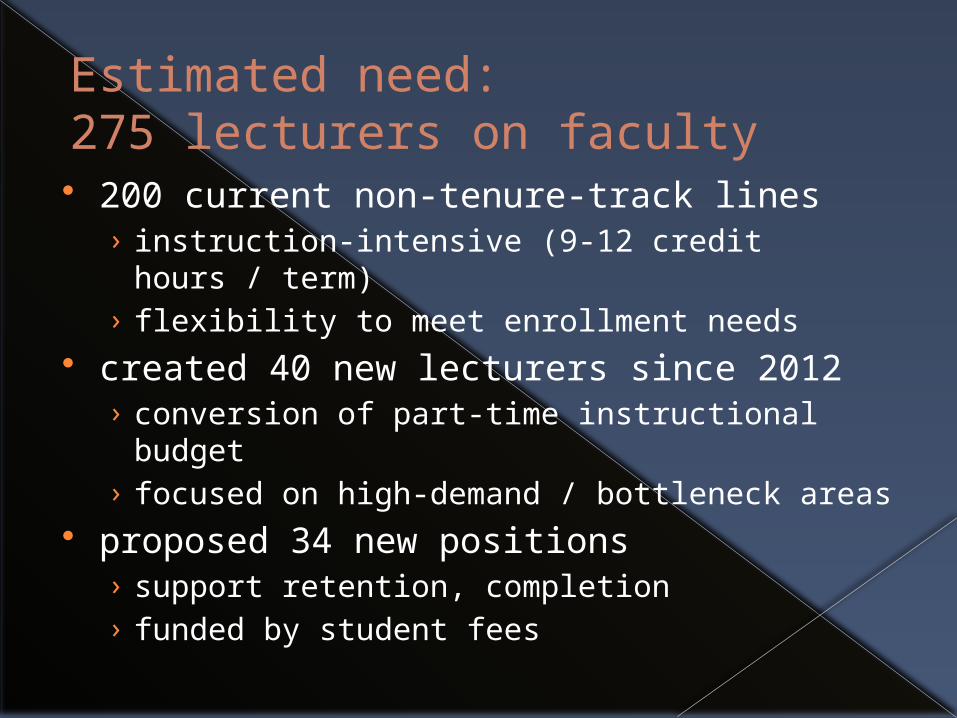
Estimated need:275 lecturers on faculty 200 current non-tenure-track lines
› instruction-intensive (9-12 credit hours / term)
› flexibility to meet enrollment needs created 40 new lecturers since 2012
› conversion of part-time instructional budget› focused on high-demand / bottleneck areas
proposed 34 new positions› support retention, completion› funded by student fees

Estimated Need:800 Graduate Assistantships
current: 550 state-funded grad assistants
proposed: 260 new grad assistantships› enhance stipends to be more competitive› focused on doctoral students› focused on research, innovation areas

Estimated Operating Costs
Year 1
(FY2016)
Year 2 (FY
2017)
Year 3 (FY
2018)
Year 4 (FY
2019)
Year 5 (FY
2020)
Year 6 (FY
2021)
Year 7 (FY
2022)
Year 8 (FY
2023)
Total Cumulative Enhanceme
nt
Faculty Hires: Senior Positions
3 3 7 7 7 7 7 7 48
Faculty Hires: Junior Positions
22 22 28 28 28 28 28 28 212
Faculty Hires: Total Positions
25 25 35 35 35 35 35 35 260
Academic Support Staff Positions
8 8 12 12 12 12 12 12 88
Total Salary for Faculty and Staff Positions
3.525 3.525 6.125 6.125 6.125 6.575 6.9 7.25 46.1
Graduate Student Scholarships
25 25 30 30 37.5 37.5 37.5 37.5 260
Doctoral Instruction/ Graduate Support
$1.1 MIL $1.1 MIL $1.45 MIL$1.45 MIL
$1.75 MIL
$1.75 MIL
$2.75 MIL
$2.75 MIL
$14.1 MIL
Annual Enhancement$4.625
MIL$4.625
MIL$7.575
MIL$7.575
MIL$7.875
MIL$8.325
MIL$9.65 MIL
$10.0 MIL
$60.25 MIL
Cumulative Enhancement
$4.625 MIL
$9.25 MIL
$16.825 MIL
$24.4 MIL
$32.275 MIL
$40.6 MIL
$50.25 MIL
$60.25 MIL
$60.25 MIL

Estimated UNLV Capital Needs
current Master Plan (15 years)› state capital funds: $182 million› campus matching funds : $131 million› build 500, 000 GSF › repurpose 200,000 GSF
UNLV School of Medicine

Proposed UNLV Match: $100 million
One-time expenses (over 10 years)› $61 million for start-up costs for new
faculty› $40 million for other research
infrastructure libraries, laboratories, instrumentation technical support staff current, anticipated institutional funds
indirect cost recovery other savings

IV. What do we need now?
Universities:› Higher productivity of advanced degrees › better supported, more research
productive faculty› greater grant/ contract activity› enhanced community support
Regents/ NSHE:› enhanced state operational support › enhanced capital funds› public support for research & innovation
mission
Top Related