


Languages
Pages
Legal


© OECD/IEA - 2009© OECD/IEA - 2009

© OECD/IEA - 2009
0
2 000
4 000
6 000
8 000
10 000
12 000
14 000
16 000
18 000
1980 1990 2000 2010 2020 2030
Mto
e
Other renewables
Hydro
Nuclear
Biomass
Gas
Coal
Oil
World energy demand expands by 45% between now and 2030 – an average rate of increase of 1.6% per year – with coal accounting for more than a third of the overall rise
World primary energy demand in tWorld primary energy demand in the he Reference Scenario: this is unsustainable!Reference Scenario: this is unsustainable!World primary energy demand in tWorld primary energy demand in the he Reference Scenario: this is unsustainable!Reference Scenario: this is unsustainable!

© OECD/IEA - 2009
The continuing importance of coal in The continuing importance of coal in world primary energy demandworld primary energy demandThe continuing importance of coal in The continuing importance of coal in world primary energy demandworld primary energy demand
0%
20%
40%
60%
80%
100%
Non-OECD OECD
All other fuelsCoal
Shares of incremental energy demand Reference Scenario, 2006 - 2030Increase in primary demand, 2000 - 2007
Demand for coal has been growing faster than any other energy source & is projected to account for more than a third of incremental global energy demand to 2030
Mto
e
0
100
200
300
400
500
600
700
800
900
1 000
Coal Oil Gas Renewables Nuclear
4.8%
1.6% 2.6%
2.2%
0.8%
% = average annual rate of growth

© OECD/IEA - 2009
Change in oil demand by region Change in oil demand by region in the Reference Scenario, 2007-2030in the Reference Scenario, 2007-2030Change in oil demand by region Change in oil demand by region in the Reference Scenario, 2007-2030in the Reference Scenario, 2007-2030
-2 0 2 4 6 8 10
China
Middle East
India
Other Asia
Latin America
E. Europe/Eurasia
Africa
OECD North America
OECD Europe
OECD Pacific
mb/d
All of the growth in oil demand comes from non-OECD, with China contributing 43%, the Middle East & India each about 20% & other emerging Asian economies most of the rest

© OECD/IEA - 2009
EU natural gas market outlookEU natural gas market outlookEU natural gas market outlookEU natural gas market outlook
EU import dependency rises from 58% today to 86% in 2030 as a result of declining domestic production and increasing demand
0
100
200
300
400
500
600
700
800
2007 2030
Bcm Imports - other countries
Imports - Middle East
Imports - Africa
Imports - Russia andother TE
Domestic production
© OECD/IEA - 2009
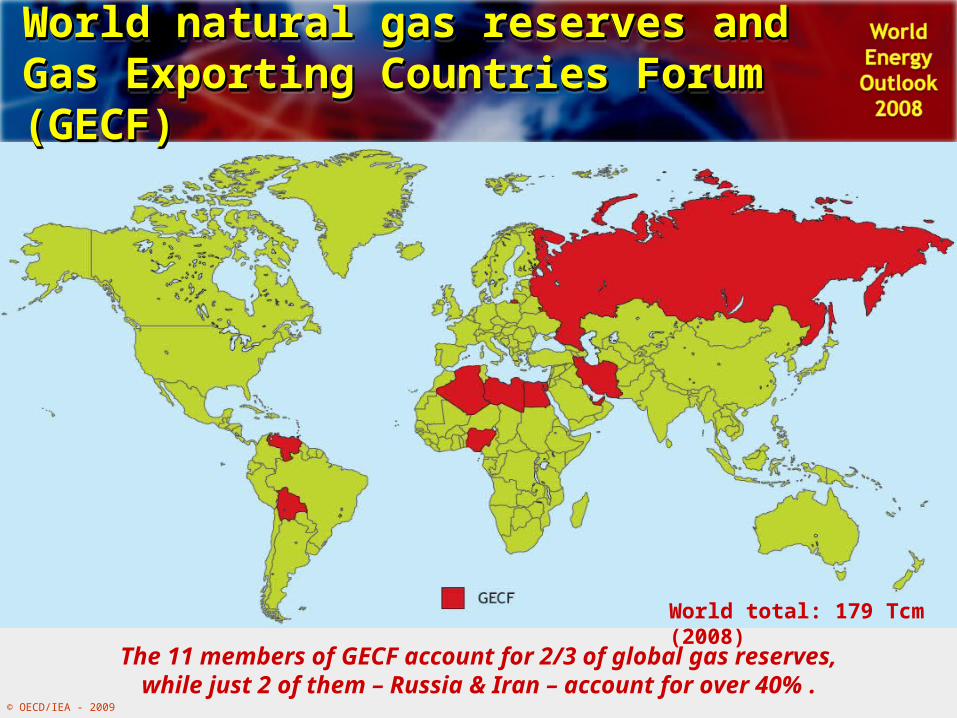
The 11 members of GECF account for 2/3 of global gas reserves,while just 2 of them – Russia & Iran – account for over 40% .
World natural gas reserves and Gas Exporting World natural gas reserves and Gas Exporting Countries Forum (GECF) Countries Forum (GECF) World natural gas reserves and Gas Exporting World natural gas reserves and Gas Exporting Countries Forum (GECF) Countries Forum (GECF)
World total: 179 Tcm (2008)

© OECD/IEA - 2009
Cumulative energy-supply investment Cumulative energy-supply investment
in the Reference Scenarioin the Reference Scenario, 2007-2030, 2007-2030
Cumulative energy-supply investment Cumulative energy-supply investment
in the Reference Scenarioin the Reference Scenario, 2007-2030, 2007-2030
Investment of $26 trillion, or over $1 trillion/year, is needed, but the credit squeeze could delay spending, potentially setting up a supply-crunch once the economy recovers
Power generation
50%
Transmission & distribution
50%Mining
91%
Shipping & ports
9%
Exploration and development
80%
Refining16%
Shipping4%
Exploration & development
61%LNG chain
8%
Transmission & distribution
31%
Power 52%
$13.6 trillion
Oil 24%
$6.3 trillion
Gas21%
$5.5 trillion
Coal 3%
$0.7 trillion
Biofuels <1%
$0.2 trillion
© OECD/IEA - 2009© OECD/IEA - 2009

© OECD/IEA - 2009
World oil production by OPEC/non-OPEC World oil production by OPEC/non-OPEC
in the Reference Scenarioin the Reference Scenario
World oil production by OPEC/non-OPEC World oil production by OPEC/non-OPEC
in the Reference Scenarioin the Reference Scenario
Production rises to 104 mb/d in 2030, with Middle East OPEC taking the lion’s share of oil market growth as conventional non-OPEC production declines
0
20
40
60
80
100
120
2000 2007 2015 2030
OPEC - other
OPEC - Middle East
Non-OPEC - non-conventional
Non-OPEC -conventional
OPEC share
mb/
d
38%
40%
42%
44%
46%
48%
50%
52%

© OECD/IEA - 2009
0
20
40
60
80
100
120
1990 2000 2010 2020 2030
mb/
d
Natural gas liquidsNon-conventional oilCrude oil - yet to be Developed or foundCrude oil - currently producing fields
World oil production by source World oil production by source in the Reference Scenarioin the Reference ScenarioWorld oil production by source World oil production by source in the Reference Scenarioin the Reference Scenario
Even if oil demand was to remain flat to 2030, 45 mb/d of gross capacity – roughly four times the capacity of Saudi Arabia – would ne needed just to offset decline from existing fields.
45 mb/d

© OECD/IEA - 2009
A sea change: world oil & gas production by A sea change: world oil & gas production by company type in the company type in the Reference ScenarioReference ScenarioA sea change: world oil & gas production by A sea change: world oil & gas production by company type in the company type in the Reference ScenarioReference Scenario
0
20
40
60
80
100
120
2007 2015 2030
mb/
d
0
750
1 500
2 250
3 000
3 750
4 500
2006 2015 2030
Bcm
NOCs Private companies
Oil Gas
Almost 80% of the projected increase in output of both oil & gas comes from national companies – on the assumption that investment is forthcoming

© OECD/IEA - 2009© OECD/IEA - 2009

© OECD/IEA - 2008
Reductions in energy-related COReductions in energy-related CO22 emissions in the climate-policy scenariosemissions in the climate-policy scenariosReductions in energy-related COReductions in energy-related CO22 emissions in the climate-policy scenariosemissions in the climate-policy scenarios
While technological progress is needed to achieve some emissions reductions, efficiency gains and deployment of existing low-carbon energy accounts for most of the savings
20
25
30
35
40
45
2005 2010 2015 2020 2025 2030
Gig
aton
nes
Reference Scenario 550 Policy Scenario 450 Policy Scenario
CCS Renewables & biofuels
Nuclear
Energy efficiency
550 Policy
Scenario
450 Policy
Scenario
54%
23%
14% 9%

© OECD/IEA - 2009
Total power generation capacity today Total power generation capacity today and in 2030 by scenarioand in 2030 by scenarioTotal power generation capacity today Total power generation capacity today and in 2030 by scenarioand in 2030 by scenario
In the 450 Policy Scenario, the power sector undergoes a dramatic change – with CCS, renewables and nuclear each playing a crucial role
0 1 000 2 000 3 000
Other renewables
Wind
Hydro
Nuclear
Coal and gas with CCS
Gas
Coal
GW
1.2 x today
1.5 x today
13.5 x today
2.1 x today
1.8 x today
12.5 x today
15% of today’s coal & gas capacity
Today Reference Scenario 2030 450 Policy Scenario 2030

© OECD/IEA - 2009
Cumulative European Union COCumulative European Union CO22 savings savings with 20% reduction target in 2020with 20% reduction target in 2020Cumulative European Union COCumulative European Union CO22 savings savings with 20% reduction target in 2020with 20% reduction target in 2020
EU cumulative savings over 2008-2020 would represent only 40% of China’s annual CO2 emissions in 2020
0
2
4
6
8
10
12
China
ANNUAL 2020 CO2 emissions
Gig
aton
nes
EU-27
CUMULATIVE savingswith 20% CO2 emissions reduction target
(2008 - 2020)
Office of the Chief Economi
st
© OECD/IEA - 2009
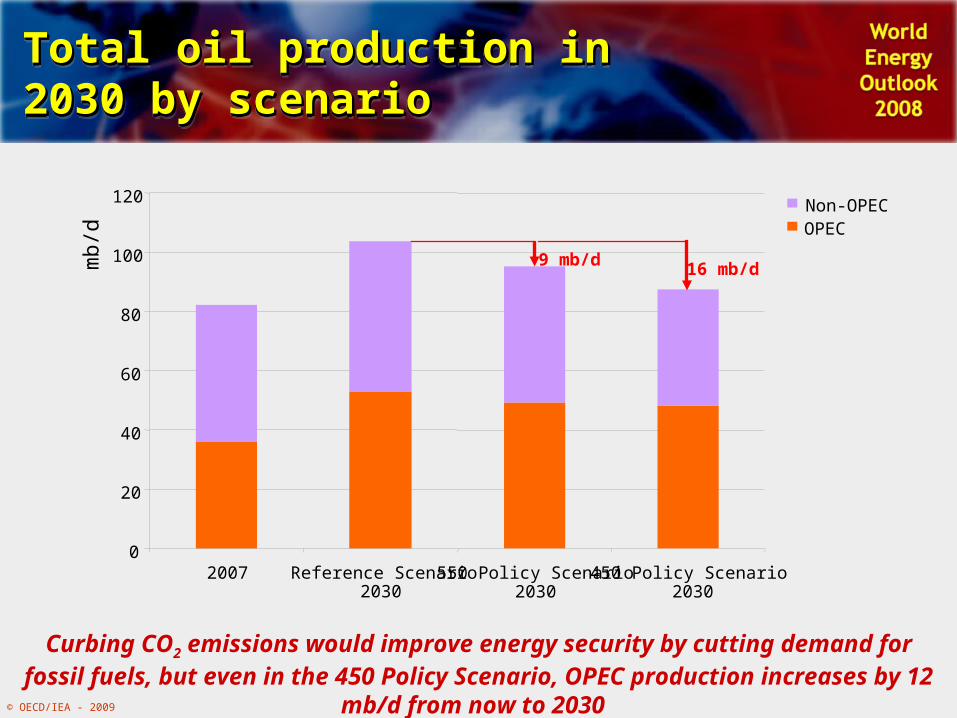
Total oil production in 2030 by Total oil production in 2030 by scenarioscenarioTotal oil production in 2030 by Total oil production in 2030 by scenarioscenario
Curbing CO2 emissions would improve energy security by cutting demand for fossil fuels, but even in the 450 Policy Scenario, OPEC production increases by 12 mb/d from now to 2030
0
20
40
60
80
100
120
2007 Reference Scenario2030
550 Policy Scenario2030
450 Policy Scenario2030
Non-OPECOPEC
9 mb/d 16 mb/dmb/
d

© OECD/IEA - 2009
How is the financial & economic crisisHow is the financial & economic crisisaffecting energy investment?affecting energy investment?
How is the financial & economic crisisHow is the financial & economic crisisaffecting energy investment?affecting energy investment?
Difficulties in obtaining credit & higher cost of capital> Increased aversion to risk> Paralysed credit markets> Plunging share values have increased debt-equity ratios
Lower prices & cash flows have made new investments less attractive
Falling demand caused by economic recession has reduced urgency & appetite for suppliers to invest
Office of the Chief Economi
st

© OECD/IEA - 2009
Impact of financial crisis on global investment Impact of financial crisis on global investment in renewable energyin renewable energyImpact of financial crisis on global investment Impact of financial crisis on global investment in renewable energyin renewable energy
Office of the Chief Economi
st
Investment in renewables has been hit by the rising cost of credit and the fall in oil & gas prices which has reduced the economic incentive for “clean” energy...
Source: NEF… since Q2 2008 investment has come down to 2006 levels
0
5
10
15
20
25
30Bi
llion
dol
lars
04-Q1
04-Q2
04-Q3
04-Q4
05-Q1
05-Q2
05-Q3
05-Q4
06-Q1
06-Q2
06-Q3
06-Q4
07-Q1
07-Q2
07-Q3
07-Q4
08-Q1
08-Q2
08-Q3
08-Q4
09-Q1

© OECD/IEA - 2009
Summary & conclusionsSummary & conclusionsSummary & conclusionsSummary & conclusions
Current energy trends are patently unsustainable — socially, environmentally, economically
Energy and geopolitics will be increasingly interconnected
We need a major decarbonisation of the world’s energy system -- Copenhagen is crucial
Addressing environmental issues will substantially improve energy security
Financial crisis can plant the seeds for an “energy investment crisis”
Top Related