


Languages
Pages
Legal


2011
Published by the Department of Agriculture, Forestry and Fisheries
Directorate Agricultural Information Services
Private Bag X144, Pretoria 0001
Contents
Preliminaries i–xvi
PART A: Strategic overview 1–18
PART B: Strategic objectives 19–52
PART C: Public entities and other agencies 53–56
Annexure 1: Annual performance plans 57–82
Annexure 2: Service Delivery Improvement Plan 83–98

DEPARTMENT OF AGRICULTURE, FORESTRY AND FISHERIES
2011/12 to 2014/15Strategic Plan

2011
Printed and published by Department of Agriculture, Forestry and Fisheries
Design and layout by Directorate Agricultural Information Services Private Bag X144, Pretoria 0001
ISBN: 978-1-86871-332-5

DAFF Strategic Plan 2011/12–2014/15
iii
ContentsAcroNymS ......................................................................................................................................................... v
Foreword by the Minister ................................................................................................................................. vii
Statement by the Deputy Minister ................................................................................................................... xi
Director-General’s overview ............................................................................................................................ xiii
PArT A: Strategic overview
mission statement ............................................................................................................................................... 2
Legislative and other mandates .......................................................................................................................... 2
Situational analysis ............................................................................................................................................. 5
Strategic goals and objectives ............................................................................................................................ 17
PArT B: Strategic objectives
Administration ..................................................................................................................................................... 20
Trade Promotion and market Access ................................................................................................................. 29
Food Security and Agrarian reform ................................................................................................................... 34
Agricultural Production, Health and Food Safety ................................................................................................ 38
Forestry .............................................................................................................................................................. 42
Fisheries ............................................................................................................................................................. 46
risk management ............................................................................................................................................... 51
PArT c: Public entities and other agencies
Agricultural research council ............................................................................................................................ 54
marine Living resources Fund ........................................................................................................................... 55
other public entities and agencies ..................................................................................................................... 56
ANNeXureS
1. Annual performance plans ............................................................................................................................ 58
2. Service Delivery Improvement Plan .............................................................................................................. 84


DAFF Strategic Plan 2011/12–2014/15
v
AcronymsABeT Adult Basic education and TrainingABP Annual Business PlanAcP Aquaculture certification PlanADF Agricultural Development FinanceADZ Aquaculture Development ZoneAGIS Agricultural Geo-referenced Information SystemAgriBee Agricultural Broad-Based Black economic
empowermentAPA Agricultural Produce AgentsAPI agricultural production inputAPP Annual Performance PlanArc Agricultural research councilATF Agricultural Trade ForumATI Agricultural Training InstituteATPr Agricultural Trade Progress report
Bcc Benguela current commissionBee Black economic empowerment
cAADP comprehensive African Agricultural Development Programme
cAF consultative Advisory ForumcASP comprehensive Agricultural Support Programmecc climate changeccS compulsory community servicecD chief DirectorcmDB configuration management databasecomeSA common market for eastern and Southern AfricacPI consumer price indexcrDP comprehensive rural Development Programme
DAFF Department of Agriculture, Forestry and FisheriesDBSA Development Bank of Southern AfricaDDG Deputy Director-GeneralDeA Department of environmental AffairsDeXco Departmental executive management committeeDFQF duty free and quota freeDG Director-GeneralDHeT Department of Higher education and Training DPSA Department of Public Service and AdministrationDPW Department of Public WorksDrDLr Department of rural Development of Land
reform DrP Disaster recovery Plan
eAc east African cooperationeAF ecosystems Approach to FisherieseAF ecological Approach to FisherieseAP employee Assistance Programmeec european countriesee employment equityeFTA european Free Trade AssociationeH&W employee Health and WellnessePA economic Partnership AgreementePDm employee Performance Development
managementePWP expanded Public Works Programme erA ecological risk AssessmenterP enterprise resource Planningeu european union
FAnGr farm animal genetic resourcesFArm Framework for Aquaculture research
managementFAo Food and Agriculture organizationFeT Further education and Training
FmD foot-and-mouth diseaseFmP Fisheries management PlanFPe fish processing establishmentFS food securityFTe full-time equivalent
GADI Grootfontein Agricultural Development InstituteGDP gross domestic productGeP Gauteng enterprise PropellerGFI gross farm sector income GHG greenhouse gasesGmo genetically modified organism
He Higher educationHIV Human Immunodeficiency VirusHoD Head of DepartmentHr human resourcesHrD Human resources DevelopmentHrm Human resources management
IBSA India, Brazil and South AfricaIcT information and communication technologyID identification document IFSNP Integrated Food Security and Nutrition
ProgrammeIFSS Integrated Fisheries Security StrategyIGDP Integrated Growth and Development PlanILm industry liaison meetingIPAP Industrial Policy Action PlanIT information technologyITc International Trade centreITcAFF Intergovernmental Technical committee for
Agriculture, Forestry and FisheriesITSc International Trade and Security cluster
KIm Knowledge and Information managementKZN KwaZulu-Natal LArP Land and Agrarian reform ProjectLP Limpopo ProvinceLR LabourRelationsLTrAmP Long-term rights Allocation management Process
mafisa micro-agricultural Financial Institutions of South Africa
mAP marketing of Agricultural ProductsmAST marine Administration Systemmcm marine and coastal managementmcS monitoring, control and surveillance mDG millennium development goalsm&e monitoring and evaluationmer monitoring, evaluation and reportingmercoSur mercado commún del SurmIS marketing Information SystemmLrA marine Living resources ActmoA memorandum of Agreementmou memorandum of understandingmSP master Systems Plan mTeF medium Term expenditure FrameworkmTSF medium Term Strategic FrameworkmWG management Working Group
NAc National Agro-meteorological committeeNAFu National African Farmers’ unionNAmc National Agricultural marketing councilNArmco National Agricultural risk management
committee

DAFF Strategic Plan 2011/12–2014/15
viNAS National Aquaculture StrategyNDTT National Disaster Task TeamNerPo National emergent red meat Producers’
organisationNFA National Forests ActNFI net farm sector incomeNGP New Growth PathNPoA National Programme of ActionNPoA National Plan of ActionNW North West
oD organisational DevelopmentoHS occupational Health and Safety
PBr plant breeders’ rightsPDA Provincial Department of Agriculture PDI previously disadvantaged individualPFmA Public Finance management ActPGrFA Plant Genetic resources for Food and
AgriculturePmDS Performance management and Development
System
Q1 Quarter 1Q2 Quarter 2Q3 Quarter 3Q4 Quarter 4QPr quarterly performance report
r&D research and developmentrSA republic of South Africa
SAcu Southern African customs unionSADc Southern African Development communitySALA Subdivision of Agricultural Land ActSAQA South African Qualifications Authority SASSA South African Social Security AgencySDIP Service Delivery Improvement PlanSeDA Small enterprise Development AgencySeTA Sector education and Training AuthoritySG strategic goalSmme small, medium and micro enterprisesSmS Senior management ServicesSo strategic objectiveSoe state-owned entitiesSPS sanitary and phytosanitarySrPP social responsibility programmes and projects
TAc total allowable catchTAe total allowable estimate the dti The Department of Trade and IndustryTIDcA Trade, Investment and Development cooperation
AgreementTor Terms of reference
uN united NationsuS united States
Ve Value engineeringVmW Virtual machine WareVoIP Voice over Internet Protocol
WcrL West coast rock lobsterWFFP Working for Fisheries ProgrammeWScD White Shark cage Diving
WSP Work Skills ProgrammeWTo World Trade organization
Directorates of the departmentD: AAemer Americas, Australasia, europe and middle east
relationsD: AH Animal HealthD: AIc Agriculture Inputs controlD: AP Agro-processingD: AP Animal ProductionD: Ar Aquaculture researchD: ATS Aquaculture Technical ServicesD: Bcc BBBee charters complianceD: c complianceD: ccDm climate change and Disaster managementD: ceD cooperatives and enterprise DevelopmentD: cS communication Services D: DFc Development Finance coordination D: eDPm employee Development and Performance
management D: er employee relations D: er ecosystems research D: Fm Forestry management D: FPV Fisheries Protection Vessels D: FSQA Food Safety and Quality Assurance D: GADI Grootfontein Agricultural Development Institute D: Gr Genetic resources D: Hrm Human resources management D: IcT Information and communication Technology D: IFm Inshore Fisheries management D: IHrm Integrated Human resources management D: IIr Intergovernmental and International relations D: IS Infrastructure SupportD: IS Inspection Services D: ITr International Trade D: KIm Knowledge and Information management D: LuSm Land use and Soil management D: m marketing D: mS monitoring and Surveillance D: Ner National extension reform D: NeS National extension SupportD: oHSFm offshore and High Seas Fisheries management D: oP organisational Performance D: PDS Programme Development Support D: PH Plant Health D: PP Plant Production D: PSPm Provincial and Soe Performance monitoring D: PrS Policy research Support D: rr resource research D: SAAr Southern Africa and Africa relations D: Sc Sectoral colleges D: SD Smallholder DevelopmentD: Se Stakeholder engagement D: SeA Statistics and economic Analysis D: SeD Socio-economic Development D: SeT Sector education and Training D: SF Subsistence Farming D: SP Strategic Planning D: Sr Stakeholder relations D: SS Security Services D: SSF Small-scale Forestry D: SSF Small-scale Fisheries D: STGS Sector Transformation and Gender Services D: VPH Veterinary Public Health D: WIFm Woodlands and Indigenous Forest management D: WuID Water use and Irrigation Development

DAFF Strategic Plan 2011/12–2014/15
vii
Foreword by the Minister
We present the Strategic Plan for the Department of Agriculture, Forestry and Fisheries 2011/12 to 2014/15 for the medium Term expenditure Framework (mTeF) period, detailing targets for improved service delivery of departmental programmes for the next four financial years. We remain committed to the five top priority areas for this administration to address the social and economic challenges in our country, which are employment creation and sustainable liveli-hoods, education, health, crime prevention and rural development including food security and land reform.
rural development, growth and transformation of the agriculture, forestry and fisheries sector cannot take place in isolation—it is a process that needs to take place within the transformation and economic growth of the country as a whole. All these require growth in ways that will contribute towards:
• employment creation and increasing the number of participants in agriculture, forestry and fisheries through support for smallholders and processors
• reducing the cost of basic foodstuffs and the cost of living
• Improving the income and conditions of farm workers, foresters and fishers
• enhancing exports
• ensuring the sustainable use of natural resources.
In support of government’s New Growth Path, focus areas to be achieved by the Department of Agriculture, Forestry and Fisheries (DAFF) are large-scale employment creation, food security, support to initiate and drive competitiveness and the intensification of key actions to enhance sustainable development.
JOb CREATION
To promote job creation in the sector, the aim of the DAFF is to create 300 000 jobs in smallholder schemes by 2015 and 145 000 jobs in agro-processing by 2020, including industrial products, forestry smallholder schemes, wine and fruit exports and extension services. Furthermore, we seek to create an environment conducive to the upgrading of
Ms Tina Joemat-Pettersson
mINISTer oF AGrIcuLTure, ForeSTry AND FISHerIeS

DAFF Strategic Plan 2011/12–2014/15
viii
living and working conditions for the country’s 660 000 farm workers. our approach will be to link smallholder schemes to land reform, provide integrated support, address the current high input costs and support farm-worker organisations.
The agriculture value chain is regarded as one of the priority sectors for economic growth and employment creation. Through the Industrial Policy Action Plan 2 the implementation of agro-processing initiatives will contribute positively towards job creation. The DAFF will focus on manufacturing as a long-term growth strategy with clear sectoral plans, targets and key interventions to enhance agro-processing, from small-scale milling operations to value-adding to rooi-bos and honeybush tea for export markets.
In collaboration with the ministries of Labour, rural Development and Land reform as well as organised agriculture, we will continue to implement the vulnerable worker summit resolutions in 2011, looking at workers’ health, working conditions, tenure security, empowerment and training, and other matters affecting vulnerable workers.
FOOD SECURITY
Against the background of an increasing population, the gradual decrease of the world’s natural resources and the consequences of climate change, food security remains one of the major priority areas for the department. In December 2010, world food prices rose to a record high, increasing by 25% from the previous year because of a higher demand from china and russia’s worst drought in 50 years. There were also big increases in the cost of other basic foodstuffs globally in 2010, while in South Africa there was less pressure because our maize prices were lower than during the previous year, which also affected the price of dairy products and meat.
As a result of the heavy rains and floods at the beginning of 2011, some areas were declared national disaster areas in terms of the Disaster management Act, 2002 (Act No. 57 of 2002). As part of government’s disaster relief measures, assistance to the farming sector will include the provision of seed, seedlings, fertiliser as well as assistance for damage to agricultural infrastructure. mechanisms will also be developed to minimise the consequences of these disasters in future. crop production will be affected negatively and the country’s ability to produce sufficient, high-quality food at affordable prices will be a major challenge.
The maize surplus of 4 million tons, which resulted from good harvests in 2009/10, has threatened farmers’ ability to produce maize profitably. DAFF has been working with industry to explore and find solutions to dispose of the surplus through export markets. We also seek to find longer-term and more holistic solutions, such as more aggressive local and international market development, particularly for yellow maize, which is more in demand than white maize. In ad-dition, we have reopened the debate on the use of maize as input in the production of biofuel.
ACCESS TO FINANCE
The role of funding institutions such as the Land Bank cannot be overemphasised. Particular emphasis will be on mak-ing affordable loans available to small-scale and smallholder farmers.
up to now, government interventions included mechanisation and fencing support to enhance production in the agricul-tural sector. An amount of r232 million was also allocated in the 2010/11 financial year for the rescue package to assist farmers who are unable to pay back loans they obtained from the Land Bank. This intervention is linked to productivity and is yet another means to encourage primary activities in the sector.
MARkET ACCESS AND INTERNATIONAL TRADE
In 2011 we will continue extending engagements with countries on the African continent to improve access to markets and to promote trade opportunities. South Africa has now been invited to become a full member of the Brazil, russia, India and china (BrIc) group of powerful emerging economies, which will open up trade and investment opportunities for the country. Simultaneously, this will enhance sector transformation and economic growth in the country.
In terms of global trading, sanitary and phytosanitary controls and inspections will always be challenges, as will con-cerns regarding food safety, the need for traceability and good agricultural practices. effective measures have also been put in place at our ports of entry to prevent the import of illegal agricultural products and to ensure that animal and plant products brought into the country are disease free.
Through rural infrastructure development our strategy is to move agricultural cargo from road to rail. Various discus-sions and consultations between role-players have taken place at national and provincial government levels to revital-ise some railway branches. The DAFF has been part of the steering committee driven by the Department of Transport’s Transnet Freight rail in developing optimal transport solutions. For the sector, this will ultimately contribute towards reducing the costs of transport and create opportunities for marketing and export of products. Further investment in infrastructure will also be a key enabler in providing access to markets and moving products to markets rapidly.

DAFF Strategic Plan 2011/12–2014/15
ix
RESEARCH AND DEvELOPMENT
The focus on research and technology development in the agricultural field has become increasingly important to achieve higher production through new methodologies, better genes for both livestock and agriculture and improving the quality of indigenous food. By using the latest technology in our research, we aim to improve and increase house-hold food production and address high input and production costs to mitigate the high costs of the final product. research will enable us to plan for disasters such as droughts and floods, the possible effects of climate change, and diseases like rift Valley fever. more funds have been allocated for research to address key needs and priorities for the country.
To extend research in the sector even further, we will incorporate the forestry and fisheries components into the existing Agriculture research and Development (r&D) Strategy to have a more consolidated approach to research. The Department of Science and Technology will be a key partner in seeking ways to implement the DAFF r&D Strategy.
To address skills development in agriculture, forestry and fisheries, the department is also planning to upgrade all col-leges of agriculture to agricultural training institutes, starting with the North West Province. In addition, we intend to renew our focus on extension support as one of the enablers of the sector and consider ways of engaging the private and commercial sector. Through engagement with sector partners and commercial agriculture we will continue to en-sure greater benefits for the majority of our rural people.
GREEN ECONOMY
As a global role player, we are committed to climate change through our policy of the responsible use of natural re-sources. environmental management initiatives will include biofuels, solar and wind energy, manufacturing inputs and construction.
citizens are encouraged to plant trees and promote the greening of our country through the annual Arbor city Awards campaign. This greening initiative was the result of the million Trees Programme, started in 2007.
FORESTRY AND AFFORESTATION
As one of the potential growth sectors in South Africa, forestry contributes towards sustainable rural development and the management of our natural resources. Although South Africa’s plantation resources have decreased over the last 20 years, pressure on natural forests and woodlands has increased because of a demand for forest production. renewed growth, transformation and sustainability throughout the value chain are important focus areas for future growth of the sector. Development will include the manufacturing of high-quality furniture, in this way moving towards the high-end value chain with the focus on the design of niche products and markets, which could also contribute to employment creation.
Areas have been identified for afforestation projects in the eastern cape, Limpopo, mpumalanga and KwaZulu-Natal provinces to expand timber resources, minimise imports and optimise enterprise development, and would further con-tribute towards job creation.
INTEGRATED GROwTH AND DEvELOPMENT PLAN
We will focus on working together with the industry to implement the Integrated Growth and Development Plan (IGDP) for agriculture, forestry and fisheries, which is currently at the final drafting stage. The goals of the IGDP include attain-ing equity and transformation, equitable growth and competitiveness, environmental sustainability and good govern-ance.
Proposals were made in the IGDP to refine the Agricultural Black economic empowerment (AgriBee) charter to ad-dress transformation constraints in the sector. It further proposes to publish the AgriBee charter in terms of section 9 of the Broad-Based Black economic empowerment Act, 2003 (Act No. 53 of 2003), in order to pave the way for imple-mentation and enforcement. The Forestry charter, the most advanced of the three sectors, must be implemented. A charter for fisheries needs to be developed and is a priority for the department for 2011.
FISHERIES
expansion of the fisheries sector is limited by the natural productive capacity of our marine living resources and our capacity to manage and control harvesting successfully and in a sustainable way. Although the fisheries sector is con-sidered to be fully utilised and well-established, the aquaculture component is still underdeveloped and provides an opportunity for substantial increases in marine aquaculture production of high-value products such as abalone, oysters and mussels.

DAFF Strategic Plan 2011/12–2014/15
x
other future actions that have been identified to address challenges in the sector include rehabilitation programmes to rebuild depleted fish stocks, investing in the sustainable management and use of marine living resources, enforcement programmes to control harvesting, the allocation of additional fishing rights in certain fishing industries, and infrastruc-ture development and investment in the 12 fishing harbours. These measures can contribute to increased socio-eco-nomic and tourism opportunities, job creation, sustainable livelihoods and improving the environment.
CONCLUSION
In conclusion, I wish to extend my appreciation to my Deputy minister, Dr Pieter mulder, for his dedication, expertise and support. Secondly, I would like to express my gratitude to the chairpersons and members of the Portfolio and Select committees on Agriculture, Forestry and Fisheries in the National Assembly and the National council of Provinces for their guidance, knowledge and oversight. I would also like thank the agricultural industry, organised agri-culture and our agribusiness partners for their continued efforts to achieve economic prosperity of the sector. Lastly, I want to thank the department, provincial departments and state-owned entities for their commitment in meeting the objectives of the department. By working together, we can do even more to speed up job creation, economic growth and food security in our country!
Ms Tina Joemat-PetterssonMINISTER OF AGRICULTURE, FORESTRY AND FISHERIES

DAFF Strategic Plan 2011/12–2014/15
xi
Statement by the Deputy Minister
As we present the Strategic Plan for the Department of Agriculture, Forestry and Fisheries for the terms 2011/12 to 2014/15, we are conscious of the fact that the majority of South Africans disregard the important role of agriculture in South Africa. Providing sufficient food to the South African public remains one of the most important aims of this depart-ment and of the agricultural sector. conversely: If food security is threatened, it would lead to famine, which would then result in political instability, coupled with all its negative effects.
We as a department will continue to make South Africans aware of the important role that the agriculture, forestry and fisheries sector plays and could play in providing food security and safety, sustainable employment creation, economic growth and rural development.
The past decade has been one of continuous change, significantly altering the environment in which the agricultural sector operates. coming years will also be characterised by economic, demographic, technological, environmental and climate changes that will bring both opportunities and challenges to the agricultural sector. Therefore the sector’s suc-cess remains a key priority for the country in addressing all these issues.
In South Africa we deregulated and liberalised our agricultural marketing and trading arrangements 14 years ago. The agricultural sector has fortunately adjusted to high levels of competitiveness across most value chains and we are start-ing to address our poverty and food security problems. However, protectionist practices in some parts of the world put unfair pressure on our farmers to compete on an equal basis. Therefore, we will still continue at the WTo to argue for the successful conclusion of the Doha Development Agenda.
According to the 2008 Nobel memorial Prize winner in economics, Paul Krugman, countries engage in international trade for two basic reasons, each of which contributes to their gain from trade. First, countries trade because they are different from one another. Nations, like individuals, can benefit from their differences by reaching an arrangement in which each does the things it does relatively well. Second, countries trade to achieve economies of scale in production. That is, if each country produces only a limited range of goods, it can produce each of these goods at a larger scale and hence more efficiently than if it tried to produce everything. In the real world, patterns of international trade reflect the interaction of both these motives.
Dr Pieter Mulder
DePuTy mINISTer oF AGrIcuLTure, ForeSTry AND FISHerIeS
DAFF Strategic Plan 2011/12–2014/15
xii
our trading partners span across the globe and enjoy the best of South Africa’s agricultural, forestry and fisheries pro-duce. Two examples: South Africa is the most reliable source of quality mohair and produces 54% of total world produc-tion (mohair SA website). The South African ostrich production is one of the top twenty agro-based industries in the country and it ranks high for export with a total investment in ostrich activities (production and processing, excluding value-adding manufacturing and businesses, and tourism) exceeding r2,1 billion.
Today food security and food safety are worldwide being placed on the political agenda whenever the future is being discussed but how would 2050 look in terms of food security?
In 1950 the world population was 2,5 billion people; in 2000, only 50 years later, it was 6 billion and according to Von Braun (Lohmann Information, october 2010), the world population of 2050 is predicted to be more than 9 billion.
once we clearly understand the deliverables needed in 2050, we will be in a better position to come up with the right and effective solutions.
The world’s farmers will have to produce 2% more food every year—in total 50% more by 2030 and double production again by 2050. If we hope to keep pace with a growing population and increased nutritional demands, as millions of people in the developing world climb out of poverty and enter the global middle class, urbanisation therefore also in-creases.
In just 20 years, we will need to produce 50% more of what we produce today. However, we have only one planet to do it on. What complicates the problem is the fact that most of the best farmland on this planet is already being used but even this is being challenged as we see some 10 million ha of farmland lost annually to urbanisation and persistent drought.
Simultaneously, we face the challenges of a rapidly changing planet because of climate change. For example: Irrigation water supply reliability, and the ratio of water consumption to requirements, is expected to worsen in Sub-Saharan Africa as a result of climate change. Without climate change, calorie availability is expected to increase in Sub-Saharan Africa between 2010 and 2050. However, with climate change it is predicted that food availability in the region will aver-age 500 calories less per person in 2050, a 21% decline.
According to a report by the International Food Policy research Institute it is predicted that 25 million more children will be malnourished in 2050 because of the effects of climate change.
untimely droughts, floods and severe cold have already had a huge socio-economic impact on South Africa and espe-cially on agriculturalists and the rural community.
We are also aware of the fact that because of the increase in the global population and climate change, the prevalence of certain pestilences and diseases has increased.
The question that confronts all of us—on a global scale—is how we can increase agricultural production without vastly increasing the problems of air pollution, ecological disturbances, soil erosion, the pollution of streams and waterways, and destroying what is left of the world’s natural habitat. I believe that increasing food production sustainably is the central, overriding, and defining agricultural issue today.
We can change this zero-sum equation through technology, research and education.
Policies must be in place that are supportive of the efforts of farmers and other participants in the supply chain to ef-fectively manage natural resources to provide sustainably produced commodities.
We must further ensure that innovation, including transfer of technologies and research, is fostered in order to increase productivity and enhance efficiency.
rural development is important in the fight against poverty and in achieving food security. South African commercial farmers realise the importance of this development and offered their assistance. yet to expect of them to create more employment opportunities and in this way assist with rural development when they have no certainty about their own future, is unreasonable. Their uncertainties and problems have to be addressed. Anyone who talks about food security in South Africa and excludes commercial farmers is unrealistic.
I thank the Honourable minister, ms Tina Joemat-Pettersson for her leadership, enthusiasm and commitment, the de-partment led by the Director-General, mr Langa Zita and the industry for their cooperation. We do not have an option but to make agriculture, forestry and fisheries succeed.
Dr Pieter MulderDEPUTY MINISTER OF AGRICULTURE, FORESTRY AND FISHERIES

DAFF Strategic Plan 2011/12–2014/15
xiii
Director-General’s overview
Mr Langa Zita
DIrecTor-GeNerAL: AGrIcuLTure, ForeSTry AND FISHerIeS
I am pleased to submit the Strategic Plan for the Department of Agriculture, Forestry and Fisheries 20011/12 to 2014/15 to the minister of Agriculture, Forestry and Fisheries for approval and tabling in Parliament. This Strategic Plan com-plies with the guidelines provided by National Treasury and the Department of Public Service and Administration (DPSA).
A new macro structure, approved by the DPSA, will become effective from 1 April 2011. This followed a very compre-hensive and involved restructuring process to ensure maximum performance on the deliverables in terms of the medium Term Strategic Framework (mTSF) priorities to address government’s broad national challenges. Twelve key outcomes were identified for government to be implemented through intergovernmental cooperation over the next four to five years. To address broad national challenges, government clusters identified and developed key policies, including the NGP, the Industrial Policy Action Plan (IPAP), the comprehensive rural Development Programme (crDP) and the envisaged IGDP for agriculture, forestry and fisheries. The DAFF will contribute directly into three of the 12 outcomes to achieve related outputs over the mTeF period. The President and ministers have also signed performance agree-ments that will ensure proper monitoring and evaluation of the implementation of set outcomes and targets. Job crea-tion targets have also been set for each sector.
The sector lost 10 000 jobs between the first and third quarters of 2010. With the implementation of policy initiatives such as IPAP, NGP, crDP, the DAFF’s IGDP and plans to elevate agriculture as a priority sector under the NGP, the unemployment trends of 2010 could be reversed. We will strive towards improving service delivery in the sector and meeting the objectives of job creation.
Briefly, the Strategic Plan will guide the DAFF to achieve government’s priorities in the following manner:
(i) Consolidation of agrarian reform programmes to ensure food security through skills development, inputs, implements, extension and technical support to agrarian reform beneficiaries to ensure their viability and sustain-ability. This will be achieved by ensuring the implementation of programmes to support the transition of agrarian reform beneficiaries from subsistence to smallholder farmers. Livestock production schemes will be implemented in a coordinated manner to enhance the value of livestock currently owned by subsistence and smallholders. This comes from the acknowledgement that agrarian reform beneficiaries are currently not receiving enough support

DAFF Strategic Plan 2011/12–2014/15
xiv
for production and access to markets. The DAFF, working closely with other government departments, state-owned entities (Soes) and the private sector, will implement production and agro-processing support measures for commodities that are in demand domestically or internationally for food security and job creation.
(ii) Development of new funding options/models. The process to finalise a new funding model that will consolidate the current comprehensive Agricultural Support Programme (cASP), micro-agricultural Financial Institutions of South Africa (mafisa), etc. into one stop shop models for subsistence and smallholder farmers, will be accelerated and concluded to ensure access to affordable capital/funding for rural entrepreneurs in the agriculture, forestry and fisheries subsectors. Innovative programmes will also be implemented with our domestic and international development funders to ensure that rural sectoral entrepreneurs have access to cheaper funds to cater for their short, medium and long-term production financial needs and facilitate the long-term investments that are essential to ensure sustainability and viability. This will contribute to ensuring food security, the creation of decent jobs and sustainable livelihoods.
(iii) Sustainable use of natural resources, including the management of natural forests and comprehensive decen-tralised watershed management; and mitigation against climate change, pollution of the marine environment and of publicly-owned agricultural natural resources including soil and water, are prioritised. Afforestation will be accel-erated as forests continue to play a critical role in our economy and are central in government’s beneficiation strategy. The recovery of wild stock of marine products such as hake, West coast rock lobster and abalone has also been prioritised through enhanced policing and regulation of access. rivers have also been identified as de-velopment nodes and in addition to this water harvesting through the creation of water reservoirs, rehabilitation of irrigation schemes, windmills and soil dams has been prioritised as critical to the successful development of small-holder farmers and create decent green jobs to ensure food security and sustainable livelihoods in rural areas.
(iv) Strengthening of human resource development programmes to address the weaknesses in support of pro-grammes for agrarian reform beneficiaries has also been prioritised. The implementation of scarce skills develop-ment programmes will be accelerated with domestic and international partners in the next three to five years with the establishment of Sectoral Institutes of excellence/Academies to focus on pre and post-settlement training. colleges of agriculture are prioritised for this purpose to create the required capacity in youth to efficiently and effectively implement the youth development agenda of government and contribute to create future farmers who will guarantee the country’s household food security and create decent jobs and sustainable livelihoods in rural areas.
(v) Facilitating the development and implementation of employment generation programmes through a pro-duction and commodity directed strategy for each district municipality and the implementation of the Zero Hunger campaign and state procurement system to guarantee markets for smallholders and ensure access to cheaper food for those who are the most vulnerable in our society. Aquaculture development will also be accelerated in rural areas to create much-needed economic opportunities. This will be achieved through cooperation between all stakeholders and other government agencies by developing a conducive environment for smallholders to create decent jobs.
(vi) Intensifying a cooperative development programme to establish viable and sustainable rural enterprises that are capable to engage in several economic activities such as disbursement of credit, distribution of agricultural inputs like seeds, fertilisers, agro-chemicals and in arranging storage, processing and marketing. This will contribute to the change in the rural economic landscape as members will be economically empowered to engage in produc-tion and processing with all the necessary support and generate decent jobs for sustainable livelihoods. De vel op-ment and private funders and other government agencies will partner in the achievement of the above objectives.
(viii) Expanding exports through enhanced inter-Africa trade and an overall increase in productivity of the sectors ac-companied by high yields and surpluses in regard to domestic demand. An export expansion programme will be implemented in cooperation with the Department of Trade and Industry by providing technical and political support to negotiate market access protocols and promote products in the targeted regional and international markets. A high-level advisory committee will be established to coordinate and ensure oversight on certification for import and export to safeguard the country’s health and economic interests. Decent work and sustainable livelihoods will be generated through this programme as demand exceeds supply and more land is brought into production.
(ix) Designing and implementing an intensive scarce skills development programme for the sectors with domes-tic and international partners to cater for short, medium and long-term needs to consolidate the basis for creating

DAFF Strategic Plan 2011/12–2014/15
xv
efficient and effective service delivery skills/capacity in research and development, rural enterprise and coop-erative development, commodity-directed extension and technical support services. Work has already started in this area and it will be expanded. This will create the much-needed capacity in the long term by increasing produc-tivity to ensure a sustainable and viable sector and increasing the contribution to the national gross domestic product.
(x) Streamlining inputs and implementing support programmes to ensure access and affordability for the new entrants into the sector. This will be achieved by working very closely with provinces and Soes by implementing mechanisation, fencing and production input support through a coordinated procurement strategy for smallholders and cooperatives. This will contribute to the attainment of food security, land reform objectives, decent work and sustainable livelihoods in rural areas.
(xi) Implementation of agro-ecological agriculture will be promoted as a way to ensure that food is produced in a sustainable way and the environment benefits positively throughout the productive cycle. High-value products and energy are key elements of agro-ecological production. An agro-ecological strategy will be finalised and pilots implemented during the year.
We realise that we are facing many challenges for the next four years. In order to create employment, we will put greater focus on the implementation of the programme initiatives indicated above. We are currently developing spatial plans, which will provide details as to where each and every initiative stated above will be taking place.
The Strategic Plan I present is structured in three parts. Part A provides a strategic overview of the department, including its vision, mission, values, strategic goals and objectives as well as the legislative and policy mandates. Part B focuses on deliverables for the mTeF cycle and provides an overview, a problem statement, implementation strategy and planned expenditure for six budgetary programmes for 2011/12 to 2013/14, as allocated by National Treasury. Part C contains information on the public entities, i.e. the Agricultural research council, the marine Living resources Fund, the National Agricultural marketing council, Ncera Farms, onderstepoort Biological Products and the Perishable Prod-ucts export control Board.
Lastly, the Annual Performance Plan of the six departmental programmes is reflected in Annexure 1. These contain outputs, output indicators and targets, presented in relation to the strategic goals and objectives. Annexure 2 contains the department’s Service Delivery Improvement Plan, with the focus on the improvement of service delivery standards.
I wish to extend my gratitude to the minister, the Deputy minister and the chairpersons of the Parliamentary committees for their political support. Secondly, I would like to thank the leadership and staff of all the agricultural state-owned entities, the agribusiness community and farmers’ organisations for their contribution. Finally, to my management team and all the staff members in the department, I appreciate all their efforts and hard work involved in contributing to the development of this Strategic Plan. Together, we will succeed in realising our vision of a leading, dynamic, united, prosperous and people-centred sector!
Mr Langa Zita
DIRECTOR-GENERAL: AGRICULTURE, FORESTRY AND FISHERIES


PART A
Strategic overview

DAFF Strategic Plan 2011/12–2014/15
2
Mission statement
VISION
A leading, dynamic, united, prosperous and people-centred sector
MISSION
Our vision will be achieved through developing and sustaining a sector that contributes to and embraces:
• Economic growth (and development)• Job creation• Rural development• Sustainable use of natural resources• Food security
VALUES
Drive Driven to deliver excellent serviceAttitude Being an ambitious, passionate, reliable and dedicated workforce Fairness Acting with objectivity, empathy, integrity and transparency Focus Focussing on people, economic and rural development
Legislative and other mandates The legal mandate of the Department of Agriculture, Forestry and Fisheries (DAFF) covers agriculture, forestry and fisheries value chains—from inputs, production and value adding to retailing.
LEGISLATIVE MANDATE
The entire legislative mandate of the DAFF is derived from section 27(1) (b) of the Constitution. The department is primarily responsible for Acts related to agriculture, forestry and fisheries. The following Acts reflect the legislative mandate of the department:
Performing Animals Protection Act, 1935 (Act No. 24 of 1935)Fertilizers, Farm Feeds, Agricultural Remedies and Stock Remedies Act, 1947 (Act No. 36 of 1947)Animal Protection Act, 1962 (Act No. 71 of 1962)Fencing Act, 1963 (Act No. 31 of 1963)Subdivision of Agricultural Land Act, 1970 (Act No. 70 of 1970)Plant Breeders’ Rights Act, 1976 (Act No. 15 of 1976)Plant Improvement Act, 1976 (Act No. 53 of 1976)Veterinary and Para-veterinary Professions Act, 1982 (Act No. 19 of 1982)Perishable Products Export Control Act, 1983 (Act No. 9 of 1983)Agricultural Pests Act, 1983 (Act No. 36 of 1983)Conservation of Agricultural Resources Act, 1983 (Act No. 43 of 1983)Sea Fisheries Act, 1988 (Act No. 12 of 1988)Animal Improvement Act, 1988 (Act No. 62 of 1988)Liquor Products Act, 1989 (Act No. 60 of 1989)Agricultural Research Act, 1990 (Act No. 86 of 1990)Animal Diseases Act, 1984 (Act No. 35 of 1984)Agricultural Product Standards Act, 1990 (Act No. 119 of 1990)Agricultural Produce Agents Act, 1992 (Act No. 12 of 1992)Groot Constantia Trust Act, 1993 (Act No. 58 of 1993)Societies for the Prevention of Cruelty to Animals Act, 1993 (Act No. 169 of 1993)Marketing of Agricultural Products Act, 1996 (Act No. 47 of 1996)Agriculture Laws Extension Act, 1996 (Act No 87 of 1996)Genetically Modified Organisms Act, 1997 (Act No. 15 of 1997)Marine Living Resources Act, 1998 (Act No. 18 of 1998)

PART A: Strategic overview
3
Agricultural Laws Rationalisation Act, 1998 (Act No. 72 of 1998)National Forests Act, 1998 (Act No. 84 of 1998)National Veld and Forest Fire Act, 1998 (Act No. 101 of 1998)Onderstepoort Biological Products Incorporation Act, 1999 (Act No. 19 of 1999)Meat Safety Act, 2000 (Act No. 40 of 2000)Animal Identification Act, 2002 (Act No. 6 of 2002)Animal Health Act, 2002 (Act No. 7 of 2002)KwaZulu Cane Growers’ Association Act Repeal Act, 2002 (Act No. 24 of 2002)
POLICY MANDATES
Key policy developments
The government’s current Medium Term Strategic Framework (MTSF) has highlighted a number of priorities to address broad national challenges. The MTSF has been consolidated into a set of 12 key outcomes which will be implemented through intergovernmental cooperation over the next four to five years. To implement these outcomes, government clusters came up with key policies which include the New Growth Path (NGP), the Industrial Policy Action Plan (IPAP), the Comprehensive Rural Development Programme (CRDP) and the envisaged Integrated Growth and Development Plan (IGDP) for agriculture, forestry and fisheries. In terms of the outcomes, the DAFF contributes directly to three of the 12 outcomes, and indirectly to another three. The key outcomes which the department contributes to directly are:
Outcome 4: Decent employment through inclusive economic growth
Outcome 7: Vibrant, equitable and sustainable rural communities contributing towards food security for all
Outcome 10: Protect and enhance our environmental assets and natural resources
The department will contribute towards the achievement of these outcomes and related outputs over the Medium Term Expenditure Famework (MTEF) period by:
• Increasing the number of smallholder farmers by 2014 through an initial assessment programme, presettlement, practical training and post-settlement support through extension services.
• Establishing a joint-venture funding model together with smallholders. The new funding model will structure incen-tives to encourage the establishment of private sectoral micro-financing outlets in targeted rural areas through coop-eratives or established financial institutions to ensure favourable lending terms.
• Creating a relevant, effective and efficient extension and technical support capacity for the development of agricul-ture and aquaculture production infrastructure in target areas (one scheme per district municipality by 2014). Basic infrastructure will be installed such as rehabilitation of existing irrigation schemes, and fencing on commercial land to encourage optimal utilisation of land.
• Accelerating the implementation of the National Extension Recovery Plan by recruiting extension and technical ad-visory services officers. The DAFF will review and develop appropriate policies in respect of recruitment, training and development.
• Implementing the Market Identification Strategy to ensure that products produced by smallholder farmers have a market domestically and to integrate viable smallholders with established commercial producers’ export networks.
• Establishing production schemes for smallholder farmers such as crop, forestry, fisheries and livestock schemes by 2015. The DAFF will provide the required capacity to assist provinces to accelerate the establishment of viable and sustainable cooperatives by training potential members of cooperatives in various skills that will assist in under-standing the operations of cooperatives.
• Developing the Agro-processing Strategy by June 2011 and creating the capacity to implement the strategy through provincial and local role players to encourage the one-product-one-district-approach to ensure competitiveness and economies of scale. Five Memorandums of Understanding (MoUs) have been signed for capacity-building pro-grammes in research and development on the establishment of rural agro-processing enterprises for one-product-one-district-schemes. The aim is to provide jobs in agro-processing by 2020. An aquaculture demonstration centre will be established at Gariep Dam for production and processing of aquaculture products.
The other four outcomes to which the department contributes indirectly and/or supports are:
Outcome 2: A long and healthy life for South Africans
Outcome 5: A skilled and capable workforce to support an inclusive growth path
Outcome 8: Sustainable human settlements and improved quality of life for households
Outcome 11: Create a better South Africa, a better Africa and a better world.

DAFF Strategic Plan 2011/12–2014/15
4
PLANNED POLICY INITIATIVES
Employment creation
The DAFF’s policy objective is to create employment in the sector through performance and delivery agreements, IPAP 2, the NGP and the draft IGDP for the sector.
The policy initiatives below will support the DAFF in the drive towards employment creation.
Access to finance
The DAFF will implement the new One Stop Shop Funding Model away from the grant system.
Access to training and development
Beneficiaries will access training through further education and training (FET) or private service providers such as train-ing companies, organised agriculture (Agri SA, National African Farmers’ Union of South Africa [NAFU] and TAU SA) or individual commercial farmers with accreditation.
Access to production infrastructure
The department plans to develop agriculture and aquacultural production infrastructure in targeted areas to ensure ac-cess to basic integrated services through spatial planning.
Access to markets
In collaboration with the National Agriculture Marketing Council (NAMC) the department will implement the Market Identification Strategy to ensure that products produced by smallholders have a market domestically and internation-ally.
Every municipality must have a fresh produce market to implement a zero hunger campaign. State markets will sell a basic food basket supplied by smallholder farmers and the access will be negotiated with leading food stores.
Extension and technical support services
Accelerate the implementation of the National Extension Recovery Plan to address the culture and skills shortages in provincial extension services. This will improve the visibility and improvement of extension and advisory services.
Spatial plans
Rivers will serve as development nodes. Alongside the rivers to the Atlantic Ocean and to the Indian Ocean we plan to have a massive programme of water harvesting. The rivers will also focus on a number of key commodities, which will also be accompanied by relevant agro-processing plants. Every municipality will have one or two primary commodities that it will specialise in with a value addition plant for processing.
Access to tractors/Mechanisation Programme
The department will roll out the Mechanisation Programme to all the provinces. Every municipality will have farmers who own tractors which will be sold at a subsidised price and owners organised at a secondary co-op level. Other farm-ers could hire those tractors at a nominal lending rate regulated by the state. Money for the hiring of tractors can be part of the loan from Land Bank.
Commodity groups
Farmers will be organised as commodity groups, where they can become members of one or two commodity groups. These commodity groups can evolve into secondary cooperatives and could negotiate better markets for their produce and secure seeds, medicines and vaccines at cheaper rates if they use their collective power to buy them. It will be easier to give targeted technical support and capacity building to groups of farmers than to individuals.
Agro-ecological fund
The department wants to promote a new kind of agriculture called agro-ecological agriculture where you use waste from animals and plants as food for each other. For instance, waste from birds can be food for fish and waste from fish can be used as fertiliser. Animal and human waste can be used to produce methane energy that can be used for lights and as electricity. We plan to have a training centre for this and a fund to promote it.

PART A: Strategic overview
5
Fencing
Working with the Department of Public Works (DPW) and the Department of Rural Development and Land Reform (DRDLR), we plan to roll out a fencing programme in the former homelands and other areas where there is a need. The focus will mainly be on areas under cultivation. Livestock will be fenced in the medium to long term.
Irrigation schemes and windmills
The identified irrigation schemes in the former homelands will be rehabilitated to focus on a few commodities for pur-poses of value addition. Agro-processing plants will be built next to each irrigation scheme. Where ecological conditions permit, the DAFF plans to rehabilitate existing windmills and/or build new ones together with the DPW and DRDLR. These will be closer to promising agricultural areas.
Dams
Working with the DPW and the DRDLR, we will create dams next to areas of potential cultivation, and to a limited ex-tent, grazing areas.
Place 300 000 households in smallholder schemes by 2015
The DAFF will collaborate with the provincial government counterparts and communities to ensure economic value and productivity of livestock by households in rural areas. Small livestock schemes (goats and sheep), will be established, and subschemes such as crop, forestry, fisheries and livestock schemes for smallholder farmers.
Situational analysis
PERFORMANCE ENVIRONMENT—SECTOR PERFORMANCE
Economic setting
Although the macroeconomic environment has experienced dramatic changes in recent years, 2010 was a much better year than 2009 and these trends should continue in 2011. Fears about a double-dip recession in the USA did not ma-terialise, and quantitative easing (sustained governmental financial support), an experiment to support the USA econ-omy, will be positive for the global economy if it is successful, but it entails risks. The question also remains whether the momentum of the Chinese economy, which to a great degree sustained the world economy, can be maintained. However, one of the biggest potential risks is what will happen in the Euro region regarding sovereign debt.
Strong economic growth is taking place in countries such as China, India, South Korea, Indonesia and Malaysia. It is expected that China’s growth of about 10% in 2010 will drop slightly to 9% in 2011 and India could even improve on its 8% growth rate in 2010. The world economy grew by an estimated 3,7% in 2010, as opposed to negative growth in 2009, but this is expected to drop to about 3% in 2011. The strong economic growth in the Far East is important to South Africa, which exports raw materials such as iron ore and coal to China. Locally, South Africa’s economic growth (gross domestic product [GDP]) could increase from 2,8% in 2010 to 3,8% in 2011. However, to address poverty and unemployment, it is estimated that the local economy must grow by at least 6% annually.
Despite relatively tough economic circumstances in South Africa in 2010, average wage and salary increases of 8% were achieved. At the same time the expected inflation rate for 2010 was 4,5%. This has put many employed people in a better position than a year ago, but there was an increase in unemployment (in the third quarter of 2010) to 25,3%. Since the second quarter of 2010, about 275 000 jobs were lost and consumers still have high debt levels compared with disposable income. Sharp increases in the cost of electricity, fuel prices and property taxes are expected to ag-gravate inflation during 2011. The prime lending rate of 9% is expected to remain unchanged for the best part of 2011. The downward movement of interest rates (6,5 percentage points from 15,5% at the end of 2008) has brought relief for those in debt and they should continue to benefit in 2011.
In total, the agriculture, forestry and fisheries sector lost 10 000 jobs between the first and third quarters of 2010. This can be seen in the context of a continuation of long-term declining trends in employment within primary economic sec-tors. However, the agricultural value chain is one of the priority sectors of the current programme of government in terms of economic growth and employment creation. With the implementation of agro-processing initiatives proposed under the IPAP, as well as plans to promote agriculture as one of the priority sectors under the NGP, there is potential for the declining employment trends to be reversed over the medium to long term.

DAFF Strategic Plan 2011/12–2014/15
6
According to the United Nations (UN), world food prices rose to a record in December 2010, exceeding levels reached in 2008. Food and Agriculture Organization (FAO) figures show that the cost of food increased by 25% from a year earlier, after Chinese demand strengthened and Russia’s worst drought in a half-century devastated grain crops. The December 2010 year-on-year increase compares with the 43% increase in food costs in June 2008. Record fuel prices, weather-related crop problems, increasing demand from the growing Indian and Chinese middle classes, and the de-mand to grow maize for ethanol fuel all contributed to that crisis. In the previous episode the main driver in food com-modities was cereals. This time it is sugar and oil seeds. While the US maize prices rose by 44% in 2010 and there were big international increases in the cost of other basic foodstuffs, there is less pressure in South Africa because local maize prices are lower than a year ago, which also affects the price of dairy products and meat. However, flooding will contribute to local food prices increasing in 2011.
Agricultural sector
Production
The estimated volume of agricultural production in 2009/10 was 4,8% higher than in 2008/09. The volume of field-crop production reflected a 3,1% increase because of an improvement in the production of summer grains. Maize production increased by 1,4 million tons or 10,8% against the previous season, followed by sugar cane with 468 000 tons or 2,5% and lucerne hay with 374 000 tons or 33,9%. Horticultural production decreased by 1,6%, mainly because of a drop in the production of citrus and subtropical fruit. The production of oranges decreased by 5,5% and that of potatoes by 3,6%. Animal production increased by 8,8% because of increases of 41,1% in fresh milk production and 5,6% in stock slaughtered. However, pastoral products (wool, mohair, karakul pelts and ostrich feathers) showed a decrease of 3,1% in production.
140
130
120
110
100
90
80
70
2005
= 1
00
Year
Volume index of agricultural production2005/06–2009/10 (July to June)
Field crops Horticulture Animal production
2005/06 2006/07 2007/08 2008/09 2009/10
Factors such as weather conditions, commodity prices, input costs, stock levels, consumption demand and exchange rates will influence agricultural production in the country like never before. The total area under field crops is expected to decline by more than 200 000 ha in 2011 on the back of deteriorating profit margins and increasing pressure on the cash flow positions of many farmers because of the low producer prices of 2010. A relative switch in summer crops is expected for 2011 with maize plantings declining by 20% and sunflower and soya bean plantings increasing by 55% and 10%, respectively. Slightly more sorghum will also be planted because of favourable prices relative to maize. Although the area planted to wheat declined by 13% in 2010, the anticipated decline in maize plantings in the summer rainfall area during 2011 will provide more fallow land for wheat plantings in 2011. The total area under field crops is expected to recover partially in 2012 and then remain relatively stagnant over the short term, as the increases in com-modity prices will not be enough to provide sufficient incentives for the area planted to expand. However, within the total area relative switches between the various field crops are expected with yellow maize and soya bean plantings increasing at the expense of white maize and sunflowers. These relative shifts are driven by long-term demand patterns and the level of parity prices.
Producer prices of agricultural products
Producer prices of agricultural products decreased on average by 2,2% from 2008/09 to 2009/10.
The weighted average price of field crops decreased by 14,4%. The prices of winter grain, summer grain, cotton, oilseeds and dry beans dropped by 26,4%, 23,1%, 17,8%, 17,7% and 7,0%, respectively, while prices for tobacco, sugar cane and hay rose by 16,9%, 15,8% and 0,6%, respectively.

PART A: Strategic overview
7
Producer prices of horticultural products rose by 7,0% from 2008/09. Prices of vegetables and fruit increased by 12,9% and 3,5% , respectively, while prices of viticultural products decreased by 0,8%.
Prices of animal products rose by 1,9%. The average price of pastoral products, dairy products and poultry increased by 22,1%, 4,1% and 1,2%, respectively, while the average price of slaughtered stock decreased by 0,1%.
For many food products, growth in demand exceeds growth in supply over the medium to long term. This trend is largely driven by the relatively slow increase in commodity prices compared to the increasing costs of production, which dampens the growth of real net farming income, causing producers to be more risk-hesitant and taking some of the marginal land out of production. Apart from increases in typical production costs like seed, fertilisers and fuel, expens-es related to electricity and labour will also increase rapidly over the next few years. For example, electricity’s share of the total production costs of maize under irrigation is projected to increase from 8% in 2009 to 20% by 2015.
It is difficult to determine the long-term impact of the economic crisis on the agricultural sector. The impact of the crisis on production and processing capacity will be one of the decisive factors for the movement of prices over the next few years. Apart from lower commodity prices, production capacity could be harmed by the availability of credit, much stricter regulation and extreme market volatility. In addition, the fundamental demand for agriculture commodities has not decreased significantly.
Gross value of agricultural production
The total gross value of agricultural production (total production during the production season, valued at the average basic prices received by producers) for 2009/10, is estimated at R126 433 million, compared to R127 568 million the previous year—a decrease of 0,9%. This drop can be attributed mainly to a decrease in the value of field crops.
230
210
190
170
150
130
110
90
2005
= 1
00
Year
Producer price indices2005/06–2009/10 (July to June)
Field crops Horticulture Animal products
2005/06 2006/07 2007/08 2008/09 2009/10
R’m
illio
n
Year
Gross value of agricultural production2005/06–2009/10 (July to June)
2005/06 2006/07 2007/08 2008/09 2009/10
70 000
60 000
50 000
40 000
30 000
20 000
10 000
0
Field crops Horticulture Animal production
The gross value of animal products, horticultural products and field crops contributed respectively 51,3%, 25,7% and 23,0% to the total gross value of agricultural production. The poultry meat industry made the largest contribution with 18,2%, followed by cattle and calves slaughtered with 11,2% and maize with 10,9%.

DAFF Strategic Plan 2011/12–2014/15
8
Farm sector income
The gross income of producers (the value of sales and production for other uses, plus the value of changes in invento-ries) for the year ended 30 June 2010 amounted to R128 848 million compared to R129 621 million the previous year—a decrease of 0,6%. The drop in income can be ascribed mainly to lower prices that farmers received for grains and oilseeds.
R’m
illio
n
Year
Gross farm sector income (GFI)2005/06–2009/10 (July to June)
2005/06 2006/07 2007/08 2008/09 2009/10
70 000
60 000
50 000
40 000
30 000
20 000
10 000
0
Field crops Horticulture Animal production
The gross income from field crops decreased by 13,8% to R31 214 million for the year ended 30 June 2010. Income from maize at R15 998 million was R3 135 million (16,4%) less than in the previous year. Income from sunflower seed and soya beans also showed substantial decreases of 27,2% to R1 705 million and 17,0% to R1 380 million, respec-tively. Income from sugar cane at R5 108 million was R549 million (12%) higher than that of the previous year. Income from groundnuts increased by 5,3% to R790 million.
The gross income from horticultural products increased by 3,3% to R32 778 million compared to R31 739 million for 2008/09. Income from citrus and subtropical fruit decreased by 1,3% and 1,8% and amounted to R4 719 million and R2 063 million, respectively. Income from deciduous fruit rose by 2,1% to R8 659 million, while income from viticulture dropped by 0,4% to R3 530 million. However, income from vegetable production increased by 7,6% to R11 690 million.
The gross income from animal products was 5,1% higher than in 2008/09 and amounted to R64 855 million compared to R61 680 million for the previous year. Producers earned R14 099 million from slaughtered cattle and calves com-pared to the previous R13 200 million—an increase of 6,8%. Income from poultry meat production rose by 2,8% to R23 073 million. Income from egg production at R6 827 million was 3,5% higher than in the previous year. Producers earned R9 491 million from milk production, which is 4,5% higher than in the previous year. Income from wool in-creased by 27,2% to R1 378 million.
Gross income from major products2009/10 compared to 2008/09 (July to June)
R’million
2008/09 2009/10
Poultry meat (+2,8%)
Red meat (+6,6%)
Maize (–16,4%)
Fruit (+0,5%)
Vegetables (+7,6%)
Milk (+4,5%)
Sugar cane (+12,0%)
0 3 000 6 000 9 000 12 000 15 000 18 000 21 000 24 000
The net farm income (after the deduction of all production expenditure, excluding expenditure on fixed assets and capital goods) amounted to R37 593 million for the year ended 30 June 2010, which is 12,6% lower than in the previous year. Payments for salaries and wages, which represented 12,7% of the total farming costs, amounted to R12 027 million.

PART A: Strategic overview
9
Interest paid by farmers to banks and other financiers during the year to 30 June 2010 is estimated at R5 094 million (5,4%) of the total farming cost.
Year
Net farm sector income (NFI)2005/06–2009/10 (July to June)
2005/06 2006/07 2007/08 2008/09 2009/10
R’m
illio
n
50 000
40 000
30 000
20 000
10 000
0
40
35
30
25
20
15
Per
cent
age
NFI (left axis) NFI as % of GFI (right axis)
Cash flow of farmers
The cash flow of farmers amounted to R38 487 million for the year ended 30 June 2010 compared to the previous R44 258 million—a decrease of 13,0%. This was the result of a drop in the gross income of producers.
Although agriculture has shown resilience to the economic downturn, producer prices and net farming income have declined since 2009. Depressed commodity prices and increased input costs have closed profit margins for many in-dustries and real net farming income is projected to recover by an average of 2,8% from 2011.
Year
Cash flow of farmers2005/06–2009/10 (July to June)
2005/06 2006/07 2007/08 2008/09 2009/10
R’m
illio
n
50 000
40 000
30 000
20 000
10 000
0
40
35
30
25
20
15
Per
cent
age
Cash flow (left axis) Cash flow as % of GFI (right axis)
Production costs
Intermediate expenditure refers to the value of goods and services that were purchased for consumption as inputs dur-ing the production process. Expenditure on intermediate goods and services during 2009/10 is estimated at R71 955 mil-lion, which represents a rise of 6,4% from R67 647 million in 2008/09. Large increases occurred in expenditure on seed and plants (21,3%), dips and sprays (20,1%), packing material (19,0%) and maintenance and repairs of machinery and implements (16,2%). Expenditure on farm feeds remained the biggest expenditure item, accounting for 22,9% of the total expenditure, followed by 16,1% for fuel, 12% for farm services and 10% for maintenance and repairs of machinery and implements.
R’m
illio
n
Year
Expenditure on intermediate goods and services2005/06–2009/10 (July to June)
2005/06 2006/07 2007/08 2008/09 2009/10
18 000
15 000
12 000
9 000
6 000
3 000
0
Farm feeds Fuel Farm services

DAFF Strategic Plan 2011/12–2014/15
10
Prices of farming requisites rose by 6,8% in 2009/10 compared to an increase of 23,2% the previous year. The price index of machinery and implements showed an increase of 16,0% for 2009/10. The price index of materials for fixed improvements increased by 3% and the combined index of prices of intermediate production inputs and services by 6,0%. The increase of 20,6% in the price of seed made the most significant contribution to the increase in the prices of intermediate goods and services. The prices of farm feeds, packing materials, dips and sprays and maintenance and repairs rose by 17,8%, 16,2%, 14,4% and 14,3%, respectively.
Investment
The value of capital assets in agriculture as at 30 June 2010 was estimated at R223 434 million compared to R206 582 million at the end of June 2009—an increase of 8,2%. Land and fixed improvements constituted R129 849 mil-lion, machinery and implements R41 361 million and livestock R52 225 million of the total value of capital assets. The gross investment in respect of fixed improvements for the year ended 30 June 2010 increased by 1% to R3 972 million. In the case of machinery, implements and vehicles, investment decreased by 20,1% and amounted to R6 501 million. The livestock inventory rose by R38,6 million from the previous year.
R’m
illio
n
Year
Investment in agriculture2005/06–2009/10 (July to June)
2005/06 2006/07 2007/08 2008/09 2009/10
9 000
7 000
5 000
3 000
1 000
–1 000
Fixed improvements Machinery and implements Change in livestock inventory
Farming sector debt
The total farming debt as at the end of June 2010 was estimated at R54 346 million (compared to R46 792 million in June 2009)—an increase of 16,1%.
Year
Agricultural debt2005/06–2009/10 (July to June)
2005/06 2006/07 2007/08 2008/09 2009/10
R’m
illio
n
60 000
50 000
40 000
30 000
20 000
10 000
0
26
25
24
23
22
Per
cent
age
Debt (left axis) Debt as % of assets (right axis)
Consumer prices
The consumer price index (CPI) (with base year 2005 = 100) of all items increased by 5,7%, from 130,1 to 137,5 during the year ended 30 June 2010 as the CPI of food increased by 2,8%, from 147,3 to 151,4 and that of non-food items increased by 2,1%, from 124,6 to 127,3. Meat prices rose by 1,9% from an index figure of 145,2 to 147,9 while the prices of grain products decreased by 2,1% from 166,9 to 163,4. The CPI of vegetables increased by 6,2% (from 145,8 to 154,9) and the CPI of fruit increased by 8,8% (from 130,0 to 141,4). Dairy products and egg prices rose by 6,5 % from an index of 148,6 to 158,2 while an increase of 8,4% was recorded for sugar and related products from 132,4 to 143,5.
Although agriculture will face ongoing adjustments over the short term, specific fundamental long-term trends that are linked to a growing economy are expected to strengthen. These trends will have a significant impact on income-sensi-

PART A: Strategic overview
11
tive products like meat, dairy, wine and fruits, as well as on the consumption of staples like maize meal, bread and potatoes. Products that feature attributes associated with prominent consumer food trends like health, indulgence and convenience are likely to experience the fastest growth in demand. Over the next decade a relative shift in staple food away from maize to bread, pastas, potatoes and rice will occur with the demand for potatoes and wheat-based products growing by more than 20%, while a decline of 5% is expected in the consumption of maize meal. The total demand for meat is expected to grow by 25%, with a 45% increase in the demand for chicken meat leading the way. The demand for fresh milk and dairy products is also expected to increase by 13% to reach 2,8 million tons over the medium term.
Consumption expenditure on food
The consumption expenditure on food for the year ended 30 June 2010 increased slightly by 2,3% and amounted to R338 875 million as against the R331 300 million of the previous year. Expenditure increased by 4,7% to R106 887 mil-lion for meat, by 15,6% to R5 062 million for sugar, by 6,5% to R48 414 million for fruit and vegetables (including pota-toes) and by 5,2% to R38 698 million for milk, milk products and eggs. Expenditure decreased by 3,6% to R92 615 mil-lion for bread and grain products and by 3,2% to R7 210 million for oils and fats. Meat represented 32% of the expenditure on the food component, while bread and grains represented 27%, milk, milk products and eggs 11%, fruit and vegetables (including potatoes) 14% and oils and fats only 2%.
R’m
illio
n
Private consumption expenditure on major food items2005/06–2009/10 (July to June)
2005/06 2006/07 2007/08 2008/09 2009/10
120 000
100 000
80 000
60 000
40 000
20 000
0
Year
Meat Bread and grains Vegetables and food
Milk, milk products and eggs Oils and fats
Imports and exports of agricultural products
The estimated value of imports for 2009/10 came to R33 946 million—a decrease of 11,6% compared to R38 401 mil-lion for 2008/09. The value of exports dropped by 9,8% from R49 278 million to R44 469 million.
R’m
illio
n
Year
Imports and exports of agricultural products2005/06–2009/10 (July to June)
2005/06 2006/07 2007/08 2008/09 2009/10
60 000
50 000
40 000
30 000
20 000
10 000
0
Imports Exports
According to the 2009/10 export values, wine (R5 927 million), citrus fruit (R5 580 million), grapes (R3 464 million), ap-ples, pears and quinces (R3 047 million) and cane sugar (R2 639 million) were the most important agricultural export products. Rice (R3 410 million), oilcake (R2 358 million), wheat and meslin (R2 284 million), undenatured ethyl alcohol (R2 139 million) and palm oil (R1 776 million) accounted for the highest imports.
During 2009/10 the Netherlands, the United Kingdom, Zimbabwe, Mozambique and Germany were the five largest trading partners of South Africa in terms of export destinations for agricultural products, with export values of R4 714 mil-

DAFF Strategic Plan 2011/12–2014/15
12
lion, R4 493 million, R3 240 million, R2 658 million and R1 941 million, respectively. About 20,7% of total agricultural exports for the period July 2009 to June 2010 went to the Netherlands and the United Kingdom.
The five largest trading partners for South Africa’s imported agricultural products during 2009/10 were Argentina, Brazil, Thailand, Germany and the United Kingdom, with import values of R4 726 million, R3 073 million, R2 776 million, R2 487 million and R1 961 million, respectively.
In terms of the balance of trade it is expected that the imports of most of the basic food staples, meat and dairy products will increase and exports will decrease. For example, whereas the total value of exports of maize and sugar exceeded the total value of imports of wheat and rice in 2009, it is expected to be the opposite by 2020 where the value of imports of wheat and rice will exceed the value of exports of sugar and maize by a significant margin. The opposite trend is expected for wine, fruits and some of the oilseeds where the increase in the value of exports should outpace the in-crease in the value of imports.
Global trading will continue to present its own unique challenges with heightened sanitary and phytosanitary barriers, increased concerns regarding food safety and the additional need for traceability and good agricultural practices. There are new requirements in terms of corporate social responsibility and worker welfare, as well as concerns about climate change and the associated buzzwords of “food miles” and “carbon footprints”. A huge challenge is to increase the share of processed agricultural products within the country’s total agricultural exports.
Forestry sector
Following two decades of shrinkage of the country’s plantation resources and increasing pressure on natural forests and woodlands, forestry’s goal is to ensure renewed growth, transformation and sustainability throughout the value chain in economic, social and environmental terms in ways which continue to improve the lives of the poor. Of increas-ing importance is the role which plantations (and the timber processing and manufacturing industries which they sup-port) can play in South Africa’s energy security and commitments to address climate change.
In general there are three categories of forests, namely indigenous forests, woodlands and plantation forests. Forestry activities in indigenous forests and woodlands are not limited to the protection of the resource as a natural heritage, but include their development, use and management, as well as the management and processing of non-timber forest products. Plantation forestry practices include the establishment of vast areas of land with exotic species that are har-vested and processed into pulp for the paper and packaging industries, sawn timber, furniture, shelving, flooring, etc.
In terms of land use the area under forestry is about 1,28 million ha (approximately 1%) of the total South African land area of 122,3 million ha. The forestry sector (forestry and forest products) contributes about 1,3% to the GDP. In terms of regional GDP, forestry in KwaZulu-Natal contributes 4,7%, while Mpumalanga contributes 5,5%, the Eastern Cape 0,7%, and Limpopo Province about 0,7%. The export of forest products has increased from R9,5 billion in 2001 to R14,8 billion in 2008. Imports totalled R11,3 billion in 2008.
Forestry provides livelihood support for 2,3 million people of South Africa’s rural population. The forestry sector em-ploys about 170 000 workers. The forestry sector provides about 77 000 direct jobs and 30 000 indirect jobs. The pulp and paper industry provides approximately 13 200 direct and 10 800 indirect employment opportunities. Some 20 000 workers are employed in saw-milling, and 6 000 in the timber board and 2 200 in the mining timber industries. Another 11 000 workers are employed in miscellaneous jobs in forestry.
Labour intensity in the forestry and forest products sector can change significantly over time. For example, if propor-tionately more land is used for pulpwood production, overall labour intensity will decline in the forests and in the processing plants. On the other hand, a move to higher value within South Africa, for example through high-value saw-log production and processing and marketing of high-quality solid wood products from this resource, could contribute to higher and more rewarding employment.
Ownership in the forestry sector is skewed, with the majority of forestry plantations owned by a handful of grower-processor multinational corporations. Ownership in forestry is similar to other parts of the world where, given the long-term nature of the investments required in growing timber and the highly capital intensive nature of large-scale process-ing and manufacturing, there is a fairly high concentration of ownership among larger companies. The majority of forestry plantations are therefore owned by 11 large companies, some of whom are multinational. There are two more cooperatives which control a significant percentage of the independent small and medium growers and this is a model thought to be useful for the more than 30 000 other small growers in the country. There is also a rapid development of black ownership and management in the form of out-grower timber schemes and increasing ownership of larger com-panies with a recent empowerment transaction worth over R800 million.
Although the area under plantations has decreased over the past few years from a peak of 1 518 138 ha in 1997 to about 1 257 341 ha in 2008, the volume of production has increased from 18 641 228 m³ to 20 100 000 m³ during the

PART A: Strategic overview
13
same period. South Africa is approaching the limits of increasing productivity from a declining resource. As a result, government has prioritised the expansion of the plantation area in areas where it is economically, environmentally and socially appropriate to do so. This is important not only for the country’s growth, but also for transformation, as it is dif-ficult to achieve meaningful change in any of the key transformation areas in a stagnant or declining sector. This is why the IPAP of the Department of Trade and Industry (the dti) has prioritised growing the area under plantations. The Forest Sector Transformation Charter is also a transformation and growth strategy.
South Africa is facing a looming shortage of softwood sawn timber and hardwood pulpwood over the medium and long term. The current estimated shortage of timber sawlogs is approximately 13%.
Challenges facing forestry are as follows:
• Forest fires, pests and diseases• Regulatory environment• Limited forestry research and development• Skills shortage• Lack of funding to invest in forestry • Shortage of timber in the country• Forest degradation
Opportunities for action in forestry are as follows:
• Implementation of an Integrated Fire Management Programme• Integrated land use resource assessment• Expansion of the Afforestation Programme in the Eastern Cape and KwaZulu-Natal • Rehabilitation of degraded natural forests and woodlands• Implementation of forest conservation programmes• Rehabilitation of existing plantations• Expansion of the Wattle Jungle Conversion Programme• Upscaling of the Million Trees Programme• Development of the Working for Forestry Programme• Greening and maintenance of open spaces
Fisheries sector
The mandate and core business of fisheries (marine and coastal management) is to manage the development and sustainable utilisation of marine and coastal resources, to maximise the economic potential of the fisheries sector and to protect the integrity and quality of the country’s marine and coastal ecosystems. The main challenge in fisheries is to create a balance between maximising the social and economic potential of the fisheries industry while protecting the integrity and quality of the country’s marine and coastal ecosystems and addressing transformation in the sector. Expansion of the fisheries sector’s total activity is limited by the natural productive capacity of the living marine re-sources from which the activities derive, and the necessity to limit and control the harvesting pressure according to what the resources can sustain on a long-term basis.
South Africa has a well-established fishery sector comprising two components, namely wild capture fisheries and an aquaculture component, which is under development. Wild capture fisheries currently include three distinct compo-nents (commercial, recreational and subsistence fisheries), each of which requires specific research and management interventions. The commercial fishing sector can be further broken down into highly industrialised capital-intensive fisheries, which generally operate in deep water (e.g. hake trawl and pelagic purse seine fisheries) and near-shore fisheries that are more easily accessible and use more traditional types of gear (line fishery and near-shore rock lobster hoop net fishery).
Fishing contributes approximately 0,5% to the GDP and is regionally important, especially in the Western Cape where it contributes about 2% to the gross geographic product. South Africa is a net exporter of fish and fish products and 55% of the demersal trawl catches are exported. Almost the total production in rock lobster, squid, tuna and demersal lon-gline is exported. On average, South Africa exports about 160 000 tons of fish per year and imports approximately 55 000 tons. The value of exports and imports during 2008 was approximately R3,1 billion and R1 billion, respectively. The commercial fishing industry currently employs approximately 27 000 people directly and approximately 100 000 indirectly, while aquaculture provides about 1 850 direct employment opportunities on farms.
Regarding commercial fisheries, marine living resources are considered to be fully utilised and high-value species largely overexploited. However, some rebuilding strategies are under way, for example in hake, rock lobster and aba-lone. The annual production of commercial fisheries is more than 600 000 tons, valued at R5,8 billion. Demersal fishing industries contribute about 70% of the total value of fishing. Large-scale capital investment (e.g. in vessels, factories)

DAFF Strategic Plan 2011/12–2014/15
14
is generally a prerequisite for commercial participation. Long-term commercial rights have been allocated in 22 fishing industries, with just over 2 900 rights holders and about 1 788 vessels.
New fisheries introduced since 1994 include large pelagics longline, patagonian toothfish and an experimental fishery for octopus. Certain other fisheries such as horse mackerel and round-herring have potential for expansion, but more research in the form of surveys is required to improve population estimates. There is potential for value addition and job creation in, for example the pelagic fishery for anchovy, but an implementation strategy and incentives are needed to stimulate its development.
Participation in subsistence fisheries is broad—coastal communities have traditionally made use of inter-tidal and shallow-water resources as a source of food. Only surplus not consumed by fishers is sold locally. Some 147 fishing communities, 28 338 fisher households and about 29 233 people are considered true subsistence fishers. A draft pol icy (for the recognition, allocation and management of small-scale fishing rights) is being developed for small-scale fishing.
Annual recreational fishing licences (all industries) total approximately 300 000. Income generated from these licences amounts to R18 million. However, the number of licensed recreational anglers is estimated at around 186 000. The actual annual catch is about 17 000 tons of high-value species.
Aquaculture production is currently underdeveloped and focused mainly on high-value products (abalone, oysters and mussels). The current aquaculture production level is 3 543 tons worth about R218 million. Production can increase to over 90 000 tons worth about R2,4 billion over the next 10 to 20 years. Most marine aquaculture is capital and skills intensive. Marine aquaculture also has limited potential because of the coastline—few protected areas, high energy coastline and the high cost of land based activities. Distance from the markets means the focus is on high-value prod-ucts. There are also concerns about genetic contamination and environmental impacts in sensitive areas.
Challenges facing fisheries are as follows:
• The value of production is restricted by the size of the national resource and threatened by declining fish stocks in certain fisheries. The profitability of the fishing industry is largely determined by factors such as international prices, exchange rates, fuel prices, quota allocations and the actual biomass of fish present.
• Growth in the industry is dependent not only on labour and capital inputs, but also on the stock of fish available.
• There are currently over 2 900 rights holders utilising 1 788 vessels in 21 different fisheries. This has decreased since 2002, which is in line with the international trend to decrease the number of fishing vessels to reduce the pres-sure on the resources.
Opportunities for action in fisheries are as follows:
• Rehabilitation programmes such as the rebuilding of depleted fish stocks that contribute to job creation and sustain-able livelihoods
• Investing in the sustainable management and efficient use of marine living resources, which can make a significant contribution to job creation while improving the environment
• Enforcement programmes such as green scorpions and environmental courts
• The allocation of additional fishing rights in certain fishing industries, which can contribute to job creation and sus-tainable livelihoods
• Infrastructure development and investment in the 12 fishing harbours, which can contribute to increased socio-economic and tourism opportunities
• Aquaculture development programmes, which also have the potential to play an important role
ORGANISATIONAL ENVIRONMENT
The macro-organisational structure which aims to integrate the agriculture, forestry and fisheries functions was ap-proved by the Minister of Agriculture, Forestry and Fisheries. In developing the new organisational structure the follow-ing activities were reviewed:
• The strategy and mandate of the DAFF and the requirements of the service delivery model;
• Legislation related to each of the three functional areas to be integrated into the newly established department;
• The current structures related to each of the three functional areas to be combined into the new department;
• Engagement with stakeholders in respect of the design process and the content of the proposed structure, and;
• The organisational structure in the context of good design principles, as defined by the Department of Public Service and Administration (DPSA).
A summary of the Senior Management Services (SMS) posts in terms of the approved macro-organisational structure is reflected in the following table.

PART A: Strategic overview
15
SMS posts Number of posts
Director-GeneralDeputy Director-GeneralChief DirectorDirector
192884
TOTAL 122
Human Resources Management Plan
During the current financial year (2011/12), the department will embark on the refinement of the macro-organisational structure. Organisational and post establishment refinement investigations will be prioritised in terms of the identified functional areas in order to determine the nature and extent of the functions and to allocate resources to render the required services effectively and efficiently, while remaining within the budget allocation for the department. The func-tional areas that need to be capacitated in order to support the departmental priority areas are: National Extension Reform, National Extension Support, Sector Transformation, Stakeholder Relations and Intergovernmental Relations. A service delivery model for corporate support services will also be investigated to demarcate the roles between the department’s head office and the regional office, with strategic objectives and policy design frameworks being set at head office level and delivery being undertaken by the regional offices.
The department acknowledged the importance of its human resources through the establishment of a Directorate: Employee Relations to facilitate sound employee relations through the development, implementation, monitoring and evaluation of human resource management policies and practices, as well as to facilitate the administration of progres-sive discipline. In improving the strategic focus of the human resource management function a need was identified to elevate the recruitment and selection unit to a higher level. The size of the organisation and diversity of its functional responsibilities require that the recruitment and selection unit need to function on a directorate level. Because of budget constraints this directorate could not be established, but the need will be reprioritised in the new financial year.
The department will facilitate a performance management culture to develop systems to ensure synergy between indi-vidual and organisational performance by establishing a dedicated performance management and development team.
Departmental structure
Corporate Services
Policy,Planning, Monitoring
and Evaluation
Agriculture Production,
Health and Food Safety
Chief Financial Office
Economic Development, Trade
and Marketing
Forestry and NaturalResources
Management
Stakeholder Relations,
Communication and Legal Services
Food Security and Agrarian
Reform
Fisheries Management
Branches
CD: Operations Support
DIRECTOR-GENERAL

DAFF Strategic Plan 2011/12–2014/15
16
Description of the strategic planning process
A comprehensive environmental scan was conducted for the financial years 2009/10 to 2014/15 and a new vision and mission developed for the new DAFF. The mission was linked to the core business outlining how things will be done in the course of realising the vision, as well as the “values” guiding principles for the department. A holistic view to iden-tify opportunities and threats of the external environment, including the organisation‘s internal strengths and weak-nesses, was enabled to determine the environment in which the organisation operates. A range of available options were teased out, given the unique environment and business history and the government-wide system of planning.
In the 2010/11 financial year, the DAFF reviewed the strategic goals and objectives and introduced a “Lets Value Engineer”—a new systems thinking initiative as a new approach of doing things “differently”. Value Engineering (VE) systematically focuses the collective wisdom of multidisciplinary groups, with a common objective. Functionally the DAFF’s SMS members prioritised what needs to be done and then creatively identified how best to achieve the tar-geted results. The blueprint for the DAFF was defined for the future if the department is to meet the presidential out-comes as prescribed.
The DAFF identified 71 issues to deal with if it has to deliver seriously on the presidential outcomes. These 71 issues were then functionally paired into 15 results to achieve using VE techniques, which were then functionally prioritised against the VE workshop objective. The top five issues that need to be addressed by the department were identified by using functional analysis, a technique and cornerstone of VE. The generic objective for the DAFF as defined by the VE workshop is “To improve the operational efficiencies and service delivery effectiveness by 20% year-on-year”.
The top five issues as prioritised using the VE methodology against the generic DAFF objective are as follows:
• Basic function – Align planning with government priorities
• Secondary functions – Excel in operations
– Adhere to regulatory framework
– Align structures with strategies
– Ensure technical relevance
The process included the consideration of government outcomes with the DAFF prioritising outcomes 4, 7 and 10. Significant work has been done in collaboration with relevant stakeholders regarding the prioritised outcomes. The Sector Plan was also considered and a decision was taken to review it to incorporate forestry and fisheries and to align it to government priorities. This process is still in progress.
Cascading and implementing the strategy
The government-wide planning and the MTSF inform and align the department’s plans on three levels of planning, namely: the five-year Strategic Plan, chief directorates’ Annual Business Plans (ABPs), directorates’ Annual Performance Plans (APPs) and Operational Plans. The plans are cascaded respectively into branches, chief directorates and direc-torates’ lowest level of planning. Individual performance agreements of SMS members are aligned to these plans.
At the level of operational plans, strategic outputs are broken down into clear milestones with implementable activities. Plans highlight various action steps to be taken to address the respective unit’s priorities, the various deliverables and its associated performance indicators, responsible persons, target dates, etc. At this level, individual work plans are aligned to the operational plans. The plans and budgets are integrated and operational and line managers are held accountable for the inputs that are allocated to resource their strategic plans. In terms of the Public Finance Management Act (PFMA), 1999 (Act No. 1 of 1999), better budgeting, extends accountability not only to the expenditure of inputs, but more importantly, to the efficient and effective achievement of outputs in line with strategic priorities. The implemen-tation strategy will reflect on the aspects of daily service delivery activities of the DAFF to ensure that the DAFF’s busi-ness community is well informed.
Monitoring and evaluation
The department will develop monitoring and evaluation plans to ensure that high-quality performance information, which is authentic, correctly calculated, reliable and verifiable, are reported at service delivery forums and that evidence is readily available. The focus will be dedicated to findings on monitoring and evaluation of planned outputs on the Strategic Plan, and analyses of progress towards achieving Strategic Plan outputs on a monthly basis.
All operational plans are also loaded into a knowledge bank reporting system to be reported against on a monthly basis. The reports of Operational Plans will be aligned to the status reported against strategic outputs. Service standards and turnaround times will be developed for each service, which needs to be reported against on a monthly basis.

PART A: Strategic overview
17
The use of a Service Delivery Improvement Plan (SDIP) should lead to improvement in the levels of service in the de-partment. In-year monitoring systems will be developed to inform the Citizens report on service delivery. Underperforming services will be isolated through analysis of in-year reports to develop the SDIP.
Agriculture, Forestry and Fisheries amalgamated
(DAFF)
DAFF environmental scan (vision, mission and values
reviewed)
Adoption of three Presidential outcomes by
DAFF
DAFF performance monitoring, evaluation and
reporting
DAFF strategic goals and strategic objectives
(reviewed and aligned with outcomes)
DAFF detailed deliverables planned against outcomes
and priorities
Value engineering (priorities against
outcomes identified)
Overview of the departmental planning process
Strategic goals and objectivesThe DAFF’s strategic goals and objectives were conceptualised from the priorities in the MTSF, which was analysed. Issues relevant to the department were identified and developed into six strategic goals and a number of strategic ob-jectives to support each goal. The strategic goals and objectives will assist the department to contribute to the achieve-ments of the MTSF priorities to ultimately achieve the department’s mission.
The following strategic goals (SGs) and stategic objectives (SOs) will be implemented over the medium term through strategic action programmes.
SG 1: Increased profitable production of food, fibre and timber products by all categories of producers (sub-sistence, smallholder and commercial)
Strategic objectives SO 1: Promote efficient production, handling and processing of food, fibre and timber
SO 2: Coordinate government food security initiative
SO 3: Improve production systems anchored in commodities with a competitive and comparative advantage in each province
SO 4: Comprehensive support towards rural development
SG 2: Sustained management of natural resources
Strategic objectivesSO 1: Promote environmentally sustainable production systems
SO 2: Ensure the sustainable management and efficient use of natural resources
SO 3: Ensure protection of indigenous genetic resources
SO 4: Increase contribution to green jobs to improve livelihoods
SG 3: Effective national regulatory services and risk management systems
Strategic objectivesSO 1: Promote safe food by managing the level of risks associated with food, diseases, pests, natural disasters and
trade
SO 2: Establish and maintain effective early-warning and mitigation systems

DAFF Strategic Plan 2011/12–2014/15
18
SG 4: A transformed and united sector
Strategic objectives
SO 1: Increase equity, ownership and participation of previously disadvantaged individuals (PDIs)
SO 2: Enhance systems to support the effective utilisation of assets
SO 3: Improve social working conditions in the sector
SO 4: Provide leadership and support to research, training and extension in the sector
SG 5: Increased contribution of the sector to economic growth and development
Strategic objectives
SO 1: Increase growth, income and sustainable job opportunities in the value chain
SO 2: Increase the level of public and private investment in the sector
SO 3: Increase domestic and international market access for South African and African agricultural, forestry and fishery products
SO 4: Increase production of feedstock to support the manufacturing sector
SO 5: Promote the use of feedstock by-products for renewable energies
SG 6: Effective and efficient governance
Strategic objectives
SO 1: Establish and strengthen cooperative governance and functional relations with local and international stake-holders
SO 2: Strengthen policy, planning, monitoring, evaluation, reporting and sector information
SO 3: Provide effective audit, investigative and legal, human resources and financial risk management
SO 4: Improve departmental service excellence through the implementation of quality standards, Batho Pele (people first) principles and the general legislative mandate
SO 5: Provide leadership and manage communication and information
Strategic outcome oriented goals
The following goal statements and outcomes were developed, linked to the departmental strategic goals to achieve the department’s mission:
Strategic goal Goal statement Outcome
SG 1 Increased profitable production of food, fibre and timber products by all categories of producers (subsistence, smallholder and commercial)
Vibrant, equitable, sustainable rural communities contributing towards food security for all
SG 2 Sustained management of natural resources Protect and enhance our environmental assets and natural resources
SG 3 Effective national regulatory services and risk management systems
All people in South Africa are and feel safe
SG 4 A transformed and united sector An efficient, effective and development oriented public service and empowered, fair and inclusive citizenship
SG 5 Increased contribution of the sector to economic growth and development
Decent employment through inclusive economic growth
SG 6 Effective and efficient governance Create a better South Africa, a better Africa and better world
PART B
Strategic objectives

DAFF Strategic Plan 2011/12–2014/15
20
Administration
PURPOSE
Provide strategic leadership, management and support services to the department. The aim of the programme is to lead, support and promote agricultural, forestry and fisheries resource management through policies, strategies and pro grammes to enhance sustainable use, and to achieve economic growth, job creation, food security, rural development and transformation.
The programme comprises the Ministry; Departmental Management; Financial Administration; Internal Audit; Corporate Services; Stakeholder Relations and Legal Services; Policy, Planning, Monitoring and Evaluation; and Office Accommo dation.
Corporate Services: To tender sound human resources management and development, security and information management.
Chief Financial Office: To provide the department with sound financial services.
Policy, Planning and Monitoring and Evaluation: To direct the provision of policy analysis, formulation, planning and monitoring and evaluation in order to facilitate the improvements of the department’s performance.
Stakeholder Relations, Communication and Legal Services: To provide the department with legal and communication services and promote intergovernmental and stakeholder relations.
PROgRAMME dELivERABLES
Strategic objective Strategic outcome Outcome indicators Strategic interventions2011/12–2014/15
Strategic goal 1: Increased profitable production of food, fibre and timber products by all categories of producers (subsistence, smallholder and commercial)
SO 2: Coordinate government food security initiative
Enabling institutional environment for sustainable and inclusive growth
30% of smallholder farmers organised into producer asso ciations to give collective power in negotiations for inputs and marketing
Improved coordination of rural farmers and small scale fishers into producer associations
Facilitate and support the establishment of commodity structures and associations
Strategic goal 4: A transformed and a united sector
SO 1: Increase equity, ownership and participation of PDIs
One functional funding facility
Functional financial schemes
Onestop Development Fund
Value Chain Financing Model
Strategic goal 6: Effective and efficient governance
SO 1: Establish and strengthen cooperative governance and functional relations with local and international stakeholders
Advancement of the South African Agenda and sustainable development
Contribution to regional, continental security and stability
Improve intergovernmental and stakeholder relations through active interaction with Cooperative Governance and Traditional Affairs (COGTA) and other spheres of government
SO 2: Strengthen policy, planning, monitoring, evaluation, reporting and sector information
Effective monitoring, evaluation and reporting system(s) for improved service delivery
Integrated monitoring and evaluation (M&E) system for the sector
Align and improve M&E systems in DAFF, provincial departments of agriculture (PDAs) and stateowned entities (SOEs)
Comprehensive economic and statistical information for the agriculture, forestry and fisheries sector
Adequate information available for decisionmaking purposes
Economic performance monitoring and provision of national sector statistics

PART B: Strategic objectives
21
Strategic objective Strategic outcome Outcome indicators Strategic interventions2011/12–2014/15
SO 2 (cont.) Aligned and coordinated policy and planning system(s) for improved strategies, programmes and plans in line with government priorities
Strengthened planning and policy formulation processes
Update and align policies and plans for national, provincial and local spheres to the electoral mandate and the MTSF
SO 3: Provide effective audit, investigative and legal, human resources and financial risk management
Improved human resources (HR) management and development support
Improved adherence to performance management and development system (PMDS)
Review PMDS, monitor and evaluate performance
Shorten appointment period and reduce vacancy rate
Monitor vacancy rate and interact with South African Social Security Agency (SASSA) and South African Qualifications Authority (SAQA)
Percentage of SMS trained on disciplinary procedures
Implement training programme
Human Resources Development (HRD) Strategy aligned to Vision 2015
Implement HRD Strategy
Safe, secure, healthy and conducive working environment
Percentage reduction in disease burden/incapacity
Establish health and wellness service points in provinces
Percentage (%) of high security risk areas addressed
Ensure compliance to se curity policies and systems
SO 4: Improve departmental service excellence through implementation of quality standards, Batho Pele principles and general legislative mandate
Improve sound financial management and accountability
Unqualified audit report Improve financial systems and practices
Efficient service delivery Improved customer satisfaction
Develop and implement Client Service Plan
SO 5: Provide leadership and manage communication and information
Wellinformed internal and external publics
Increased awareness of DAFF mandate and services
Align communication strategies to the government’s National Communication Strategy
Improved business processes and application
Integrated information and communication technology (ICT) system processes and technology
Optimise ICT infrastructure and utilisation
STRATEgiC OBJECTivES
The strategic goals and objectives, indicators and targets for the subprogrammes Human Resources; Chief Information Officer; and Stakeholder Relations and Communications, are reflected as follows:
Strategic goal
Strategic objective indicator
Target
2011/12 2012/13 2013/14 2214/15
1 2: Coordinate government’s food security initiative
30% of farmers organised into producer associ ations
8% 8% 8% 8%
Number of commodity structures established
9 9 9 9

DAFF Strategic Plan 2011/12–2014/15
22
Strategic goal
Strategic objective indicator
Target
2011/12 2012/13 2013/14 2214/15
4 1: Increase equit y, ownership and participation of PDIs
Number of smallholder and subsistence farmers accessing financial services
Finance Funding Model developed
Development of Finance Funding Model reviewed
Development of Finance Funding Model reviewed
Development of Finance Funding Model reviewed
10 000 smallholder farmers accessing financial services
10 500 smallholder farmers accessing financial services
11 000 smallholder farmers accessing financial services
12 000 smallholder farmers accessing financial services
10 000 subsistence farmers accessing financial services
10 500 subsistence farmers accessing financial services
11 000 subsistence farmers accessing financial services
12 000 subsistence farmers accessing financial services
Number of successful PDI farmers
284 distressed farmers financed and supported
50 distressed farmers financed and supported
100 distressed farmers financed and supported
150 distressed farmers financed and supported
6 1: Establish and strengthen cooperative governance and functional relations with local and inter national stake holders
Percentage of interactions with COGTA and other spheres of government
100% 100% 100% 100%
Number of pre scribed Marine Living Resources Act (MLRA) structures established
One consultative advisory forum
One transformation council
Maintenance and ongoing support of structures
Maintenance and ongoing support of structures
Number of smallscale fishers organised into communitybased entities
5 10 10 5
Enhanced stakeholder participation
Develop and implement Stakeholder Strategy
Implement Stakeholder Strategy
Implement Stakeholder Strategy
Review Stakeholder Strategy
International multilateral and bilateral fisheries agreements implemented
Develop International Fisheries Strategy
25% of strategy implemented
25% of strategy implemented
25% of strategy implemented
Develop Intergovern mental Fisheries Strategy–100%
25% of strategy implemented
25% of strategy implemented
25% of strategy implemented
2: Strengthen policy, planning, monitoring, evaluation, reporting and sector information
Effective planning system for the sector
Align national and provincial plans with Presidential outcomes and targets
Update plans in alignment with MTSF
Update plans in alignment with MTSF
Update plans in alignment with MTSF

PART B: Strategic objectives
23
Strategic goal
Strategic objective indicator
Target
2011/12 2012/13 2013/14 2214/15
6 (cont.) Aligned strategic, business and implementation plans
Continuous programme planning support
Continuous programme planning support
Continuous programme planning support
Continuous programme planning support
Existing policies reviewed
Review existing policies
Update and align policies
Update and align policies
Update and align policies
Targeted research and development (R&D) programme developed
Implement targeted R&D programme
Monitor, coordinate and report on targeted R&D programme
Monitor, coordinate and report on targeted R&D programme
Monitor, coordinate and report on targeted R&D programme
M&E systems coordinated
Monitor and assess the performance of DAFF, PDAs and SOEs
Monitor and assess the performance of DAFF, PDAs and SOEs
Monitor and assess the performance of DAFF, PDAs and SOEs
Monitor and assess the performance of DAFF, PDAs and SOEs
Comprehensive economic reports for the sector
Reports on economic indicators and trends for the sector
Reports on economic indicators and trends for the sector
Reports on economic indicators and trends for the sector
Reports on economic indicators and trends for the sector
Comprehensive statistical database for the sector
National statistical information and reports
National statistical information and reports
National statistical information and reports
National statistical information and reports
3: Provide effective audit, investigative and legal, human resources and financial risk management
Percentage of PMDS adhered to
80% adherence to PMDS
100% adherence to PMDS
100% adherence to PMDS
100% adherence to PMDS
Annual reduction in vacancy rate
12% 11% 10% 9%
Percentage of SMS members trained on disciplinary procedures
60% SMS members trained
80% SMS members trained
100% SMS members trained
100% SMS members trained
Percentage of employees trained and developed on HRD Strategy
30% of HRD Strategy implemented
70% of HRD Strategy implemented
90% of HRD Strategy implemented
100% of HRD Strategy implemented
Number of service points established
1 service point per province (1 official)
Fully capacitate 3 service points with 3 components:
Human Immuno deficiency Virus (HIV), Em ployee Assist ance Programme (EAP), Occupa tional Health and Safety (OHS)
Fully capacitate 3 service points with 3 components:
HIV, EAP, OHS
Fully capacitate 3 service points with 3 components:
HIV, EAP, OHS

DAFF Strategic Plan 2011/12–2014/15
24
Strategic goal
Strategic objective indicator
Target
2011/12 2012/13 2013/14 2214/15
6 (cont.) Percentage reduction on disease burden (communicable and noncommunicable diseases, etc.)
Reduced by 10%
20% 20% 30%
Improved adherence to Security Policy and systems
Review Security Policy
Monitor compliance to Security Policy and systems
Monitor compliance to Security Policy and systems
Monitor compliance to Security Policy and systems
MLRA reviewed and implemented
Review of the MLRA and alignment of departmental policies
Draft Bill submitted to Cabinet
Implementation of Amended MLRA
Implementation of Amended MLRA
4: Improve the DAFF’s service excellence through imple mentation of quality stan dards, Batho Pele principles and general legislative mandate
Compliance to legislation, prescripts, procedures and guidelines
Unqualified audit report on financial statements
Unqualified audit report on financial statements
Unqualified audit report on financial statements
Unqualified audit report on financial statements
% improvement in customer satisfaction index
25% 25% 25% 25%
5: Provide leadership and manage com muni cation and information
Integrated information and communication technology (ICT) systems
100% migration and integration
100% ICT systems maintenance
100% ICT systems maintenance
100% ICT systems maintenance
Master System Plan (MSP) approved and implemented
Integrate and review MSP
Implement phase 1 of MSP
Implement phase 2 of MSP
Implement phase 3 of MSP
Knowledge and Information Management (KIM) Strategy approved and implemented
Implement phase 1 of KIM Strategy
Implement phase 2 of KIM Strategy
Implement phase 3 of KIM Strategy
Implement phase 4 of KIM Strategy
Approved communication strategies
Develop and implement communication strategies
Revise and implement strategies
Revise and implement strategies
Revise and implement strategies
OvERviEw
Within the Administration Programme, there are four branches namely: Corporate Services; Stakeholder Relations, Com munication and Legal Services; Chief Financial Office (CFO); and Policy, Planning, Monitoring and Evaluation.
Each branch is divided into chief directorates and directorates managed by the DDGs, Chief Directors and Directors, respectively. All the branches are linked to the five strategic objectives which ultimately contribute and support to strategic goal number six (6). Performance indicators will be used to measure the achievement of strategic objectives over the MTEF period.
Each performance measure will be attached to the relevant branch’s chief directorate.

PART B: Strategic objectives
25
PROBLEM STATEMEnT
Lack of comprehensive consultation with stakeholders, particularly the rural stakeholders, improper organisation of smallholder farmers, fishers and foresters has led to poor access to markets for this group. By establishing proper communication channels and legal support to the department and these groups of stakeholders, major improvements can be achieved. Inadequate capacity to support human resource development and financial resources is another challenge which hampers the department to achieve its objectives. Potential risk management, occupational risks, health complexities and psychosocial problems also have a greater impact on employee’s productivity level. Safety and security of employees will minimise the potential for loss.
iMPLEMEnTATiOn STRATEgy
The department identified the importance of a stakeholder engagement strategy to ensure achievement of its objectives. As a result, the legal support will be strengthened to facilitate improvement of partnership management, communication and stakeholder relations. Human resources development will be improved in support of weaknesses in agrarian reform beneficiaries. The DAFF will prioritise resources to accelerate the implementation of scarce skills development programmes. The required capacity will ensure efficient and effective implementation of the development agenda of government which contributes to household food security and creates decent and sustainable livelihoods in rural areas.
Training and development
To provide effective and efficient services, the department will deal with challenges brought forth by the amalgamation of the new functions through training and development. The DAFF will continue to implement management development programmes to ensure a continuous supply of junior, middle and senior managers and a mentorship programme to enhance leadership.
Skills gaps identified during the skills audit will be addressed through various interventions such as learnership and bursary schemes. An estimated 300 new bursaries will be processed for the employees in the department for 2011/12.
In reducing the illiteracy level, employees will continue to enrol at level 1–5 on adult basic education and training (ABET) programmes.
Employee health and wellness
The department will align with the approved Employee Health and Wellness (EH&W) Framework for the public service led by the DPSA. The DAFF will continue to render services and advocacy programmes in disease management, HIV counselling and testing, psychosocial services and access to health information through the EAP. All the employees of the department will access the EAP as per the Batho Pele principles.
Professional security services will be provided to people, state property and information against security risks and threats in line with minimum information security standards and minimum physical security standards. The department will ensure that 33% of the employees deployed in highrisk areas, attend safetyrelated generic training, and are subjected to risk assessments and medical surveillance exercises according to the provisions of the Occupational Health and Safety Act. This will be coupled with administrative services in terms of occupational injuries and diseases.
Employee relations have been identified as an area of importance that will equip managers with sound employee relations, policies and practices. Training will continue to be conducted in terms of the policy and procedures on incapacity and illhealth retirement.
gender and transformation
The department will ensure gender mainstreaming and transformation through the implementation of the Heads of Department (HoDs) 8 Principle Action Plan for promoting women empowerment and gender equality as well as increasing the number of people with disabilities to 2% by 31 March 2012 in the public service. Monitoring mechanisms are put in place, including reviewing all appointments from salary level 9 upwards, so that they feed into the development of an SMS pool of women and people with disabilities at SMS levels. These will continue to be integrated in the performance agreements of the SMS members.
Sector human capital development
Over the MTEF period the DAFF will accelerate a process towards the promulgation of the Agricultural Training Institutes Bill, thereby ensuring the positioning of the twelve colleges of agriculture to operate as national training institutes

DAFF Strategic Plan 2011/12–2014/15
26
and as centres of excellence and rural wealth creation. The department will continue to facilitate and monitor the implementation of the Commoditybased Mentorship Programme in all nine provinces in support of the projects on the ground. To ensure return on investment in training, the department will ensure that the beneficiaries of the Comprehensive Agricultural Support Programme (CASP) are subjected to quality training, which is guided by approved training business plans.
On the part of extension, the department will continue the implementation of the Extension Recovery Plan. More than 1 500 employees will undergo various types of appropriate skills training programmes while more than 1 000 will continue to upgrade their qualifications. The DAFF will continue to monitor the benefit of the newly introduced innovative Extension Suite Online, ensuring that all extension officers make optimal use of the system. The use of the Farmer’s green book by all farmers will be enhanced.
The department will continue to engage with the Department of Higher Education and Training (DHET) to ensure the alignment and relevance of the work of agricultural and forestry line function sector education and training authorities (SETAs), the alignment of agricultural, forestry and fisheries curricula at institutions of higher learning, make a joint effort in sourcing of resources for implementation of ABET in the sector and the development of an agricultural, forestry and fisheries vocational training strategy.
implementation of iCT Strategy
In this financial year, the department intends to centralise funding for all information and communication technology (ICT) services, and implement wireless connectivity to 11 sites across forestry regions as a last phase of the cutover migration of forestry and fisheries. The server operating systems will be upgraded to the approved version and virtualisation in the Windows environment will be implemented. Implementation of the systems that were planned in the previous financial year will be deployed, and planning will commence for the following legacy systems: Forlats, Asset Management, and Seed Analysis. The ICT Strategy for 2011/12–2014/15 is as follows:
Project Time frame Priority Budget
The implementation of radio links to remote sites, and where it is not working, the investigation of alternative solutions
Apr. 2011 to Mar. 2012 2 Yes
Communicate ICT training (enduser) to department (e.g. ICT circular) Apr. 2011 to Mar. 2012 2 No
Conversion of current contractor positions to permanent positions in a phased approach
Apr. 2011 to Mar. 2013 2 Yes
Request for D: ICT to be coopted to DEXCO for ICT observation purposes Apr. 2011 to Mar. 2012 1 No
Send ICT customer satisfaction survey to all DAFF users (e.g. Heat software)
Apr. 2011 to Mar. 2012 2 No
Resend request for representatives at information technology (IT) user group to all directors
Apr. 2011 to Jun. 2011 3 No
Update ICT policies and procedures (e.g. forms, procedures, service catalogue) on Intranet
Apr. 2011 to Mar. 2012 1 No
Prepare current infrastructure to be Virtual Machine Ware (VMW) ready Apr. 2011 to Mar. 2012 2 Yes
Implementation of server operating systems upgrade May 2011 to Apr. 2012 2 Yes
ICT day as an awareness campaign with different presentations for departmental officials
Jul. 2011 to Sept. 2011 2 Yes
Implement change control (Heat software) to other ICT units Aug. 2011 to Mar. 2012 2 No
Investigate and implement the rollout of FOSS OpenOffice Apr. 2012 2 No
Create post for ICT Trainer/System Tester Apr. 2012 to 2014 3 Yes
Develop and review of the MSP Apr. 2012 to 2014 1 Yes
Implementation of the Disaster Recovery Plan (DRP) for ICT services Medium to long term 1 Yes
Conduct research on: Antivirus protection, remote management, backup software, server capacity planning, configuration management database (CMDB), SharePoint, document management, Voice over Internet Protocol (VoIP), auto password generation and single signon, Oracle or MS SQL for AGIS conversion
Apr. 2011 to Mar. 2012 2 No
Development of legacy systems (Asset Management, Seed Analysis, Forlats, ASTATS and Trade Permit)
Apr. 2011 to Mar. 2012 1 Yes

PART B: Strategic objectives
27
Acquisition and asset management
Fixed capital assets
The department normally plans for the construction of new buildings and repairs and maintenance of fixed capital assets in conjunction with the official programme of the DPW. Once needs have been identified a certified needs assessment is submitted to the DPW as the custodian of all government buildings.
The following multiyear projects have been identified for the MTEF period 2011/12, 2012/13 and 2013/14:
Project name Type Project description 2011/12 2012/13 2013/14
Footandmouth disease (FMD) border fence
Fence, access roads and water control structures
20 km elephant control fence and 20 km normal fence
28 000 28 000 28 000
Drilling Boreholes 120 boreholes per year 7 000 7 500 8 000
Lesotho border fence Border fence Farmers to erect and maintain fence as per court order and compensated for it for 500 km
2 000 2 000 2 000
Durban Quarantine Station Quarantine station Quarantine station – – –
Stellenbosch: Administrative building
Office building Additional office building – – –
King Shaka International Airport (KwaZuluNatal): Kennels
Kennels Dog kennels 771 1 941 1 174
Upington: Offices and laboratory
Office building and laboratory
Office and laboratory building
332 837 506
Upington: Locust control depot
Store Store 1 169 – –
Upington: Fencing of locust control site
Fence Perimeter fence – – –
Stellenbosch: Chemical store
Chemical store Chemical store – – –
Grootfontein Agri cultural Development Institute: New hostel
Building Accommodation facilities for students
– – 6 839
Cape Town: Sniffer dog kennels
Kennels Dog kennels 771 1 941 1 174
Total 40 043 42 219 47 693
Movable assets
The following is a summary of the anticipated acquisition of movable assets and related costs:
Asset type2011/12 2012/13 2013/14
R’000 R’000 R’000
Buildings and other fixed structuresMachinery and equipmentSoftware and other intangible assets
42 11469 640
783
42 56341 083
789
43 25944 016
817
Total 112 537 84 435 8 892
Rehabilitation and maintenance of physical assets
All departmental assets are being serviced as and when required or in terms of a maintenance plan. Assets which are not serviceable are normally auctioned off, the proceeds of which are deposited into the National Revenue Fund.

DAFF Strategic Plan 2011/12–2014/15
28
Capital transfers
The department plans to transfer the following capital funds to the Agricultural Research Council (ARC):
item2011/12 2012/13 2013/14
R’000 R’000 R’000
Renovations and upgradingAgricultural research and infrastructureFMD facility
67 260100 91243 859
70 62313 853
105 263
74 50714 615
–
Total 212 031 189 739 89 122
Multiyear projections of income and projected receipts from the sale of assets are as follows:
departmental receipts 2011/12 2012/13 2013/14
Sales of goods and services Sale of scrap, waste and other used current goodsFines, penalties and forfeitsInterest, dividends and rent on landSale of capital assetsFinancial transactions in assets and liabilities
93 12183
11 930500
15 930
94 53653
10 140550
13 000
96 50664
11 000570
15 500
Total 121 492 118 234 123 586
Projections for the sale of capital assets are based on possible movable assets identified for disposal. The DAFF normally transfers assets free of charge to schools and other institutions. Assets not transferred are sold on public auctions.
ExPEndiTURE TREndS
Expenditure decreased from R1,7 billion in 2010/11 to R1,1 billion in 2013/14, at an average annual rate of 13,5%, due to the allocation of a oneoff amount of R248 million in 2007/08, R22,1 million in 2008/09 and R367 million for the Microagricultural Financial Institutions of South Africa (Mafisa) Scheme. Expenditure is projected to increase from R1,1 billion in 2010/11 to R1,4 billion in 2013/14, at an average rate of 8,6%. The main contributor to the increase is the incorporation of fisheries and forestry functions as a result of the function shift and restructuring of the department. Further more, the oversight role of Mafisa and the transfer payment to the ARC are now included in this programme. Spending in the Office Accommodation subprogramme increased from R83 million in 2009/10 to R95 million in 2010/11, because of the department’s negotiated lease for new offices in Pretoria to accommodate the forestry personnel and as a result of consolidating offices in other cities. Expenditure is projected to increase to R123 million over the medium term.
RESOURCE ALLOCATiOn (extracted from vote 26, Estimates of national Expenditure, 2011)
Programme: Administration2011/12 2012/13 2013/14
R’000 R’000 R’000
Per subprogrammeMinisterDepartment ManagementFinancial AdministrationInternal AuditCorporate ServicesStakeholder Relations, Communication and Legal ServicesPolicy, Planning, Monitoring and EvaluationOffice Accommodation
20 715 16 810
142 252 7 306
107 395 40 080
854 239 108 161
21 755 18 545
152 882 7 832
115 427 41 930
984 950 117 639
22 950 19 530
161 789 8 257
123 028 44 190
930 271 123 092
1 296 958 1 460 960 1 433 107
Economic classificationCompensation of employeesGoods and servicesInterest and rent on landTransfers and subsidiesPayments for capital assets
283 546 247 729
269 759 191
6 223
305 840 275 380
337 873 192
6 211
327 391 297 308
364 801 565
6 479
1 296 958 1 460 960 1 433 107

PART B: Strategic objectives
29
Trade Promotion and Market Access
PURPOSE
Ensure value chain integration; facilitation of market access for agriculture, forestry and fisheries products in support of economic growth, job creation and development.
The programme comprises the following three subprogrammes, namely International Relations and Trade; Agroprocessing and Marketing; and Cooperatives and Rural Enterprises Development.
international Relations and Trade: Facilitates, coordinates and supports international relations and international trade for the agriculture, forestry and fisheries sectors through the development and implementation of appropriate policies and programmes.
Agro-processing and Marketing: Ensures the conversion/transformation of primary agriculture, forestry and fisheries product commodities into valueadded products and ensure domestic and international market access.
Cooperatives and Rural Enterprises development: Facilitates and supports the implementation of programmes and initiatives to ensure the promotion and participation of the agriculture, forestry and fisheries sectors in the economic development of businesses.
PROgRAMME dELivERABLES
Strategic objective Strategic outcome Outcome indicators Strategic interventions2011/12–2014/15
Strategic goal 1: Increased profitable production of food, fibre and timber products by all categories of producers (subsistence, smallholder and commercial)
SO 2: Coordinate government food security initiative
Enabling institutional environment for sustainable and inclusive growth
At least 30% of smallholder farmers to be organised into producers’ associations or marketing coops to give collective power in negotiations for inputs and marketing
Facilitate and support the establishment of commodity structures and associations
SO 4: Provide comprehensive support towards rural development
Rural job creation and promoting economic livelihoods
Increase jobs in agroprocessing in rural areas, including small towns
Facilitate the implementation of the Agroprocessing Strategy
Percentage of small farmers producing for sale rises from 4,07% to 10%
Facilitate establishment of marketing/trade linkages to support the commercialisation of small farmers
Strategic goal 5: Increased contribution of the agriculture, forestry and fisheries sector to economic growth and development
SO 1: Increase growth, income and sustainable job opportunities in the value chain
More labour absorbing growth support
Sector strategies to support growth of labourintensive industries
Facilitate the development and implementation of sector charters and strategies
Improved cost structure in the economy
Interventions to promote appropriate cost structure
Improve the efficiency of value chains within the sector (DAFF)
SO 2: Increase the level of public and private investment for agricultural, forestry and fisheries products
Improved support to small businesses and cooperatives
Improved integration of second economy activities into the mainstream economy
Create an enabling environment to support SMMEs within the sector
SO 3: Increase market access for South African and African agricultural, forestry and fisheries products domestically and internationally
Increased competitiveness to raise net exports, grow trade as a share of world trade and improve its composition
Support for exports and import competing sectors
Facilitate intraAfrica trade on DAFF products by promoting the export of valueadded trade

DAFF Strategic Plan 2011/12–2014/15
30
Strategic objective Strategic outcome Outcome indicators Strategic interventions2011/12–2014/15
Strategic goal 6: Effective and efficient governance
SO 1: Establish and strengthen cooperative governance and functional relations with local and international stakeholders
Advancement of the African Agenda and sustainable development
Contribution to regional, continental security and stability
Facilitate the preparation of agreements and monitor and coordinate implementation of signed agreements
Enhanced trade and investment
Enhanced representation in and strengthened regional, continental and global platforms and governance institutions
Oversee and provide support for the promotion and protection of DAFF interests regionally and internationally
STRATEgiC OBJECTivES
Strategic goal
Strategic objective indicator
Target
2011/12 2012/13 2013/14 2214/15
1 2: To coordinate government food security initiative
30% of smallholder farmers organised into commodity associations and cooperatives
12 commodity associations established
12 commodity associations established
12 commodity associations established
12 commodity associations established
90 cooperatives established
108 cooperatives established
126 cooperatives established
144 cooperatives established
5 1: Increase growth, income and sustain able job opportunities in the value chain
Value chain networks established and institutionalised
Grain value chain network established
Horticulture value chain network established
Livestock value chain network established
Forestry and fisheries value chain network established
Sector charters implemented
Implementation of the AgriBEE (10 AgriBEE deals facilitated)
Implementation of the AgriBEE (10 AgriBEE deals facilitated)
Implementation of the AgriBEE (10 AgriBEE deals facilitated)
Implementation of the AgriBEE (10 AgriBEE deals facilitated)
Forestry charters implemented
Forestry charters implemented
Forestry charters implemented
Forestry charters implemented
Study on status of transformation within the fisheries sector
Fisheries charter developed
Fisheries charter implemented
Fisheries charter implemented
Sector strategies developed and implemented
SMME Strategy developed
SMME Strategy developed
SMME Strategy implemented
(25 small businesses supported)
SMME Strategy implemented
(25 small businesses supported)
Trade strategy to provide importer and exporter readiness training to 20 developing farmers in place
Trade strategy to provide importer and exporter readiness training to 100 farmers in place
Trade strategy to provide importer and exporter readiness training to 200 farmers in place
Trade strategy to provide importer and exporter readiness training to 300 farmers in place
400 farmers trained on marketing skills
450 farmers trained on marketing skills
500 farmers trained on marketing skills
550 farmers trained on marketing skills
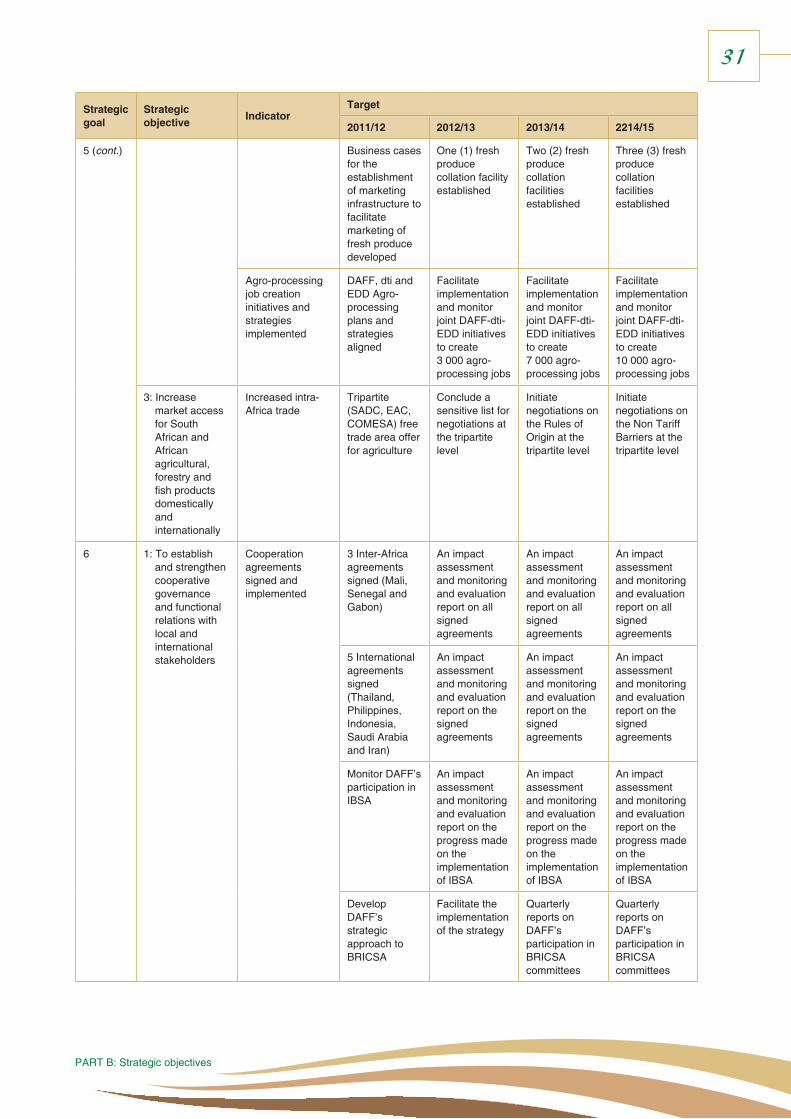
PART B: Strategic objectives
31
Strategic goal
Strategic objective indicator
Target
2011/12 2012/13 2013/14 2214/15
5 (cont.) Business cases for the establishment of marketing infrastructure to facilitate marketing of fresh produce developed
One (1) fresh produce collation facility established
Two (2) fresh produce collation facilities established
Three (3) fresh produce collation facilities established
Agroprocessing job creation initiatives and strategies implemented
DAFF, dti and EDD Agroprocessing plans and strategies aligned
Facilitate implementation and monitor joint DAFFdtiEDD initiatives to create 3 000 agroprocessing jobs
Facilitate implementation and monitor joint DAFFdtiEDD initiatives to create 7 000 agroprocessing jobs
Facilitate implementation and monitor joint DAFFdtiEDD initiatives to create 10 000 agroprocessing jobs
3: Increase market access for South African and African agricultural, forestry and fish products domestically and internationally
Increased intraAfrica trade
Tripartite (SADC, EAC, COMESA) free trade area offer for agriculture
Conclude a sensitive list for negotiations at the tripartite level
Initiate negotiations on the Rules of Origin at the tripartite level
Initiate negotiations on the Non Tariff Barriers at the tripartite level
6 1: To establish and strengthen cooperative governance and functional relations with local and international stakeholders
Cooperation agreements signed and implemented
3 InterAfrica agreements signed (Mali, Senegal and Gabon)
An impact assessment and monitoring and evaluation report on all signed agreements
An impact assessment and monitoring and evaluation report on all signed agreements
An impact assessment and monitoring and evaluation report on all signed agreements
5 International agreements signed (Thailand, Philippines, Indonesia, Saudi Arabia and Iran)
An impact assessment and monitoring and evaluation report on the signed agreements
An impact assessment and monitoring and evaluation report on the signed agreements
An impact assessment and monitoring and evaluation report on the signed agreements
Monitor DAFF’s participation in IBSA
An impact assessment and monitoring and evaluation report on the progress made on the implementation of IBSA
An impact assessment and monitoring and evaluation report on the progress made on the implementation of IBSA
An impact assessment and monitoring and evaluation report on the progress made on the implementation of IBSA
Develop DAFF’s strategic approach to BRICSA
Facilitate the implementation of the strategy
Quarterly reports on DAFF’s participation in BRICSA committees
Quarterly reports on DAFF’s participation in BRICSA committees

DAFF Strategic Plan 2011/12–2014/15
32
OvERviEw
The DAFF will ensure facilitation of market access for agricultural, forestry and fisheries products domestically and internationally, through the agricultural forestry and fisheries marketing support interventions, such as marketing information, training, facilitating the establishment of marketing infrastructure and the issuing of import and export permits in terms of trade agreements signed between South Africa and trading partners.
Negotiation with developing countries with the aim of broadening market access for South African agricultural products in various markets through bilateral trade initiatives such as with the European Union (EU), European Free Trade Associ ation (EFTA), Southern African Customs Union (SACU), SADC, India and multilaterally through market access negotiations at the World Trade Organisation (WTO), will be improved. Further economic research and analysis of the sector is of importance to provide advice and support on production and resource economics to provinces and other agencies involved in agricultural production. Collaboration with the NAMC will be continued to implement shared projects such as the monitoring of food prices across the country.
The department will facilitate the development of viable and sustainable cooperatives to provide support for increased production on niche markets and products that offer a competitive advantage and integration of agrarian reform enterprises to the overall commercial export producers’ infrastructure. In cooperation with the dti, the programme will enhance export promotion and marketing capacity.
New jobs will also be created through expanded sectoral export. The programme will engage and conclude agreements with domestic and international partners to provide support in scarce skills development. Through a MoU with other strategic countries official exchange programmes will be established for skills development purposes and to develop the relevant skills to support agrarian reform.
The areas of importance will be to facilitate the functioning of the AgriBEE Charter Council towards the finalisation of the AgriBEE sector codes; increase the number of AgriBEE equity deals annually by 10%, facilitate the increase in the number of sustainable land and agrarian reform projects/beneficiaries; increase the number of farmers and/or entrepreneurs gaining access to financial services; and the number of memberbased financial institutions linked to financial markets. The Forest Sector Transformation Charter will develop a monitoring and reporting system to enable the Charter Council to report on the state of transformation in the sector.
PROBLEM STATEMEnT
Since the advent of deregulation of markets and liberalisation of international trade, South Africa became an integral part of the global value chains. The accession into the global scene necessitated the sector to adjust to the new environment so that it becomes relevant to the changed environment as well as to play a significant role in world trade in agricultural, forestry and fisheries products.
From the trading point of view, the challenge facing the sector is to diversify its export destinations as well as broaden the basket of commodities and valueadded products that are destined for export markets. Market access by developing farmers has also been identified as one of the key challenges noted by the department. In pursuit of addressing the challenge, the DAFF will implement the strategy aimed at unblocking market access barriers such as facilitating the establishment of marketing infrastructure, providing marketing information to farmers as well as providing capacitybuilding training programmes as part of increasing the knowledge base of farmers.
In the implementation of South Africa’s foreign policy objectives, the DAFF interacts with various sector stakeholders at national, regional and international level. Other than the structured interactions through bilateral and multilateral agreements, there are a number of engagements that the DAFF is expected to participate in. Furthermore, there are no systems in place to coordinate and monitor engagements with partners. A need to expand to the new strategic partners in line with the consolidation of the African Agenda has been identified. A further need was identified to put systems in place to monitor engagements with international partners.
iMPLEMEnTATiOn STRATEgy
Strategies and interventions aimed at improving market access will continue to be implemented. The interventions will focus on training, providing marketing information and facilitating the establishment of agricultural marketing infrastructure for developing farmers. The DAFF will participate in trade negotiation sessions aimed at improving access for South African products in international markets.
We will continue to undertake agricultural economic research, render policy advice and work with other government departments to improve the efficiency of the agrologistics system to promote an efficient and costeffective flow of agricultural, forestry and fisheries commodities across the economy.

PART B: Strategic objectives
33
In an effort to strengthen international relations, special focus will be on the implementation of agreements, through continuous engagements with bilateral and multilateral partners. A special focus will be put on the new strategic partners in line with the consolidation of the African Agenda. The implementation strategy will focus on putting systems in place to advance the efforts of South Africa to implement the Comprehensive African Agricultural Development Programme (CAADP), strengthen SouthSouth cooperation (India, Brazil and South Africa) and NorthSouth relations and contribute towards the UN reform process. The strategy is informed by foreign policy objectives and the International Trade and Security Cluster (ITSC) priorities.
In addition to the signing of agreements with different international partners, focus will be on the implementation and monitoring of agreements which will take centre stage. Various funding options will be explored to assist with the implementation of the agreements. The success of this process will depend on collaboration and partnership with relevant stakeholders. In this context, there is the questionable ability of partners to implement the agreements because of capac ity problems. It is therefore critical that partnerships with the SADC and India, Brazil and South Africa (IBSA) be prioritised. Furthermore, as recommended by the ITSC, postconflict reconstruction efforts will take preference.
ExPEndiTURE TREndS
The spending focus over the medium term will be on supporting the objectives of the government’s NGP and implementing the IGDP in the sector. Particular emphasis will be placed on promoting market access and trade; strengthening the participation of the department in multilateral agencies; establishing market infrastructure; providing market information, trade intelligence and training; developing entrepreneurs; developing and implementing the sector charter and strategies; and creating an enabling environment to support SMMEs within the sector.
Expenditure decreased from R191,5 million in 2007/08 to R145,6 million in 2010/11, at an average annual rate of 8,7%. The decrease is the result of a reprioritisation of the budget in 2010/11 in relation to AgriBEE. A new Memorandum of Agreement was entered into with the Land Bank, in which the allocation was reinstated from 2011/12 for AgriBEE equity projects. Over the medium term, expenditure is projected to increase from R145,6 million in 2010/11 to R193,5 million in 2013/14, at an average annual rate of 10%. The increase provides for adjustments for inflation.
The ratio of administrative costs to line function costs is 1:7.
RESOURCE ALLOCATiOn (extracted from vote 26, Estimates of national Expenditure, 2011)
Programme: Trade Promotion and Market Access2011/12 2012/13 2013/14
R’000 R’000 R’000
Per subprogrammeManagementInternational Relations and TradeCooperatives and Rural Business DevelopmentAgroprocessing and Marketing
2 344 81 846 60 165 47 411
2 533 72 991 65 376 42 526
2 672 76 999 68 520 45 307
191 766 183 426 193 498
Economic classificationCompensation of employeesGoods and servicesInterest and rent on landTransfers and subsidiesPayments for capital assets
52 475 38 031
12 100 637
611
54 705 44 230
15 83 829
647
57 345 47 124
15 88 320
694
191 766 183 426 193 498

DAFF Strategic Plan 2011/12–2014/15
34
Food Security and Agrarian Reform
PURPOSE
The programme facilitates and promotes food security and agrarian reform programmes and initiatives. It comprises three subprogrammes, namely Food Security; Sector Capacity Development; and National Extension Support Services.
Food Security: The subprogramme provides national frameworks to promote sustainable household food security programmes through improving the production systems of subsistence and smallholder farmers in the agriculture, forestry and fishery sector to achieve food security livelihoods and facilitate the provision of inputs, implements and infrastructure support.
Sector Capacity: Facilitates the provision of agriculture, forestry and fisheries education and training in support of sustainable growth and equitable participation in the sector. This will be achieved by facilitating and supporting education and training skills, promoting the development of centres of excellence on skills training and develop, manage and coordinate the sector transformation policy and strategy in line with the government objectives for the department.
national Extension Support Services: Provides national extension policies, norms and standards on research and technology development. The subprogramme will provide strategic leadership and guidance for the planning, coordination and implementation of extension and advisory services in the sector. It will also provide leadership and strategic support in the implementation of norms and standards for extension.
PROgRAMME dELivERABLES
Strategic objective Strategic outcome Outcome indicators Strategic interventions2011/12–2014/15
Strategic goal 1: Increased profitable production of food, fibre and timber products by all categories of producers (subsistence, smallholder and commercial)
SO 2: Coordinate government food security initiative
Sustained agrarian reform Improved support mechanisms for food production by subsistence and smallholder producers
Monitor compliance to Food Security (FS) Policy
Implement Zero Hunger Strategy
SO 2 (cont.) 45 000 producers receiving comprehensive support
Provide comprehensive support to new producers
Monitor compliance to Mechanisation Policy
Develop engineering norms and standards on production technologies
Strategic goal 4: A transformed and united sector
SO 4: Provide leadership and support to research, training and extension in the sector
Increased production enabled by extension support and appropriate technologies
2 000 extension personnel receiving targeted technical and generic training
Facilitate the implementation of training extension personnel in technical and generic skills
Enhanced agrarian reform 30 000 producers accessing training programmes per year
Provide appropriate training to new producers
Strategic goal 6: Effective and efficient governance
SO 4: Improve departmental service excellence through the implementation of quality standards, Batho Pele principles and general legislative mandate
A transformed DAFF and sector (gender mainstreaming and transformation/sector transformation)
Compliance to transformation legislation
Audit departmental processes and deliverables aimed at vulnerable groups, youth, subsistence and smallholder producers

PART B: Strategic objectives
35
STRATEgiC OBJECTivES
Strategic goal
Strategic objectives indicator
Targets
2011/12 2012/13 2013/14 2214/15
1 2: Coordinate government food security initiative
Approved FS Policy Develop and approve FS Policy
Compliance to FS Policy
Compliance to FS Policy
Compliance to FS Policy
Approved Zero Hunger Strategy
Develop, approve and im plement Zero Hunger Strategy
Implement Zero Hunger Strategy
Implement Zero Hunger Strategy
Review Zero Hunger Strategy
Number of producers receiving comprehensive production support
15 000 15 000 15 000 15 000
Approved Policy on Mechanisation Support Model
Develop and approve Policy on Mechan i sation Support Model
Implement the Policy on Mechan isa tion Support Model
Implement the Policy on Mechan isa tion Support Model
Implement the Policy on Mechan isa tion Support Model
Number of production technologies with norms and standards
3 5 7 8
4 4: Provide leadership and support to research, training and extension in the sector
Number of new producers completing training programmes
14 targeted programmes
15 targeted programmes
16 targeted programmes
16 targeted programmes
Approved agriculture training institutions (ATIs) Green Paper
ATI Green Paper consultation concluded
Norms and standards approved by HODs
60% of colleges of agriculture transformed into ATI and adhering to norms and standards
90% of colleges of agriculture transformed into ATI and adhering to norms and standards
100% of colleges of agriculture (ATIs) operating as centres of excellence
Approved concept plan on number of villages (on agriculture, forestry and fisheries vulnerable workers)
4 villages 5 villages 8 villages 10 villages
Number of extension personnel received training
1 500 extension personnel receive training
1 800 extension personnel receive training
2 000 extension personnel receive training
2 100 extension personnel receive training
Develop appropriate policies towards improvement of extensionservice
Implement approved policies towards improvement of extension service
Implement approved policies towards improvement of extension service
Implement approved policies towards improvement of extension service
6 4: Improve departmental service excellence through the implementation of quality standards, Batho Pele principles and general legislative mandate
Transformed sector Implement findings of the DAFF audit report
Audit sector processes and deliverables
Implement sector audit recommendations
Implement sector audit recommendations
Overall coordination on the resolution of the workers summit
Monitor and report
Monitor and report
Monitor and report
Monitor and report

DAFF Strategic Plan 2011/12–2014/15
36
OvERviEw
The sector has been experiencing a decline in employment, which has been accelerated by the global economic recession, lack of investments to support development of rural agroprocessing industries. The sector seeks to improve the productivity and competitiveness of the producers in general and of smallholder producers in particular. Both subsistence and smallholder producers in general lack the requisite skills and resources to compete with wellestablished commercial farmers.
While the state endeavours to increase the number of viable smallholder farmers there is a significant decline in the level of productivity among the land reform beneficiaries. The latter contribute negatively to government’s Black Economic Empowerment (BEE) policies. People living in rural areas continue to be poor while having some natural assets at their disposal.
There is an urgent need to package and redefine the products and services that the state in partnership with the private sector will provide to both subsistence and smallholder farmers. Over the MTEF period the main focus will be on continuing rollout of the enterprise resource planning (ERP), implementation of programmes that support the use of commodity accredited mentors to support extension and advisory services and the introduction and acceleration of the Zero Hunger Strategy.
The proposed interventions will reduce food insecurity through the development of successful subsistence and smallholder producers. The programme will focus on the organisation of subsistence and smallholder farmers into producer groups at local, district and provincial level and assist them to network with established commodity organisations. The emphasis will be on value chain development and to facilitate the development of sectoral employment generation programmes.
PROBLEM STATEMEnT
Rural areas continue to be marginalised economically. There are high levels of food insecurity and people are highly dependent on social grants. The looming high food prices, lack of requisite skills and inadequate support of resources are some of the factors contributing to high levels of food insecurity. There is reluctance among investors to plough resources in rural areas because of underdevelopment.
iMPLEMEnTATiOn STRATEgy
At policy level through consultation with stakeholders, a national policy on food security integrating agriculture, forestry and fisheries to ensure national and household food security will be formulated. The strategic intent of the policy is to create a regulatory framework to mitigate against high global food prices and market manipulation and to give effect to government vision of a united and prosperous sector which is free of social ills.
The Food Security Policy will be backed by the Zero Hunger Strategy which will form a key pillar of the Strategic Plan for Smallholder Producers. Working with sector partners, the private sector and relevant programmes within the DAFF, we will encourage the establishment of one or two primary commodities supported by a valueaddition plant in each municipality.
Through a comprehensive smallholder producer development plan the provision of training, mentorship and extension will be aligned to relevant commodities within a given cluster of municipalities. As a mechanism to increase the accountability of extension personnel, a geospatial (smart pen) technology will be rolled out in all the provinces. A database of active subsistence and smallholder producers will be generated and a booklet with the names and contact numbers of all extension officers and their areas of operation will be published. The latter will be used to link up producers with extension officers in their areas of operation.
Through a partnership with the National Skills Fund in the DHET smallholder producers will receive commodityfocused training and mentorship.
ExPEndiTURE TREndS
The spending focus over the medium term will contribute to the creation of vibrant, equitable and sustainable rural communities (government outcome 7), facilitating the increase in the number of farmers generating produce for sales purposes from the current 4% to 10% over the medium term, and accelerating the national ERP.
Expenditure increased from R628,6 million in 2007/08 to R1,1 billion in 2010/11, at an average annual rate of 20,2%, because of a oneoff allocation in 2007/08 of R700 million for the Land Bank recapitalisation. The significant increase is the result of the 222,3% expenditure increase in the National Extension Support Services subprogramme as a result

PART B: Strategic objectives
37
of the CASP grant extension that was introduced in 2008/09. Expenditure is projected to increase to R1,6 billion over the medium term at an average annual rate of 12,6%. This growth is the result of allocations of R400 million over the medium term for the CASP. The 23,5% decrease in 2011/12 in goods and services over the MTEF period is the result of a oneoff allocation for the outbreak of avian influenza and classical swine fever.
The budget for food security and agrarian reform consists mainly of the CASP and the Ilima/Letsema Fund. These funds were mainly dedicated to agriculture. There is currently no dedicated fund to integrate the forestry and fisheries sectors to support the development of smallholder producers. In general the support provided is not integrated and this calls for a onestopshop funding facility in support of smallholder producers. There is a need to emerge with project specific public private partnerships as the available state funds cannot match the needs of existing and new smallholder producers.
The ratio of administrative cost to line function cost is 1:1.
RESOURCE ALLOCATiOn (extracted from vote 26, Estimates of national Expenditure, 2011)
Programme: Food Security and Agrarian Reform2011/12 2012/13 2013/14
R’000 R’000 R’000
Per Subprogramme
Management Food Security Sector Capacity Development National Extension Support Services
2 064 777 200 125 124 339 807
2 230 886 972 133 292 357 219
2 353 1 039 284
141 214 376 141
1 244 195 1 379 713 1 558 992
Economic classification
Compensation of employees 88 537 68 595
47 1 049 684
37 332
94 265 74 873
48 1 170 323
40 204
99 512 Goods and services 79 648 Interest and rent on land 49 Transfers and subsidies 1 338 076 Payments for capital assets 41 707
1 244 195 1 379 713 1 558 992
Agricultural Production, Health and Food Safety
PURPOSE
Manage the risks associated with animal diseases, plant pests, genetically modified organisms (GMOs) and registration of products used in agriculture, promote food safety and create an enabling environment for increased and sustainable agricultural production.
The programme comprises three subprogrammes, namely Plant Production and Health; Animal Production and Health; and Inspection and Laboratory Services.
Plant Production and Health: Focuses on increasing agricultural productivity with the emphasis on a sustainable plant production system, efficient use of genetic resources and manages risks associated with plant pests, diseases and GMOs.
Animal Production and Health: Aims to improve livestock production through the implementation of animal production and health strategies, projects and programmes founded on sound animal disease risk management principles, an informed extension service and sustainable natural resource management.
inspection and Laboratory Services: Focuses on the provision of leadership, guidance and support in ensuring compliance with agricultural legislation and regulatory frameworks and overseeing the effective implementation of risk management strategies and plans for regulated agricultural products.

DAFF Strategic Plan 2011/12–2014/15
38
PROgRAMME dELivERABLES
Strategic objective Strategic outcome Outcome indicators Strategic interventions2011/12–2014/15
Strategic goal 1: Increased profitable production of food, fibre and timber products by all categories of producers (subsistence, smallholder and commercial)
SO 2: Coordinate government food security initiative
Sustainable agrarian reform Contribute to the increase of the number of smallholder farmers from 200 000 to 250 000, for crop and animal production
Facilitate programmes, schemes and support packages for smallholder farmers
Strategic goal 3: Effective national regulatory services and risk management systems
SO 1: Promote safe food by managing the level of risks associated with food, diseases, pests and natural disasters
Promotion of compliance to quality standards and sanitary and phytosanitary measures to exporters and importers
Rapid response to outbreaks of animal and plant diseases
Strategies, policies and regulations developed
Increase the number of regulatory compliance and monitoring interventions (policies, legislation, strategies, regulations, risk analysis, inspections, surveys, testing and diagnosis, permits and certification)
Strategic goal 5: Increased contribution of agriculture, forestry and fisheries sector to economic growth and development
SO 2: Increase the level of public and private investment for agricultural, forestry and fisheries products
More labourabsorbing growth
Programmes to support production strategy implemented
Create enabling environment and partnerships for the support of the Production Strategy
STRATEgiC OBJECTivES
Strategic goal
Strategic objective indicator
Target
2011/12 2012/13 2013/14 2214/15
1 2: Coordinate government food security initiative
Number of animal schemes implemented and monitored
9 9 9 9
Implemented commodity strategies (red meat, milk, poultry and pigs)
1 1 1 1
Percentage of veterinary graduates deployed for Compulsory Community Service (CCS)
CCS Framework completed
CCS Framework approved by Parliament
100% deployed 100% deployed
Number of animalidentification marks issued
32 000 32 000 32 000 32 000
Number of export facilities inspected
20 20 20 20
Number of laboratories approved by the DAFF
24 24 24 24
Surveillance reports published
2 2 2 2
Disease reports submitted
4 4 4 4

PART B: Strategic objectives
39
Strategic goal
Strategic objective indicator
Target
2011/12 2012/13 2013/14 2214/15
1 (cont.) Number of support interventions implemented
Regulatory support (phytosanitary measures, early warning systems, legislative compliance)
Regulatory support
Regulatory support
Regulatory support
Technical support (norms, standards and guidelines)
Technical support
Technical support
Technical support
Promotion and awareness
Promotion and awareness
Promotion and awareness
Promotion and awareness
3 1: Promote safe food by managing the level of risks associated with food, diseases, pests, natural disasters and trade
Number of reports on regulatory compliance and monitoring interventions
4 4 4 4
Approved regulatory framework instruments
Fertilizers and Farm Feeds Act
Liquor Products Act
Policy on the Food Control Agency
Draft Food Safety Bill
Food Safety Act
5 2: Increase the level of public and private investment for agricultural, forestry and fisheries products
Number of commodity strategies implemented
2 key commodity strategies implemented
1 key commodity strategy implemented
1 key commodity strategy implemented
Evaluation and review of the national production strategy
OvERviEw
The increase in food prices and the recent occurrence of diseases will require increased investment in sustainable production systems. In the third quarter of 2009 the overall costs of production inputs started showing moderate declines following months of increases.
According to the National Crop Estimates Committee, the 2009/10 maize crop was 12,82 million tons, which is 6,3% more than the 12,05 million tons of 2008/09. The prices of white maize and yellow maize continued declining in 2010, with the white maize price decreasing by 25% and the yellow maize price decreasing by 15% compared to 2009. Wheat production for 2010 is expected to be 19,8% lower than in 2009. All these will require appropriate strategies, especially to address winter cereal shortages. Comprehensive input support packages will be considered for the coming three years.
The recent climatic changes will have an impact on our production systems and occurrences of plant and animal diseases will require us to strengthen our early warning systems, adaptation and mitigation strategies. Further investment is required to concentrate on new technologies which address these climatic challenges. Farmers will have to plan according to the early warning information received from both government and the private sector. Some commodities might not be suitable for certain areas because some of the areas might be colder or receive more rain or experience drought. Solid partnerships with the private sector will have to be established.
With regard to outbreaks of plant and animal diseases, old methodologies will have to be considered. Increasingly, surveillance systems in all areas, especially in the rural areas, will have to be strengthened. The planning should be such that each ward in every community has an animal health technician who can provide primary animal health care services to all.
The recent outbreak of Rift Valley fever and its impact on human health will require accessible awareness programmes, especially to the farmworkers, and strengthened relations with the Department of Health. The recent spread of Bactrocera invadens (invader fruit fly) all over Africa will also require harmonised surveillance systems and cooperation across borders.

DAFF Strategic Plan 2011/12–2014/15
40
PROBLEM STATEMEnT
The recent low prices of maize and increased input costs, make farming an unprofitable business. For the small farmers, lack of resources and rising mechanisation costs will require government intervention to support smallholder production systems. This will impact negatively on our national food security. A reliable biosecurity system will be required to ensure safe and nutritious food.
The continuing lack of investment in our laboratories will reduce South Africa’s capacity to provide reliable diagnostic services. Lack of ensuring that qualified scientists are nurtured within government, will result in a situation in which more marketable individuals leave the state service. The surge in trade and increased movement of people, have resulted in an increase in biosecurity risks. The implementation of the Consumer Protection Bill will also pose a challenge, especially on matters relating to GMOs.
iMPLEMEnTATiOn STRATEgy
The department will work with all stakeholders to ensure increased production. The implementation of the three main objectives of the sector will be strengthened. A greater effort will be made to support smallholder production systems. Early warning systems will be strengthened and the department will work with other government departments to ensure proper implementation. Contribution to developing the rural areas and creating jobs within the sector will be prioritised.
In addition to the above, the programme will improve the performance of services rendered. All markets opened will have to be publicised to ensure access to information.
ExPEndiTURE TREndS
Over the MTEF expenditure is expected to increase to R1,048 billion in 2013/14, at an average annual rate of 10,9%. This is due to additional allocations over the medium term of R200 million, R400 million and R420 million to further strengthen Ilima/Letsema and new allocations of R80 million, R120 million and R126 million for the implementation of compulsory community services for veterinarians and the implementation of the Primary Animal Health Care Programme.
Adequate funds which support production and investment in new technologies will be required to ensure proper implementation of government priorities. Alternative cost recovery mechanisms will have to be considered, especially for those who can afford to pay for such services. Investment in new technologies and ensuring that research provides answers for some of the challenges experienced, will ensure that the department is in a position to support the agricultural sector. Private sector investment in research is also required.
RESOURCE ALLOCATiOn (extracted from vote 26, Estimates of national Expenditure, 2011)
Programme: Agricultural Production, Health and Food Safety2011/12 2012/13 2013/14
R’000 R’000 R’000
Per subprogramme
ManagementInspection and Laboratory ServicesPlant Production and HealthAnimal Production and Health
1 878 249 172 477 939 162 934
2 029 277 786 505 025 209 417
2 140 295 656 530 232 220 368
891 923 994 257 1 048 396
Economic classification
Compensation of employeesGoods and servicesInterest and rent on landTransfers and subsidiesPayments for capital assets
294 493 148 331
60 406 966 42 073
349 307 210 757
63 427 271
6 859
368 083 222 661
60 450 769
6 823
891 923 994 257 1 048 396

PART B: Strategic objectives
41
Forestry
PURPOSE
Develop and facilitate the implementation of policies and targeted programmes to ensure management of forests, sustainable use and protection of land and water as well as managing agricultural risks and disasters.
There are three subprogrammes in the Forestry Programme, namely Forestry Operations; Forestry Development and Regulations; and Natural Resources Management.
Forestry Operations: To ensure sustainable management of forestry operations through managing state forests and woodlands, other state assets in the region and to render coordination and operational support.
Forestry development and Regulations: Ensures effective development of policies for forestry regulation and oversight by promoting the optimum development of arboriculture, commercial and urban forestry and the development of smallscale forestry.
natural Resources Management: Will facilitate the development of infrastructure and the sustainable use of natural resources through an enabling framework for the sustainable management of woodlands and indigenous forests, the efficient development and revitalisation of irrigation schemes and water use. The subprogramme will facilitate climate change mitigation and adaptation, risk and disaster management as well as promote, regulate and coordinate the sustainable use of natural resources (land and soil).
PROgRAMME dELivERABLES
Strategic objective Strategic outcome Outcome indicators Strategic interventions2011/12–2014/15
Strategic goal 5: Increased contribution of agriculture, forestry and fisheries sector to economic growth and development
SO 2: Increase the level of public and private investment for agricultural, forestry and fisheries products
More labourabsorbing growth
Sector strategies to support growth of labourintensive industries
Create enabling environment for planting 40 000 ha
Refurbishment of category B and C plantations
Strategic goal 1: Increased profitable production of food, fibre and timber products by all categories of producers (subsistence, smallholder and commercial)
SO 2: Coordinate government food security initiative
Sustainable agrarian reform The number of smallholder farmers increased from 200 000 to 250 000
Provide support to 10 000 new small growers
The efficiency of water use improved
Support refurbishment and maintenance of 2% smallholder government irrigation schemes
Jobs through community works and EPWP in rural areas created
Facilitate the creation of 5 200 job opportunities
Enabling institutional environment for sustainable and inclusive growth
Disaster management and mitigation systems to facilitate a rapid response established in rural municipalities
Develop and implement disaster risk mitigation strategies
Strategic goal 2: Sustained management of natural resources
SO 2: Ensure the sustainable management and efficient use of natural resources
Reduced climate change and improved air/atmospheric quality
Climate impact identified and adaptation framework developed
Develop and implement climate change adaption plans
Sustainable environmental management
32 million ha of degraded indigenous forests and woodland rehabilitated by 2014
3 200 ha of indigenous forests and woodland rehabilitated

DAFF Strategic Plan 2011/12–2014/15
42
Strategic objective Strategic outcome Outcome indicators Strategic interventions2011/12–2014/15
SO 2 (cont.) 3 200 ha of land rehabilitated
Increase number of hectares of agricultural land under rehabilitation
Reduced climate change impacts on biodiversity
Develop and implement climate change adaptation plans
STRATEgiC OBJECTivES
Strategic goal
Strategic objective indicator
Target
2011/12 2012/13 2013/14 2214/15
1 2: Coordinate government food security initiative
Number of small growers supported
2 500 2 500 2 500 2 500
Number of jobs created
1 300 fulltime equivalents (FTEs)
1 300 FTE 1 300 FTE 1 300 FTE
Disaster risk mitigation strategies implemented
Disaster risk management system developed
Disaster risk management system implemented
Disaster risk management system implemented
Disaster risk management system reviewed
2 1: Promote environ mentally sustainable production systems
Number of government irrigation schemes revitalised for smallholder farmers
0,5% 0,5% 0,5% 0,5%
2: Ensure the sustainable management and efficient use of natural resources
Number of hectares rehabilitated
800 000 ha 800 000 ha 800 000 ha 800 000 ha
Climate change adaptation plans implemented
Climate change adaptation plans developed
Climate change adaptation plans implemented
Climate change adaptation plans implemented
Climate change adaptation plans reviewed
5 2: Increase the level of public and private investment for agricultural, forestry and fisheries products
Number of hectares planted (Forest Sector Transformation Charter)
10 000 ha 10 000 ha 10 000 ha 10 000 ha
OvERviEw
The expansion of the South African forest estate with a view to conserve and improve the quality of these forests, to secure the supply for downstream processing and through the complete value chain increase the economic contribution of the sector to the country’s GDP, will be a priority for the DAFF.
The outputs of protected biodiversity (land protection) are that 81% of all agricultural land and land rehabilitation of 800 000 ha per annum will be protected through the LandCare Programme and the Compliance and Enforcement Strategy as well as the Soil Conservation and Fencing Scheme. The 800 000 ha account for 1% of agriculture’s contribution to the annual reduction of soil degradation. The mobilisation of resources and mainstreaming of sustainable land use practices to other stakeholders will be explored to ensure their programmes contribute to reduction of soil degradation to the envisaged 55%. The regulatory and programme incentives of best practices, such as conservation agriculture, will be strengthened to contribute to the reduction of soil degradation and increase adoption of sustainable practices.

PART B: Strategic objectives
43
The Forest Sector Transformation and Growth Charter that has been published in terms of the BroadBased Black Economic Empowerment Act, 2003 (Act No. 53 of 2003) will be one of the main focus areas of the programme, especially in terms of delivery on charter commitments. The administration, implementation and enforcement of the National Forests Act, 1998 (Act No. 84 of 1998) and the National Veld and Forest Fire Act, 1998 (Act No. 101 of 1998) remain the other main focus area.
Sustainable use and management of natural resources underpins the agricultural, forestry and fisheries sectors. The department’s aim is to provide policy advice on access to water arrangement for all users, promoting its efficient allocation and use; and coordination of programme implementation to ensure forestry production. This will be undertaken sustainably, within the capacity of the landscape and climate. This includes encouraging landowners, primary industries, communities and regions through targeted programmes to maintain and improve the natural resource base on which agricultural production relies—soil, vegetation, water and the atmosphere.
The DAFF will implement innovative ways to enhance and streamline the regulatory environment to ensure compliance while promoting the fair and equitable distribution of their economic, social, health and environmental benefits. The purpose will be to increase the contribution of all types of forests and related goods and services, support conservation of forest biological diversity, ecosystems and habitats with particular focus on rural and disadvantaged commun ities.
The development of water resource assessment methodologies will be coordinated to support national and regional reporting and water accounting; and mitigation and adaptation measures will be developed against the risks of disaster and climate change.
To enhance the profile of the sector, the department will improve contributions to skills development, awareness raising and information sharing.
PROBLEM STATEMEnT
The sector has experienced a number of challenges which hampered it from achieving its full potential contribution to job and wealth creation as well as conservation of biological diversity.
The following challenges threaten the longterm sustainability of the sector and represent the areas on which the programme will focus:
• Security of tenure and postsettlement support are major requirements for forestry investment and development and, because of the protracted land reform process, tenure has not been secured. Linked to this is postsettlement support to communities.
• Timber shortage in some parts of the country has an adverse effect on the sustainability of local sawmilling, pulp and paper operations and subsequently poses a threat to employment opportunities and local economies.
• Afforestation and forestry enterprise development require access to financial and extension support services.
• The Forest Sector Transformation Charter identifies the dire shortage of critical, scarce and core skills as well as shortcomings in skillsdevelopment infrastructure in the sector as key constraints to transformational growth.
• Forest sector research and development activities suffer from underfunding, lack of coordination and a declining skills base.
• Climate change will have a significant impact on forestry.
• Only 6,8% of South Africa’s total land area is currently under formal protection and where protection measures are in place there remain persistent pressures on protected areas from neighbouring communities, industrial and mining developments as well as urban development. Certain forest types, including woodlands, are under pressure from resource utilisation and development.
• Unsustainable landuse practices. While demands for soil use are growing, the problems of unsustainable landuse practices are intensifying in many parts of the country. Unsustainable farming practices have contributed to increased acidification, reduction in organic matter and soil erosion.
• The low level of conservation ethics, minimum compliance and enforcement thereof, and soil degradation caused by a variety of factors, have been identified as threats to the soil fertility and productivity of the sector.
• The sector is also constrained by continuous pressure for change of landuse limits of 3% nonrenewable highpotential agricultural land.
• Land degradation is linked directly to global climate change in several ways. Loss of vegetative cover and soils is one of the main factors in global warming through the release of organic carbon into the atmosphere and a reduction in the carbonsequestration capacity of the land.

DAFF Strategic Plan 2011/12–2014/15
44
iMPLEMEnTATiOn STRATEgy
The Forestry 2030 Roadmap includes an implementation strategy with deliverables and timeframes. An implementation strategy has also been developed for the implementation of the Forest Sector Transformation Charter. Existing programmes will be utilised to assist the Forestry Programme in achieving its deliverables in terms of support to SMMEs, including the Land and Agrarian Reform Project (LARP) and CASP. In terms of the management of commercial plantations, the department will implement the annual plans of operations with assistance from the Working for Forests Programme and through outsourcing of silviculture work.
The department will furthermore explore opportunities in terms of its relationship with the FAO to facilitate the integrated assessment of forest resources. The Development Bank of Southern Africa (DBSA) will assist in terms of the finalisation of the transfer of plantation assets to land reform beneficiaries, while the administration and enforcement of the National Forests Act, 1998 (Act No. 84 of 1998) and the National Veld and Forest Fire Act, 1998 (Act No. 101 of 1998) will be done by both the national and the regional offices. The Working for Fire Programme will be used to assist in terms of awareness raising and building capacity in communities to prevent and combat veldfires. The target set for the Million Trees Programme will be met through cooperation with and contributions made by various partners, with Total SA as the main sponsor of the Arbor Week celebrations.
The demand to meet the increasing food needs of the country and challenges associated with land degradation necessitate a thorough coordinated and collaborative strategic approach across the spectrum of role players such as the DAFF, provincial counterparts, other government departments, research institutions and communities to work together towards better implementation and enhanced service delivery. The subworking group of the Intergovernmental Technical Committee for Agriculture, Forestry and Fisheries (ITCAFF) on natural resource management has adopted outputs that will assist in attaining government outcomes which seek to protect and enhance our environmental assets and natural resources. The outputs relate to enhanced quality and quantity of water resources (water resources protection through wetland rehabilitation). The aim of sustainable natural resource management is to reduce land affected by soil degradation from 70% to 55%.
ExPEndiTURE TREndS
The focus over the medium term will be on the management of forestry operations, amendment and implementation of the National Veld and Forest Fire Act, 1998 (Act No. 101 of 1998). This will also include the implementation of policies that promote forestry growth; the participation of communities in forestry; activities related to the Forest Sector Transformation Charter and forestry protection; LandCare; climate change; afforestation; and the Million Trees Programme.
Expenditure decreased from R881 million in 2007/08 to R755 million in 2010/11, at an average annual rate of 5%. The decrease was the result of the oneoff allocations for disaster management, which decreased from R300 million in 2007/08 to R50 million in 2010/11. Expenditure is expected to increase from R755 million in 2010/11 to R935,7 million in 2013/14, at an average rate of 7,4%. This is the result of an increase of R55 million in 2012/13 and R45 million in 2013/14 for the LandCare fencing project and the increase in the baseline of R34 million in 2011/12, R57 million in 2012/13 and R60 million in 2013/14 to provide funding for forestry operations in Mpumalanga.
The ratio of administrative costs to line function costs is 1:4.
RESOURCE ALLOCATiOn (extracted from vote 26, Estimates of national Expenditure, 2011)
Programme: Forestry2011/12 2012/13 2013/14
R’000 R’000 R’000
Per subprogramme
ManagementForestry OperationsForestry Oversight and RegulationNatural Resources Management
3 968 369 487 78 171
319 085
4 286 419 210 85 328
393 653
4 522 439 259 92 953
398 958
770 711 902 477 935 692
Economic classification
Compensation of employeesGoods and servicesInterest and rent on landTransfers and subsidiesPayments for capital assets
420 260 262 021
1 298 60 834 26 298
450 759 300 953
1 403 118 848 30 514
474 737 314 559
1 456 112 551 32 389
770 711 902 477 935 692

PART B: Strategic objectives
45
Fisheries
PURPOSE
Promote the development, management, monitoring and sustainable uses of marine living resources and the development of South Africa’s fisheries sectors. Sustainable livelihoods will be achieved through aquaculture growth and fisheries economic development.
The programme comprises four subprogrammes, namely Aquaculture and Economic Development; Fisheries Research and Development; Marine Resource Management; and Monitoring, Control and Surveillance.
Aquaculture and Economic development: Will ensure aquaculture growth and fisheries economic development for sustainable livelihoods by providing public support and an integrated platform for management of aquaculture.
Fisheries Research and development: To ensure the promotion of the sustainable development of fisheries resources and ecosystems by conducting and supporting appropriate research.
Marine Resource Management: Ensures the sustainable utilisation and equitable and orderly access to the marine living resources through improved management and regulation.
Monitoring, Control and Surveillance: Ensure the protection and promotion of sustainable use of marine living resources by intensifying enforcement and compliance.
PROgRAMME dELivERABLES
Strategic objective Strategic outcome Outcome indicators Strategic interventions2011/12–2014/15
Strategic goal 5: Increased contribution of agriculture, forestry and fisheries sector to economic growth and development
SO 2: Increase the level of public and private investment for agricultural, forestry and fisheries products
More labourabsorbing growth
Sector strategies to support growth of labourintensive within the fisheries sector
Marine Resource Management Strategy
Smallscale fisheries policy
Strategic goal 1: Increased profitable production of food, fibre and timber products by all categories of producers (subsistence, smallholder and commercial)
SO 2: Coordinate government food security initiative
Sustainable agrarian reform Establishment of 80 aquaculture farms
Aquaculture sector development
Rural job creation and promoting economic livelihoods
Create jobs through community works and EPWP in rural areas (including valueadded services)
Community empowerment and support through Working for Fisheries Programme
Enabling institutional environment for sustainable and inclusive growth
Establishing of community structures to support social cohesion and development
Facilitate fishery programmes for economic development
Strategic goal 2: Sustained management of natural resources
SO 2: Ensure the sustainable management and efficient use of natural resources
Rebuild depleted fish stocks Extent of recovery of abalone; hake; West Coast rock lobster and linefish
Fisheries research to inform TAC/TAE and Stock Recovery Strategy for Hake, Abalone, West Coast Rock Lobster and Linefish
Compliance with and enforcement of marine and coastal legislation
Percentage of fish landings in five key fisheries (hake; abalone; squid; linefish and rock lobster) inspected and spot checks conducted in other sectors:
Integrated Fisheries Security Strategy

DAFF Strategic Plan 2011/12–2014/15
46
Strategic objective Strategic outcome Outcome indicators Strategic interventions2011/12–2014/15
Strategic Goal 6: Effective and efficient governance
SO 1: Establish and strengthen cooperative governance and functional relations with local and inter national stakeholders
Advancement of the African Agenda and sustainable development
Contribution to regional, continental security and stability
Strengthened contribution to peace missions
Stakeholder engagement, management and communication
Enhanced regional integration
Reformed global governance and peace and security institutions
Deepen technical and development cooperation
Integrated Fisheries Security Strategy
Enhanced trade and investment
Enhanced representation and strengthened regional, continental and global platforms
Increased export growth in target economies
STRATEgiC OBJECTivES
Strategic goal
Strategic objective indicator
Target
2011/12 2012/13 2013/14 2214/15
1 2: Coordinate government food security initiative
Increase number of fish farms from 84 to 96
3 3 3 3
Increase number of fish processing facilities from 60 to 70
2 3 3 2
Increase proclaimed fishing harbours from 12 to 19
Plan for proclaimed fishing harbours
3 Plan for additional proclaimed fishing harbours
4
Number of smallholder producer associations established
1 3 2 2
Number of community projects implemented through Working for Fisheries Programme (WFFP)
10 15 15 10
Policy and regulatory framework implemented
Finalise and implement the Smallscale Fisheries Policy
Implement the Smallscale Fisheries Policy
Monitor the implementation of Smallscale Fisheries Policy and its users
Monitor the implementation of Smallscale Fisheries Policy and its users

PART B: Strategic objectives
47
Strategic goal
Strategic objective indicator
Target
2011/12 2012/13 2013/14 2214/15
1 (cont.) Strategy implemented
Consult stakeholders and develop strategy
Implement strategy and pilot study
Continue to implement strategy
Continue to implement strategy
2 2: Ensure the Sustainable management and efficient use of natural resources
Resource assessments and catch limit recommendations for 22 fishery sectors
Research on fish stocks for 22 fishery sectors
Research on fish stocks for 22 fishery sectors
Research on fish stocks for 22 fishery sectors
Research on fish stocks for 22 fishery sectors
Feasibility reports on potential new fisheries
Investigation on feasibility of two potential new fisheries
Investigation of feasibility of two potential new fisheries
Investigation of feasibility of two potential new fisheries
Investigation of feasibility of two potential new fisheries
Revised Framework for Aquaculture Research Management (FARM)
Revise the Aquaculture Research Programme
Implement the Aquatic Animal Health pillar of FARM
Implement the Aquatic Animal Nutrition pillar of FARM
Implement the Aquaculture Breeding and Technology pillar of FARM
Recommendations on ecosystem considerations in annual catch limit recommendations
Advice on ecological considerations included in catch limit advice for 22 fishery sectors
Advice on ecological considerations included in catch limit advice for 22 fishery sectors
Advice on ecological considerations included in catch limit advice for 22 fishery sectors
Advice on ecological considerations included in catch limit advice for 22 fishery sectors
Integrated Fisheries Security Strategy (IFSS) approved and implemented
Approve and implement the strategy
Implement andmonitor progress
Review and enhance the strategy
Review and enhance the strategy
Extent of the recovery of abalone, hake, West Coast rock lobster (WCRL), and linefish
Develop a recovery plan for abalone, hake, WCRL, and linefish
Management recommendations towards targets set for the recovery of abalone, hake, WCRL, and linefish
Management recommendations towards targets set for the recovery of abalone, hake, WCRL, and linefish
Management recommendations towards targets set for the recovery of abalone, hake, WCRL, and linefish
Commercial fishing rights holders’ performance reviewed
Implement, manage and control findings of current performance review process
Implement, manage and control findings of current performance review process
Review rights holders in 2 or more fishing sectors
Continuation of review process
Commercial fishing rights allocated
Revise rights allocation policies in affected sectors
Rights allocation process established
Rights allocated for sectors in which fishing rights have expired
Rights allocation process established for rights that expire in 2015
Policy and a regulatory framework for the management of the recreational sector developed
Engagement with the recreational forum and other stakeholders
Expanded public participation process in developing a draft policy
Develop and gazette draft policy
Finalise policy

DAFF Strategic Plan 2011/12–2014/15
48
Strategic goal
Strategic objective indicator
Target
2011/12 2012/13 2013/14 2214/15
2 (cont.) Framework for the Management of Fish Processing Establishments (FPEs) developed
Develop guidelines for managing an allocation process for FPEs
Continue to allocate FPE rights
Continue to allocate FPE rights
Continue to allocate FPE rights
National programmes of action (NPAs) for sharks, turtles, and fleet capacity
Finalise and implement NPA for sharks
Finalise and implement NPA for fleet capacity
Finalise and implement NPA for turtles
Continued implementation and review the NPA for seabirds
Ecosystem approach to fisheries (EAF) considerations implemented in fisheries
Establish the Branch EAF Steering Committee and set priorities
Review ecological risk assessments in relevant fishing sectors
Review ecological risk assessments in relevant fishing sectors and implement priority EAF management objectives
Review ecological risk assessments in relevant fishing sectors and implement priority EAF management objectives
Review ecological risk assessments in relevant fishing sectors and implement priority EAF management objectives
Fisheries management plans
Draft fisheries management plans for 1 offshore and 1 inshore fishing sector
Draft fisheries management plans for 2 or more fishing sectors
Draft fisheries management plans for 2 or more fishing sectors
Draft fisheries management plans for 2 or more fishing sectors
Number of sector stakeholder forums in place
Improve existing stakeholder forums and establish smallscale fishing and recreational fishing forums
Maintain and enhance management working groups and comanagement committees
Maintain and enhance management working groups and comanagement committees
Maintain and enhance management working groups and comanagement committees
5 2: Increase the level of public and private investment for agricultural, forestry and fisheries products
Amalgamated freshwater and marine aquaculture policies
National Aquaculture Strategy (NAS) and action plan
Aquaculture Certification Plan (ACP) and implementation of the NAS
Monitoring of the NAS andimplementation of the ACP
Review and amalgamate the freshwater and marine aquaculture policies
Approved Fisheries Charter
Conduct a study on transformation in fisheries
Development of the discussion document for stakeholder engagement
Development of the Fisheries Charter
Implementation of the Fisheries Charter
OvERviEw
South Africa is an important coastal range state because of its strategic location. Being bordered by the Indian and Atlantic Oceans and influenced by the Southern Ocean, its marine and coastal biodiversity is exceptionally high. The warm Algulhas current as well as the cold, highly productive Benguela current, provides unique opportunities for economic activity, especially for fishing. South Africa has a welldeveloped fisheries management system and is a leading state in terms of the implementation of an EAF management. South Africa also plays an important role internationally, e.g. in regional fisheries management organisations (RFMOs) and regional programmes such as the Benguela Current Commission (BCC) and other related programmes.

PART B: Strategic objectives
49
The coast, being the meeting place of land and sea, forms a distinctive, complex and interconnected natural system with finite and valuable resources that are impacted upon by human and environmental perturbations such as pollution, inappropriate development and environmental degradation. It provides substantial opportunities for economic and social development.
South Africa has a wellestablished fishery sector, comprising two components, wild capture fisheries which range from highlyindustrialised capitalintensive fishing sectors to more accessible fishing sectors, including subsistence fisheries and an aquaculture component which is under development.
The Marine Living Resources Fund receives transfers for the management and sustainable use of marine living resources to supplement the revenue received from levies on fish and fish products, for permits and application fees and the proceeds from the sale of confiscated fish and fish products.
PROBLEM STATEMEnT
Although South Africa has a wellestablished fishery sector, conversely; the sector faces a number of challenges which limit it from realising its ability to contribute to key government imperatives of sustainable use of marine living resources and ensuring food security for all. The following challenges are highlighted and will therefore inform the key strategic areas the branch will focus on:
• Limited natural resources: Over the years the sector has experienced depletion and collapse of some fisheries, while on the other hand, there is a growing reliance on the resources as a source of food security for many communities. This, in turn, poses challenges to the department to consider recovery measures for depleted stocks, broadening the scope of aquaculture as well as empowering fishing communities on alternative livelihood avenues in order to ensure sustainable food security.
• Access to markets: Persistent changes in the global market conditions continue to pose challenges to the fishing sector’s ability to access markets for the exportation of fishing products and economic growth.
• Climate change: This has resulted in the migration of natural resources from their original habitat, leading to increasing levels of poverty, unemployment, infrastructure dilapidation because of either closure and/or migration of fishing processing facilities to other areas.
• illegal fishing: Fisheries generally is a highly contested industry, both locally and globally. It is plagued with syndicated crime, overexploitation of highvalue species, corruption and poor compliance levels. Hence, the department must introduce comprehensive responses to this complex, highly technical and technologically advanced challenge of local and international organised crime.
• Capacity constraints: The branch does not have the human, financial and infrastructure resources required to deliver excellent services to its stakeholders and communities at large.
iMPLEMEnTATiOn STRATEgy
The implementation strategy as aligned to the service delivery agreement will focus on the following key strategic thrusts:
• By embarking on fisheryspecific research, which will inform the setting of total allowable catches and effort (TACs/TAEs) in 22 fishing sectors and implement the Stock Recovery Strategy for Hake, Abalone, West Coast Rock Lobster and Linefish. The department will finalise and implement the Smallscale/subsistence Fisheries Policy, broaden the scope of the aquaculture sector and develop and implement a proactive stakeholder engagement strategy.
• The Fisheries Sector Charter will be developed and implemented in the medium term to ensure achievement of transformation imperatives within the fishing sector. Implantation of the IFSS is a key deliverable which will intensify visibility of compliance, and monitoring and enforcement efforts. The DAFF has committed itself to job creation and promoting sustainable/alternative and economic livelihoods through working for Working for Fisheries; social responsibility programmes and projects (SRPP) and decentralisation of the customer service stations as key flagship projects, etc.
ExPEndiTURE TREndS
Spending over the medium term will be focused on conducting fishery specific research to inform the setting of TAC in 22 fishing sectors; implementing the Stock Recovery Strategy for Hake, Abalone, West Coast Rock Lobster and Linefish; finalising and implementing the Smallscale Subsistence Fisheries Policy; broadening the scope of the aquaculture sector; developing and implementing the proactive Stakeholder Engagement Strategy; developing and finalising the

DAFF Strategic Plan 2011/12–2014/15
50
Fisheries Charter to meet transformation targets within the fishing sector; developing and implementing the Integrated Fisheries Security Strategy to ensure better compliance, monitoring and enforcement efforts; and promoting job creation and sustainable economic livelihoods.
Expenditure increased from R149,8 million in 2007/08 to R283,5 million in 2010/11, at an average annual rate of 23,7% and is projected to increase to R333,5 million over the medium term, at an average annual rate of 5,6%. The increase in both periods is the result of increased allocations for vessel operations and function shifts from the DEA.
The ratio of administrative costs to line function costs is 1:3
RESOURCE ALLOCATiOn (extracted from vote 26, Estimates of national Expenditure, 2011)
Programme: Fisheries2011/12 2012/13 2013/14
R’000 R’000 R’000
Per subprogramme
ManagementAquacultureAdministrative support servicesMarine Living Resources Fund
264 24 620
108 805 190 499
277 25 852
114 245 250 825
290 27 145
119 960 186 128
324 188 391 199 333 523
Economic classification
Compensation of employeesGoods and servicesInterest and rent on landTransfers and subsidiesPayments for capital assets
133 689 – –
190 499 –
140 374 – –
250 825 –
147 395 – –
186 128 –
324 188 391 199 333 523
SA FiSHing indUSTRy
wholesale value of production, 2007
Fishery Catch(tons)
Landings(tons)
wholesale value(R’000)
% of totalvalue
Demersal: offshore trawl 167 353 11 6579 261 7896 42,6Demersal: inshore trawl 10 690 7 355 147 611 2,4
Total demersal trawl 178 043 12 3934 276 5507 45,0
Purse seine (pelagic) 421 000 421 000 1 388 517 22,6Rock lobster (SC) 473 335 159 200 2,6Rock lobster (WC) 3 073 3 073 533 271 8,7Crustacean trawl 225 225 18 210 0,3Squid (jigging) 6 990 6 990 419 400 6,8Tuna pole 4 681 4 681 131 480 2,1Line fish 7 363 7 363 212 719 3,5Demersal longlining 8 520 8 520 270 000 4,4Miscellaneous nets 2 611 2 611 23 061 0,4Oysters 44 44 1 723 0,0Mariculture 3 211 3 211 214 411 3,5Seaweed 10 085 10 085 11 281 0,2
Total 646 319 592 072 6 148 780 100,0

PART B: Strategic objectives
51
wholesale value of production, 2009
Fishery Catch(tons)
Landings(tons)
wholesale value(R’000)
% of totalvalue
Demersal: offshore trawl 153 932 106 836 253 1044 43,6Demersal: inshore trawl 9 408 6 654 151 074 2,6
Total demersal trawl 163 340 113 490 268 2118 46,2
Purse seine (pelagic) 425 080 425 080 1 464 803 25,3Rock lobster (SC) 843 392 144 213 2,5Rock lobster (WC) 1 860 1 860 359 478 6,2Crustacean trawl 225 225 18 210 0,3Squid (jigging) 7 900 7 900 418 700 7,2Tuna pole 3 085 3 095 76 433 1,3Line fish 7 126 7 126 175 109 3,0Demersal longlining 8 906 8 906 160 308 2,8Miscellaneous nets 2 611 2 611 23 061 0,4Oysters 44 44 1 723 0,0Mariculture 1 900 1 900 265 000 4,6Seaweed 8 138 8 138 10 020 0,2
Total 63 1058 580 767 5 799 176 100,0
Risk ManagementIn line with section 38(1) of the Public Finance Management Act, 1999 (Act No. 1 of 1999) as amended, and section 3,2 of the Treasury Regulations, the department will implement an effective risk management and control process. The accounting officer, management and other personnel, have the responsibility to maintain effective risk management and control on their daily activities to maintain a balance between strategy, objectives, related risks and effective and efficient use of resources. The DAFF management is expected to identify potential events that may affect the department in the achievement of the objectives. The department should identify, assess, prioritise and manage risks to be within its risk tolerance, to provide reasonable assurance to achieve its objectives.
Risk management offers the following benefits to the department:
• Organisational alignment: The risk management process will complement effective strategic and operational planning by ensuring that management and staff understand and are committed to the key objectives which have been defined and performance indicators against which our success is measured.
• improved ability to manage risks: By formally identifying and evaluating risks, managers will improve the understanding of the risks which have to be managed. Furthermore, they will analyse and understand the causes of risks to ensure that internal controls manage these causes.
• improved ability to achieve objectives: By proactively identifying risks the department will have a better understanding of risks (more anticipatory) and therefore be able to achieve objectives with greater certainty.
• improved ability to seize opportunities: By understanding our risk profiles, the risk management process will enable us to seize and execute new opportunities successfully.
• Cost-effective internal controls: The risk management process will ensure that our system of internal control is cost effective. Areas of overcontrol should be identified and removed.
• Sustainability: Risk management will be embedded at all levels within the department as all management and staff will be educated on their responsibility for risk management and the effective application of internal controls.
The department has completed the Strategic Risk Assessment. The exercise was conducted by officials from National Treasury. The performance of the Operational Risk Assessment by Deloitte is in progress and will be completed in March 2011. Flowing from the risk assessment, riskrelated policies and assessments will be attended to. These include the Fraud Risk Assessment and the Fraud Prevention Plan to complement the risk assessment. The current assignment by Deloitte does not extend to the performance of these activities.


PART C
Public entities and other agencies

DAFF Strategic Plan 2011/12–2014/15
54
Agricultural Research Council
STRATegiC oveRview: 2007/08–2013/14
The ARC is a science institution established by the Agricultural Research Act, 1990 (Act No. 86 of 1990). In terms of the Act, the objectives of the ARC are to conduct fundamental and applied research; drive research and development; drive technology development and the transfer of technology (dissemination) to promote agriculture and related indus-tries; contribute to a better quality of life; facilitate and ensure natural resource conservation and alleviate poverty.
The ARC’s strategic objectives and related output are aligned with the DAFF’s mission and are directed at ensuring access to sufficient, safe and nutritious food; eliminating skewed participation and inequality in the sector; maximising growth, employment and income in agriculture and enhancing the sustainable management of the natural agricultural resources and ecological systems. To deliver on the department’s priorities in particular, the research, technology devel-opment and the transfer of technology are aimed at improving agricultural production, food security and growth, which in turn, will result in poverty alleviation.
As a public entity, the ARC’s performance and priorities must be aligned with the national priorities outlined in the MTSF. These are further refined through the council’s annual strategic review process to ensure effective delivery by alignment with the DAFF’s priorities, as well as with those of the Department of Science and Tech nol ogy.
The ARC carries out its functions in accordance with approved strategic and business plans, notwithstanding the fund-ing challenges it continuously has to face. In addition, since 2007/08, the council has met, and in some cases exceed-ed, the performance targets set out in the business plan.
The following six objectives form the basis of its Strategic Plan over the medium term:
• Generate, develop and apply new knowledge, science and technology for agriculture to meet the demands for in-creased food production, food security and poverty alleviation
• Promote the sustainable use and management of the natural resources to ensure a competitive agricultural sector and increase wealth for people and industries dependent upon natural-resource-based agriculture
• Improve nutrition and food security and safety by improving crop and livestock production systems, including seed security
• Provide information and technical solutions that will enable the agricultural sector to manage and mitigate agricul-tural risks, including threats to the agricultural practice
• Disseminate information and transfer technology emanating from research and development
• Achieve organisational growth and sustainability.
DeTAilS of PRogRAmmeS, objeCTiveS AnD ACTiviTieS
The ARC conducts fundamental and applied research with partners to generate knowledge, develop human capital and foster innovation in agriculture through technology development and dissemination, and the commercialisation of re-search results. Its main focus is on agricultural research and development, and the transfer of technology in the agri-cultural sector. In addition, 86% of its total budget is spent on the council’s core business—research and the transfer of technology. The remaining 14% of the budget is allocated to support services.
Recently, the ARC developed an early blushed pear cultivar, called Cheeky™, which is currently playing a major role in the establishment of early blush pears in Europe and other export countries. The prediction is that by the end of 2012, the total number of hectares under the cultivation of Cheeky™ will be 37% of the total early blushed pears in South Africa, with a potential income of R354 million per annum for the pear industry.
The development of Cheeky™ not only extends the blushed pear range in the South African pear industry, it is also in support of the ARC’s stategic objective to generate, develop and apply knowledge, science and technology for agricul-ture to meet the demands for increased food production, food security and poverty alleviation.
The budget allocation for the 2011/12 financial year is R144 million.

PART C: Public entities and other agencies
55
Marine Living Resources Fund
STRATegiC oveRview: 2007/08–2013/14
The Marine Living Resources Fund was established in terms of the Marine Living Resource Act, 1998 (Act No. 18 of 1998). The fund is the main source of funding for marine fisheries and coastal management, which is a branch of the national Department of Agriculture, Forestry and Fisheries. The mandate and core business of the fund is to manage the development and sustainable use of South Africa’s marine and coastal resources, as well as to protect the integrity and quality of the marine and coastal ecosystems.
The organisation regulates the use of marine resources through administering fishing rights, permits and licences. Key activities include:
• Developing and implementing a policy framework to allocate and manage long-term fishing rights in 20 commercial sectors, facilitate and manage the transfer of commercial fishing rights; conserve and protect seals, seabirds and shorebirds
• Developing a policy and management framework for the subsistence fishing sector and monitor fish stocks to pre-vent overexploitation or a negative impact on the integrity of the marine ecosystem and develop management strat-egies to rebuild depleted fish stocks.
In terms of a government proclamation of February 2010, fisheries-related functions had been transferred to the DAFF, while environmental/conservation functions remained with the DEA. Part of this transfer involves the fund moving to the DAFF with effect from 1 April 2010 to support the operational activities relating to the management of South Africa’s marine wild capture fisheries, as well as aquaculture.
The research fleet is nearing the end of its lifespan and must be replaced to minimise the risk of high maintenance costs and sea days available for surveys.
The key strategic priorities for the fisheries sector over the medium term include:
• Conducting fishery-specific research to inform the setting of TACs and efforts in 22 fishing sectors
• Implementing the Stock Recovery Strategy for Hake, Abalone, West Coast Rock Lobster and Linefish
• Finalising and implementing the Small-scale Subsistence Fisheries Policy
• Broadening the scope of the aquaculture sector
• Developing and implementing a proactive stakeholder engagement strategy
• Developing and finalising a fisheries charter to meet transformation targets within the fishing sector
• Developing and implanting the Integrated Fisheries Security Strategy to ensure better compliance, monitoring and enforcements
• Promoting job creation and sustainable economic livelihoods.
DeTAilS of PRogRAmmeS/objeCTiveS/ACTiviTieS
The fund manages the development and sustainable use of South Africa’s marine resources and protects the integrity and quality of the marine ecosystem. This entails performing specific research to inform the setting of TACs and efforts in 22 fishing sectors, and ensures the intensification and visibility of compliance, monitoring and enforcement efforts. The fund allocates 40% of its annual budget to vessel operating costs for fisheries research and patrol efforts. The department achieved 100% landings monitored in abalone, hake longline, pelagic, Western Cape rock lobster and squid at a cost of R12 million in 2010/11.

DAFF Strategic Plan 2011/12–2014/15
56
Other public entities and agencies
The following public entities also report directly to the Minister of Agriculture, Foerstry and Fisheries. Comprehensive coverage with more detailed information for Vote 26 is available on the web at www.treasury.gov.za under the budget information link.
• The national Agricultural marketing Council was established in terms of the Marketing of Agricultural Products Act, 1996 (Act No. 47 of 1996) to provide strategic agricultural marketing advice to the Minister of Agriculture, Forestry and Fisheries. The council’s total budget for 2011/12 is R32,5 million.
• ncera farms is a schedule 3B company in terms of the Public Finance Management Act, 1999 (Act No. 1 of 1999). The company has the mandate to perform development functions on identified land administered by the DAFF. The company’s total budget for 2011/12 is R4,2 million.
• onderstepoort biological Products is a state-owned company, whose mandate is to prevent and control animal diseases that have an impact on food security, human health and livelihoods. The company’s total budget for 2011/12 is R146,5 million.
• The Perishable Products export Control board is an official certification agency operating on behalf of govern-ment to control all perishable export products. The company’s total budget for 2011/12 is R164,3 million.

ANNEXURE 1
Annual performance plans

DAFF Strategic Plan 2011/12–2014/15
58
Administration
DiREctoRAtE: iNfoRmAtioN AND commUNicAtioN tEchNology
Strategic goal 6: Effective and efficient governance
Strategic objective 5: Provide leadership and manage communication and information
Key objective Baseline Output Output indicator Target Time frame
Responsibility
Ensure migration and integration of the DAFF systems
70% migration and integration
Systems migrated and integrated into the DAFF network
Integrated system 1 Q4 D: ICT
Integrate and review MSP
Agriculture MSP Integrated MSP for the DAFF
Approved MSP by DEXCO
1 Q4 D: ICT
DiREctoRAtE: KNowlEDgE AND iNfoRmAtioN mANAgEmENt
Strategic goal 6: Effective and efficient governance
Strategic objective 5: Provide leadership and manage communication and information
Key objective Baseline Output Output indicator Target Time frame
Responsibility
Review and implement phase 1 of KIM Strategy
Draft KIM Strategy KIM Strategy Approved KIM Strategy by DEXCO
1 Q4 D: KIM
DiREctoRAtE: hUmAN RESoURcES mANAgEmENt
Strategic goal 6: Effective and efficient governance
Strategic objective 3: Provide effective audit, investigative and legal, human resources and financial risk management
Key objective Baseline Output Output indicator Target Time frame
Responsibility
Reduce vacancy rate
12% (current post establish ment)
Vacancy report on percentage reduc-tion in vacancy rate
Approved report by the CD
14% Q4 D: HRM
DiREctoRAtE: EmPloyEE RElAtioNS
Strategic goal 6: Effective and efficient governance
Strategic objective 3: Provide effective audit, investigative and legal, human resources and financial risk management
Key objective Baseline Output Output indicator Target Time frame
Responsibility
Have SMS members trained on disciplinary procedures
40% SMS members trained
Trained SMS members on disciplinary procedures
Percentage of SMS members trained on disciplinary procedures
60% Q4 D: ER
Align HRM policies and practices with operational objectives
10 HRM policies aligned and approved
HRM policies aligned and approved
Number of HRM policies approved by DEXCO
20 Q4 D: ER

Annexure 1: Annual performance plans
59
DiREctoRAtE: EmPloyEE DEvEloPmENt AND PERfoRmANcE mANAgEmENt
Strategic goal 6: Effective and efficient governance
Strategic objective 3: Provide effective audit, investigative and legal, human resources and financial risk management
Key objective Baseline Output Output indicator Target Time frame
Responsibility
Ensure adherence to PMDS
PMDS adherence Report on adherence to PMDS
Approved report on 80% adherence by the CD
1 Q4 D: EDPM
Review HRD Strategy
Draft HRD Srategy HRD Strategy Approved strategy by the DG
1 Q3 D: EDPM
Implement HRD Strategy
HRD Strategy Imple-mentation Plan (excl. forestry and fisheries)
DAFF HRD Strategy Implementation Plan
Report on 30% implementation
Implementation Plan approved by the DG
Approved report by the CD
1 Q4 D: EDPM
Establish service points in all provinces
1 service point (Western Cape)
Report on 8 estab-lished service points
Approved report by the CD
8 Q4 D: EDPM
Reduce disease burden
5% reduction Report on 10% reduction
Approved report by the CD
1 Q4 D: EDPM
Finalise Health and Wellness Framework
Draft strategies and policies in place
Health and Wellness Framework
Approved framework by DEXCO
1 Q4 D: EDPM
DiREctoRAtE: SEcURity SERvicES
Strategic goal 6: Effective and efficient governance
Strategic objective 3: Provide effective audit, investigative and legal, human resources and financial risk management
Key objective Baseline Output Output indicator Target Time frame
Responsibility
Review Security Policy
Draft Security Policy Security Policy Approved Security Policy by DEXCO
1 Q2 D: SS
0% implementation Report on phase 1 Approved by the DDG
1 Q4 D: SS
DiREctoRAtE: iNtEgRAtED hUmAN RESoURcES mANAgEmENt
Strategic goal 6: Effective and efficient governance
Strategic objective 3: Provide effective audit, investigative and legal, human resources and financial risk management
Key objective Baseline Output Output indicator Target Time frame
Responsibility
Review and imple-ment the EPMD system required to monitor and evalu-ate performance
PMDS unit currently located with LR and Performance subdirectorate
Report on the EPMD system (review and implementation)
Approved report (OD or EPMD system) by the CD
1 report Q4 D: IHRM
Monitor the vacancy and turnover rate
13% of establish-ment is vacant
Report on percent-age reduction in vacancy and turn-over rate
Approved report by the CD
12% Q4 D: IHRM
Implement Training Programme on Disciplinary Procedures
12 SMS members trained on public service disciplinary procedures
Report on number of SMS members trained on disciplinary procedures
Percentage of SMS members trained on disciplinary procedures
100% Q4 D: IHRM

DAFF Strategic Plan 2011/12–2014/15
60
Strategic goal 6: Effective and efficient governance
Strategic objective 3: Provide effective audit, investigative and legal, human resources and financial risk management
Key objective Baseline Output Output indicator Target Time frame
Responsibility
Implement HRD Strategy and WSP (incl. tailor-made/customised training programmes)
Draft HRD Strategy and WSP for the branch
Fisheries HRD Strategy and WSP aligned to departmental HRD Strategy
Report on 50% trained on HRD Strategy
Approved Fisheries HRD Strategy and WSP by the CD
Approved report by the CD
1 strategy
1 report
Q4
Q4
D: IHRM
Implement health and wellness programmes
Draft EH&W Plan Behavioural risk assessment study report
EH&W Plan
EH&W customised programmes for staff in fisheries in place
Approved assessment study
Approved EH&W Plan
Implement and monitor EH&W in the branch
1 report
1 plan
Q4 D: IHRM
Review and implement the departmental Transformation Plan
No EE plan/targets Diversity management plans
Approved report by the CD on implementation of diversity management plans
1 report Q4 D: IHRM
DiREctoRAtE: iNfoRmAtioN AND commUNicAtioN tEchNology
Strategic goal 6: Effective and efficient governance
Strategic objective 5: Provide leadership and manage communication and information
Key objective Baseline Output Output indicator Target Time frame
Responsibility
Maintain and enhance integrated systems
MAST and Oracle financial application
Report on integra-tion and consolida-tion of catch systems in MAST
Report on enhanced functionality in MAST and Oracle financials
Approved implemen-tation plans for catch systems by the CD
Approved and implemented change requests
1
1
Q4
Q4
D: ICT
D: ICT
DiREctoRAtE: commUNicAtioN SERvicES
Strategic goal 6: Effective and efficient governance
Strategic objective 5: Provide leadership and manage communication and information
Key objective Baseline Output Output indicator Target Time frame
Responsibility
Develop and implement communication strategies
2009–2014 Communication Strategy not aligned to the macro-structure
Media plans per project
Media plans approved by the CD
10 media plans
Q1–Q4 D: CS
DiREctoRAtE: iNtEgRAtED hUmAN RESoURcE mANAgEmENt (cont.)

Annexure 1: Annual performance plans
61
DiREctoRAtE: StAKEholDER RElAtioNS
Strategic goal 1: increased profitable production of food, fibre and timber products by all categories of producers (subsistence, smallholder and commercial)
Strategic objective 2: coordinate government food security initiative
Key objective Baseline Output Output indicator Target Time frame
Responsibility
Organise 8% of farmers into producer associations
No producer asso-ciations currently in existence
Report on 8% of farm-ers organised into producer associations
Approved report by the CD
1 report Q4 D: SR
Strategic goal 6: Effective and efficient governance
Strategic objective 1: Establish and strengthen cooperative governance and functional relations with local and international stakeholders
Key objective Baseline Output Output indicator Target Time frame
Responsibility
Organise 8% of farmers into producer associations
Stakeholder Relations Strategy not aligned to the new mandate
Comprehensive Stakeholder Relations Strategy in terms of the new mandate
Approved compre-hensive strategy by DEXCO
1 strategy
Q4 D: SR
Establish 9 com-modity structures
No commodity structures currently in existence
Report on 9 com-modity structures established
Approved report by the CD
1 report Q4 D: SR
DiREctoRAtE: iNtERgovERNmENtAl AND iNtERNAtioNAl RElAtioNS
Strategic goal 6: Effective and efficient governance
Strategic objective 1: Establish and strengthen cooperative governance and functional relations with local and international stakeholders
Key objective Baseline Output Output indicator Target Time frame
Responsibility
Develop International Fisheries Strategy
Strategy aligned to the old structure of Fisheries Branch 1
Accredited Inter-national Fisheries Strategy
Approved strategy by DEXCO
1 Q4 D: IIR
Identify inter govern-mental stakeholders and actively parti - cipate in relevant programmes and forums to efficiently represent fisheries issues
Organisations representing industry only
Credible fisheries database
Database approved by DEXCO
1 Q4 D: IIR
DiREctoRAtE: StAKEholDER ENgAgEmENt
Strategic goal 6: Effective and efficient governance
Strategic objective 5: Provide leadership and manage communication and information
Key objective Baseline Output Output indicator Target Time frame
Responsibility
Establish 1 prescribed MLRA structure
Collapsed Con-sultative Advisory Forum (CAF) docu-ments and MLRA
Consultative Advisory Forum Comprehensive Plan
CAF Plan approved by DEXCO
1 Q4 D: SE
Establish 5 small-scale fishing community-based entities
Small-scale fish eries policy guidelines and existing informal interim relief and abalone structures
Functional community-based entities
Approved database of fishers
5 fishing community-based legal entities
Q4 D: SE

DAFF Strategic Plan 2011/12–2014/15
62
Strategic goal 6: Effective and efficient governance
Strategic objective 5: Provide leadership and manage communication and information
Key objective Baseline Output Output indicator Target Time frame
Responsibility
Develop and implement Stakeholder Strategy
Public perception survey and current stakeholder structures
Comprehensive Stakeholder Strategy
Strategy approved by DEXCO
1 Q3 D: SE
Develop and implement Client Service Plan
Public perception survey
Client Service Improvement Plan
Client Service Improvement Plan approved by DEXCO
1 Q3 D: SE
DiREctoRAtE: DEvEloPmENt fiNANcE cooRDiNAtioN
Strategic goal 1: increased profitable production of food, fibre and timber products by all categories of producers (subsistence, smallholder and commercial)
Strategic objective 2: coordinate government food security initiative
Key objective Baseline Output Output indicator Target Time frame
Responsibility
Develop a development finance funding model
– Value Chain Financing Model
Approved Value Chain Model
1 Q4 D: DFC
Have 10 000 smallholder farmers and 10 000 subsistence farmers accessing financial services
30 000 (smallholders and subsistence farmers)
Smallholder farmers and subsistence farmers accessing financial services
Number of smallholders and subsistence farmers accessing financial services
10 000 (inclusive of Land Bank funded small-holder operators)
Q4 D: DFC
To finance and support distressed farmers
284 distressed farmers at Land Bank
Distressed farmers financed and supported
Number of distressed farmers financed and supported
50 distressed farmers supported
Q4 D: DFC
DiREctoRAtE: StRAtEgic PlANNiNg
Strategic goal 6: Effective and efficient governance
Strategic objective 2: Strengthen policy, planning, monitoring, evaluation, reporting and sector information
Key objective Baseline Output Output indicator Target Time frame
Responsibility
Align national and provincial plans with Presidential outcomes and targets
Departmental Strategic Plan 2010/11
2011/12 Departmental Strategic Plan
Strategic Plan tabled 1 Q4 D: SP
2009/10 Strategic and operational planning guidelines
2011/12 Strategic and operational planning guidelines
Approved guidelines 1 Q4 D: SP
Draft PDA planning survey report
DAFF/PDA Planning Framework
Approved framework 1 Q4 D: SP
Service Delivery Improvement Plan
Approved SDIP 1 Q4 D: SP
DiREctoRAtE: StAKEholDER ENgAgEmENt (cont.)

Annexure 1: Annual performance plans
63
DiREctoRAtE: PRogRAmmE DEvEloPmENt SUPPoRt
Strategic goal 6: Effective and efficient governance
Strategic objective 2: Strengthen policy, planning, monitoring, evaluation, reporting and sector information
Key objective Baseline Output Output indicator Target Time frame
Responsibility
Provide continuous programme management support
– Review programmes and projects
Departmental programmes aligned to broader governmental policies and strategies
1 status re-port on the alignment of pro-grammes
Q4 D: PDS
– Departmental programmes implemented
Status report on the implementation of programmes
1 Q4 D: PDS
DiREctoRAtE: Policy RESEARch SUPPoRt
Strategic goal 6: Effective and efficient governance
Strategic objective 2: Strengthen policy, planning, monitoring, evaluation, reporting and sector information
Key objective Baseline Output Output indicator TargetTime frame
Responsibility
Implement targeted R&D programmes
National Sectoral R&D Agenda
Commodity-specific R&D programme
Approved R&D Programme
Service level agree-ments signed on commodity-specific R&D projects
1 Q4 D: PRS
Review existing policies
Departmental legislative mandate (list of Acts in Strategic Plan 2010/11)
Reviewed three policies
Three policies reviewed
3 Q4 D: PRS
DiREctoRAtE: oRgANiSAtioNAl PERfoRmANcE
Strategic goal 6: Effective and efficient governance
Strategic objective 2: Strengthen policy, planning, monitoring, evaluation, reporting and sector information
Key objective Baseline Output Output indicator Target Time frame
Responsibility
Monitor and assess the performance of DAFF
Strategic Plan 2011/12
Quarterly performance reports
Approved quarterly performance reports by DEXCO (consult MER document)
4 Q1–Q4 D: OP
Quarterly performance reports 2010/11
Annual report 2010/11
Approved Annual report by DEXCO
1 Q1 D: OP
Strategic Plan 2011/12
2011/12 Knowledge Bank Model
Functional KnowledgeBank Model
1 Q1 D: OP
Departmental Services Catalogue
Service catalogue Service catalogue developed
1 Q4 D: OP

DAFF Strategic Plan 2011/12–2014/15
64
DiREctoRAtE: PRoviNciAl AND SoE PERfoRmANcE moNitoRiNg
Strategic goal 6: Effective and efficient governance
Strategic objective 2: Strengthen policy, planning, monitoring, evaluation, reporting and sector information
Key objective Baseline Output Output indicator Target Time frame
Responsibility
Monitor and assess the performance of PDAs and SOEs
2010/11 PDAs performance indicators
2011/12 performance indicators of PDAs
Approved PDAs performance indicators by ITCAFF
1 Q1 D: PSPM
QPR Treasury Model
PDA quarterly reports
Approved quarterly PDAs reports by ITCAFF
4 Q1–Q4 D: PSPM
DiREctoRAtE: StAtiSticS AND EcoNomic ANAlySiS
Strategic goal 6: Effective and efficient governance
Strategic objective 2: Strengthen policy, planning, monitoring, evaluation, reporting and sector information
Key objective Baseline Output Output indicator Target Time frame
Responsibility
Produce reports on economic indicators and trends for the sector
8 reports Published reports Trends and economic performance of the sector analysed
12 reports (3 per quarter)
Q1–Q4 D: SEA
20 reports Published reports Trends and statistical performance of the sector analysed
20 reports Q1–Q4 D: SEA
Trade promotion and market access
DiREctoRAtE: SoUthERN AfRicA AND AfRicA RElAtioNS
Strategic goal 6: Effective and efficient governance
Strategic objective 1: Establish and strengthen cooperative governance and functional relations with local and international stakeholders
Key objective Baseline Output Output indicator Target Time frame
Responsibility
Facilitate the process of preparation of agreements
3 finalised and ready for signature
Agreements Signed agreements (Mali, Senegal and Gabon)
3 Q4 D: SAAR
3 drafts Finalised agree-ments (Zimbabwe, Tanzania and Swaziland)
3
12 signed agreements
Report on imple-mentation of signed agreements
Approved report on implementation of signed agreements by the CD
1 Q4 D: SAAR
Oversee and provide support for the promotion and protection of DAFF interests regionally and internationally
5 SADC meetings and 1 meeting per country (bilateral)
Schedule of strategic meetings (regionally and internationally)
Schedule of strategic meetings approved by the CD
Reports on DAFF’s attendance of strategic meetings
1 Q4 D: SAAR
Report on DAFF’s representation in strategic countries
Approved report by the CD
1 functional and staffed office
Q4 D: SAAR

Annexure 1: Annual performance plans
65
DiREctoRAtE: cooPERAtivES AND ENtERPRiSE DEvEloPmENt
Strategic goal 5: increased contribution of the sector to economic growth and development
Strategic objective 2: increase the level of public and private investment in the sector
Key objective Baseline Output Output indicator Target Time frame
Responsibility
Facilitate the development of sector strategies
Draft agribusiness policy
Sector business policy to guide sector strategies
Approved Sector Business Policy by DEXCO
1 Q4 D: CED
Facilitate the implementation of partnerships within the value chain
Unit standards aligned material
Skills Development Support Programme for Small Enterprises
The number of small businesses supported through training
100 Q4 D: CED
Draft cooperation agreement (SEDA)
Partnership agreements
Signed partnership agreements by all the partners
6 Q4 D: CED
Accredited SMME excellence model training material
Training programme for entrepreneurs and/or farmers
Number of farmers trained
100 Q4 D: CED
Partnership for enterprise develop-ment support
Cooperation agreement signed by the DG
1 Q3 D: CED
Facilitate the establishment of marketing linkages
Partnerships to broaden participation within the value chain
Number of partnerships established
3 Q4 D: CED
Facilitate the development of the SMME Strategy within the sector
Forestry SMME Strategy
Integrated SMME Strategy for the sector
Approved integrated SMME Strategy for the sector by DEXCO
1 Q4 D: CED
Draft Agricultural SMME Strategy
Facilitate the establishment and support of commodity associations and cooperatives
Commodity associations established
Number of com-modity associations established
12 Q4 D: CED
Guidelines on the establishment of cooperatives
Cooperatives established
Number of cooperatives established
90 Q4 D: CED
Commodity Approach Model
Accredited training material
Capacity-building Programme for Cooperatives
Number of cooperatives trained
90 Q4 D: CED
DiREctoRAtE: BBBEE chARtERS comPliANcE
Strategic goal 5: increased contribution of the sector to economic growth and development
Strategic objective 1: increase growth, income and sustainable job opportunities in the value chain
Key objective Baseline Output Output indicator Target Time frame
Responsibility
Facilitate the gazetting of the charter/sector code (AgriBEE section 9)
AgriBEE Transformation Charter, section 12
Gazetting of the AgriBEE Sector Code, section 9
Published Gazette 1 Q3 D: BCC
Facilitate the implementation of the AgriBEE Charter/Sector code
Signed AgriBEE Fund MoA between DAFF and Land Bank
AgriBEE deals funded
Number of BEE deals funded
8 Q4 D: BCC

DAFF Strategic Plan 2011/12–2014/15
66
Strategic goal 5: increased contribution of the sector to economic growth and development
Strategic objective 1: increase growth, income and sustainable job opportunities in the value chain
Key objective Baseline Output Output indicator Target Time frame
Responsibility
Facilitate the development of the Fisheries Charter
No charter in place Conduct study on status of trans-formation in the fisheries sector
Status report (published)
1 Q4 D: BCC
Facilitate the implementation of the Forestry Charter/Sector code
– Number of government undertakings implemented
Progress report on undertakings implemented
4 Q1–Q4 D: BCC
DiREctoRAtE: iNtERNAtioNAl tRADE
Strategic goal 5: increased contribution of the sector to economic growth and development
Strategic objective 2: increase market access for South African and African agricultural, forestry and fish products domestically and internationally
Key objective Baseline Output Output indicator Target Time frame
Responsibility
Undertake the implementation of the Trade Strategy
Approved Agricultural Trade Development Strategy, 2008
WTO commitment schedule
Completed WTO commitment schedule
1 Q3 D: ITR
Report on SADC/EU/ EPA negotiations
Finalised outcome for the negotiation
1 Q3 D: ITR
Review of SACU/EFTA bilateral agreements
Agreed on review programme
1 Q4 D: ITR
ITC Training Programme
Number of training workshops conducted
4 Q4 D: ITR
Undertake the im-plementation of the regional coopera-tion agreements
SADC Summit decision on regional integration
Tripartite (SADC, EAC, COMESA) free trade area offer for agriculture
Draft tripartite free trade area offer completed
1 Q4 D: IT
DiREctoRAtE: AmERicAS, AUStRAlASiA, EURoPE AND miDDlE EASt RElAtioNS
Strategic goal 6: Effective and efficient governance
Strategic objective 1: Establish and strengthen cooperative governance and functional relations with local and international stakeholders
Key objective Baseline Output Output indicator Target Time frame
Responsibility
Facilitate the process of preparation of agreements
5 agreements Draft agreements (Russia, Turkey, the Netherlands, Cuba and Argentina)
Number of draft agreements
5 Q4 D: AAEMER
Finalised agreements (Thailand, Philippines, Indonesia, Saudi Arabia and Iran)
Number of signed agreements
5 Q4
Ooversee and provide support for the promotion and protection of the DAFF’s interests regionally and internationally
25 meetings Coordinate the attend-ance of the DAFF at scheduled strategic meetings (regionally and internationally)
Report on the DAFF’s attendance of scheduled strategic meetings (signed by the Director)
25 Q4 D: AAEMER
– Manage the DAFF’s representation in strategic countries
Report on the DAFF’s representation in stra-tegic countries (signed by the Director)
6 functional and staffed offices
Q4 D: AAEMER
DiREctoRAtE: BBBEE chARtERS comPliANcE (cont.)

Annexure 1: Annual performance plans
67
DiREctoRAtE: mARKEtiNg
Strategic goal 5: increased contribution of the sector to economic growth and development
Strategic objective 1: increase growth, income and sustainable job opportunities in the value chain
Key objective Baseline Output Output indicator Target Time frame
Responsibility
Facilitate the review and implementation of legislations
– Marketing of Agricul-tural Products (MAP) Amendment Bill
Gazetted MAP Amendment Bill
1 Q4 D: M
– Agricultural Produce Agents (APA) Amendment Bill
Gazetted APA Amendment Bill
1 Q4 D: M
Facilitate the implementation of the Marketing Strategy
– Programme for linking farmers to markets
Programme approved by DEXCO
1 Q4 D: M
Fresh produce feasibility study report
Fresh Produce Marketing Infrastructure Support Programme
Business case/plan developed
1 Q4 D: M
– Agriculture, Forestry and Fisheries Logistics Programme/Solutions
Approved programme by the Minister
1 Q3 D: M
– Marketing Assistance Scheme established
Approval by the National Treasury
1 Q4 D: M
– Tariff policy implementation reports
Approval of the DAFF’s recommendations on agricultural, forestry and fisheries tariff po-sition (approval by ITCAFF)
4 Q1–Q4 D: M
Facilitate the establishment and institutionalisation of value chain networks
– Value chain round-tables/networks concept document
Concept document approved by the Minister
1 Q4 D: M
DiREctoRAtE: AgRo-PRocESSiNg
Strategic goal 1: increased profitable production of food, fiber and timber products by all categories of producers (subsistence, smallholder, commercial)
Strategic objective 2: coordinate government food security initiative
Key objective Baseline Output Output indicator Target Time frame
Responsibility
Facilitate the devel-opment of the agro-processing Strategy
– Agro-processing Strategy
Strategy approved by DEXCO
1 Q4 D: AP
Facilitate the promotion of value-added products in the export market
– Export Promotion Strategy for Value-added Products
Strategy approved by DEXCO
1 Q4 D: AP
Facilitate the profiling of the agro-processing industry and subsectors
– Agro-processing industry profile
Completed industry profile
1 Q4 D: AP
Facilitate the develop -ment of support measures to promote the establishment of the agro-processing industries
– Agro-processing support measures/incentives
Incentives brochure developed
1 Q4 D: AP
Facilitate the estab-lishment of marketing and agro-processing associations
– Agro-processing industry associations established
Commodity-based associations established
4 Q4 D: AP

DAFF Strategic Plan 2011/12–2014/15
68
Food Security and Agrarian Reform
DiREctoRAtE: SUBSiStENcE fARmiNg
Strategic goal 6: Effective and efficient governance
Strategic objective 3: Provide effective audit, investigative and legal, human resources and financial risk management
Key objective Baseline Output Output indicator Target Time frame
Responsibility
Develop and approve a national food security policy
Food Security Policy Guidelines and the Integrated Food Security Strategy
National Food Security Policy
Approved Food Security Policy by the Cabinet
1 Q4 D: SF
National FS Plan to ensure compliance to Food Security Policy
1 Q4 D: SF
Implement Zero Hunger Strategy
Integrated Food Security and Nutrition Programme (IFSNP)
Zero Hunger Strategy
Approved Zero Hunger Strategy by the Minister
1 Q1 D: SF
Zero Hunger Strategy Implementation Plan
1 Q4 D: SF
DiREctoRAtE: SmAllholDER DEvEloPmENt
Strategic goal 1: increased profitable production of food, fibre and timber products by all categories of producers (subsistence, smallholder and commercial)
Strategic objective 2: coordinate government food security initiative
Key objective Baseline Output Output indicator TargetTime frame
Responsibility
Develop and support new producers
205 000 New smallholder producers supported
Number of small-holder producers supported
15 000 Q4 D: SD
DiREctoRAtE: iNfRAStRUctURE SUPPoRt
Strategic goal 1: increased profitable production of food, fibre and timber products by all categories of producers (subsistence, smallholder and commercial)
Strategic objective 2: coordinate government food security initiative
Key objective Baseline Output Output indicator Target Time frame
Responsibility
Develop and approve Policy on Mechanisation Support Model
Lack of mechanisation policy
Mechanisation Support Policy
Approved policy by DEXCO
1 Q4 D: IS
Develop and monitor engineering norms and standards on production technologies
No engineering norms and standards for production technologies
Engineering norms and standards for supporting the subsistence and smallholder producers
Number of engineering norms and standards developed
3 Q4 D: IS

Annexure 1: Annual performance plans
69
DiREctoRAtE: SEctoR EDUcAtioN AND tRAiNiNg
Strategic goal 4: A transformed and united sector
Strategic objective 4: Provide leadership and support to research, training and extension in the sector
Key objective Baseline Output Output indicator Target Time frame
Responsibility
Provide training to new producers
15 000 Report on number of producers trained on targeted programmes
Number of new producers trained
15 000 Q4 D: SET
15 Targeted training programmes for producers
Number of training programmes
10 Q4 D: SET
DiREctoRAtE: SEctoRAl collEgES
Strategic goal 4: A transformed and united sector
Strategic objective 4: Provide leadership and support to research, training and extension in the sector
Key objective Baseline Output Output indicator Target Time frame
Responsibility
To approve ATI Bill and norms and standards
Draft ATI Green Paper
ATI Green Paper Approved ATI Green Paper by the DAFF
1 Q4 D: SC
Draft norms and standards
Norms and stan-dards on agricultural training institutes
Approved norms and standards by ITCAFF
1 Q4 D: SC
DiREctoRAtE: gRootfoNtEiN AgRicUltURAl DEvEloPmENt iNStitUtE
Strategic goal 4: A transformed and united sector
Strategic objective 4: Provide leadership and support to research, training and extension in the sector
Key objective Baseline Output Output indicator Target Time frame
Responsibility
Implement 14 targeted Education and Training Programmes for the sector
1 140 New producers trained through GADI’s Farmer Training Programme
Number of trainees on industry-focused farmer training
1 000 Q4 D: GADI
180 Students trained through GADI’s Higher Education (HE) Programme
Number of students enrolled at the college
180 Q4 D: GADI
DiREctoRAtE: SEctoR tRANSfoRmAtioN AND gENDER SERvicES
Strategic goal 4: A transformed and united sector
Strategic objective 4: Provide leadership and support to research, training and extension in the sector
Key objective Baseline Output Output indicator Target Time frame
Responsibility
Implement findings of DAFF audit report
Audit report on compliance to gender and transformation legislation
Training programmes implementing audit report findings
Number of programmes
14 Q4 D: STGS
Concept document on villages
Number of villages established
4 Q4 D: STGS
Overall coordination on compliance to workers summit resolutions
Report on compliance
1

DAFF Strategic Plan 2011/12–2014/15
70
DiREctoRAtE: NAtioNAl EXtENSioN REfoRm
Strategic goal 4: A transformed and united sector
Strategic objective 4: Provide leadership and support to research, training and extension in the sector
Key objective Baseline Output Output indicator Target Time frame
Responsibility
Implement Extension Recovery Plan
2 300 On-line training of extension officers
Number of extension officers trained
1 600 Q4 D: NER
986 Upgrading of extension officers qualifications
Number of extension officers upgraded qualifications
800 Q4 D: NER
DiREctoRAtE: NAtioNAl EXtENSioN SUPPoRt
Strategic goal 4: A transformed and united sector
Strategic objective 4: Provide leadership and support to research, training and extension in the sector
Key objective Baseline Output Output indicator Target Time frame
Responsibility
Develop appropriate policies towards improvement of extension
3 draft policies Draft policies onnational extension performance moni-toring, establishment of extension profes-sional body and national extension policy
Number of draft policies approved by the DAFF
3 Q4 D: NES
Agricultural Production, Health and Food Safety
DiREctoRAtE: ANimAl PRoDUctioN
Strategic goal 1: increased profitable production of food, fibre and timber products by all categories of producers (subsistence, smallholder and commercial)
Strategic objective 2: coordinate government food security initiative
Key objective Baseline Output Output indicator Target Time frame
Responsibility
Implement and monitor animal production schemes
1 (Kaonafatso ya Dikgomo)
Animal production schemes (milk, beef, small stock, poultry and wool)
Approved schemes by the CD
9 Q4 D: AP
Implement Commodity Strategy
– Commodity strategy (red meat) implement -ation report
Approved report by the CD
1 Q4 D: AP
DiREctoRAtE: vEtERiNARy PUBlic hEAlth
Strategic goal 1: increased profitable production of food, fibre and timber products by all categories of producers (subsistence, smallholder and commercial)
Strategic objective 2: coordinate government food security initiative
Key objective Baseline Output Output indicator Target Time frame
Responsibility
Finalise CCS Frame-work (legislation)
– Amended Veterinary and Paraveterinary Act
Approved Act by the Parliament
1 Q4 D: VPH
Issue farmers with registration marks
524 000 ID certificates Number of certificates issued
32 000 Q4 D: VPH

Annexure 1: Annual performance plans
71
Strategic goal 3: Effective national regulatory services and risk management systems
Strategic objective 1: Promote safe food by managing the level of risks associated with food, diseases, pests, natural disasters and trade
Key objective Baseline Output Output indicator Target Time frame
Responsibility
Conduct inspections on export facilities
20 Inspection reports Inspection reports approved by the CD
20 Q4 D: VPH
DiREctoRAtE: ANimAl hEAlth
Strategic goal 3: Effective national regulatory services and risk management systems
Strategic objective 1: Promote safe food by managing the level of risks associated with food, diseases, pests, natural disasters and trade
Key objective Baseline Output Output indicator Target Time frame
Responsibility
Implement animal disease control interventions
12 Implemented interventions
Number of interventions implemented
12 Q4 D: AH
Issue veterinary import permits
40 000 Veterinary import permits issued
Number of veterinary import permits issued
40 000 Q4 D: AH
Approve DAFF laboratories
24 Laboratory inspection reports
Approved laboratory inspection reports by the CD
24 Q4 D: AH
Conduct surveillance
2 Surveillance reports Approved surveillance reports by the CD
2 Q4 D: AH
Monitor prevalence of diseases
12 Disease reports Approved disease reports by the CD
4 Q1–Q4 D: AH
DiREctoRAtE: gENEtic RESoURcES
Strategic goal 1: increased profitable production of food, fibre and timber products by all categories of producers (subsistence, smallholder and commercial)
Strategic objective 2: coordinate government food security initiative
Key objective Baseline Output Output indicator Target Time frame
Responsibility
Provide regulatory support services
2 lists of declared plants per annum
Lists of declared plants
Amended Table 1 in terms of PBR Act
2 Q2, Q4 D: GR
– Framework on GMO low level and adventitious presence
Approved GMO consignment threshold levels by the Executive Council
1 Q4 D: GR
Provide technical support services
– In situ Conservation Programme: (PGRFA) implemented
On-farm conservation project established in KZN
1 Q3 D: GR
– FAnGR Repatriation/ Restocking Programme implemented
Number of repatriation plans (indigenous livestock)
2 districts in North West
2 districts in Free State
Q2
Q4
D: GR
DiREctoRAtE: vEtERiNARy PUBlic hEAlth (cont.)

DAFF Strategic Plan 2011/12–2014/15
72
DiREctoRAtE: PlANt PRoDUctioN
Strategic goal 1: increased profitable production of food, fibre and timber products by all categories of producers (subsistence, smallholder and commercial)
Strategic objective 2: coordinate government food security initiative
Key objective Baseline Output Output indicator Target Time frame
Responsibility
Provide regulatory support services
– Policy on Plant Improvement
Approved policy by DEXCO
1 Q3 D: PP
Strategic goal 5: increased contribution of the sector to economic growth and development
Strategic objective 2: increase the level of public and private investment in the sector
Implement commodity strategies
– Implementation plan for Grain Strategy
Approved plan by the CD
1 Q4 D: PP
– Implementation plan for Fruit Strategy
Approved plan by the CD
1 Q4 D: PP
DiREctoRAtE: PlANt hEAlth
Strategic goal 1: increased profitable production of food, fibre and timber products by all categories of producers (subsistence, smallholder and commercial)
Strategic objective 2: coordinate government food security initiative
Key objective Baseline Output Output indicator Target Time frame
Responsibility
Provide regulatory support services
– Policy on Plant Health (phytosanitary matters)
Gazetted policy 1 Q4 D: PH
1 Revised legislation: Agricultural Pests Act, 1983 (Act No. 36 of 1983)
Gazetted Plant Protection Bill
1 Q4 D: PH
Provide technical support services
– Prioritisation mechanism/tool/system for phytosanitary export markets
Approved departmental system by DEXCO
1 Q4 D: PH
DiREctoRAtE: AgRicUltURE iNPUtS coNtRol
Strategic goal 3: Effective national regulatory services and risk management systems
Strategic objective 1: Promote safe food by managing the level of risks associated with food, diseases, pests, natural disasters and trade
Key objective Baseline Output Output indicator Target Time frame
Responsibility
Regulate compliance and monitoring interventions implemented
2 400 Registration of agrochemicals
Number of regis-tered agrochemicals
2 400 Q4 D: AIC
2 000 Inspections conducted
Number of inspect-ions conducted
2 000 Q4 D: AIC
9 Technical information packages provided
Number of technical information packages provided
9 Q4 D: AIC
Fertilizers and Farm Feeds Bill
Gazetted Bill 1 Q4 D: AIC

Annexure 1: Annual performance plans
73
DiREctoRAtE: iNSPEctioN SERvicES
Strategic goal 3: Effective national regulatory services and risk management systems
Strategic objective 1: Promote safe food by managing the level of risks associated with food, diseases, pests, natural disasters and trade
Key objective Baseline Output Output indicator Target Time frame
Responsibility
Regulate compliance and monitoring interventions implemented
47 000 Inspections conducted
Number of inspections conducted
51 700 Q4 D: IS
DiREctoRAtE: fooD SAfEty AND QUAlity ASSURANcE
Strategic goal 3: Effective national regulatory services and risk management systems
Strategic objective 1: Promote safe food by managing the level of risks associated with food, diseases, pests, natural disasters and trade
Key objective Baseline Output Output indicator Target Time frame
Responsibility
Regulate compliance and monitoring interventions implemented
30 000 Laboratory samples analysed
Number of laboratory samples analysed
30 000 Q4 D: FSQA
Food Safety and Quality Assurance Regulations
Number of regulations
10 Q4 D: FSQA
Liquor Products Amendment Bill
Gazetted Bill 1 Q4 D: FSQA
Forestry
DiREctoRAtE: foREStRy mANAgEmENt
Strategic goal 5: increased contribution of the sector to economic growth and development
Strategic objective 2: increase the level of public and private investment in the sector
Key objective Baseline Output Output indicator Target Time frame
Responsibility
Implement Forest Sector Charter for planting 10 000 ha to supply timber in the country
– Afforestation programme implementation report
Number of afforestation licences issued
100 Q4 D: FM
Number of hectares afforested
10 000 Q4 D: FM
Strategic goal 1: increased profitable production of food, fiber and timber by all categories of producers (subsistence, smallholder and commercial)
Strategic objective 2: coordinate government food security initiative
Facilitate the creation of job opportunities in the forestry sector
– Status report on creation of jobs through wattle jungle conversion and rehabilitation
Number of jobs created
300 Q4 D: FM

DAFF Strategic Plan 2011/12–2014/15
74
DiREctoRAtE: SmAll-ScAlE foREStRy
Strategic goal 2: Sustained management of natural resources
Strategic objective 2: Ensure the sustainable management and efficient use of natural resources
Key objective Baseline Output Output indicator Target Time frame
Responsibility
Increase number of hectares of indigenous forests and woodlands rehabilitated
South Africa Greening
Greening strategy implementation report
Number of indigenous and fruit trees planted
100 000 trees
Q4 D: SSF
Greening strategy implementation report
Number of indigenous and fruit trees planted
100 000 trees
Q4 D: SSF
Strategic goal 1: increased profitable production of food, fiber and timber by all categories of producers (subsistence, smallholder and commercial)
Strategic objective 2: coordinate government food security initiative
Provide support to 2 500 new small growers in the forestry sector
– Status report on support provided to new small growers
Number of new small growers supported
2 500 Q4 D: SSF
DiREctoRAtE: wooDlANDS AND iNDigENoUS foRESt mANAgEmENt
Strategic goal 2: Sustained management of natural resources
Strategic objective 2: Ensure the sustainable management and efficient use of natural resources
Key objective Baseline Output Output indicator Target Time frame
Responsibility
Increase number of hectares of indigenous forests and woodlands rehabilitated
South Africa Greening
Report on hectares of indigenous forests and woodlands rehabilitated
Number of hectares rehabilitated
800 ha Q4 D: WIFM
DiREctoRAtE: wAtER USE AND iRRigAtioN DEvEloPmENt
Strategic goal 2: Sustained management of natural resources
Strategic objective 2: Ensure the sustainable management and efficient use of natural resources
Key objective Baseline Output Output indicator Target Time frame
Responsibility
Refurbish 0,5% smallholder government irrigation schemes
50 000 ha Progress report on irrigation schemes revitalised
Number of hectares revitalised
250 Q4 D: WUID
DiREctoRAtE: climAtE chANgE AND DiSAStER mANAgEmENt
Strategic goal 1: increased profitable production of food, fiber and timber by all categories of producers (subsistence, smallholder and commercial)
Strategic objective 2: coordinate government food security initiative
Key objective Baseline Output Output indicator Target Time frame
Responsibility
Develop disaster risk management system
Monthly advisories Copying strategy for flood disasters
Approved strategy by NAC
1 Q4 D: CCDM

Annexure 1: Annual performance plans
75
Strategic goal 1: increased profitable production of food, fiber and timber by all categories of producers (subsistence, smallholder and commercial)
Strategic objective 2: coordinate government food security initiative
Key objective Baseline Output Output indicator Target Time frame
Responsibility
Develop disaster risk management system (cont.)
NARMCO and NDTT Terms of Reference
Progress report on the functioning of consultative structures (NARMCO and NDTT)
Approved report by DEXCO
1 Q3 D: CCDM
Implementation framework
Progress report on implementation of Western Cape Flood Disaster Relief Scheme
Approved report by DEXCO
1 Q4 D: CCDM
Strategic goal 2: Sustained management of natural resources
Strategic objective 2: Ensure the sustainable management and efficient use of natural resources
Develop climate change adaptation plans
Draft CC Sector Plan, Atlas of CC and SA agricultural sector GHG inventory report
Adaptation and mitigation plan
Approved plan by DEXCO
1 Q4 D: CCDM
DiREctoRAtE: lAND USE AND Soil mANAgEmENt
Strategic goal 2: Sustained management of natural resources
Strategic objective 2: Ensure the sustainable management and efficient use of natural resources
Key objective Baseline Output Output indicator Target Time frame
Responsibility
Increase number of hectares of agricultural land under rehabilitation
70% land degraded in RSA
Report on hectares of land rehabilitated
Percentation reduction in land degradation
1% (800 000 ha)
Q4 D: LUSM
Report on wetlands rehabilitated
Number of wetlands rehabilitated
6 Q4 D: LUSM
Land capability and agricultural land zoning maps for LP and NW provinces
Number of provinces mapped
2 Q4 D: LUSM
SALA legislation Policy on Protection of Agricultural Land
Approved policy by DEXCO
1 Q4 D: LUSM
Strategic goal 1: increased profitable production of food, fiber and timber by all categories of producers (subsistence, smallholder and commercial)
Strategic objective 2: coordinate government food security initiative
Create 1 300 job opportunities through LandCare
– Report on job opportunities created
Number of jobs created
1 300 FTE Q4 D: LUSM
DiREctoRAtE: climAtE chANgE AND DiSAStER mANAgEmENt (cont.)

DAFF Strategic Plan 2011/12–2014/15
76
Fisheries
DiREctoRAtE: AQUAcUltURE tEchNicAl SERvicES
Strategic goal 1: increased profitable production of food, fiber and timber by all categories of producers (subsistence, smallholder and commercial)
Strategic objective 2: coordinate government food security initiative
Key objective Baseline Output Output indicator Target Time frame
Responsibility
Establish 10 new fish farms
84 existing farms Report on operational fish farms
Number of new fish farms established
3 Q4 D: ATS
Establish aqua culture develop ment zones (ADZs)
0 Report on established ADZs
Number of ADZs established
1 Q4 D: ATS
DiREctoRAtE: Socio-EcoNomic DEvEloPmENt
Strategic goal 5: increased contribution of the sector to economic growth and development
Strategic objective 2: increase the level of public and private investment in the sector
Key objective Baseline Output Output indicator Target Time frame
Responsibility
Conduct a study on transformation in fisheries
No charter exists for fisheries
Status report on fisheries transformation
Published report 1 Q4 D: SED
Strategic goal 1: increased profitable production of food, fiber and timber by all categories of producers (subsistence, smallholder and commercial)
Strategic objective 2: coordinate government food security initiative
Establish 2 fish proces-sing facilities
60 fish processing facilities already exist
Fish processing facilities Number of fish processing facili-ties established
2 Q4 D: SED
Proclaim 3 new fishing harbours
12 fishing harbours already proclaimed
Fishing Harbour Develop-ment Programme
Number of fishing harbours proclaimed
3 Q4 D: SED
Implement 10 WFFP projects
No EPWP pro-gramme framework in fisheries
Working for Fisheries Programme
Number of WFFP projects implemented
10 Q4 D: SED
DiREctoRAtE: RESoURcE RESEARch
Strategic goal 2: Sustained management of natural resources
Strategic objective 2: Ensure sustainable management and efficient use of natural resources
Key objective Baseline Output Output indicator Target Time frame
Responsibility
Conduct research on fish stocks for 22 fishery sectors
Scientific recom-mendations on catch limits for 22 fishery sectors, current schedule of research surveys
Research report on: sardine and anchovy (updated), seaweeds; abalone, linefish, net fish, oysters, demersal sharks, South Coast rock lobster, West Coast rock lobster, white mussel and hake, horse mackerel, tuna pole, Patagonian toothfish, sardine and anchovy (initial), prawns, shark longline, Agulhas sole, squid, tuna and swordfish longline
TAC/TAE recommenda-tions, cruise reports
Approved TAC/TAE recommenda-tions by the Minister
Scientific recommenda-tions on catch limits for 22 fishery sec-tors
Q1–Q3 D: RR

Annexure 1: Annual performance plans
77
DiREctoRAtE: EcoSyStEmS RESEARch
Strategic goal 2: Sustained management of natural resources
Strategic objective 2: Ensure sustainable management and efficient use of natural resources
Key objective Baseline Output Output indicator Target Time frame
Responsibility
Advise on ecological considerations in-cluded in catch limit advice for 22 fishery sectors
EAF Scientific Working Group
Ecological risk assessment report
Approved report by the DDG
1 Q3 D: ER
DiREctoRAtE: AQUAcUltURE RESEARch
Strategic goal 1: increased profitable production of food, fibre and timber products by all categories of producers (subsistence, smallholder and commercial)
Strategic objective 2: coordinate government food security initiative
Key objective Baseline Output Output indicator Target Time frame
Responsibility
Revise the Aquaculture Research Programme
Existing Marine Aquaculture Research Programme
Framework for Aqua culture Re-search Manage-ment (FARM)
Approved framework by the DDG
1 Q1 D: AR
Implement research projects within the framework for aqua-culture research management through universities
6 existing projects internally
Research projects imple-mented through MoUs with uni-versities
Number of projects implemented
10 Q4 D: AR
DiREctoRAtE: comPliANcE
Strategic goal 1: increased profitable production of food, fibre and timber products by all categories of producers (subsistence, smallholder and commercial)
Strategic objective 2: coordinate government food security initiative
Key objective Baseline Output Output indicator Target Time frame
Responsibility
Intensify compliance and enforcement efforts
No baseline 1 100 vessel landings inspected in 5 key fisheries
Number of vessel landings inspected in 5 key fisheries (hake, abalone, squid, line-fish and rock lobster) inspected and spot checks conducted in other sectors
Hake = 300
Abalone = 150
Rock lobster = 100
Pelagics = 200
Linefish = 350
Q4
Q4
Q4
Q4
Q4
D: C
DiREctoRAtE: RESoURcE RESEARch (cont.)
Strategic goal 2: Sustained management of natural resources
Strategic objective 2: Ensure sustainable management and efficient use of natural resources
Key objective Baseline Output Output indicator Target Time frame
Responsibility
Investigate the feasibility of two potential new fisheries
Feasibility studies of two potential new fisheries
Feasibility reports on two potential new fisheries
Approved reports 2 Q4 D: RR

DAFF Strategic Plan 2011/12–2014/15
78
Strategic goal 1: increased profitable production of food, fibre and timber products by all categories of producers (subsistence, smallholder and commercial)
Strategic objective 2: coordinate government food security initiative
Key objective Baseline Output Output indicator Target Time frame
Responsibility
– Joint partner-ships with law enforcement and conserva-tion agencies established/formalised
Number of joint partnerships with law enforcement and conservation agencies established/formalised
2 Q4 D: C
DiREctoRAtE: moNitoRiNg AND SURvEillANcE
Strategic goal 1: increased profitable production of food, fibre and timber products by all categories of producers (subsistence, smallholder and commercial)
Strategic objective 2: coordinate government food security initiative
Key objective Baseline Output Output indicator Target Time frame
Responsibility
Rebuild depleted fish stocks
Strategy in place for abalone and hake
Strategy for hake, West Coast rock lobster and linefish
Strategy developed and implemented in these sectors
1 Q4 D: MS
Enhance compliance and enforcement of marine living resource legislation
Review of 10% of 2 304 rights holders investigated in the 5 key fishery sectors
Rights holders investigated in 5 key fisheries sectors, namely hake, abalone, rock lobster, squid and linefish
Number of rights holders investigated in key fisheries sectors, namely hake, abalone, rock lobster, squid and linefish
Hake long-line = 17 (10%)
Hake deep sea trawl = 6 (10%)
Hake hand line = 9 (10%)
Hake inshore trawl = 4 (10%)
West Coast rock lobster near shore = 84 (10%)
West Coast rock lobster off shore = 29 (10%)
Traditional linefish = 40 (10%)
Abalone = 31 (10%)
Squid = 13 (10%)
Q4
Q4
Q4
Q4
Q4
Q4
Q4
Q4
Q4
D: MS
Enhanced compliance with and enforcement of marine living resource legislation
Cases and tip-offs investigated
Percentage of cases and tip-offs investigated according to ser-vice standards
Number of cases and tip-offs investi-gated according to service standards
40 Q4 D: MS
Joint partner-ships with law enforcement and conserva-tion agencies maintained and strengthened
Number of joint operational initiatives with partners, law enforcement and conservation agencies
20 Q4 D: MS
DiREctoRAtE: comPliANcE (cont.)

Annexure 1: Annual performance plans
79
DiREctoRAtE: fiShERiES PRotEctioN vESSElS
Strategic goal 1: increased profitable production of food, fibre and timber products by all categories of producers (subsistence, smallholder and commercial)
Strategic objective 2: coordinate government food security initiative
Key objective Baseline Output Output indicator Target Time frame
Responsibility
Intensify compliance and enforcement efforts at sea
175 sea days per vessel per annum, (i.e. about 15 days per month per vessel) to inspect and/or process 10 vessels at sea per month per sector in the 5 key prior-ity fisheries, i.e. hake, rock lobster, squid, linefish and small pelagics
Sea-based inspection of vessels in 5 priority fisheries, i.e. hake, abalone, squid, linefish and rock lobster, and other random sea inspection of vessels in other sectors
Number of sea-based inspections of vessels in 5 priority fisheries, i.e. hake, abalone, squid, linefish and rock lobster, and other random sea inspection of vessels in other sectors
Rock lobster = 120
Squid/Chokka = 120
Hake = 120
Small pelagics = 120
Linefish = 120
Q4
Q4
Q4
Q4
Q4
D: FPV
Rebuild depleted fish stocks
Abalone and hake fisheries recovery strategies in existence
Special operations targeting hotspot areas, and vessel deployment plans that are focusing in the hake fishing grounds and pre-identified abalone poaching hotspots
Increased law enforcement ac-tivities, number of arrests and penalties issued, confiscation of equipment and other parapher-nalia used in the MLRA transgres-sion in the two fisheries as speci-fied in the recov-ery strategies for both fisheries
Continuous re-view/ implemen-tation of strategy for hake and aba-lone fisheries with respect to MCS, research and resource man-agement
Q4 D: FPV
DiREctoRAtE: SmAll-ScAlE fiShERiES
Strategic goal 1: increased profitable production of food, fibre and timber products by all categories of producers (subsistence, smallholder and commercial)
Strategic objective 2: coordinate government food security initiative
Key objective Baseline Output Output indicator Target Time frame
Responsibility
Finalise and implement Small-scale Fisheries Policy
Draft policy in place
Small-scale Fisher ies Policy and implementa-tion plan
Approved policy and implementa-tion plan by the Cabinet
1 Q4 D: SSF
Interim relief data base (and sub sistence database)
Database for small-scale fishers
Database signed off by the DDG
1 Q4 D: SSF
DiREctoRAtE: offShoRE AND high SEAS fiShERiES mANAgEmENt
Strategic goal 1: increased profitable production of food, fibre and timber products by all categories of producers (subsistence, smallholder and commercial)
Strategic objective 2: coordinate government food security initiative
Key objective Baseline Output Output indicator Target Time frame
Responsibility
Consult stakehold-ers and develop Strategy on An-chovy for Human Consumption
Anchovy feasibility study
Strategy on Anchovy for Human Consumption
Strategy approved
1 Q4 D: OHSFM

DAFF Strategic Plan 2011/12–2014/15
80
Strategic goal 2: Sustained management of natural resources
Strategic objective 2: Ensure sustainable management and efficient use of natural resources
Key objective Baseline Output Output indicator Target Time frame
Responsibility
Develop Recovery Plan for Hake
Current levels of hake TAC/TAE
Improved stocks Percentage improvement from current level
Management recommendations towards targets set for the recovery of hake
Q3 D: OHSFM
Review perfor-mance of rights holders in certain fishing sectors
2009 performance review process
Report on rights holders’ perform-ance and fishing sectors reviewed
Approved performance review reports
2 Q1–Q2 D: OHSFM
Reallocate commercial fishing rights in relevant sectors
2005 LTRAMP Revised policy documents
Hake handline and tuna pole policy reviews
2 Q4 D: OHSFM
Manage and regulate the rec-reational fishing sector (including charter fishing)
Interim recreational fisheries forum established
Framework for licensing charter Boat Operators
Approved framework
1 Q4 D: OHSFM
Develop guide-lines for manag-ing an allocation process for FPEs
Rights allocated and exemptions for new entrants
Guidelines for the FPE sector
Guidelines for FPE sector approved
1 Q4 D: OHSFM
Finalise National Plan of Action for Sharks (NPoA)
Draft NPoA for sharks
NPoA finalised Final NPoA approved
1 NPoA for sharks finalised and implemented
Q3 D: OHSFM
Manage ecosys-tems approach to fisheries manage-ment for offshore fisheries
ERA reports for hake, small and large pelagics, Patagonian tooth fish
Review of hake ERA
ERA reports
Reviewed and improved permit conditions
Review ERAs in relevant fishing sectors
Implementation of EAF priorities
Q2–Q4 D: OHSFM
Establish Fisher-ies Management Plans (FMPs) for key fishing sec-tors
Framework for FMPs
Finalise FMP for large pelagic sector
Draft large pelagic FMP
Draft Fisheries Management Plans for one offshore fishing sector
Q3 D: OHSFM
Manage stakeholder engagement and communication
Existing management working groups and stakeholder forums
Functional working groups and active participation in related forums
Management working group (MWG) reports/minutes of meetings
Improve existing stakeholder forums and establish small-scale fishing and recreational fishing forums
Q1–Q3 D: OHSFM
DiREctoRAtE: iNShoRE fiShERiES mANAgEmENt
Strategic goal 2: Sustained management of natural resources
Strategic objective 2: Ensure sustainable management and efficient use of natural resources
Key objective Baseline Output Output indicator Target Time frame
Responsibility
Develop Recovery Plan for Abalone, WCRL and Linefish
Current levels of abalone, WCRL and linefish TAC/TAE
Improved stocks Improvement from current levels
Management re-commendations towards targets set for the recovery of abalone, WCRL and linefish
Q3 D: IFM
DiREctoRAtE: offShoRE AND high SEAS fiShERiES mANAgEmENt (cont.)

Annexure 1: Annual performance plans
81
Strategic goal 2: Sustained management of natural resources
Strategic objective 2: Ensure sustainable management and efficient use of natural resources
Key objective Baseline Output Output indicator Target Time frame
Responsibility
Review performance of rights holders in certain fishing sectors
2009 performance review process
Rights holders’ performance and fishing sectors’ performance reviewed
Performance review report
Address findings of 2009 performance review process
Q3 D: IFM
Reallocate commercial fishing rights in relevant sectors
2005 LTRAMP Linefish, squid, oyster, white mussel, KZN prawn trawl, policy reviews
Sector policies reviewed, revised and approved
Review and revise rights allocation policies in affected sectors
Q4 D: IFM
Manage and regulate the recreational fishing sector (including charter fishing)
Interim recreational fisheries forum established
Engagement with recreational stakeholders at all levels
Established framework for recreational business processes and permitting
1 framework Q4 D: IFM
Manage and regulate fish processing establishments (FPEs)
Rights allocated and exemptions for new entrants granted
Development of guidelines for the FPE sector
Guideline for FPE sector approved
1 Q4 D: IFM
Manage EAF for inshore fisheries
ERA reports for squid, linefish, WCRL and abalone
Review of linefish, WCRL, abalone
ERA reports reviewed and implemented through sector permit conditions
2 Q2, Q4 D: IFM
Establish Fisheries Management Plans (FMPs) for key fishing sectors
Framework for FMPs
Draft FMP for linefish fishing sector
Draft FMP for linefish fishing sector approved
1 Q4 D: IFM
DiREctoRAtE: iNShoRE fiShERiES mANAgEmENt (cont.)


ANNEXURE 2
Service Delivery Improvement Plan

DAFF Strategic Plan 2011/12–2014/15
84
The improvement of service delivery standards is a strategic imperative for government, especially in its drive to eradi-cate poverty and meet the other millennium development goals (MDGs) to which it is committed. In response to the challenges of service delivery, government has introduced the concept of Batho Pele—People First—which is aimed at changing attitudes and the culture of public service from a “Can’t Do” to a “Can Do and Will Do” mindset.
The Service Delivery Improvement Plan (SDIP) is a value addition to service delivery as it is an action plan that outlines details on how the Batho Pele concept will be implemented. It is the “HOW” of Batho Pele. The SDIP will focus on bring-ing the Batho Pele principles to life, thus making service delivery a reality for the citizens.
In terms of the Public Service Regulations, 2001, Part III.C.1, an executing authority must establish and sustain a Service Delivery Improvement Plan (according to Batho Pele principles) for his or her department. The DPSA also re-quires that the SDIP should be planned, developed and implemented in accordance with the MTEF. Departments are expected to select and improve key services which have a direct impact on beneficiaries. Progress reporting must be done quarterly and annually to the DPSA.
Over the MTEF 2009/12, the DAFF has developed its own SDIP in line with the Public Service Regulations, 2001, Part III.C.1. The DAFF identified the following services as focus areas of improvement: • Registration of agricultural production inputs according to Act No. 36 of 1947
• Development finance (facilitating production loans and savings mobilisation)
• Market access (issue market access import and export permits, food price monitoring report and agricultural com-modity profiles and market analysis reports)
• Facilitation and promotion of agricultural products (providing agricultural trade-related information)
• Regulation of natural forests, woodlands and protected trees
• Processing of all permits and licence applications (except fishing effort and vessel change and fish processing es-tablishments)
The DAFF intends to improve on the registration of agricultural production inputs in terms of Act No. 36 of 1947 and to facilitate production loans. With regard to access to markets the department will focus on the issuing of import and export permits, the monitoring of food prices, commodity profiles and market analysis reports. The department will provide in formation on agricultural trade related negotiations and research information on inter national markets, export opportunities and related export requirements.
The SDIP has clear targets outlined, and these will be achieved, utilising the current budget. However, those initiatives that are planned for the coming years and will have an impact on the departmental budget will be used as motivation to have a direct correlation between the budget and the ability to address the specific service delivery outcome. The de-partment will report the progress in monitoring and evaluation on a quarterly basis and review the SDIP annually.

Annexure 2: Service Delivery Improvement Plan
85S
ER
vic
E o
bjE
cti
vE
: to
man
age
appl
icat
ions
of a
gric
ultu
ral p
rodu
ctio
n in
puts
(AP
is) w
ithin
the
Fert
ilize
rs, F
arm
Fee
ds, A
gric
ultu
ral R
emed
ies
and
Sto
ck R
emed
ies
Act
, 194
7
(Act
No.
36
of 1
947)
Key
ser
vice
s S
ervi
ce b
enef
icia
ry
Fiel
dc
urre
nt s
tand
ard
Des
ired
sta
ndar
d
2008
/09
2009
/10
2010
/11
2011
/12
Reg
istra
tion
of a
gri-
cultu
ral p
rodu
ctio
n in
puts
acc
ordi
ng to
A
ct N
o. 3
6 of
194
7 (p
estic
ides
, sto
ck
rem
edie
s, a
nim
al
feed
s, fe
rtilis
ers,
et
c.) a
nd P
est C
ontro
l O
pera
tors
in te
rms
of
the
Ferti
lizer
s, F
arm
Fe
eds,
Agr
icul
tura
l R
emed
ies
and
Sto
ck
Rem
edie
s A
ct)
Agr
icul
tura
l pr
oduc
tion
inpu
t (A
PI)
prod
ucer
s,
man
ufac
ture
rs a
nd
trade
rs
Qua
ntity
Unk
now
nE
stab
lish
a ba
selin
e fo
r qu
anti f
icat
ion
of a
pplic
atio
ns
proc
esse
d (p
er m
onth
/qu
arte
r/yea
r)
5% im
prov
emen
t on
the
esta
blis
hed
base
line
Incr
ease
impr
ovem
ent
targ
et b
ased
on
the
2011
in
form
atio
n
Qua
lity
Com
plia
nce
with
Act
No.
36
of 1
947
and
its re
gula
tions
Com
plia
nce
with
Act
No.
36
of 1
947
and
its re
gula
tions
Com
plia
nce
with
Act
No.
36
of 1
947
and
its re
gula
tions
Com
plia
nce
with
Act
No.
36
of 1
947
and
its re
gula
tions
con
sulta
tion
Tele
phon
e, e
-mai
l and
qu
arte
rly in
dust
ry li
aiso
n m
eetin
gs (I
LM)
Tele
phon
e, e
-mai
l and
qu
arte
rly IL
MTe
leph
one,
e-m
ail a
nd
quar
terly
ILM
Tele
phon
e, e
-mai
l and
qu
arte
rly IL
M
Est
ablis
hing
a n
ew
rela
tions
hip
with
indu
stry
/st
akeh
olde
r ass
ocia
tions
Est
ablis
hing
one
mor
e re
latio
nshi
p w
ith in
dust
ry/
stak
ehol
der a
ssoc
iatio
ns
Est
ablis
h on
e m
ore
rela
tions
hip
with
indu
stry
/st
akeh
olde
r ass
ocia
tions
Dev
elop
term
s of
refe
renc
e (T
oRs)
for m
eetin
gs w
ith
new
ly e
stab
lishe
d re
latio
n-sh
ips
(indu
stry
ass
ocia
tions
an
d ot
her s
take
hold
ers)
Impl
emen
t the
dev
elop
ed
ToR
s fo
r mee
tings
with
in
dust
ry a
ssoc
iatio
ns a
nd
othe
r sta
keho
lder
s
Rev
iew
the
ToR
s fo
r m
eetin
gs w
ith in
dust
ry
asso
ciat
ions
and
oth
er
stak
ehol
ders
and
thei
r im
plem
enta
tion
Acc
ess
App
licat
ion
for r
egis
tratio
n is
acc
esse
d th
roug
h de
partm
enta
l web
site
, fax
, e-
mai
l, po
sted
if re
ques
ted.
A
pplic
atio
ns c
an b
e po
sted
or
han
d-de
liver
ed to
the
depa
rtmen
t
App
licat
ion
for r
egis
tratio
n is
acc
esse
d th
roug
h de
partm
enta
l web
site
, fax
, e-
mai
l, po
sted
if re
ques
ted.
A
pplic
atio
ns c
an b
e po
sted
or
han
d-de
liver
ed to
the
depa
rtmen
t
App
licat
ion
for r
egis
tratio
n is
acc
esse
d th
roug
h de
partm
enta
l web
site
, fax
, e-
mai
l, po
sted
if re
ques
ted.
A
pplic
atio
ns c
an b
e po
sted
or
han
d-de
liver
ed to
the
depa
rtmen
t
App
licat
ion
for r
egis
tratio
n is
acc
esse
d th
roug
h de
partm
enta
l web
site
, fax
, e-
mai
l, po
sted
if re
ques
ted.
A
pplic
atio
ns c
an b
e po
sted
or
han
d-de
liver
ed to
the
depa
rtmen
t
cou
rtes
yC
lient
s ar
e no
tifie
d th
roug
h e-
mai
ls/p
hone
s w
hen
the
perm
its a
re re
ady
for c
olle
ctio
n or
whe
n ap
plic
atio
ns a
re re
ject
ed
Clie
nts
are
notif
ied
thro
ugh
e-m
ails
/pho
nes
whe
n th
e pe
rmits
are
read
y fo
r col
lect
ion
or w
hen
appl
icat
ions
are
reje
cted
Clie
nts
are
notif
ied
thro
ugh
e-m
ails
/pho
nes
whe
n th
e pe
rmits
are
read
y fo
r col
lect
ion
or w
hen
appl
icat
ions
are
reje
cted
Clie
nts
are
notif
ied
thro
ugh
e-m
ails
/pho
nes
whe
n th
e pe
rmits
are
read
y fo
r col
lect
ion
or w
hen
appl
icat
ions
are
reje
cted
ope
nnes
s an
d tr
ansp
ar-
ency
Gaz
ette
the
deci
sion
s
(in fo
rmat
ion
on p
olic
ies,
bill
s,
regu
latio
ns a
nd o
ther
not
ices
)
Dev
elop
and
pub
lish
(gaz
ette
) a
guid
elin
e on
pro
duct
re
gist
ratio
n re
quire
men
ts
Upd
ate
and
publ
ish
(gaz
ette
) a
guid
elin
e on
pro
duct
re
gist
ratio
n re
quire
men
ts
Upd
ate
and
publ
ish
(gaz
ette
) a
guid
elin
e on
pro
duct
re
gist
ratio
n re
quire
men
ts
info
rmat
ion
Info
rmat
ion
avai
labl
e on
the
web
site
Qua
rterly
web
site
upd
ates
on
regi
stra
tion
requ
irem
ents
M
onth
ly w
ebsi
te u
pdat
esM
onth
ly w
ebsi
te u
pdat
es
Gui
delin
es g
azet
ted
annu
ally
Gui
delin
es g
azet
ted
annu
ally
Gui
delin
es g
azet
ted
annu
ally
Gui
delin
es g
azet
ted
annu
ally

DAFF Strategic Plan 2011/12–2014/15
86S
ER
vic
E o
bjE
cti
vE
: to
man
age
appl
icat
ions
of a
gric
ultu
ral p
rodu
ctio
n in
puts
(AP
is) w
ithin
the
Fert
ilize
rs, F
arm
Fee
ds, A
gric
ultu
ral R
emed
ies
and
Sto
ck R
emed
ies
Act
, 194
7
(Act
No.
36
of 1
947)
(con
t.)
SE
Rv
icE
ob
jEc
tiv
E: F
acili
tate
acc
ess
to lo
ans
by fa
rmer
s to
impr
ove
prod
uctio
n
Key
ser
vice
s S
ervi
ce b
enef
icia
ry
Fiel
dc
urre
nt s
tand
ard
Des
ired
sta
ndar
d
2008
/09
2009
/10
2010
/11
2011
/12
Faci
litat
e pr
oduc
tion
loan
s an
d sa
ving
s m
obili
satio
n
Sm
allh
olde
r far
mer
s ow
ning
land
, lan
d re
form
and
agr
aria
n be
nefic
iarie
s, w
omen
an
d yo
uth,
peo
ple
with
dis
abili
ties,
se
lf-he
lp g
roup
s/co
-op
erat
ives
, hou
seho
ld
prod
ucer
s th
roug
h in
term
edia
ries
Qua
ntity
A m
inim
um o
f tw
o in
term
edia
ries
per p
rovi
nce
accr
edite
d th
roug
h w
hich
cl
ient
s ac
cess
fina
ncia
l se
rvic
es
Acc
redi
t a m
inim
um o
f tw
o m
ore
inte
rmed
iarie
s pe
r pr
ovin
ce
Rev
iew
MoU
s ba
sed
on
the
perfo
rman
ce o
f the
in
term
edia
ries
in o
rder
to
impr
ove
the
effe
ctiv
enes
s an
d ef
ficie
ncy
of th
e in
ter -
med
iarie
s in
all
prov
ince
s
Brin
g in
mem
ber-
base
d fin
anci
al in
stitu
tions
as
third
-tier
ser
vice
pro
vide
rs
(inte
rmed
iarie
s at
loca
l lev
el)
to e
xten
d ou
treac
h
Qua
lity
Pro
duct
ion
loan
s of
fere
d ac
cord
ing
to M
oUs
sign
ed
with
the
inte
rmed
iarie
s
Dev
elop
Maf
isa
mon
itorin
g an
d ev
alua
tion
guid
elin
esIm
plem
ent M
afis
a m
onito
ring
and
eval
uatio
n gu
idel
ines
Mon
itor c
ompl
ianc
e w
ith
Maf
isa
mon
itorin
g an
d ev
alua
tion
guid
elin
es
Key
ser
vice
s S
ervi
ce b
enef
icia
ry
Fiel
dc
urre
nt s
tand
ard
Des
ired
sta
ndar
d
2008
/09
2009
/10
2010
/11
2011
/12
Reg
istra
tion
of a
gri-
cultu
ral p
rodu
ctio
n in
puts
acc
ordi
ng to
A
ct N
o. 3
6 of
194
7 (p
estic
ides
, sto
ck
rem
edie
s, a
nim
al
feed
s, fe
rtilis
ers,
et
c.) a
nd P
est C
ontro
l O
pera
tors
in te
rms
of
the
Ferti
lizer
s, F
arm
Fe
eds,
Agr
icul
tura
l R
emed
ies
and
Sto
ck
Rem
edie
s A
ct) (
cont
.)
Agr
icul
tura
l pr
oduc
tion
inpu
ts
prod
ucer
s (A
PIs
), m
anuf
actu
rers
and
tra
ders
(con
t.)
Red
ress
Com
plai
nts
rece
ived
at r
an-
dom
so
that
any
em
ploy
ee
can
atte
nd a
nd in
vest
igat
e en
quiri
es/c
ompl
aint
s ac
cord
-in
g to
Act
No.
36
Enq
uirie
s an
d co
mpl
aint
s di
rect
ed to
Dire
ctor
: FS
QA
Initi
ate
esta
blis
hmen
t of
a he
lpde
sk to
stre
amlin
e en
quiri
es a
nd c
ompl
aint
s
Set
up
help
desk
to d
eal w
ith
enqu
iries
(dep
endi
ng o
n th
e av
aila
bilit
y of
fund
s)
Cap
acita
te th
e he
lpde
sk to
de
al w
ith la
rge
volu
mes
of
enqu
iries
(dep
endi
ng o
n th
e av
aila
bilit
y of
fund
s)
val
ue fo
r m
oney
The
regi
stra
tion
certi
ficat
es
enab
le th
e re
gist
ratio
n ho
lder
s to
sel
l the
ir pr
oduc
ts
lega
lly
The
regi
stra
tion
certi
ficat
es
enab
le th
e re
gist
ratio
n ho
lder
s to
sel
l the
ir pr
oduc
ts
lega
lly
The
regi
stra
tion
certi
ficat
es
enab
le th
e re
gist
ratio
n ho
lder
s to
sel
l the
ir pr
oduc
ts
lega
lly
The
regi
stra
tion
certi
ficat
es
enab
le th
e re
gist
ratio
n ho
lder
s to
sel
l the
ir pr
oduc
ts
lega
lly
t im
eR
egis
tratio
n of
new
pro
duct
s is
fina
lised
with
in 1
6 m
onth
s.
and
type
s of
gen
eric
ap
plic
atio
ns a
re fi
nalis
ed
with
in s
ix m
onth
s
Reg
istra
tion
of n
ew p
rodu
cts
is fi
nalis
ed w
ithin
16
mon
ths.
Type
s of
gen
eric
app
licat
ions
ar
e fin
alis
ed w
ithin
six
mon
ths
Reg
istra
tion
of n
ew p
rodu
cts
is fi
nalis
ed w
ithin
16
mon
ths.
Type
s of
gen
eric
app
licat
ions
ar
e fin
alis
ed w
ithin
six
mon
ths
Reg
istra
tion
of n
ew p
rodu
cts
is fi
nalis
ed w
ithin
16
mon
ths.
Type
s of
gen
eric
app
licat
ions
ar
e fin
alis
ed w
ithin
six
mon
ths
Ass
ess
turn
arou
nd ti
me
for
proc
essi
ng o
f app
licat
ions
in
ord
er to
redu
ce p
roce
ss
turn
arou
nd ti
me
Dev
elop
tim
efra
mes
for
impr
ovin
g th
e pr
oces
sing
of
the
appl
icat
ions
rece
ived
Impl
emen
t the
de
velo
ped
timef
ram
es
for t
he p
roce
ssin
g of
the
appl
icat
ions
rece
ived
cos
tP
rices
for d
iffer
ent
regi
stra
tion
appl
icat
ions
are
pu
blis
hed
in T
ariff
boo
k
Pric
es fo
r diff
eren
t re
gist
ratio
n ap
plic
atio
ns a
re
publ
ishe
d in
Tar
iff b
ook
Pric
es fo
r diff
eren
t re
gist
ratio
n ap
plic
atio
ns a
re
publ
ishe
d in
Tar
iff b
ook
Pric
es fo
r diff
eren
t re
gist
ratio
n ap
plic
atio
ns a
re
publ
ishe
d in
Tar
iff b
ook
Hum
an
reso
urce
s11
vac
anci
esFi
ll th
e ex
istin
g va
canc
ies
Ass
ess
with
D: H
RM
sta
ff co
mpl
emen
t for
ade
quac
yR
eque
st D
: HR
M to
con
duct
ne
eds
anal
ysis

Annexure 2: Service Delivery Improvement Plan
87
Key
ser
vice
s S
ervi
ce b
enef
icia
ry
Fiel
dc
urre
nt s
tand
ard
Des
ired
sta
ndar
d
2008
/09
2009
/10
2010
/11
2011
/12
Faci
litat
e pr
oduc
tion
loan
s an
d sa
ving
s m
obili
satio
n (c
ont.)
Sm
allh
olde
r far
mer
s ow
ning
land
, lan
d re
form
and
agr
aria
n be
nefic
iarie
s, w
omen
an
d yo
uth,
peo
ple
with
dis
abili
ties,
se
lf-he
lp g
roup
s/co
-op
erat
ives
, hou
seho
ld
prod
ucer
s th
roug
h in
term
edia
ries
(c
ont.)
con
sulta
tion
Con
sulta
tion
in th
e fo
rm o
f te
leph
ones
, mee
tings
and
w
orks
hops
Mee
tings
, wor
ksho
ps,
tele
phon
e an
d e-
mai
lM
eetin
gs, w
orks
hops
, te
leph
one
and
e-m
ail
Con
duct
clie
nt s
atis
fact
ion
surv
eys
to d
eter
min
e if
clie
nts
are
kept
sat
isfie
d w
ith
the
serv
ices
pro
vide
d
Mee
tings
, wor
ksho
ps,
tele
phon
e an
d e-
mai
l
Impr
ove
serv
ices
bas
ed o
n th
e su
rvey
Acc
ess
Thro
ugh
accr
edite
d in
stitu
tions
:G
aute
ng: N
ER
PO
, GE
P,
Peu
lwan
aN
orth
Wes
t: N
ER
PO
, MG
K
Gro
up, P
eulw
ana
Free
Sta
te: N
ER
PO
KZN
: NE
RP
O, P
eulw
ana
Eas
tern
Cap
e: N
ER
PO
, U
vim
baW
este
rn C
ape:
NE
RP
O,
Kaa
p A
gri
Nor
ther
n C
ape:
NE
RP
O,
Kaa
p A
gri
Mpu
mal
anga
: NE
RP
O,
Hla
ngan
ani
Lim
popo
: NE
RP
O,
Hla
ngan
ani
Thro
ugh
accr
edite
d in
stitu
tions
Est
ablis
hed
AD
F ca
ll ce
ntre
te
l. 01
2 31
9 68
25
Thro
ugh
accr
edite
d in
stitu
tions
Use
pre
viou
s co
nsul
tatio
n su
gges
tions
to im
prov
e ac
cess
Cap
acita
te th
e ca
ll ce
ntre
to
resp
ond
to la
rge
volu
mes
of
enqu
iries
Thro
ugh
accr
edite
d in
stitu
tions
Incr
ease
the
num
ber o
f ac
cred
ited
inst
itutio
ns
by b
ringi
ng in
third
-tier
in
stitu
tions
(mem
ber-
base
d in
stitu
tions
)
Trai
n ca
ll ce
ntre
per
sonn
el
on c
usto
mer
ser
vice
cou
rtes
yA
lway
s ad
here
to B
atho
Pel
e pr
inci
ples
Alw
ays
adhe
re to
Bat
ho P
ele
prin
cipl
es
Incl
ude
Bat
ho P
ele
prin
cipl
es in
the
MoU
s w
ith
inte
rmed
iarie
s
Adh
ere
to B
atho
Pel
e pr
inci
ples
Dev
elop
sta
ndar
d va
lues
an
d tra
inin
g pr
ogra
mm
es o
n cu
stom
er s
ervi
ce
Adh
ere
to B
atho
Pel
e pr
inci
ples
Mon
itor a
nd e
valu
ate
the
deve
lope
d st
anda
rd v
alue
s
ope
nnes
s an
d tr
ansp
aren
cy
Info
rmat
ion
on th
e fin
anci
al
serv
ices
is a
vaila
ble
thro
ugh
repo
rts, s
ervi
ce c
atal
ogue
an
d th
e de
partm
enta
l w
ebsi
te
Info
rmat
ion
on th
e fin
anci
al
serv
ices
is a
vaila
ble
thro
ugh
repo
rts, s
ervi
ce c
atal
ogue
an
d th
e de
partm
enta
l w
ebsi
te
Upd
ate
info
rmat
ion
on th
e w
ebsi
te a
nd a
ll ot
her s
ourc
es
of in
form
atio
n re
gula
rly (a
t le
ast q
uarte
rly)
Upd
ate
info
rmat
ion
on th
e w
ebsi
te a
nd a
ll ot
her s
ourc
es
of in
form
atio
n re
gula
rly (a
t le
ast q
uarte
rly)
Pub
lish
info
rmat
ion
in v
ario
us
mag
azin
es a
nd p
aper
s
info
rmat
ion
Info
rmat
ion
is d
isse
min
ated
th
roug
h pa
mph
lets
, m
eetin
gs, w
orks
hops
and
aw
aren
ess
cam
paig
ns
Info
rmat
ion
is d
isse
min
ated
th
roug
h pa
mph
lets
, mee
t-in
gs, w
orks
hops
and
aw
are-
ness
cam
paig
ns
Info
rmat
ion
is d
isse
min
ated
th
roug
h pa
mph
lets
, mee
t-in
gs, w
orks
hops
and
aw
are-
ness
cam
paig
ns
Info
rmat
ion
is d
isse
min
ated
th
roug
h pa
mph
lets
, mee
t-in
gs, w
orks
hops
and
aw
are-
ness
cam
paig
ns
SE
Rv
icE
ob
jEc
tiv
E: F
acili
tate
acc
ess
to lo
ans
by fa
rmer
s to
impr
ove
prod
uctio
n (c
ont.)

DAFF Strategic Plan 2011/12–2014/15
88
SE
Rv
icE
ob
jEc
tiv
E: t
o al
low
acc
ess
to im
port
atio
n an
d ex
port
atio
n of
pro
duct
s
Key
ser
vice
s S
ervi
ce b
enef
icia
ry
Fiel
dc
urre
nt s
tand
ard
Des
ired
sta
ndar
d
2008
/09
2009
/10
2010
/11
2011
/12
Issu
e m
arke
t acc
ess,
im
port
and
expo
rt pe
rmits
Man
ufac
ture
rs,
proc
esso
rs a
nd
trade
rs o
f agr
icul
tura
l pr
oduc
ts
Qua
ntity
840
perm
its is
sued
per
an
num
(som
e re
new
ed
quar
terly
and
hal
f-yea
rly)
723
perm
its (t
he n
umbe
r of
perm
its is
low
er th
an in
the
prev
ious
sea
son
beca
use
spar
klin
g w
ine
will
ent
er
Eur
opea
n C
ount
ries
(EC
) m
arke
ts d
uty
free
and
quot
a fre
e (D
FQF)
as
from
1
Janu
ary
2010
)
±723
per
mits
(the
exa
ct
figur
e w
ill b
e de
term
ined
by
the
num
ber o
f app
licat
ions
re
ceiv
ed a
nd th
e pr
oduc
ts
that
are
list
ed in
the
Mar
rake
sh a
gree
men
ts)
723
perm
its (t
he e
xact
fig
ure
will
be
dete
rmin
ed b
y th
e nu
mbe
r of a
pplic
atio
ns
rece
ived
and
the
prod
ucts
th
at a
re li
sted
in th
e M
arra
kesh
agr
eem
ents
)
Qua
lity
Pro
cess
ing
adhe
res
to
guid
elin
es a
s pu
blis
hed
per
invi
tatio
n in
the
Gaz
ette
Pro
cess
ing
adhe
res
to
guid
elin
es a
s pu
blis
hed
per
invi
tatio
n in
the
Gaz
ette
Pro
cess
ing
adhe
res
to
guid
elin
es a
s pu
blis
hed
per
invi
tatio
n in
the
Gaz
ette
Pro
cess
ing
adhe
res
to
guid
elin
es a
s pu
blis
hed
per
invi
tatio
n in
the
Gaz
ette
Key
ser
vice
s S
ervi
ce b
enef
icia
ry
Fiel
dc
urre
nt s
tand
ard
Des
ired
sta
ndar
d
2008
/09
2009
/10
2010
/11
2011
/12
Faci
litat
e pr
oduc
tion
loan
s an
d sa
ving
s m
obili
satio
n (c
ont.)
Sm
allh
olde
r far
mer
s ow
ning
land
, lan
d re
form
and
agr
aria
n be
nefic
iarie
s, w
omen
an
d yo
uth,
peo
ple
with
dis
abili
ties,
se
lf-he
lp g
roup
s/co
oper
ativ
es,
hous
ehol
d pr
oduc
ers
thro
ugh
inte
rmed
iarie
s (c
ont.)
info
rmat
ion
(con
t.)C
redi
t pol
icy
and
the
Maf
isa
guid
elin
es w
ill b
e av
aila
ble
on th
e de
partm
enta
l web
site
Cre
dit p
olic
y an
d th
e M
afis
a gu
idel
ines
will
be
avai
labl
e on
the
depa
rtmen
tal w
ebsi
te
Red
ress
Com
plai
nts
lodg
ed w
ith
vario
us s
truct
ures
of t
he
inte
rmed
iarie
s an
d w
here
ne
eded
and
app
ropr
iate
the
depa
rtmen
t (A
DF)
to a
ssis
t in
reso
lvin
g th
e m
atte
r
Com
plai
nts
lodg
ed o
n A
DF
call
cent
re (0
12 3
19 6
825)
Imm
edia
te fe
edba
ck
depe
ndin
g on
the
natu
re o
f th
e en
quiry
or c
ompl
aint
s
Com
plai
nts
lodg
ed o
n A
DF
call
cent
re (0
12 3
19 6
825)
Imm
edia
te fe
edba
ck
depe
ndin
g on
the
natu
re o
f th
e en
quiry
or c
ompl
aint
s
Com
plai
nts
lodg
ed o
n A
DF
call
cent
re (0
12 3
19 6
825)
Imm
edia
te fe
edba
ck
depe
ndin
g on
the
natu
re o
f th
e en
quiry
or c
ompl
aint
s
val
ue fo
r m
oney
Pro
duct
ion
loan
s re
ceiv
ed a
t lo
wer
inte
rest
rate
com
pare
d to
com
mer
cial
ban
ks
Pro
duct
ion
loan
s re
ceiv
ed a
t lo
wer
inte
rest
rate
com
pare
d to
com
mer
cial
ban
ks
Pro
duct
ion
loan
s re
ceiv
ed a
t lo
wer
inte
rest
rate
com
pare
d to
com
mer
cial
ban
ks
Look
into
way
s of
redu
cing
ad
min
istra
tive
cost
s
Pro
duct
ion
loan
s re
ceiv
ed a
t lo
wer
inte
rest
rate
com
pare
d to
com
mer
cial
ban
ks
Red
uce
adm
inis
trativ
e co
sts
tim
e30
day
s to
pro
cess
loan
ap
plic
atio
ns30
day
s to
pro
cess
loan
ap
plic
atio
ns20
wor
king
day
s of
tu
rnar
ound
tim
e 15
wor
king
day
s of
tu
rnar
ound
tim
e
cos
tFr
ee lo
an a
pplic
atio
n Fr
ee lo
an a
pplic
atio
nFr
ee lo
an a
pplic
atio
nFr
ee lo
an a
pplic
atio
n
Hum
an
reso
urce
sU
tilis
e th
e av
aila
ble
reso
urce
sC
ondu
ct n
eeds
ana
lysi
s fo
r ad
ditio
nal r
esou
rces
Cap
acita
te p
erso
nnel
and
re
sour
ces
SE
Rv
icE
ob
jEc
tiv
E: F
acili
tate
acc
ess
to lo
ans
by fa
rmer
s to
impr
ove
prod
uctio
n (c
ont.)

Annexure 2: Service Delivery Improvement Plan
89
Key
ser
vice
s S
ervi
ce b
enef
icia
ry
Fiel
dc
urre
nt s
tand
ard
Des
ired
sta
ndar
d
2008
/09
2009
/10
2010
/11
2011
/12
Issu
e m
arke
t acc
ess,
im
port
and
expo
rt pe
rmits
(con
t.)
Man
ufac
ture
rs,
proc
esso
rs a
nd
trade
rs o
f agr
icul
tura
l pr
oduc
ts (c
ont.)
con
sulta
tion
Con
sulta
tion
on a
qua
rterly
ba
sis
thro
ugh
mee
tings
and
w
orks
hops
. All
sugg
estio
ns
and
feed
back
s ar
e di
rect
ed
to th
e D
irect
or: M
arke
ting
Tel:
01
2 31
9 84
56
E-m
ail:
DM
@da
ff.go
v.za
Fax:
01
2 31
9 81
31
In a
dditi
on to
pre
viou
s co
nsul
tatio
ns
Roa
d sh
ows
and
farm
ers’
da
ys in
Lim
popo
and
W
este
rn C
ape
prov
ince
s to
pro
mot
e in
cent
ives
for
hist
oric
ally
dis
adva
ntag
ed
busi
ness
es
In a
dditi
on to
pre
viou
s co
nsul
tatio
ns
Roa
d sh
ows
and
farm
ers’
da
ys in
Fre
e S
tate
and
K
waZ
ulu-
Nat
al p
rovi
nces
to
pro
mot
e in
cent
ives
for
hist
oric
ally
dis
adva
ntag
ed
busi
ness
es
In a
dditi
on to
pre
viou
s co
nsul
tatio
ns
Roa
d sh
ows
and
farm
ers’
da
ys in
Nor
ther
n C
ape
and
Gau
teng
pro
vinc
es
to p
rom
ote
ince
ntiv
es fo
r hi
stor
ical
ly d
isad
vant
aged
bu
sine
sses
Acc
ess
The
appl
icat
ion
form
s av
aila
ble
elec
troni
cally
at
ww
w.d
aff.g
ov.z
a
On
requ
est f
rom
: Per
mit
Offi
ceTe
l:
012
319
8064
/806
8/
8069
/807
0Fa
x:
012
319
8077
E-m
ail:
Jan
K@
daff.
gov.
zaD
uduM
@da
ff.go
v.za
Deo
nK@
daff.
gov.
zaS
isiC
@da
ff.go
v.za
The
appl
icat
ion
form
s av
aila
ble
elec
troni
cally
at
ww
w.d
aff.g
ov.z
a
On
requ
est f
rom
: Per
mit
Offi
ceTe
l:
012
319
8064
/806
8/
8069
/807
0Fa
x:
012
319
8077
E-m
ail:
Jan
K@
daff.
gov.
zaD
uduM
@da
ff.go
v.za
Deo
nK@
daff.
gov.
zaS
isiC
@da
ff.go
v.za
The
appl
icat
ion
form
s av
aila
ble
elec
troni
cally
at
ww
w.d
aff.g
ov.z
a
On
requ
est f
rom
: Per
mit
Offi
ceTe
l:
012
319
8064
/806
8/
8069
/807
0Fa
x:
012
319
8077
E-m
ail:
Jan
K@
daff.
gov.
zaD
uduM
@da
ff.go
v.za
Deo
nK@
daff.
gov.
zaS
isiC
@da
ff.go
v.za
May
als
o be
pos
ted
on re
ques
t
The
appl
icat
ion
form
s av
aila
ble
elec
troni
cally
at
ww
w.d
aff.g
ov.z
a
On
requ
est f
rom
: Per
mit
Offi
ceTe
l:
012
319
8064
/806
8/
8069
/807
0Fa
x:
012
319
8077
E-m
ail:
Jan
K@
daff.
gov.
zaD
uduM
@da
ff.go
v.za
Deo
nK@
daff.
gov.
zaS
isiC
@da
ff.go
v.za
May
als
o be
pos
ted
on re
ques
t
cou
rtes
yC
lient
s ar
e no
tifie
d th
roug
h e-
mai
ls w
hen
the
perm
its a
re
read
y fo
r col
lect
ion
Clie
nts
are
notif
ied
thro
ugh
e-m
ails
whe
n th
e pe
rmits
are
re
ady
for c
olle
ctio
n
Clie
nts
are
notif
ied
thro
ugh
e-m
ails
whe
n th
e pe
rmits
are
re
ady
for c
olle
ctio
n
App
licat
ion
form
s ca
n al
so b
e po
sted
on
requ
est
Clie
nts
are
notif
ied
thro
ugh
e-m
ails
whe
n th
e pe
rmits
are
re
ady
for c
olle
ctio
n
App
licat
ion
form
s ca
n al
so b
e po
sted
on
requ
est
ope
nnes
s an
d tr
ansp
aren
cy
App
licat
ion
proc
edur
es
publ
ishe
d in
the
Gov
ernm
ent
Gaz
ette
Nos
106
8 an
d 11
25
of 2
008.
The
gaz
ette
s ar
e av
aila
ble
elec
troni
cally
on
th
e de
partm
enta
l web
site
at
ww
w.d
aff.g
ov.z
a
App
licat
ion
proc
edur
es
publ
ishe
d in
the
Gov
ernm
ent
Gaz
ette
Nos
129
6 an
d 12
97
of 2
009.
The
gaz
ette
s ar
e av
aila
ble
elec
troni
cally
on
the
depa
rtmen
tal w
ebsi
te a
t w
ww
.daf
f.gov
.za
App
licat
ion
proc
edur
es p
ub-
lishe
d in
the
rele
vant
Gov
ern-
men
t Gaz
ette
s fo
r 201
0. T
he
gaze
ttes
will
be
avai
labl
e el
ectro
nica
lly o
n th
e de
part-
men
tal w
ebsi
te a
t ww
w.d
aff.
gov.
za o
r pos
ted
on re
ques
t
App
licat
ion
proc
edur
es p
ub-
lishe
d in
the
rele
vant
Gov
ern-
men
t Gaz
ette
s fo
r 201
1. T
he
gaze
ttes
will
be
avai
labl
e el
ectro
nica
lly o
n th
e de
part-
men
tal w
ebsi
te a
t ww
w.d
aff.
gov.
za o
r pos
ted
on re
ques
t
info
rmat
ion
Info
rmat
ion
perta
inin
g to
pe
rmits
ava
ilabl
e on
the
depa
rtmen
tal w
ebsi
te a
t w
ww
.daf
f.gov
.za
Info
rmat
ion
perta
inin
g to
pe
rmits
ava
ilabl
e on
the
depa
rtmen
tal w
ebsi
te a
t w
ww
.daf
f.gov
.za
Info
rmat
ion
perta
inin
g to
pe
rmits
ava
ilabl
e on
the
depa
rtmen
tal w
ebsi
te a
t w
ww
.daf
f.gov
.za
or p
oste
d on
requ
est
Info
rmat
ion
perta
inin
g to
pe
rmits
ava
ilabl
e on
the
depa
rtmen
tal w
ebsi
te a
t w
ww
.daf
f.gov
.za
or p
oste
d on
requ
est
SE
Rv
icE
ob
jEc
tiv
E: t
o al
low
acc
ess
to im
port
atio
n an
d ex
port
atio
n of
pro
duct
s (c
ont.)

DAFF Strategic Plan 2011/12–2014/15
90
Key
ser
vice
s S
ervi
ce b
enef
icia
ry
Fiel
dc
urre
nt s
tand
ard
Des
ired
sta
ndar
d
2008
/09
2009
/10
2010
/11
2011
/12
Issu
e m
arke
t acc
ess,
im
port
and
expo
rt pe
rmits
(con
t.)
Man
ufac
ture
rs,
proc
esso
rs a
nd
trade
rs o
f agr
icul
tura
l pr
oduc
ts (c
ont.)
Red
ress
Que
ries
dire
cted
to th
e D
irect
or: M
arke
ting
Tel:
01
2 31
9 84
56
E-m
ail:
DM
@da
ff.go
v.za
Fax:
01
2 31
9 81
31
and
Dep
uty
Dire
ctor
Tel:
01
2 31
9 80
70E
-mai
l: D
eonK
@da
ff.go
v.za
Que
ries
dire
cted
to th
e D
irect
or: M
arke
ting
Tel:
01
2 31
9 84
56
E-m
ail:
DM
@da
ff.go
v.za
Fax:
01
2 31
9 81
31
and
Dep
uty
Dire
ctor
Tel:
01
2 31
9 80
70E
-mai
l: D
eonK
@da
ff.go
v.za
Que
ries
are
ackn
owle
dged
w
ithin
one
day
and
form
al
feed
back
with
in th
ree
days
(d
epen
ding
on
the
natu
re o
f th
e qu
ery)
Que
ries
dire
cted
to th
e D
irect
or: M
arke
ting
Tel:
01
2 31
9 84
56
E-m
ail:
DM
@da
ff.go
v.za
Fax:
01
2 31
9 81
31
and
Dep
uty
Dire
ctor
Tel:
01
2 31
9 80
70E
-mai
l: D
eonK
@da
ff.go
v.za
Que
ries
are
ackn
owle
dged
w
ithin
one
day
and
form
al
feed
back
with
in tw
o da
ys
(dep
endi
ng o
n th
e na
ture
of
the
quer
y)
Que
ries
dire
cted
to th
e D
irect
or: M
arke
ting
Tel:
01
2 31
9 84
56
E-m
ail:
DM
@da
ff.go
v.za
Fax:
01
2 31
9 81
31
and
Dep
uty
Dire
ctor
Tel:
01
2 31
9 80
70E
-mai
l: D
eonK
@da
ff.go
v.za
Que
ries
are
ackn
owle
dged
an
d fo
rmal
feed
back
giv
en
with
in o
ne d
ay (d
epen
ding
on
the
natu
re o
f the
que
ry)
val
ue fo
r m
oney
Per
mits
allo
w c
lient
s to
ef-
ficie
ntly
impo
rt an
d ex
port
agric
ultu
ral p
rodu
cts
at
pref
eren
tial r
ates
Per
mits
allo
w c
lient
s to
ef
ficie
ntly
impo
rt an
d ex
port
agric
ultu
ral p
rodu
cts
at
pref
eren
tial r
ates
Per
mits
allo
w c
lient
s to
ef
ficie
ntly
impo
rt an
d ex
port
agric
ultu
ral p
rodu
cts
at
pref
eren
tial r
ates
Per
mits
allo
w c
lient
s to
ef
ficie
ntly
impo
rt an
d ex
port
agric
ultu
ral p
rodu
cts
at
pref
eren
tial r
ates
tim
eO
ne m
onth
’s n
otic
e fo
r in
vita
tions
One
-mon
th p
erio
d fo
r one
-ye
ar v
alid
ity p
erio
d fo
r pe
rmits
unl
ess
spec
ified
di
ffere
ntly
One
mon
th’s
not
ice
for
invi
tatio
ns
One
-mon
th p
erio
d fo
r one
-ye
ar v
alid
ity p
erio
d fo
r pe
rmits
unl
ess
spec
ified
di
ffere
ntly
One
mon
th’s
not
ice
for
invi
tatio
ns
One
-mon
th p
erio
d fo
r one
-ye
ar v
alid
ity p
erio
d fo
r pe
rmits
unl
ess
spec
ified
di
ffere
ntly
One
mon
th’s
not
ice
for
invi
tatio
ns
One
-mon
th p
erio
d fo
r one
-ye
ar v
alid
ity p
erio
d fo
r pe
rmits
unl
ess
spec
ified
di
ffere
ntly
cos
tR
350,
00R
395,
00R
435,
00To
be
dete
rmin
ed
SE
Rv
icE
ob
jEc
tiv
E: t
o al
low
acc
ess
to im
port
atio
n an
d ex
port
atio
n of
pro
duct
s (c
ont.)
SE
Rv
icE
ob
jEc
tiv
E: i
nfor
m fa
rmer
s an
d th
e pu
blic
on
food
pri
ce tr
ends
for
deci
sion
mak
ing
Key
ser
vice
s S
ervi
ce b
enef
icia
ry
Fiel
dc
urre
nt s
tand
ard
Des
ired
sta
ndar
d
2008
/09
2009
/10
2010
/11
2011
/12
Food
pric
e m
onito
ring
repo
rtC
onsu
mer
s (r
ural
and
ur
ban)
, com
petit
ion
com
mis
sion
and
re
taile
rs
Qua
ntity
Four
repo
rts o
n fo
od p
rice
in-
form
atio
n pu
blis
hed
annu
ally
Four
repo
rts o
n fo
od p
rice
in-
form
atio
n pu
blis
hed
annu
ally
Four
repo
rts o
n fo
od p
rice
in-
form
atio
n pu
blis
hed
annu
ally
Four
repo
rts o
n fo
od p
rice
in-
form
atio
n pu
blis
hed
annu
ally
Qua
lity
Acc
urat
e an
d re
leva
nt
info
rmat
ion
repo
rt is
sued
Acc
urat
e an
d re
leva
nt
info
rmat
ion
repo
rt is
sued
Acc
urat
e an
d re
leva
nt
info
rmat
ion
repo
rt is
sued
Acc
urat
e an
d re
leva
nt
info
rmat
ion
repo
rt is
sued

Annexure 2: Service Delivery Improvement Plan
91
Key
ser
vice
s S
ervi
ce b
enef
icia
ry
Fiel
dc
urre
nt s
tand
ard
Des
ired
sta
ndar
d
2008
/09
2009
/10
2010
/11
2011
/12
Food
pric
e m
onito
ring
repo
rt (c
ont.)
Con
sum
ers
(rur
al a
nd
urba
n), C
ompe
titio
n C
omm
issi
on a
nd
reta
ilers
(con
t.)
con
sulta
tion
All
sugg
estio
ns a
nd fe
ed-
back
s ar
e di
rect
ed th
roug
h e-
mai
l, w
orks
hops
and
mee
t-in
gs o
n a
quar
terly
bas
is to
th
e D
irect
or: M
arke
ting
Tel:
01
2 31
9 84
56E
-mai
l: D
M@
daff.
gov.
zaFa
x:
012
319
8131
or
And
ré J
oost
eTe
l:
012
341
1115
E-m
ail:
andr
e@na
mc.
co.z
a
Thes
e in
puts
are
inco
rp-
orat
ed in
to th
e ne
xt is
sue
of
the
repo
rt
All
sugg
estio
ns a
nd fe
ed-
back
s ar
e di
rect
ed th
roug
h e-
mai
l, w
orks
hops
and
mee
t-in
gs o
n a
quar
terly
bas
is to
th
e D
irect
or: M
arke
ting
Tel:
01
2 31
9 84
56E
-mai
l: D
M@
daff.
gov.
zaFa
x:
012
319
8131
or
And
ré J
oost
eTe
l:
012
341
1115
E-m
ail:
andr
e@na
mc.
co.z
a
Thes
e in
puts
will
be
inco
rp-
orat
ed w
ithin
a m
onth
and
a
repo
rt re
issu
ed
Acc
ess
Qua
rterly
med
ia re
leas
e on
food
tren
ds, q
uarte
rly
repo
rts p
ublis
hed
on th
e M
IS
web
site
: ww
w.a
gis.
agric
.za
an
d N
AM
C w
ebsi
te:
ww
w.n
amc.
co.z
a
Qua
rterly
med
ia re
leas
e on
food
tren
ds, q
uarte
rly
repo
rts p
ublis
hed
on th
e M
IS
web
site
: ww
w.a
gis.
agric
.za
an
d N
AM
C w
ebsi
te:
ww
w.n
amc.
co.z
a
Thes
e re
ports
are
als
o se
nt
by e
-mai
l to
bene
ficia
ries
Qua
rterly
med
ia re
leas
e on
food
tren
ds, q
uarte
rly
repo
rts p
ublis
hed
on th
e M
IS
web
site
: ww
w.a
gis.
agric
.za
an
d N
AM
C w
ebsi
te:
ww
w.n
amc.
co.z
a
Thes
e re
ports
will
als
o be
se
nt b
y e-
mai
l to
bene
fi-ci
arie
s, a
nd h
ard
copi
es w
ill
be s
ent o
n re
ques
t
Qua
rterly
med
ia re
leas
e on
food
tren
ds, q
uarte
rly
repo
rts p
ublis
hed
on th
e M
IS
web
site
: ww
w.a
gis.
agric
.za
an
d N
AM
C w
ebsi
te:
ww
w.n
amc.
co.z
a
Thes
e re
ports
will
als
o be
se
nt b
y e-
mai
l to
bene
fi-ci
arie
s, a
nd h
ard
copi
es w
ill
be s
ent o
n re
ques
t
cou
rtes
yD
ata
from
800
col
lect
ion
poin
ts a
re re
ceiv
ed o
n a
mon
thly
bas
is a
nd a
ggre
-ga
ted
into
qua
rters
. The
dat
a w
ere
anal
ysed
and
a re
port
publ
ishe
d w
ithin
a w
eek
Dat
a fro
m 8
00 c
olle
ctio
n po
ints
are
rece
ived
on
a m
onth
ly b
asis
and
agg
re-
gate
d in
to q
uarte
rs. T
he d
ata
wer
e an
alys
ed a
nd a
repo
rt pu
blis
hed
with
in a
wee
k
Rep
ort p
ublis
hed
with
in fo
ur
days
of r
ecei
ving
dat
a
Sen
d re
gula
r rem
inde
rs o
n re
leas
e of
upc
omin
g re
ports
Rep
ort p
ublis
hed
with
in
thre
e da
ys o
f rec
eivi
ng d
ata
Sen
d re
gula
r rem
inde
rs o
n re
leas
e of
upc
omin
g re
ports
ope
nnes
s an
d tr
ansp
aren
cy
Dat
a co
llect
ion
met
hods
an
d an
alys
is a
re d
escr
ibed
in
App
endi
x F
of e
ach
food
pr
ice
mon
itorin
g re
port
Dat
a co
llect
ion
met
hods
an
d an
alys
is a
re d
escr
ibed
in
App
endi
x F
of e
ach
food
pr
ice
mon
itorin
g re
port
Dat
a co
llect
ion
met
hods
and
an
alys
is w
ill b
e de
scrib
ed
in A
ppen
dix
F of
eac
h fo
od
pric
e m
onito
ring
repo
rt
Dat
a co
llect
ion
met
hods
and
an
alys
is w
ill b
e de
scrib
ed
in A
ppen
dix
F of
eac
h fo
od
pric
e m
onito
ring
repo
rt
i nfo
rmat
ion
All
repo
rts w
ere
avai
labl
e on
th
e A
GIS
web
site
: ww
w.a
gis.
agric
.za
and
NA
MC
web
site
: w
ww
.nam
c.co
.za
All
repo
rts w
ere
avai
labl
e on
th
e A
GIS
web
site
: ww
w.a
gis.
agric
.za
and
NA
MC
web
site
: w
ww
.nam
c.co
.za
All
repo
rts w
ere
avai
labl
e on
th
e A
GIS
web
site
: ww
w.a
gis.
agric
.za
and
NA
MC
web
site
: w
ww
.nam
c.co
.za
Har
d co
pies
ava
ilabl
e on
re
ques
t
All
repo
rts w
ere
avai
labl
e on
th
e A
GIS
web
site
: ww
w.a
gis.
agric
.za
and
NA
MC
web
site
: w
ww
.nam
c.co
.za
Har
d co
pies
ava
ilabl
e on
re
ques
t
SE
Rv
icE
ob
jEc
tiv
E: i
nfor
m fa
rmer
s an
d th
e pu
blic
on
food
pri
ce tr
ends
for
deci
sion
mak
ing
(con
t.)

DAFF Strategic Plan 2011/12–2014/15
92
Key
ser
vice
s S
ervi
ce b
enef
icia
ry
Fiel
dc
urre
nt s
tand
ard
Des
ired
sta
ndar
d
2008
/09
2009
/10
2010
/11
2011
/12
Food
Pric
e M
onito
ring
repo
rt (c
ont.)
Con
sum
ers
(rur
al a
nd
urba
n), C
ompe
titio
n C
omm
issi
on a
nd
reta
ilers
(con
t.)
Red
ress
All
quer
ies
dire
cted
to
the
Dire
ctor
: Mar
ketin
gTe
l:
012
319
8456
E-m
ail:
DM
@da
ff.go
v.za
Fax:
01
2 31
9 81
31or
A
ndré
Joo
ste
Tel:
01
2 34
1 11
15E
-mai
l: a
ndre
@na
mc.
co.z
a
Que
ries
wer
e ad
dres
sed
imm
edia
tely
. If t
hey
requ
ired
inve
stig
atio
n, th
ey w
ere
addr
esse
d w
ithin
a w
eek
All
quer
ies
dire
cted
to
the
Dire
ctor
: Mar
ketin
gTe
l:
012
319
8456
E-m
ail:
DM
@da
ff.go
v.za
Fax:
01
2 31
9 81
31or
A
ndré
Joo
ste
Tel:
01
2 34
1 11
15E
-mai
l: a
ndre
@na
mc.
co.z
a
Que
ries
are
addr
esse
d im
med
iate
ly. I
f the
y re
quire
in
vest
igat
ion,
they
are
ad
dres
sed
with
in a
wee
k
All
quer
ies
dire
cted
to
the
Dire
ctor
: Mar
ketin
gTe
l:
012
319
8456
E-m
ail:
DM
@da
ff.go
v.za
Fax:
01
2 31
9 81
31or
A
ndré
Joo
ste
Tel:
01
2 34
1 11
15E
-mai
l: a
ndre
@na
mc.
co.z
a
Que
ries
will
be
addr
esse
d im
med
iate
ly. I
f the
y re
quire
in
vest
igat
ion,
they
will
be
addr
esse
d w
ithin
thre
e da
ys
val
ue fo
r m
oney
Food
pric
e m
onito
ring
repo
rts a
re u
sefu
l for
de
cisi
on m
akin
g
Cre
ates
aw
aren
ess
of fo
od
pric
e tre
nds
Food
pric
e m
onito
ring
repo
rts a
re u
sefu
l for
de
cisi
on m
akin
g
Will
cre
ate
awar
enes
s of
fo
od p
rice
trend
s
Food
pric
e m
onito
ring
repo
rts a
re u
sefu
l for
de
cisi
on m
akin
g
Will
cre
ate
awar
enes
s of
fo
od p
rice
trend
s
Food
pric
e m
onito
ring
repo
rts a
re u
sefu
l for
de
cisi
on m
akin
g
tim
eQ
uarte
rly
Qua
rterly
Q
uarte
rly
Qua
rterly
cos
tFr
ee
Free
Fr
ee
Free
Hum
an
reso
urce
s8
(NA
MC
sta
ff)8
(NA
MC
sta
ff)8
(NA
MC
sta
ff)8
(NA
MC
sta
ff)
SE
Rv
icE
ob
jEc
tiv
E: i
nfor
m fa
rmer
s an
d th
e pu
blic
on
food
pri
ce tr
ends
for
deci
sion
mak
ing
(con
t.)
SE
Rv
icE
ob
jEc
tiv
E: t
o pr
ovid
e m
arke
ting
info
rmat
ion
for
sele
cted
com
mod
ities
Key
ser
vice
s S
ervi
ce b
enef
icia
ry
Fiel
dc
urre
nt s
tand
ard
Des
ired
sta
ndar
d
2008
/09
2009
/10
2010
/11
2011
/12
Agr
icul
tura
l co
mm
odity
pro
files
an
d m
arke
t ana
lysi
s re
ports
Land
and
agr
aria
n re
form
ben
efic
iarie
s,
com
mun
al fa
rmer
s,
emer
ging
farm
ers,
co
mm
odity
as
soci
atio
ns,
exte
nsio
n of
ficer
s
and
cons
ulta
nts
Qua
ntity
29 m
arke
t rep
orts
per
qua
rter
and
34 c
omm
odity
pro
files
an
nual
ly
29 m
arke
t rep
orts
per
qua
rter
and
34 c
omm
odity
pro
files
an
nual
ly
29 m
arke
t rep
orts
per
qua
rter
and
34 c
omm
odity
pro
files
an
nual
ly
29 m
arke
t rep
orts
per
qua
rter
and
34 c
omm
odity
pro
files
an
nual
ly
Qua
lity
Rep
orts
with
acc
urat
e an
d re
leva
nt in
form
atio
nR
epor
ts w
ith a
ccur
ate
and
rele
vant
info
rmat
ion
Rep
orts
with
acc
urat
e an
d re
leva
nt in
form
atio
nR
epor
ts w
ith a
ccur
ate
and
rele
vant
info
rmat
ion
con
sulta
tion
All
sugg
estio
ns a
nd fe
ed-
back
s w
ere
dire
cted
thro
ugh
e-m
ail a
nd p
hone
cal
ls to
th
e D
irect
or: M
arke
ting
Tel:
01
2 31
9 84
56
E-m
ail:
DM
@da
ff.go
v.za
Fa
x:
012
319
8131
All
sugg
estio
ns a
nd fe
ed-
back
s ar
e di
rect
ed th
roug
h e-
mai
l and
pho
ne c
alls
to
the
Dire
ctor
: Mar
ketin
gTe
l:
012
319
8456
E
-mai
l: D
M@
daff.
gov.
za
Fax:
01
2 31
9 81
31
All
sugg
estio
ns a
nd fe
ed-
back
s ar
e di
rect
ed th
roug
h e-
mai
l and
pho
ne c
alls
to
the
Dire
ctor
: Mar
ketin
gTe
l:
012
319
8456
E
-mai
l: D
M@
daff.
gov.
za
Fax:
01
2 31
9 81
31
All
sugg
estio
ns a
nd fe
ed-
back
s ar
e di
rect
ed th
roug
h e-
mai
l and
pho
ne c
alls
to
the
Dire
ctor
: Mar
ketin
gTe
l:
012
319
8456
E
-mai
l: D
M@
daff.
gov.
za
Fax:
01
2 31
9 81
31

Annexure 2: Service Delivery Improvement Plan
93
Key
ser
vice
s S
ervi
ce b
enef
icia
ry
Fiel
dc
urre
nt s
tand
ard
Des
ired
sta
ndar
d
2008
/09
2009
/10
2010
/11
2011
/12
Agr
icul
tura
l co
mm
odity
pro
files
an
d m
arke
t ana
lysi
s re
ports
(con
t.)
Land
and
agr
aria
n re
form
ben
efic
iarie
s,
com
mun
al fa
rmer
s,
emer
ging
farm
ers,
co
mm
odity
as
soci
atio
ns,
exte
nsio
n of
ficer
s an
d co
nsul
tant
s (c
ont.)
Acc
ess
Pro
files
and
mar
ket r
epor
ts
avai
labl
e on
MIS
web
site
at
ww
w.a
gis.
agric
.za/
mis
Pro
files
har
d co
pies
ava
il-ab
le th
roug
h pr
ovin
cial
co
ordi
nato
rs
Pro
files
and
mar
ket r
epor
ts
avai
labl
e on
MIS
web
site
at
ww
w.a
gis.
agric
.za/
mis
Pro
files
and
mar
ket r
epor
ts
avai
labl
e on
MIS
web
site
at
ww
w.a
gis.
agric
.za/
mis
Pro
files
and
mar
ket r
epor
ts
avai
labl
e on
MIS
web
site
at
ww
w.a
gis.
agric
.za/
mis
cou
rtes
yA
ll do
cum
ents
are
sen
t to
prov
inci
al c
oord
inat
ors
with
in
eigh
t wee
ks (f
or p
rofil
es)
and
two
wee
ks (f
or m
arke
t re
ports
)
All
docu
men
ts a
re s
ent t
o pr
ovin
cial
coo
rdin
ator
s w
ithin
fo
ur w
eeks
(for
pro
files
) and
a
wee
k (fo
r mar
ket r
epor
ts)
All
docu
men
ts a
re s
ent t
o pr
ovin
cial
coo
rdin
ator
s an
d re
gula
r clie
nts
with
in a
wee
k
(for p
rofil
es) a
nd w
ithin
a d
ay
(for m
arke
t rep
orts
)
All
docu
men
ts a
re s
ent t
o pr
ovin
cial
coo
rdin
ator
s an
d re
gula
r clie
nts
with
in a
wee
k
(for p
rofil
es) a
nd w
ithin
a d
ay
(for m
arke
t rep
orts
)
ope
nnes
s an
d tr
ansp
aren
cy
All
sour
ces
of d
ata
and
refe
renc
es a
re li
sted
th
roug
hout
the
prof
iles
and
mar
ket r
epor
t doc
umen
ts
All
sour
ces
of d
ata
and
refe
renc
es a
re li
sted
th
roug
hout
the
prof
iles
and
mar
ket r
epor
t doc
umen
ts
All
sour
ces
of d
ata
and
refe
renc
es a
re li
sted
th
roug
hout
the
prof
iles
and
mar
ket r
epor
t doc
umen
ts
All
sour
ces
of d
ata
and
refe
renc
es a
re li
sted
th
roug
hout
the
prof
iles
and
mar
ket r
epor
t doc
umen
ts
info
rmat
ion
Sam
e as
acc
ess
Sam
e as
acc
ess
Sam
e as
acc
ess
Sam
e as
acc
ess
Red
ress
All
quer
ies
dire
cted
to
the
Dire
ctor
: Mar
ketin
gTe
l:
012
319
8456
E
-mai
l: D
M@
daff.
gov.
za
Fax:
01
2 31
9 81
31
All
enqu
iries
atte
nded
to
with
in a
wee
k
All
quer
ies
dire
cted
to
the
Dire
ctor
: Mar
ketin
gTe
l:
012
319
8456
E
-mai
l: D
M@
daff.
gov.
za
Fax:
01
2 31
9 81
31
Que
ries
are
ackn
owle
dged
w
ithin
one
day
and
form
al
feed
back
with
in th
ree
days
(d
epen
ding
on
the
natu
re o
f th
e qu
ery)
All
quer
ies
dire
cted
to
the
Dire
ctor
: Mar
ketin
gTe
l:
012
319
8456
E
-mai
l: D
M@
daff.
gov.
za
Fax:
01
2 31
9 81
31
Que
ries
are
ackn
owle
dged
w
ithin
one
day
and
form
al
feed
back
with
in tw
o da
ys
(dep
endi
ng o
n th
e na
ture
of
the
quer
y)
All
quer
ies
dire
cted
to
the
Dire
ctor
: Mar
ketin
gTe
l:
012
319
8456
E
-mai
l: D
M@
daff.
gov.
za
Fax:
01
2 31
9 81
31
Que
ries
are
ackn
owle
dged
w
ithin
one
day
and
form
al
feed
back
with
in tw
o da
ys
(dep
endi
ng o
n th
e na
ture
of
the
quer
y)
val
ue fo
r m
oney
Pro
vide
mar
ketin
g in
form
atio
n on
sel
ecte
d ag
ricul
tura
l com
mod
ities
to
hel
p in
pro
duct
ion
and
mar
ketin
g de
cisi
ons
Pro
vide
mar
ketin
g in
form
atio
n on
sel
ecte
d ag
ricul
tura
l com
mod
ities
to
hel
p in
pro
duct
ion
and
mar
ketin
g de
cisi
ons
Pro
vide
mar
ketin
g in
form
atio
n on
sel
ecte
d ag
ricul
tura
l com
mod
ities
to
hel
p in
pro
duct
ion
and
mar
ketin
g de
cisi
ons
Pro
vide
mar
ketin
g in
form
atio
n on
sel
ecte
d ag
ricul
tura
l com
mod
ities
to
hel
p in
pro
duct
ion
and
mar
ketin
g de
cisi
ons
tim
eP
rofil
e ha
rd c
opie
s av
aila
ble
thro
ugh
prov
inci
al
coor
dina
tors
with
in e
ight
w
eeks
and
mar
ket r
epor
ts
avai
labl
e w
ithin
two
wee
ks
Pro
file
hard
cop
ies
avai
labl
e th
roug
h pr
ovin
cial
co
ordi
nato
rs w
ithin
four
w
eeks
and
mar
ket r
epor
ts
avai
labl
e w
ithin
a w
eek
Pro
files
dis
tribu
ted
on
com
pact
dis
ks w
ithin
a w
eek
and
mar
ket r
epor
ts w
ithin
a
day
Pro
files
dis
tribu
ted
on
com
pact
dis
ks w
ithin
a w
eek
and
mar
ket r
epor
ts w
ithin
a
day
cos
tFr
eeFr
eeFr
eeFr
ee
Hum
an
reso
urce
s5
67
7
SE
Rv
icE
ob
jEc
tiv
E: t
o pr
ovid
e m
arke
ting
info
rmat
ion
for
sele
cted
com
mod
ities
(con
t.)

DAFF Strategic Plan 2011/12–2014/15
94S
ER
vic
E o
bjE
cti
vE
: to
impr
ove
know
ledg
e on
inte
rnat
iona
l mar
ket a
nd e
xpor
t opp
ortu
nitie
s, th
us im
prov
ing
clie
nts’
exp
ort a
bilit
ies
Key
ser
vice
s S
ervi
ce b
enef
icia
ry
Fiel
dc
urre
nt s
tand
ard
Des
ired
sta
ndar
d
2008
/09
2009
/10
2010
/11
2011
/12
Pro
vide
agr
icul
tura
l tra
de re
late
d in
form
atio
n on
:
•Fo
reig
n tra
de
nego
tiatio
ns,
cons
ulta
tions
and
ag
reem
ents
•R
esea
rch
info
rmat
ion
on
inte
rnat
iona
l m
arke
ts, e
xpor
t op
portu
nitie
s an
d re
late
d im
port
and
expo
rt re
quire
men
ts
Agr
icul
tura
l ind
ustri
espr
oduc
ers,
pro
ces-
sors
, tra
ders
, con
-su
mer
s, O
rgan
ised
A
gric
ultu
re, N
AM
C,
Land
Ban
k, th
e dt
i, P
DA
s, tr
ade
prom
o-tio
n or
gani
satio
ns in
pr
ovin
ces,
ser
vice
pr
ovid
ers
on tr
ade
and
farm
er e
xpor
ters
Qua
ntity
Four
trad
e ne
gotia
tions
: E
PA, E
FTA
, ME
RC
OS
UR
an
d TI
DC
A
Thre
e co
untry
-spe
cific
trad
e pr
ofile
s
Thre
e tra
de n
egot
iatio
ns;
EPA
, TID
CA
and
Indi
a
Pre
para
tory
pha
se fo
r en
gage
men
t in
futu
re tr
ade
nego
tiatio
ns o
f int
ra-A
frica
Thre
e pr
ovin
cial
trad
e aw
aren
ess
wor
ksho
ps a
nd
one
trade
bro
chur
e/m
anua
l pe
r ann
um
Five
cou
ntry
-spe
cific
trad
e an
d m
arke
t app
roac
hes
on
Indi
a, C
hina
, US
, Jap
an a
nd
Sau
di A
rabi
a
Ant
icip
ate
that
par
ticip
atio
n w
ill b
e in
five
trad
e ne
gotia
-tio
ns: W
TO, E
PAs,
US
, Af-
rica
Trip
artit
e an
d In
dia
Sta
rt th
e na
tiona
l tra
inin
g fo
r 15
offi
cial
s pe
r ann
um in
the
depa
rtmen
t on
inte
rnat
iona
l tra
de a
naly
sis
(MoU
with
ITC
) P
rodu
ce o
ne o
r mor
e pr
ovin
cial
trad
e aw
aren
ess
wor
ksho
p an
d tra
de
broc
hure
/man
ual p
er a
nnum
Ant
icip
ate
that
par
ticip
atio
n w
ill b
e in
five
trad
e ne
gotia
-tio
ns: W
TO, E
PAs,
US
, Af-
rica
Trip
artit
e an
d In
dia
Pro
vide
nat
iona
l tra
inin
g to
15
offi
cial
s pe
r ann
um in
the
depa
rtmen
t on
inte
rnat
iona
l tra
de a
naly
sis
(MoU
with
IT
C).
Pro
duce
and
pub
lish
eigh
t mar
ket a
naly
sis
repo
rtsP
rodu
ce o
ne o
r mor
e pr
ovin
cial
trad
e aw
aren
ess
wor
ksho
p an
d tra
de
broc
hure
/man
ual p
er a
nnum
con
sulta
tion
Agr
icul
tura
l Tra
de F
orum
(A
TF) m
eetin
gs e
very
six
w
eeks
ATF
mee
tings
eve
ry
six
wee
ks
One
spe
cial
pol
icy
mee
ting
with
the
indu
stry
ATF
mee
tings
eve
ry
six
wee
ks
One
or m
ore
spec
ial
polic
y br
iefs
per
ann
um o
n sp
ecia
lised
topi
cs
Mee
t with
the
prov
inci
al tr
ade
prom
otio
n or
gani
satio
ns a
nd
PD
A p
rior t
o tra
de c
ampa
ign
Pro
vide
pro
vinc
ial a
cces
s to
IT
C tr
aini
ng M
oU
ATF
mee
tings
eve
ry
six
wee
ks
One
or m
ore
spec
ial A
TF
mee
tings
per
ann
um
Rev
iew
the
need
as
sess
men
t with
ser
vice
pr
ovid
ers
on e
xpor
t in
form
atio
n re
quire
d
Pro
vide
pro
vinc
ial a
cces
s to
IT
C tr
aini
ng M
oU
Qua
lity
Pro
vide
rele
vant
, acc
urat
e an
d tim
ely
info
rmat
ion
Pro
vide
rele
vant
, acc
urat
e an
d tim
ely
info
rmat
ion
Pro
vide
rele
vant
, acc
urat
e an
d tim
ely
info
rmat
ion
Pro
vide
rele
vant
, acc
urat
e an
d tim
ely
info
rmat
ion
Acc
ess
Clie
nts
can
phon
e, fa
x,
e-m
ail o
r dire
ctly
vis
it th
e di
rect
orat
e
Clie
nts
can
phon
e, fa
x,
e-m
ail o
r dire
ctly
vis
it th
e di
rect
orat
e
Pro
activ
e su
bmis
sion
s an
d br
iefin
gs
Clie
nts
can
phon
e, fa
x,
e-m
ail o
r dire
ctly
vis
it th
e di
rect
orat
e
Pro
activ
e su
bmis
sion
s an
d br
iefin
gs
Pro
vide
nat
iona
l acc
ess
to
info
rmat
ion
on tr
ade
and
expo
rts
Clie
nts
can
phon
e, fa
x,
e-m
ail o
r dire
ctly
vis
it th
e di
rect
orat
e
Pro
activ
e su
bmis
sion
s an
d br
iefin
gs
Pro
vide
nat
iona
l acc
ess
to
info
rmat
ion
on tr
ade
and
expo
rts
cou
rtes
yA
TF m
inut
es c
ircul
ated
to
clie
nts
as s
oon
as a
vaila
ble
Rel
evan
t upd
ates
are
sen
t re
gula
rly to
all
mem
bers
ATF
min
utes
circ
ulat
ed to
cl
ient
s as
soo
n as
ava
ilabl
e
Rel
evan
t upd
ates
are
sen
t re
gula
rly to
all
mem
bers
ATF
min
utes
circ
ulat
ed to
cl
ient
s as
soo
n as
ava
ilabl
e
Rel
evan
t upd
ates
are
sen
t re
gula
rly to
all
mem
bers
ATF
min
utes
circ
ulat
ed to
cl
ient
s as
soo
n as
ava
ilabl
e
Rel
evan
t upd
ates
are
sen
t re
gula
rly to
all
mem
bers

Annexure 2: Service Delivery Improvement Plan
95
Key
ser
vice
s S
ervi
ce b
enef
icia
ry
Fiel
dc
urre
nt s
tand
ard
Des
ired
sta
ndar
d
2008
/09
2009
/10
2010
/11
2011
/12
Pro
vide
agr
icul
tura
l tra
de re
late
d in
form
atio
n on
(c
ont.)
: •Fo
reig
n tra
de
nego
tiatio
ns,
cons
ulta
tions
and
ag
reem
ents
•R
esea
rch
info
rmat
ion
on
inte
rnat
iona
l m
arke
ts, e
xpor
t op
portu
nitie
s an
d re
late
d im
port
and
expo
rt re
quire
men
ts
Agr
icul
tura
l ind
ustri
espr
oduc
ers,
pro
ces-
sors
, tra
ders
, con
-su
mer
s, O
rgan
ised
A
gric
ultu
re, N
AM
C,
Land
Ban
k, d
ti,
PD
As,
trad
e pr
omo-
tion
orga
nisa
tions
in
prov
ince
s, s
ervi
ce
prov
ider
s on
trad
e an
d fa
rmer
exp
orte
rs
(con
t.)
ope
nnes
s an
d tr
ansp
aren
cy
Cou
ntry
pro
files
are
pos
ted
on th
e in
tern
etC
ount
ry m
arke
t app
roac
hes
are
post
ed o
n th
e in
trane
t
Con
tinuo
usly
upd
ate
pro v
-in
ces
with
new
and
rele
vant
in
form
atio
n vi
a th
e A
TFE
lect
roni
c/w
ebsi
te d
istri
butio
n of
exp
ort m
anua
l/bro
chur
e an
d in
form
atio
n on
Tra
de
Aw
aren
ess
Cam
paig
ns P
ublis
h IT
C s
tudi
es o
n w
orld
m
arke
ts o
n D
AFF
web
site
Con
tinuo
usly
upd
ate
prov
-in
ces
with
new
and
rele
vant
in
form
atio
n vi
a A
TFE
lect
roni
c/w
ebsi
te d
istri
butio
n of
exp
ort m
anua
l/bro
chur
e an
d in
form
atio
n on
Tra
de
Aw
aren
ess
Cam
paig
ns
Sta
rt pl
anni
ng o
n po
ssib
le
med
ia in
form
atio
n fo
r re
achi
ng a
wid
er a
udie
nce
Pub
lish
ITC
stu
dies
on
wor
ld
mar
kets
on
DA
FF w
ebsi
te
i nfo
rmat
ion
ATP
R re
ports
pub
lishe
d on
th
e in
tern
et
Trad
e aw
aren
ess
cam
paig
ns
for n
ew e
ntra
nts
Rep
orts
on
inte
rnat
iona
l ag
ricul
tura
l mar
kets
pu
blis
hed
on th
e w
eb
ATP
R p
ublis
hed
on th
e in
tern
etTr
ade
awar
enes
s ca
mpa
igns
ATP
R p
ublis
hed
on th
e in
tern
et
Des
ensi
tised
ATF
min
utes
/re
ports
sen
t to
stak
ehol
ders
fo
r inf
orm
atio
nTr
ade
awar
enes
s ca
mpa
ign/
ex
porte
r man
ual/b
roch
ure
ATP
R p
ublis
hed
on th
e in
tern
et
Des
ensi
tised
ATF
min
utes
/re
ports
sen
t to
stak
ehol
ders
fo
r inf
orm
atio
nTr
ade
awar
enes
s ca
mpa
ign/
expo
rter m
anua
l/bro
chur
e
Red
ress
All
enqu
iries
are
ans
wer
ed in
th
ree
days
Tailo
red
and
diffi
cult
inqu
iries
re
quiri
ng a
dditi
onal
rese
arch
do
not
hav
e a
pred
efin
ed
resp
onse
tim
e
All
enqu
iries
are
ans
wer
ed in
th
ree
days
Tailo
red
and
diffi
cult
inqu
iries
re
quiri
ng a
dditi
onal
rese
arch
do
not
hav
e a
pred
efin
ed
resp
onse
tim
e
All
enqu
iries
are
ans
wer
ed in
th
ree
days
Tailo
red
and
diffi
cult
inqu
iries
re
quiri
ng a
dditi
onal
rese
arch
do
not
hav
e a
pred
efin
ed
resp
onse
tim
e
All
enqu
iries
are
ans
wer
ed in
th
ree
days
Exp
and
docu
men
tatio
n ce
ntre
with
pro
duct
-rel
ated
in
quiri
es to
ena
ble
impr
oved
re
spon
se
val
ue fo
r m
oney
Info
rmat
ion
assi
sts
clie
nts
in te
rms
of a
gric
ultu
ral t
rade
re
late
d de
cisi
ons
Info
rmat
ion
assi
sts
clie
nts
in te
rms
of a
gric
ultu
ral t
rade
re
late
d de
cisi
ons
Info
rmat
ion
assi
sts
clie
nts
in te
rms
of a
gric
ultu
ral t
rade
re
late
d de
cisi
ons
Info
rmat
ion
assi
sts
clie
nts
in te
rms
of a
gric
ultu
ral t
rade
re
late
d de
cisi
ons
tim
eTe
leph
onic
info
rmat
ion
requ
ests
are
resp
onde
d to
imm
edia
tely
and
writ
ten
requ
ests
are
resp
onde
d to
w
ithin
a w
eek
(dep
endi
ng o
n th
e na
ture
of t
he re
ques
t)
Tele
phon
ic in
form
atio
n re
ques
ts a
re re
spon
ded
to im
med
iate
ly a
nd w
ritte
n re
ques
ts a
re re
spon
ded
to
with
in a
wee
k (d
epen
ding
on
the
natu
re o
f the
requ
est)
Tele
phon
ic in
form
atio
n re
ques
ts a
re re
spon
ded
to im
med
iate
ly a
nd w
ritte
n re
ques
ts a
re re
spon
ded
to
with
in th
ree
days
(dep
endi
ng
on th
e na
ture
of t
he re
ques
t)
Tele
phon
ic in
form
atio
n re
ques
ts a
re re
spon
ded
to im
med
iate
ly a
nd w
ritte
n re
ques
ts a
re re
spon
ded
to
with
in tw
o da
ys (d
epen
ding
on
the
natu
re o
f the
requ
est)
cos
tS
ervi
ces
are
prov
ided
free
of
char
ge w
ithin
allo
cate
d bu
dget
Mai
ntai
n its
ess
entia
l ser
vice
s w
ithin
allo
cate
d bu
dget
Impr
ovem
ents
are
con
ditio
nal t
o ap
prov
ed p
roje
cts
and
budg
etIm
prov
emen
ts a
re c
ondi
tiona
l to
appr
oved
pro
ject
s an
d bu
dget
Hum
an
reso
urce
sD
edic
ated
add
ition
al
capa
city
on
trade
faci
litat
ion:
Tw
o po
sts
(1x
Ass
ista
nt
Dire
ctor
and
1x
Eco
nom
ist)
Res
truct
ure
and
recr
uit a
n ad
-di
tiona
l Ass
ista
nt D
irect
or a
nd
Eco
nom
ist a
nd o
ne a
dmin
. st
aff m
embe
r to
achi
eve
goal
s on
impr
ovin
g tra
de fa
cilit
atio
n
Res
truct
ure
and
recr
uit a
n ad
-di
tiona
l Ass
ista
nt D
irect
or a
nd
Eco
nom
ist a
nd o
ne a
dmin
. st
aff m
embe
r to
achi
eve
goal
s on
impr
ovin
g tra
de fa
cilit
atio
n
SE
Rv
icE
ob
jEc
tiv
E: t
o im
prov
e kn
owle
dge
on in
tern
atio
nal m
arke
t and
exp
ort o
ppor
tuni
ties,
thus
impr
ovin
g cl
ient
s’ e
xpor
t abi
litie
s (c
ont.)

DAFF Strategic Plan 2011/12–2014/15
96S
ER
vic
E o
bjE
cti
vE
: Adm
inis
teri
ng, i
mpl
emen
ting
and
enfo
rcin
g th
e N
atio
nal F
ores
ts A
ct, 1
998
(Act
No.
84
of 1
998)
Key
ser
vice
s S
ervi
ce b
enef
icia
ry
Fiel
dc
urre
nt s
tand
ard
Des
ired
sta
ndar
d
2008
/09
2009
/10
2010
/11
2011
/12
Reg
ulat
ion
of n
atur
al
fore
sts,
woo
dlan
ds
and
prot
ecte
d tre
es
Com
mun
ities
Qua
ntity
All
natu
ral f
ores
tsN
atio
nal l
ist o
f pro
tect
ed
trees
(47
spec
ies)
and
Lis
t of
cham
pion
tree
s
(44
trees
)
Ens
ure
prot
ectio
n an
d re
gula
tion
for a
ll 47
spe
cies
lis
ted
on n
atio
nal l
ist o
f pr
otec
ted
spec
ies
Ens
ure
prot
ectio
n an
d re
gula
tion
for a
ll 47
spe
cies
lis
ted
on n
atio
nal l
ist o
f pr
otec
ted
spec
ies
List
s ga
zette
d an
nual
ly
List
s pu
blis
hed
and
aire
d an
nual
ly
Ens
ure
prot
ectio
n an
d re
gula
tion
for a
ll 47
spe
cies
lis
ted
on n
atio
nal l
ist o
f pr
otec
ted
spec
ies
List
s ga
zette
d an
nual
ly
List
s pu
blis
hed
and
aire
d an
nual
ly
Qua
lity
Adh
eren
ce to
nor
ms
as p
re-
scrib
ed in
Nat
iona
l For
ests
Act
(N
FA) a
nd re
leva
nt le
gisl
atio
n
Adh
eren
ce to
nor
ms
as
pres
crib
ed in
NFA
and
re
leva
nt le
gisl
atio
n
Adh
eren
ce to
nor
ms
as
pres
crib
ed in
NFA
and
re
leva
nt le
gisl
atio
n
Adh
eren
ce to
nor
ms
as
pres
crib
ed in
NFA
and
re
leva
nt le
gisl
atio
n
con
sulta
tion
Ann
ual g
azet
ting
and
publ
i-ca
tion
for p
ublic
com
men
t
Ann
ual r
evie
w b
y E
xper
t Pan
el
Ann
ual p
ublic
atio
n fo
r pub
lic
com
men
t
Ann
ual r
evie
w b
y E
xper
t Pan
el
Ann
ual p
ublic
atio
n fo
r pub
lic
com
men
t
Ann
ual r
evie
w b
y E
xper
t Pan
el
Ann
ual p
ublic
atio
n fo
r pub
lic
com
men
t
Ann
ual r
evie
w b
y E
xper
t Pan
el
Thro
ugh
publ
icat
ion
by
the
depa
rtmen
t in
the
Gov
ernm
ent G
azet
te a
nd o
n th
e de
partm
enta
l web
site
Thro
ugh
publ
icat
ion
by
the
depa
rtmen
t in
the
Gov
ernm
ent G
azet
te a
nd o
n th
e de
partm
enta
l web
site
Thro
ugh
publ
icat
ion
by
the
depa
rtmen
t in
the
Gov
ernm
ent G
azet
te a
nd o
n th
e de
partm
enta
l web
site
Thro
ugh
publ
icat
ion
by
the
depa
rtmen
t in
the
Gov
ernm
ent G
azet
te a
nd o
n th
e de
partm
enta
l web
site
cou
rtes
yN
FA, 1
998
(Act
No.
84
of
1998
) and
rele
vant
legi
slat
ion
pres
crip
tions
adh
eren
ce
NFA
, 199
8 (A
ct N
o. 8
4 of
19
98) a
nd re
leva
nt le
gisl
atio
n pr
escr
iptio
ns a
dher
ence
NFA
, 199
8 (A
ct N
o. 8
4 of
19
98) a
nd re
leva
nt le
gisl
atio
n pr
escr
iptio
ns a
dher
ence
NFA
, 199
8 (A
ct N
o. 8
4 of
19
98) a
nd re
leva
nt le
gisl
atio
n pr
escr
iptio
ns a
dher
ence
ope
nnes
s an
d tr
ansp
aren
cy
List
s of
all
regu
late
d na
tura
l fo
rest
s, p
rote
cted
tree
s an
d ch
ampi
on tr
ees
gaze
tted,
pu
blis
hed
and
aire
d an
nual
ly
List
s of
all
regi
ster
ed n
atur
al
fore
sts,
pro
tect
ed tr
ees
and
cham
pion
tree
s ga
zette
d,
publ
ishe
d an
d ai
red
annu
ally
Pub
lishe
d na
tiona
lly a
nd
loca
lly fo
r pub
lic c
omm
ent
List
s of
all
regi
ster
ed n
atur
al
fore
sts,
pro
tect
ed tr
ees
and
cham
pion
tree
s ga
zette
d,
publ
ishe
d an
d ai
red
annu
ally
Pub
lishe
d na
tiona
lly a
nd
loca
lly fo
r pub
lic c
omm
ent
List
s of
all
regi
ster
ed n
atur
al
fore
sts,
pro
tect
ed tr
ees
and
cham
pion
tree
s ga
zette
d,
publ
ishe
d an
d ai
red
annu
ally
Pub
lishe
d na
tiona
lly a
nd
loca
lly fo
r pub
lic c
omm
ent
i nfo
rmat
ion
Info
rmat
ion
publ
ishe
d na
tiona
lly a
nd lo
cally
Info
rmat
ion
post
ers
avai
labl
e an
d di
strib
uted
Info
rmat
ion
publ
ishe
d na
tiona
lly a
nd lo
cally
Info
rmat
ion
post
ers
avai
labl
e an
d di
strib
uted
Info
rmat
ion
publ
ishe
d na
tiona
lly a
nd lo
cally
Info
rmat
ion
post
ers
avai
labl
e an
d di
strib
uted
Info
rmat
ion
publ
ishe
d na
tiona
lly a
nd lo
cally
Info
rmat
ion
post
ers
avai
labl
e an
d di
strib
uted
Red
ress
Com
men
ts re
ceiv
ed fr
om
the
publ
ic a
re c
onsi
dere
d in
re
view
ing
the
lists
Obj
ectiv
e cr
iteria
are
follo
wed
w
hen
trees
are
nom
inat
ed.
A p
anel
of e
xper
ts c
onsi
ders
th
e ap
plic
atio
n fo
r dec
lara
tion
and
com
plai
nts
that
aris
e ar
e de
alt w
ith b
y th
is p
anel
Com
men
ts re
ceiv
ed fr
om
the
publ
ic a
re c
onsi
dere
d in
re
view
ing
the
lists
Obj
ectiv
e cr
iteria
are
follo
wed
w
hen
trees
are
nom
inat
ed.
A p
anel
of e
xper
ts c
onsi
ders
th
e ap
plic
atio
n fo
r dec
lara
tion
and
com
plai
nts
that
aris
e ar
e de
alt w
ith b
y th
is p
anel
Com
men
ts re
ceiv
ed fr
om
the
publ
ic a
re c
onsi
dere
d in
re
view
ing
the
lists
Obj
ectiv
e cr
iteria
are
follo
wed
w
hen
trees
are
nom
inat
ed.
A p
anel
of e
xper
ts c
onsi
ders
th
e ap
plic
atio
n fo
r dec
lara
tion
and
com
plai
nts
that
aris
e ar
e de
alt w
ith b
y th
is p
anel
Com
men
ts re
ceiv
ed fr
om
the
publ
ic a
re c
onsi
dere
d in
re
view
ing
the
lists
Obj
ectiv
e cr
iteria
are
follo
wed
w
hen
trees
are
nom
inat
ed.
A p
anel
of e
xper
ts c
onsi
ders
th
e ap
plic
atio
n fo
r dec
lara
tion
and
com
plai
nts
that
aris
e ar
e de
alt w
ith b
y th
is p
anel

Annexure 2: Service Delivery Improvement Plan
97
Key
ser
vice
s S
ervi
ce b
enef
icia
ry
Fiel
dc
urre
nt s
tand
ard
Des
ired
sta
ndar
d
2008
/09
2009
/10
2010
/11
2011
/12
Reg
ulat
ion
of n
atur
al
fore
sts,
woo
dlan
ds
and
prot
ecte
d tre
es
(con
t.)
Com
mun
ities
(con
t.)R
edre
ssC
omm
ents
rece
ived
from
th
e pu
blic
are
con
side
red
in
revi
ewin
g th
e lis
ts
Obj
ectiv
e cr
iteria
are
follo
wed
w
hen
trees
are
nom
inat
ed.
A p
anel
of e
xper
ts c
onsi
ders
th
e ap
plic
atio
n fo
r dec
lara
tion
and
com
plai
nts
that
aris
e ar
e de
alt w
ith b
y th
is p
anel
Com
men
ts re
ceiv
ed fr
om
the
publ
ic a
re c
onsi
dere
d in
re
view
ing
the
lists
Obj
ectiv
e cr
iteria
are
follo
wed
w
hen
trees
are
nom
inat
ed.
A p
anel
of e
xper
ts c
onsi
ders
th
e ap
plic
atio
n fo
r dec
lara
tion
and
com
plai
nts
that
aris
e ar
e de
alt w
ith b
y th
is p
anel
Com
men
ts re
ceiv
ed fr
om
the
publ
ic a
re c
onsi
dere
d in
re
view
ing
the
lists
Obj
ectiv
e cr
iteria
are
follo
wed
w
hen
trees
are
nom
inat
ed.
A p
anel
of e
xper
ts c
onsi
ders
th
e ap
plic
atio
n fo
r dec
lara
tion
and
com
plai
nts
that
aris
e ar
e de
alt w
ith b
y th
is p
anel
Com
men
ts re
ceiv
ed fr
om
the
publ
ic a
re c
onsi
dere
d in
re
view
ing
the
lists
Obj
ectiv
e cr
iteria
are
follo
wed
w
hen
trees
are
nom
inat
ed.
A p
anel
of e
xper
ts c
onsi
ders
th
e ap
plic
atio
n fo
r dec
lara
tion
and
com
plai
nts
that
aris
e ar
e de
alt w
ith b
y th
is p
anel
val
ue fo
r m
oney
Cos
tly a
dmin
istra
tive
and
com
mun
icat
ions
exe
rcis
e
Ens
ure
effic
ient
com
plia
nce
and
enfo
rcem
ent
Cos
tly a
dmin
istra
tive
and
com
mun
icat
ions
exe
rcis
e
Ens
ure
effic
ient
com
plia
nce
and
enfo
rcem
ent
Cos
tly a
dmin
istra
tive
and
com
mun
icat
ions
exe
rcis
e
Ens
ure
effic
ient
com
plia
nce
and
enfo
rcem
ent
Cos
tly a
dmin
istra
tive
and
com
mun
icat
ions
exe
rcis
e
Ens
ure
effic
ient
com
plia
nce
and
enfo
rcem
ent
cos
tR
1 20
0 00
0R
1 50
0 00
0R
1 70
0 00
0R
2 00
0 00
0
Hum
an
reso
urce
sO
ne F
ores
t Sci
entis
t plu
s on
e A
D: F
ores
t Tec
hnic
al
Info
rmat
ion
Ser
vice
s
One
For
est S
cien
tist p
lus
one
AD
: For
est T
echn
ical
In
form
atio
n S
ervi
ces
Two
Fore
stry
Sci
entis
ts p
lus
one
AD
: For
est T
echn
ical
In
form
atio
n S
ervi
ces
Two
Fore
st S
cien
tists
plu
s on
e A
D: F
ores
t Tec
hnic
al
Info
rmat
ion
Ser
vice
s
SE
Rv
icE
ob
jEc
tiv
E: A
dmin
iste
ring
, im
plem
entin
g an
d en
forc
ing
the
Nat
iona
l For
ests
Act
, 199
8 (A
ct N
o. 8
4 of
199
8) (c
ont.)
SE
Rv
icE
ob
jEc
tiv
E: t
o im
prov
e pr
oces
sing
of p
erm
its a
nd li
cenc
e ap
plic
atio
ns
Key
ser
vice
s S
ervi
ce b
enef
icia
ry
Fiel
dc
urre
nt s
tand
ard
Des
ired
sta
ndar
d
2008
/09
2009
/10
2010
/11
2011
/12
Pro
cess
ing
of a
ll pe
rmits
and
lice
nce
appl
icat
ions
(exc
ept
fishi
ng e
ffort
and
vess
el c
hang
e an
d fis
h pr
oces
sing
es
tabl
ishm
ents
)
Fish
ing
indu
stry
; fis
hing
righ
t’s
hold
ers;
recr
eatio
nal
fishe
rs; f
orei
gn a
nd
loca
l ves
sel o
wne
rs;
fish
impo
rt an
d ex
port
indu
stry
Qua
ntity
80%
of p
erm
its o
r ap
plic
atio
ns re
ceiv
ed,
proc
esse
d pe
r mon
th
90%
of a
ll ap
plic
atio
ns
rece
ived
per
mon
th95
% o
f all
appl
icat
ions
re
ceiv
ed p
er m
onth
10
0% o
f all
appl
icat
ions
re
ceiv
ed p
er m
onth
Qua
lity
Alig
nmen
t and
st
anda
rdis
atio
n of
bu
sine
ss p
roce
sses
Alig
nmen
t and
st
anda
rdis
atio
n of
bu
sine
ss p
roce
sses
Mai
ntai
n an
exc
elle
nt
stan
dard
of b
usin
ess
proc
esse
s
Cha
mpi
on s
tand
ard
of
busi
ness
pro
cess
es
con
sulta
tion
One
-on-
one
inte
nsiv
e st
akeh
olde
r col
labo
ratio
nO
ne-o
n-on
e in
tens
ive
stak
ehol
der c
olla
bora
tion
One
-on-
one
inte
nsiv
e st
akeh
olde
r col
labo
ratio
n
Edu
catio
n an
d aw
aren
ess
road
sho
ws
One
-on-
one
inte
nsiv
e st
akeh
olde
r col
labo
ratio
n
Edu
catio
n an
d aw
aren
ess
road
sho
ws
Acc
ess
Wal
k-in
cen
tre, e
-mai
l, fa
xes
and
lette
rsW
alk-
in c
entre
, e-m
ail,
faxe
s an
d le
tters
Wal
k-in
cen
tre, e
-mai
l, fa
xes
and
lette
rsW
alk-
in c
entre
, e-m
ail,
faxe
s an
d le
tters

DAFF Strategic Plan 2011/12–2014/15
98S
ER
vic
E o
bjE
cti
vE
: to
impr
ove
proc
essi
ng o
f per
mits
and
lice
nce
appl
icat
ions
(con
t.)
Key
ser
vice
s S
ervi
ce b
enef
icia
ry
Fiel
dc
urre
nt s
tand
ard
Des
ired
sta
ndar
d
2008
/09
2009
/10
2010
/11
2011
/12
Pro
cess
ing
of a
ll pe
rmits
and
lice
nce
appl
icat
ions
(exc
ept
fishi
ng e
ffort
and
vess
el c
hang
e an
d fis
h pr
oces
sing
es
tabl
ishm
ents
) (c
ont.)
Fish
ing
indu
stry
; fis
hing
righ
t’s
hold
ers;
recr
eatio
nal
fishe
rs; f
orei
gn
and
loca
l ves
sel
owne
rs; f
ish
impo
rt an
d ex
port
indu
stry
(c
ont.)
cou
rtes
yS
impl
ify a
nd s
tream
line
busi
ness
pro
cess
esS
impl
ify a
nd s
tream
line
busi
ness
pro
cess
es
Impl
emen
t a c
lient
rela
tion-
ship
man
agem
ent s
yste
m
Sim
plify
and
stre
amlin
e bu
sine
ss p
roce
sses
Impl
emen
t a c
lient
re
latio
nshi
p m
anag
emen
t sy
stem
Sim
plify
and
stre
amlin
e bu
sine
ss p
roce
sses
Impl
emen
t a c
lient
rela
tion-
ship
man
agem
ent s
yste
m
ope
nnes
s an
d tr
ansp
aren
cy
Pub
lish
Ann
ual F
inan
cial
S
tate
men
tsP
ublis
h A
nnua
l Fin
anci
al
Sta
tem
ents
Pub
lish
Ann
ual F
inan
cial
S
tate
men
tsP
ublis
h A
nnua
l Fin
anci
al
Sta
tem
ents
info
rmat
ion
10 e
duca
tion
and
awar
enes
s ro
ad s
how
s pe
r fin
anci
al y
ear
15 e
duca
tion
and
awar
e nes
s ro
ad s
how
s pe
r fin
anci
al y
ear
20 e
duca
tion
and
awar
enes
s ro
ad s
how
s pe
r fin
anci
al y
ear
30 e
duca
tion
and
awar
enes
s ro
ad s
how
s pe
r fin
anci
al y
ear
Red
ress
Tele
phon
es a
re a
nsw
ered
w
ithin
four
ring
s 80
% o
f the
tim
e. T
elep
hone
enq
uirie
s ar
e lo
gged
and
refe
rred
to
line
man
ager
s w
ithin
one
day
For e
-mai
l, le
tters
and
faxe
s ac
know
ledg
emen
t of r
ecei
pt
with
in th
ree
days
Res
pons
e w
ithin
15
days
, 85
%
Tele
phon
es a
re a
nsw
ered
w
ithin
four
ring
s 80
% o
f the
tim
e. T
elep
hone
enq
uirie
s ar
e lo
gged
and
refe
rred
to
line
man
ager
s w
ithin
one
day
Est
ablis
h M
CM
Cal
l Cen
tre
infra
stru
ctur
e
App
oint
men
t of d
edic
ated
st
aff t
o de
al w
ith te
leph
one
enqu
iries
For e
-mai
l, le
tters
and
faxe
s ac
know
ledg
emen
t of r
ecei
pt
with
in th
ree
days
Res
pons
e w
ithin
15
days
, 85
%
Tele
phon
es a
re a
nsw
ered
w
ithin
thre
e rin
gs 8
5% o
f the
tim
e. T
elep
hone
enq
uirie
s ar
e lo
gged
and
refe
rred
to
line
man
ager
s w
ithin
one
day
Impl
emen
t a c
lient
rela
tion-
ship
man
agem
ent s
yste
m
Est
ablis
h de
dica
ted
resp
onse
co
ordi
nato
rs w
ithin
line
fu
nctio
ns
For e
-mai
l, le
tters
and
faxe
s ac
know
ledg
emen
t of r
ecei
pt
with
in th
ree
days
Res
pons
e w
ithin
15
days
, 85
%
Tele
phon
es a
re a
nsw
ered
w
ithin
two
rings
90%
of t
he
time.
Tel
epho
ne e
nqui
ries
are
logg
ed a
nd re
ferr
ed to
lin
e m
anag
ers
with
in o
ne d
ay
Con
tinuo
us s
taff
train
ing
For e
-mai
l, le
tters
and
faxe
s ac
know
ledg
emen
t of r
ecei
pt
with
in th
ree
days
Res
pons
e w
ithin
15
days
, 85
%
tim
e It
take
s th
ree
to s
even
day
s fo
r pro
cess
ing
Red
uce
turn
arou
nd ti
me
to
thre
e to
six
day
sR
educ
e tu
rnar
ound
tim
e to
th
ree
to fi
ve d
ays
Red
uce
turn
arou
nd ti
me
to
two
to fi
ve d
ays
Hum
an
reso
urce
sA
dequ
ate
hum
an c
apita
l E
nsur
e av
aila
bilit
y of
ad
equa
te h
uman
cap
ital
Ens
ure
avai
labi
lity
of
adeq
uate
hum
an c
apita
lE
nsur
e av
aila
bilit
y of
ad
equa
te h
uman
cap
ital
Top Related