


Languages
Pages
Legal


© Crown copyright Met Office
Met Office seasonal forecasting for winter 2010-11 Jeff Knight (with thanks to many colleagues)

© Crown copyright Met Office
The main event: December

© Crown copyright Met Office
December2010
MonthMean Temp (degC)
Feb-47 -2.0
Jan-63 -1.8
Feb-86 -1.2
Jan-40 -1.1
Feb-63 -1.1
Dec-10 -1.0
Courtesy of Mike Kendon (NCIC)
Snow at
Land’s End

© Crown copyright Met Office
December 2010: Central England Temperature series
3 voyages of Captain Cook 1768 - 1779
Monthly Mean Central England Temperature - December
-2.0
-1.0
0.0
1.0
2.0
3.0
4.0
5.0
6.0
7.0
8.0
9.0
1650 1700 1750 1800 1850 1900 1950 2000 2050
Year
Mea
n D
ecem
ber
CE
T (
deg
C)
The coldest December since 1890
The second coldest December in a series from 1659
Queen Victoria’s coronation 1838
World War 11914-1918 December 2010
Public execution of Charles 1st 1649 (only 10 years before series
starts)
Courtesy of Mike Kendon (NCIC)

© Crown copyright Met Office
UK Temperatures: recent winters

© Crown copyright Met Office
Christmas Eve 2010 Satellite Receiving Station, Dundee University
1150 GMT 7 January 2010Photo: NASA/GSFC, MODIS Rapid Response.
2009-10 and 2010-11

© Crown copyright Met Office
Met Office Winter Forecast 2010-11

© Crown copyright Met Office
DJF Met Office Seasonal Forecast
for UK Government
Outlook for December 2010 – February 2011
For the period December 2010-February 2011, there is a 25% chance of mild conditions, a 30% chance of near-average and a 45% chance of cold conditions over northern Europe.
For precipitation, there is a 25% chance of wet conditions, a 35% chance of near-average and a 40% chance of dry conditions over northern Europe.

© Crown copyright Met Office
GloSea4 ‘November’ ensemble
GloSea4 L85DJF

© Crown copyright Met Office
Temperature terciles from Nov
L85 GloSea (1996-2009 climate)

© Crown copyright Met Office
Precipitation terciles from Nov(1996-2009 climatology)
L85 GloSea (1996-2009 Climate)

© Crown copyright Met Office
Nino3.4 plumes: GloSea4-EC-EUROSIP
Charts courtesy of ECMWF
© Crown copyright Met Office
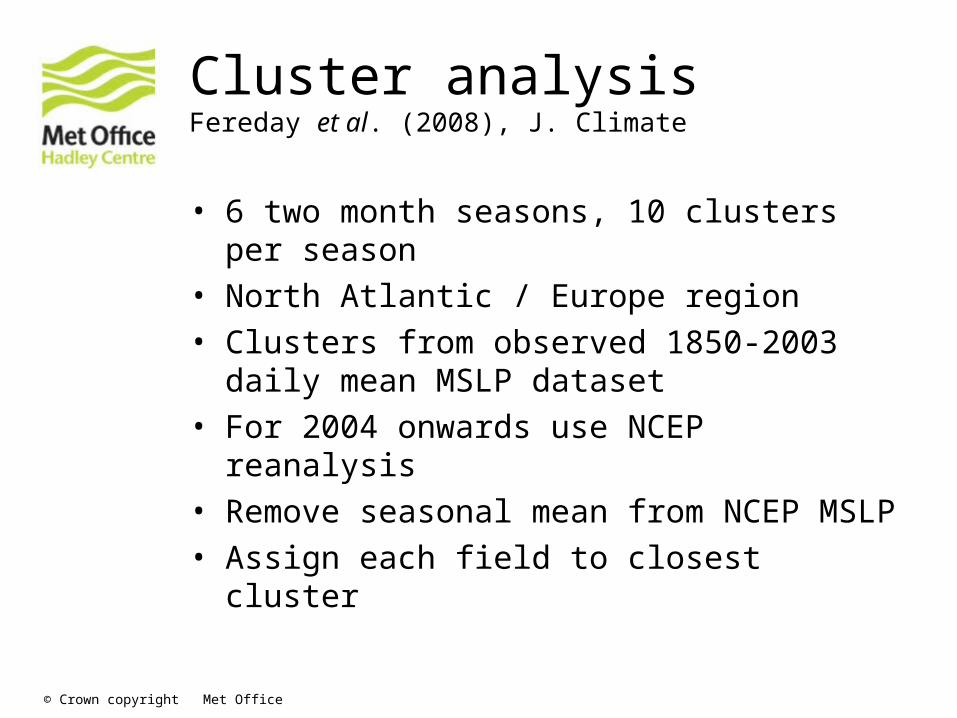
Cluster analysisFereday et al. (2008), J. Climate
• 6 two month seasons, 10 clusters per season• North Atlantic / Europe region• Clusters from observed 1850-2003 daily mean
MSLP dataset• For 2004 onwards use NCEP reanalysis• Remove seasonal mean from NCEP MSLP • Assign each field to closest cluster
© Crown copyright Met Office
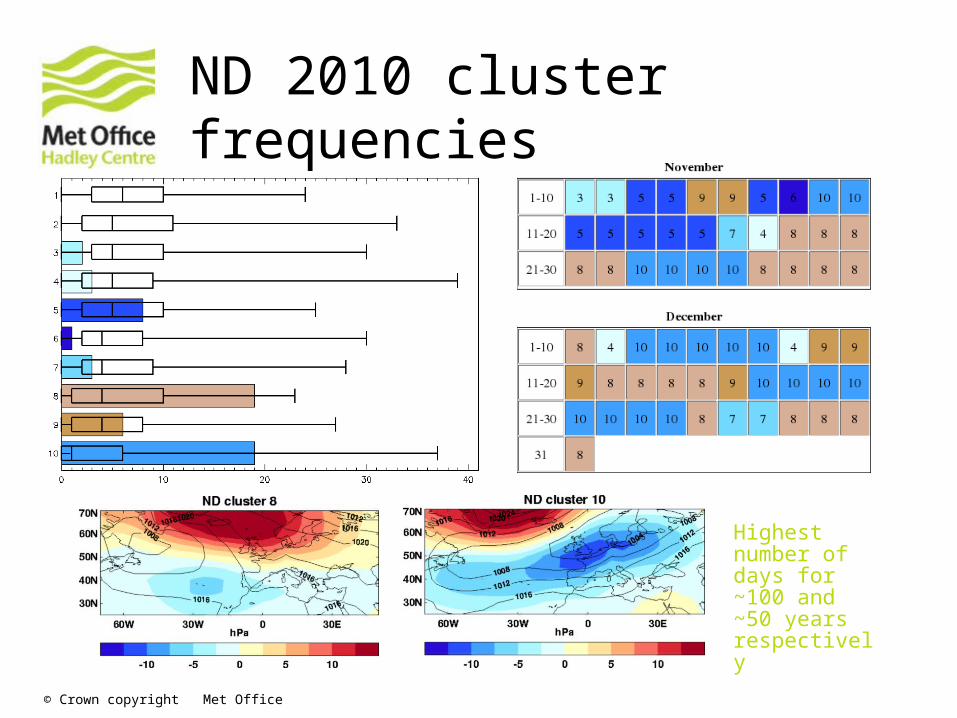
ND 2010 cluster frequencies
Highest number of days for ~100 and ~50 years respectively
© Crown copyright Met Office
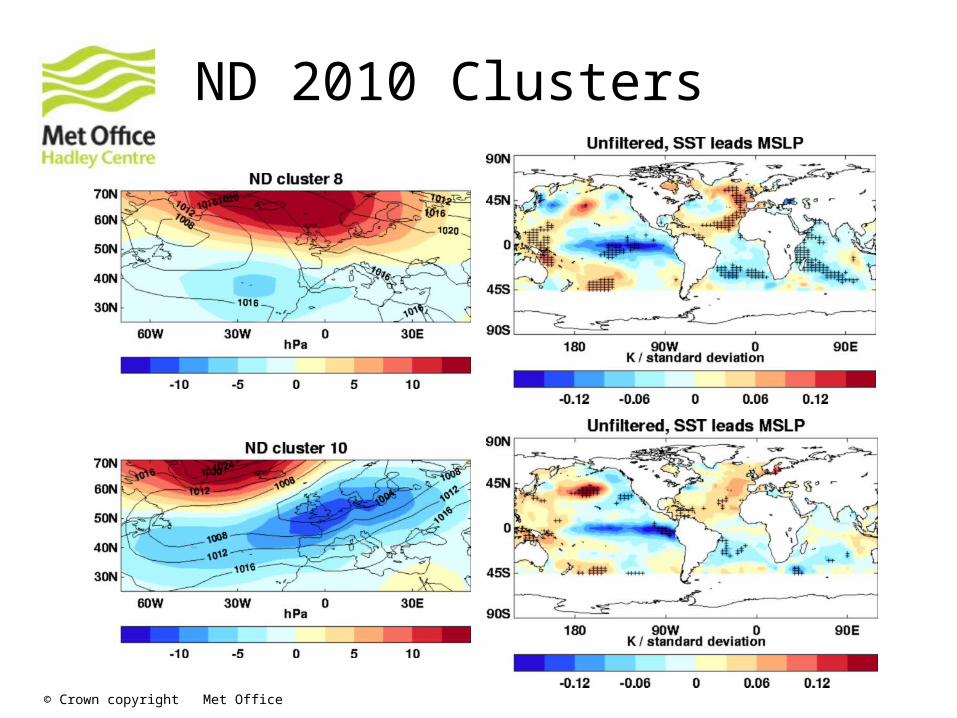
ND 2010 Clusters

© Crown copyright Met Office
Oct-Nov North Atlantic SST
October 2011 14-21 Nov 2011

© Crown copyright Met Office
North Atlantic Sub-Surface temperature
May October
Rodwell and Folland (2002), Q. J. R. Meteorol. Soc.

© Crown copyright Met Office
Quasi-Biennial Oscillation
W phase of QBO → stronger polar vortex, less chance of a stratospheric warming event
So perhaps switch to zonal at end of winter?
This is also the signal from La Niña

© Crown copyright Met Office
‘Canonical’ JF La Niña clusters

© Crown copyright Met Office
Later Forecasts

© Crown copyright Met Office
JFM, FMA from preceding month
FMA
JFM
D-J-F

© Crown copyright Met Office
Stratosphere?

© Crown copyright Met Office
JF 2011 cluster frequencies

© Crown copyright Met Office
JF 2011 Clusters

© Crown copyright Met Office
Worldwide

© Crown copyright Met Office
La Niña Teleconnections• During La Niña the rainfall that normally falls out o
ver the Pacific shifts west

© Crown copyright Met Office
Global precipitation

© Crown copyright Met Office
Queensland

© Crown copyright Met Office
Conclusions
• GloSea4 did a reasonable job in predicting the likelihood of a cold winter
• In later forecasts, however, it wanted to retain the cold for too long
• Consistency with EuroSIP and other models • Other factors such as La Niña, Atlantic SSTs
and the QBO were considered alongside models
• Potential additional influences were the continuing low solar activity (Ineson et al., 2011), low sea-ice, ...

© Crown copyright Met Office
Advertisement
For various long-range forecasts including decadal global temperature forecasts and seasonal tropical storm forecasts:
http://www.metoffice.gov.uk/science/specialist/long-range
For the seasonal probability maps, ENSO forecast and skill scores:
http://www.metoffice.gov.uk/science/specialist/seasonal

© Crown copyright Met Office
Questions and answers

© Crown copyright Met Office
Title
Top Related