


Languages
Pages
Legal


04/19/2023 1
الرحيم الرحمن الله بسم
An Najah National UniversityFaculty of Engineering
Civil Engineering Department
Prepared by : 1. Bashar abu hajji 2. Ahmad abu asbih 3. Adham sulimanSupervisor : Dr. Hafez Q. Shaheen
04/19/2023 2
Study and conceptual design of Al-Malaqi
bridge dam

04/19/2023 3
Study area :
Jeser Al Malaqi is located 3.5 km from the main intersection of
Al-Badan village with Al-Faria and linking with the Jordan Valley
(Al Ghor) and Jericho City.

04/19/2023 4

04/19/2023 5
The selected location of the dam is approximately 500m downstream from Jesser Al-Malaqi at the confluence Wadi Al-Faria and wadi Al-Badan.
Wadi Al BadanWadi Al Faria

04/19/2023 6
Wastewater and springs flow :
The wastewater comes from Nablus city and the amount of
wastewater flow about (6000m³/day – 8000m³/day), only
Small portion of it reaches the dam. the spring flow is natural
Storage in al faria catchment, the number of spring is 13
springs distributed as groups (Al-faria, Al-badan, Nablus).

04/19/2023 7
the four sub- catchments for the upper part of Wadi Al-Faria and Wadi Al-Badan.
The area of the watersheds is :
A1 = 14.35 km2
A2 = 20.04km2
A3 = 21.55 km2.
B1 = 82.88 km2

04/19/2023 8
SCS is used to construct the unit hydrograph (example)
Tc= ( L / V ) / 60
Tctr 6.02
TP =
PT
A08.2qP=

04/19/2023 9
Description of
water course
Slope in percent
0 – 3 4 – 7 8 – 12 Larger than 12
Unconcentrated
Woodland 0 - 1.5 1.5 - 2.5 2.5 - 3.25 Larger than 3.25
Pastures 0 - 2.5 2.5 -3.5 3.5 – 4.25 Larger than 4.25
Cultivated 0 – 3 3 – 4.5 4.5 – 5.5 Larger than 5.5
Pavement 0 -8.5 8.5 – 13.5 13.5 – 17 Larger than 17
Concentrated
Outlet channel-determine velocity by manning formula
Natural channel
not well defined
0 -2 2 – 4 4 – 7 Larger than 7
approximate average velocities in ft/s runoff flow for calculating time of concentration
(chow, 1989)

04/19/2023 10
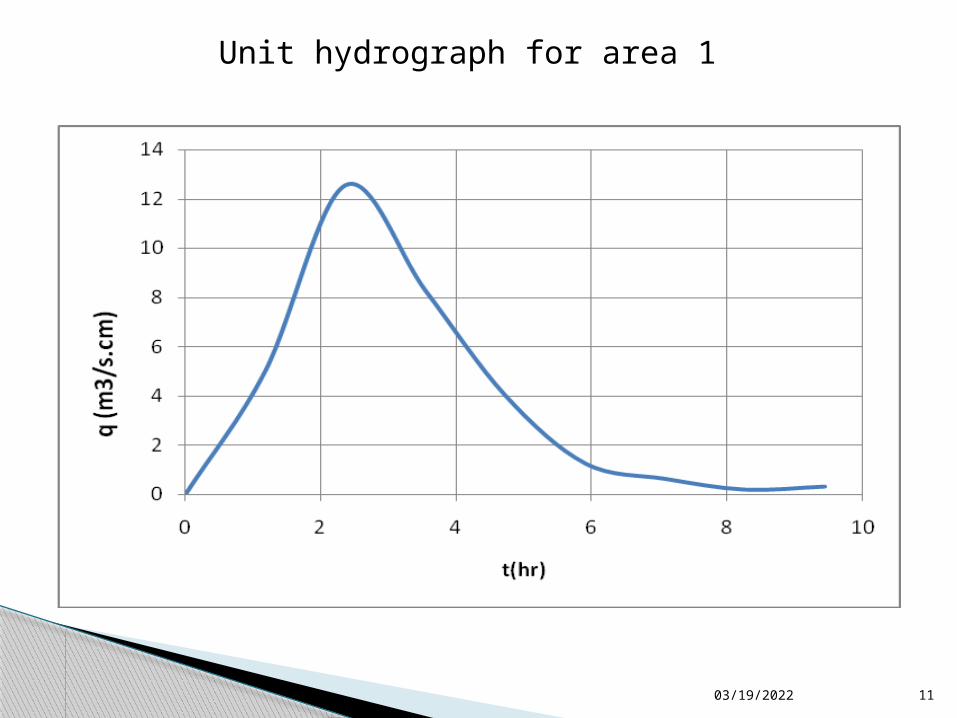
t / Tp q / qp t(hr) q=(m3/s.cm)
0.000 0.000 0.000 0.000
0.500 0.400 1.18 5.01
1.000 1.000 2.36 12.54
1.500 0.660 3.54 8.27
2.000 0.320 4.72 4.01
2.500 0.100 5.9 1.25
3.000 0.050 7.08 0.62
3.500 0.015 8.26 0.19
4.000 0.025 9.44 0.31
this table shows the coordinates to construct the 1 cm-unit hydrograph of area (A3).
04/19/2023 11
Unit hydrograph for area 1

04/19/2023 12
Flow Routing

04/19/2023 13
S= K {XI + (1 - X) O}
K: is a constant, approximates travel time of the flood wave through the reach.
X: is a factor that weighs the relative influence of inflow and outflow upon the
storage for most river channels, X lies between 0.1 and 0.3, indicating both
attenuation and translation. The modal value is about 0.2.

04/19/2023 14
The routed unit hydrograph is shown below.
04/19/2023 15
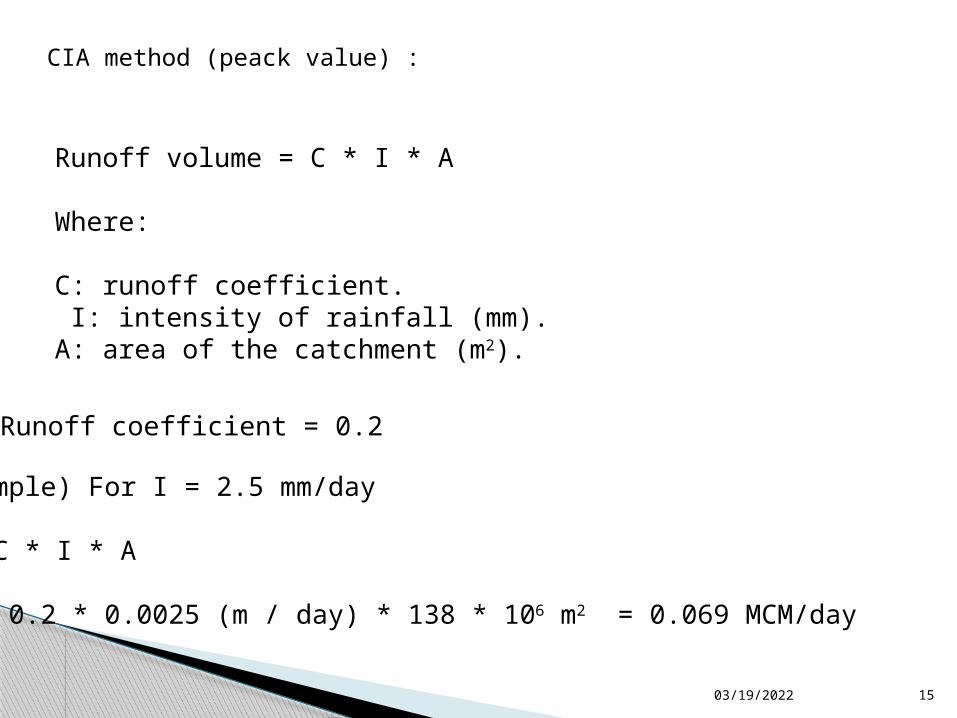
CIA method (peack value) :
Runoff volume = C * I * A
Where:
C: runoff coefficient. I: intensity of rainfall (mm).A: area of the catchment (m2).
Runoff coefficient = 0.2
(example) For I = 2.5 mm/day
Q = C * I * A = 0.2 * 0.0025 (m / day) * 138 * 106 m2 = 0.069 MCM/day

04/19/2023 16

04/19/2023 17
Dam design
Dam height(m) Dam face
Soil conditions
>50% gravel
>15% clay
>50% sand
>15% clay
>55%clay
3
Upstream 2.5:1 2.5:1 3:1
Downstream 2:1 2:1 2.5:1
3.1-6
Upstream 2.5:1 2.5:1 3:1
Downstream 2.5:1 2.5:1 3:1
6.1-15
Upstream 3:1 3:1 3.5:1
Downstream 2.5:1 3:1 3:1
Nelson (1985)

04/19/2023 18

04/19/2023 19

04/19/2023 20
Storage volumeThe calculation of storage volume done by using the following equation (prismoidal formula):
V = L/3 (A1 + An + 2 ( A3+A5+ …… + An-2) +4(A2+A4+……+An-1)
For n = 3:V = L/3 * (A1 + 4A2 + A3)
Height of dam (m)
Depth of water(m) Area of
surface (m²)Cumulative volume (m³)
05
5108 8514
55
24403 73778
105
54303 180362
155
99087 517355

04/19/2023 21
04/19/2023 22
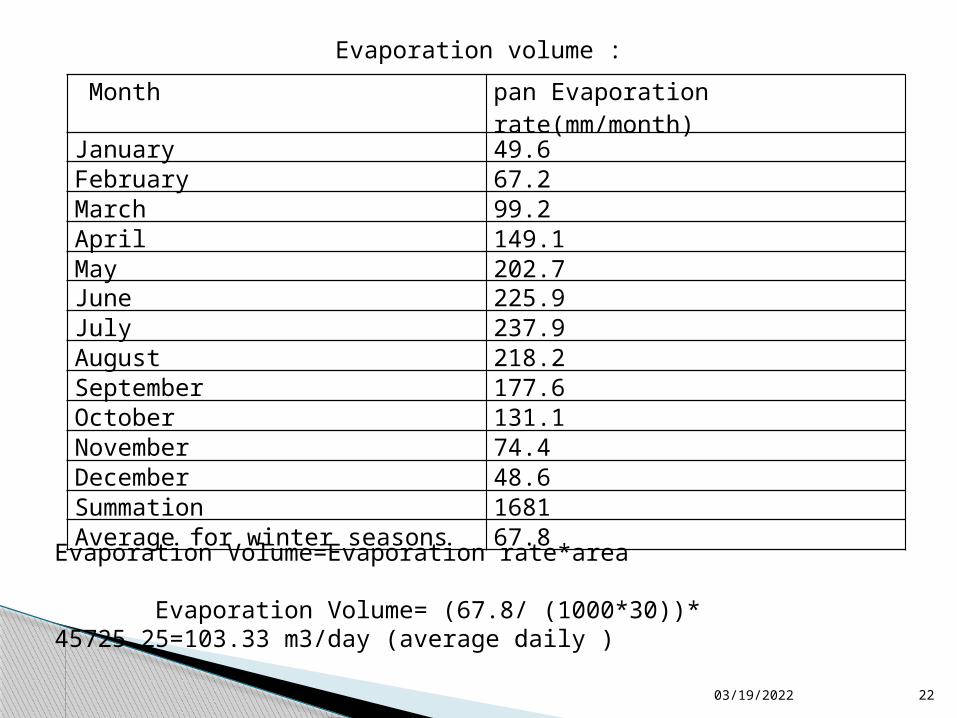
Evaporation volume :
Month pan Evaporation rate(mm/month)January 49.6February 67.2March 99.2April 149.1May 202.7June 225.9July 237.9August 218.2September 177.6October 131.1November 74.4December 48.6Summation 1681Average for winter seasons 67.8
Evaporation Volume=Evaporation rate*area
Evaporation Volume= (67.8/ (1000*30))* 45725.25=103.33 m3/day (average daily )
04/19/2023 23
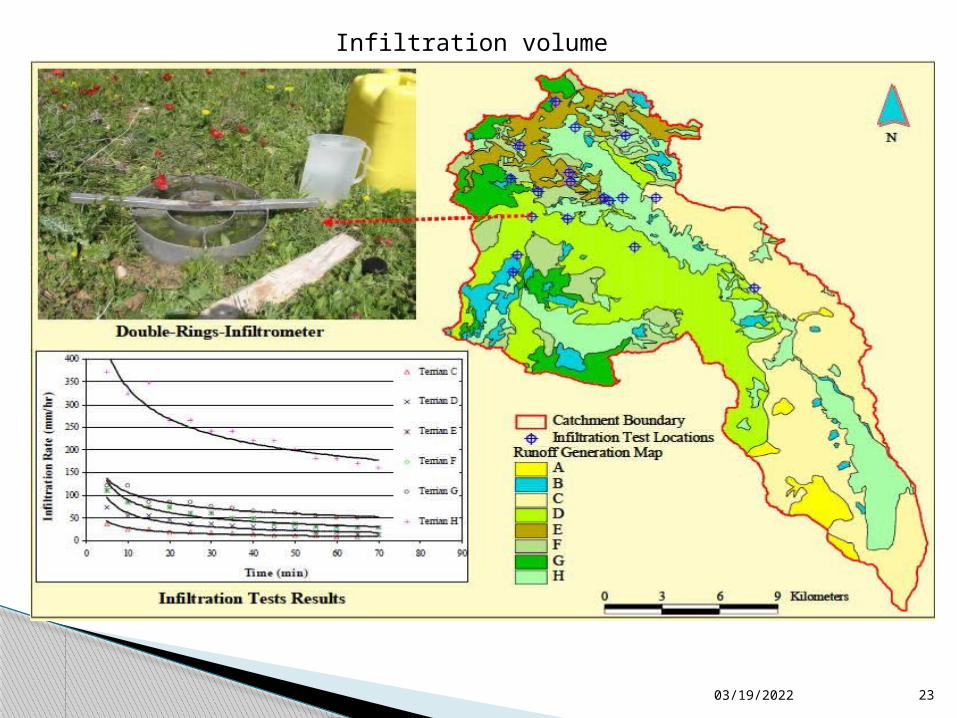
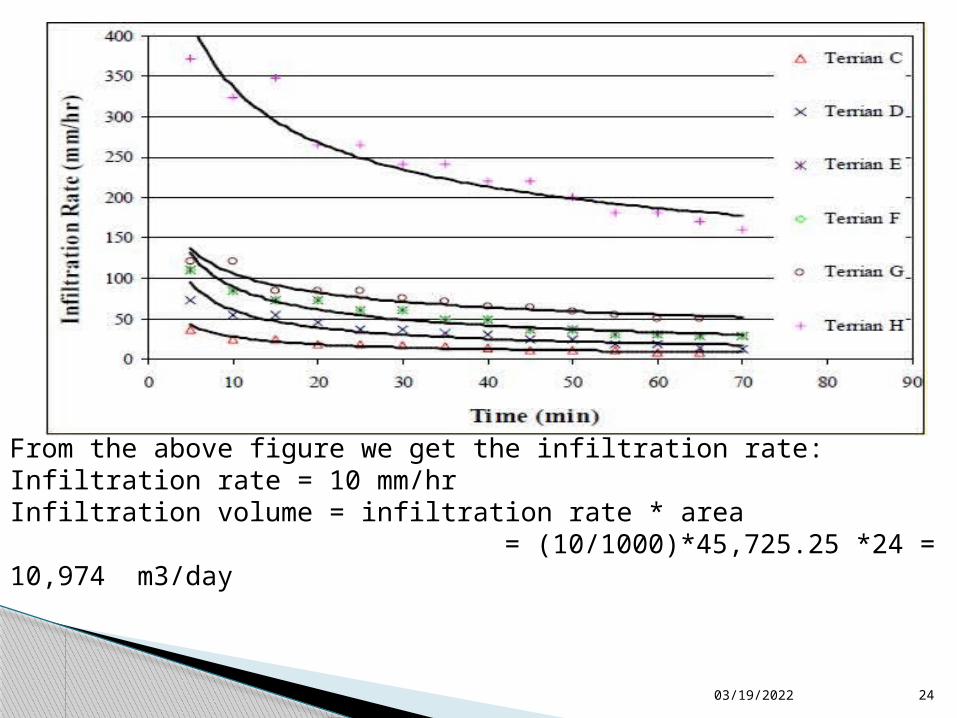
Infiltration volume
04/19/2023 24
From the above figure we get the infiltration rate:Infiltration rate = 10 mm/hrInfiltration volume = infiltration rate * area = (10/1000)*45,725.25 *24 = 10,974 m3/day

04/19/2023 25
Seepage volume
For k : the value depend on the type of the soil .
Hydraulic conductivity (K)
Soil type Cm/sec Ft/min
Clean gravel 100-1.0 200-2.0
Coarse sand 1.0-0.01 2.0-0.02
Fine sand 0.01-0.001 0.02-0.002
Silty clay 0.001-0.00001 0.002-0.00002
Clay <0.000001 <0.000002
The type of soil is silty clay K = 0.0005
(L.Casagrande’s method 1932)q = k Lsinϴ² in (m²/s)L = (√ (d²+H²) –√ (d²- H²cotϴ²)) in (m)
From Principles of geotechnical engineering

04/19/2023 26
H=15 m , D=69.55m , ϴ=21⁰ , K=0.0005
L= √5062.2-√3310.24 = 13.61m
q = (0.0005) *(13.61) (sin21)2 = 8.73*10^-4 (m²/s)
Take length of the dam = 85m Q= 8.73*10^-4 (m²/s)* 85 (m) = 0.0007429 m3/s
Q= 0.0745*60*60*24=64.2 m3/d

04/19/2023 27
Design of spillway
I = 8 mm/hrQ = C *I *A = 0.2 * 0.008 (m/hr) * 138 * 10 6 m2 / 3600s = 61.33 m3/s
The time of concentration = 2.5hr = 150 min

04/19/2023 28
For three pipes :
Q = 20.44 m3/s
Assume velocity = 5 m/s
A = Q / V = 20.44 / 5 = 12.26 m2
D = 2.28 m
We will use 3 pipes with diameter 2.5 m each.
(this is for emergency outflow to avoid damage of dam).
04/19/2023 29
Requirements
1. Change the road connect Nablus to Jordan valley such as the new road become over the reservoir level.
2. Badan sub-catchment wastewater flowing from Nablus East should be treated and stored with the runoff water and to recharge into the aquifer and used for agricultural activities.
3. Studies are needed to investigate the infiltrated water quality at the site of the dam.
4. Evaluate the required infiltration rate (hydraulic conductivity) and treat the soil of the dam accordingly.

04/19/2023 30
Happy to answer your question