Zooplankton and estuary food web dynamics - Delta Stewardship...
41
Zooplankton and estuary food web dynamics Laboratory of Oceanography and Geosciences, UMR CNRS 8187 LOG, University of Lille 1 Sciences & Technologies - Marine Station of Wimereux Sami Souissi Lower Food Web Dynamics in California’s Bay-Delta Ecosystem: Current understanding and future interactions in a changing landscape
Transcript of Zooplankton and estuary food web dynamics - Delta Stewardship...

Zooplankton and estuary food web
dynamics
Laboratory of Oceanography and Geosciences, UMR CNRS 8187 LOG,
University of Lille 1 Sciences & Technologies - Marine Station of Wimereux
Sami Souissi
Lower Food Web Dynamics in California’s Bay-Delta Ecosystem: Current understanding and future interactions in a changing landscape

Estuaries are very complex systems (interface
between land and oceans)
Estuaries are heavily impacted by human activities
(Harbors, transportation, Industrial activity,
agriculture, urbanization, pollution, etc.)
In addition to their economic role, estuaries are still
playing significant ecological role (offering several
ecological services, etc.)
In Europe and USA the restoration of estuarine
ecosystems already started and will be certainly
reinforced in the future.
Background

Seminar Objective
Broad decadal declines of lower pelagic fish
populations in California’s Bay-Delta ecosystem,
with concomitant declines in primary and
secondary productivity, have driven policy,
management, and regulatory efforts to identify
approaches that will restore the pelagic food web.
But how can we restore these ecological functions?
What about the role of zooplankton?
Need of a global approach and a real feedback
between scientists, managers and all actors of the
estuarine system.

Zooplankton in estuaries:
-Low diversity
-Cryptic species (high
physiological capacities)
- Few endemic species
San Francisco estuary is one of the most studied
‘system’ with significant knowledge on the
zooplankton compartment.

San Francisco
estuary
Seine estuary
At local scale both systems are very different (we do not have
a generic and universal framework) but from scientific and/or
global management angles these systems are comparable

Seine Scheldt
19th century
Today
Natural system
Anthropogenic footprint
Loss of natural habitats and a decrease of the resilience
of the system (i.e. flooding, eutrophication, etc.)

Mapping of the habitat of the juveniles of the
flatfish Solea solea in the Seine estuary
1834
2004
From Rochette et al. (2008)
These changes of the
Seine estuary induced an
annual loss of 20% of the
total production of
juveniles of Solea solea in
the Eastern English
Channel.

From JP Lemoine GIP Seine-Aval (2013)
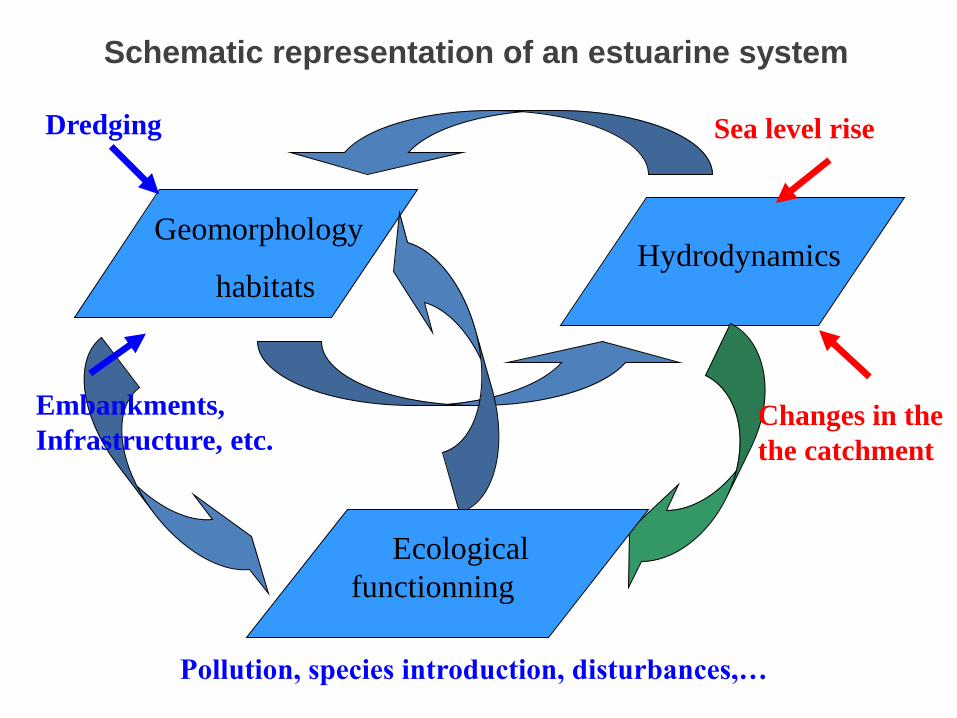
Geomorphology
habitats Hydrodynamics
Ecological
functionning
Sea level rise
Changes in the
the catchment
Dredging
Embankments,
Infrastructure, etc.
Pollution, species introduction, disturbances,…
Schematic representation of an estuarine system

Understanding the system – developing tools – stimulating
interdisciplinary studies
1995-2000 2001-2003 2004-2006 2007-2012
Biological structure Fisheries, risk
assessment,…
Habitat restoration,
management,
indicators
Climate change,
biodiversity
dynamics,..
Scientists Managers
Decision makers
Different phases of the scientific program Seine-Aval

Modeling
In situ Laboratory First challenge: to develop biological
indicators of the water quality (in the
Seine estuary) based on the
copepod Eurytemora affinis.
From V. Loiseau
Estuarine food
web in the Low
Salinity Zone
(LSZ) based on
the knowledge of
the first phase of
the Seine Aval
program

male
Female
Spermatophore
1 egg sac
Nauplius IV
Copepodid I
Gene expression
Proteomics
Enzymatic activity
Behaviour/Mating
Morphology
Development/Growth
Fecundity/Survival
Longevity
Bioaccumulation
Vulnerability (predators &
epibionts)
Effect of turbulence
Plasticity/Adaptation
Resting eggs/Diapause
Competition with Acartia
Modeling (IBM)
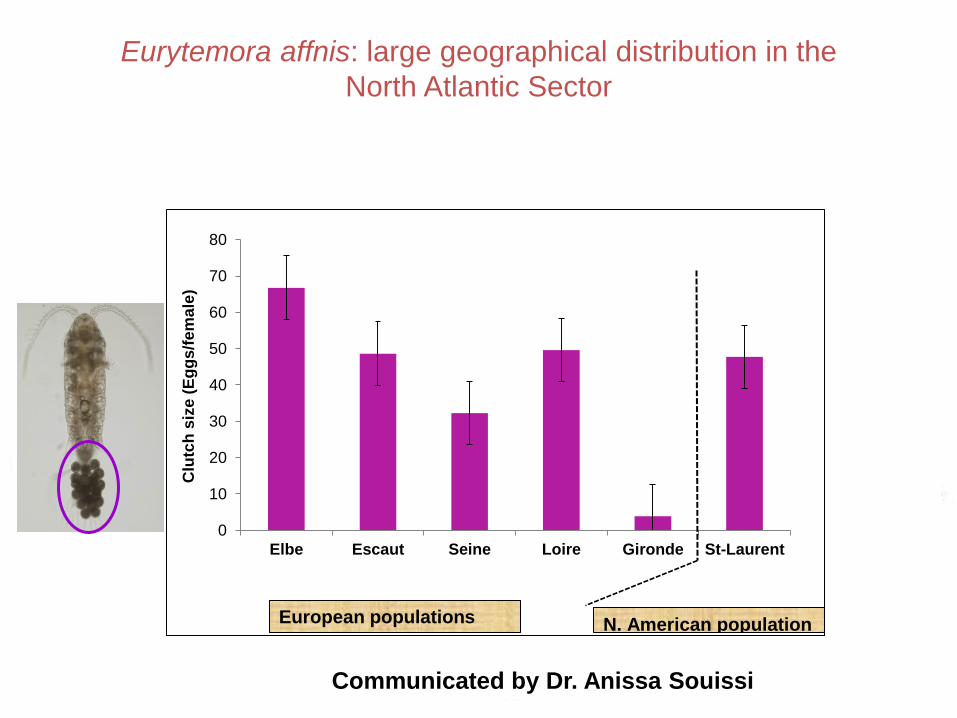
Eurytemora affnis: large geographical distribution in the
North Atlantic Sector
Winkler, Souissi et al. (2011)
2012
0
10
20
30
40
50
60
70
80
Elbe Escaut Seine Loire Gironde St-Laurent
Clu
tch
siz
e (
Eg
gs/f
em
ale
)
N. American population European populations
Communicated by Dr. Anissa Souissi
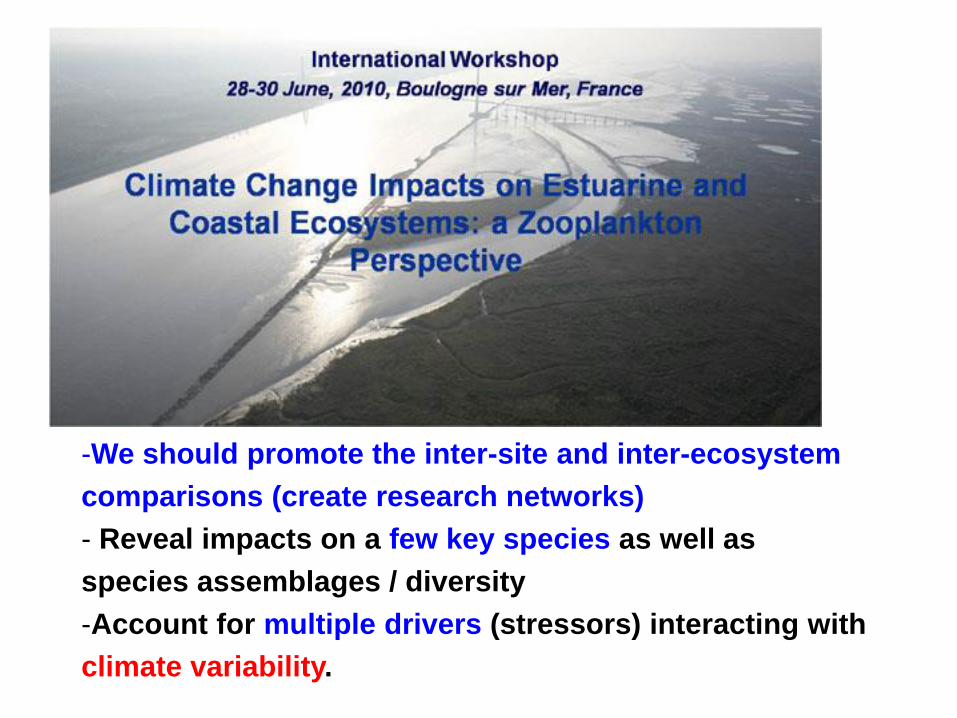
-We should promote the inter-site and inter-ecosystem
comparisons (create research networks)
- Reveal impacts on a few key species as well as
species assemblages / diversity
-Account for multiple drivers (stressors) interacting with
climate variability.

Figure communicated
Dr. David G. Kimmel
Other uses
Composition/
dynamics
Diversity/dynamics
/Production
Diversity/Abundance/size/
biomass/Production
Responses of
zooplankton to water
quality improvement
Regional climate variability vs lower food web levels
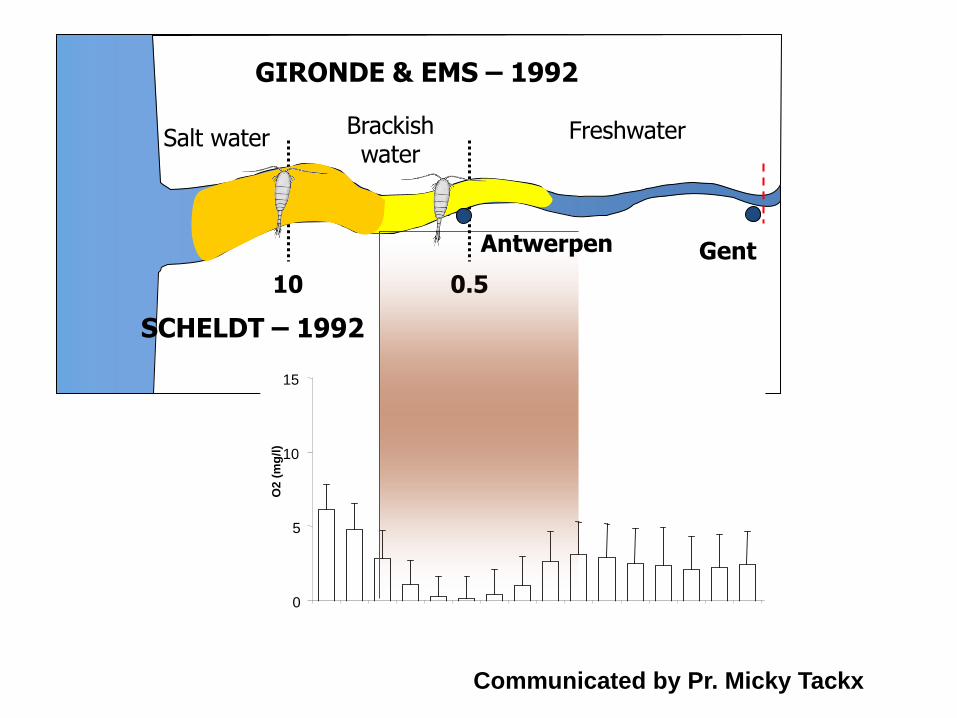
0.5
Brackish water
Salt water Freshwater
10
GIRONDE & EMS – 1992
SCHELDT – 1992
0
5
10
15
O2
(m
g/l
)
Gent Antwerpen
Communicated by Pr. Micky Tackx
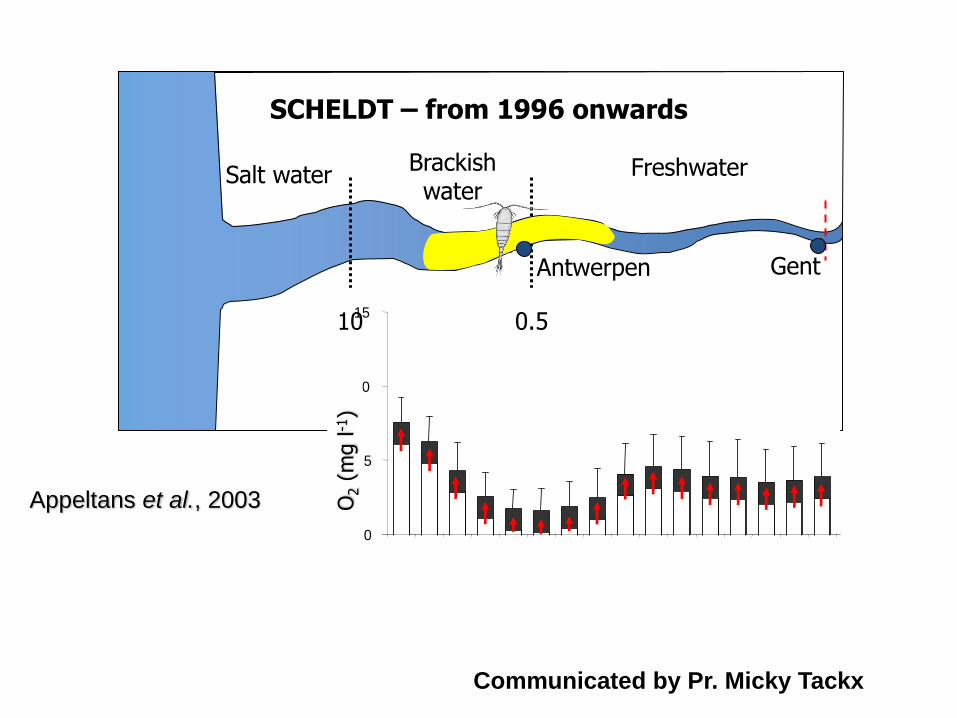
Brackish water
Salt water Freshwater
Appeltans et al., 2003
0
5
10
15
O2 (
mg
/l)
SCHELDT – from 1996 onwards
Gent
0.5 10
Antwerpen
O2 (
mg l
-1)
Communicated by Pr. Micky Tackx
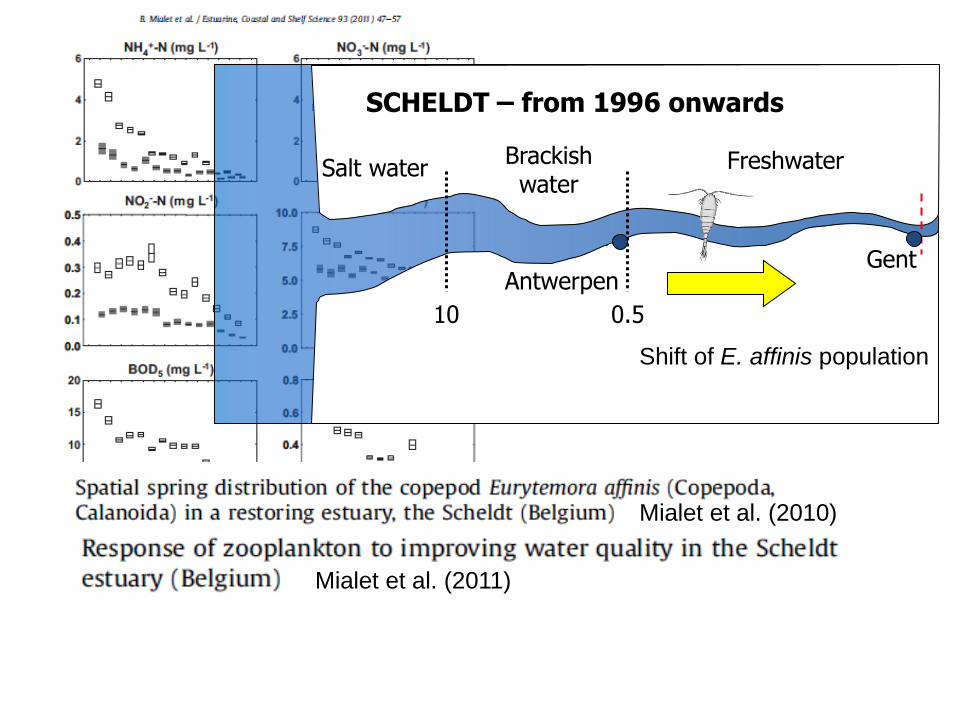
Brackish water
Salt water Freshwater
SCHELDT – from 1996 onwards
Gent
0.5 10
Antwerpen
Shift of E. affinis population
Mialet et al. (2010)
Mialet et al. (2011)

Tidal marsh
mudflats
Shallow water
Service :
Primary production
Biodiversity
Regulation of nutrients
Si regeneration
Pelagic habitat
River
Zm/Zp
Phyto
plankton
Organic
Load/ Si
Habitat function
Regulation of nutrients
Modified from Pr. Patrick Meire and col.
Restoration program in the Scheldt estuary: A 3500 ha restoration project is being realized
combining safety and ecosystem functioning
Zooplankton
Fish
? ?
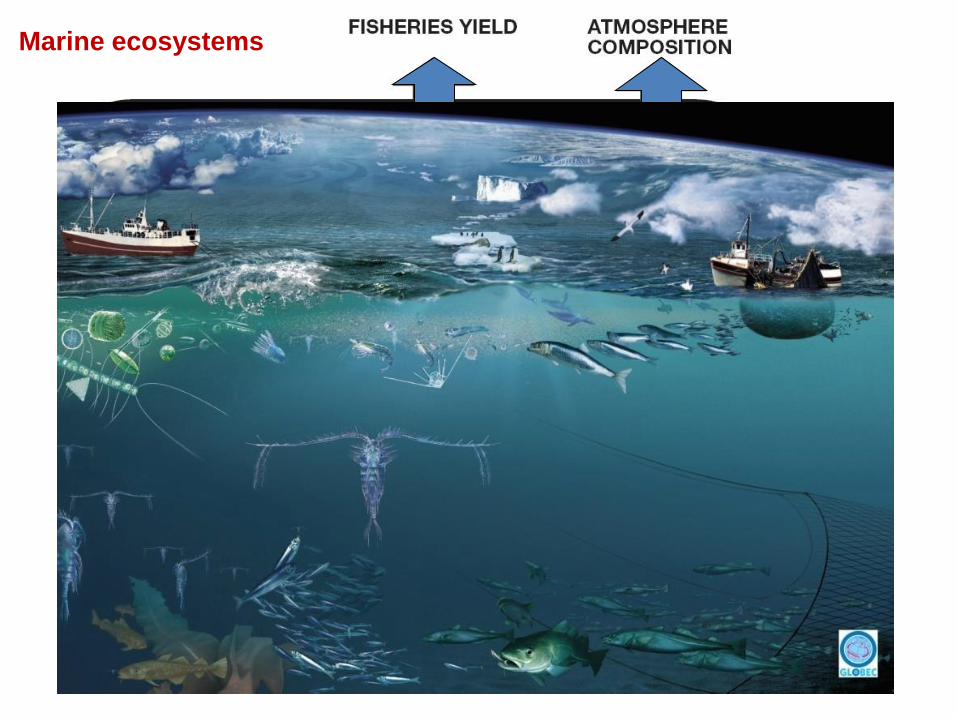
Duffy & Stachowicz (2006) MEPS
Marine ecosystems
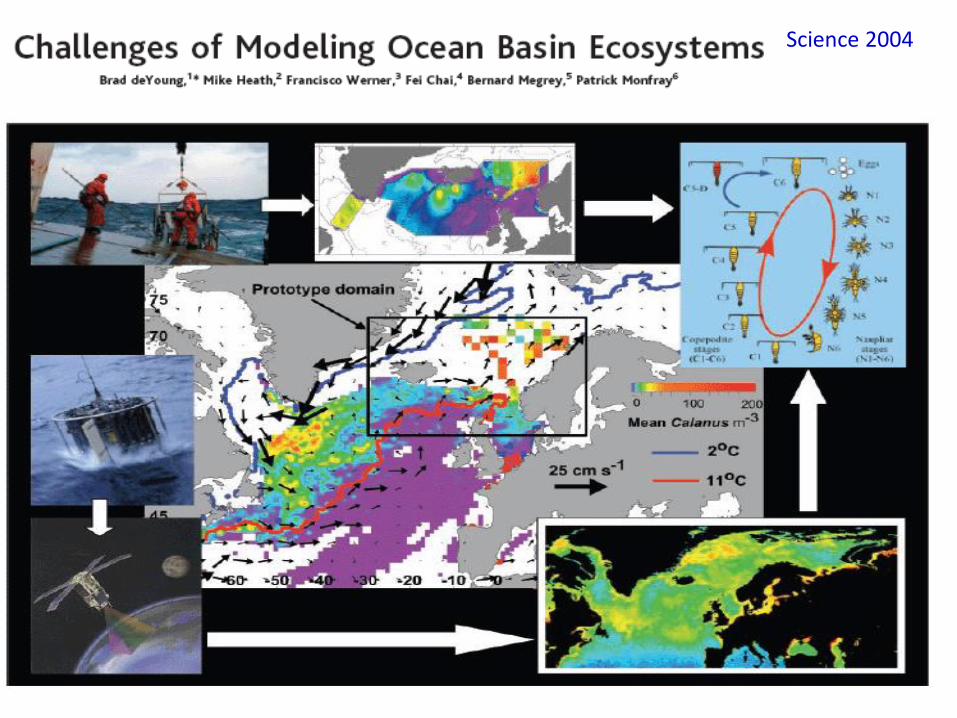
Science 2004
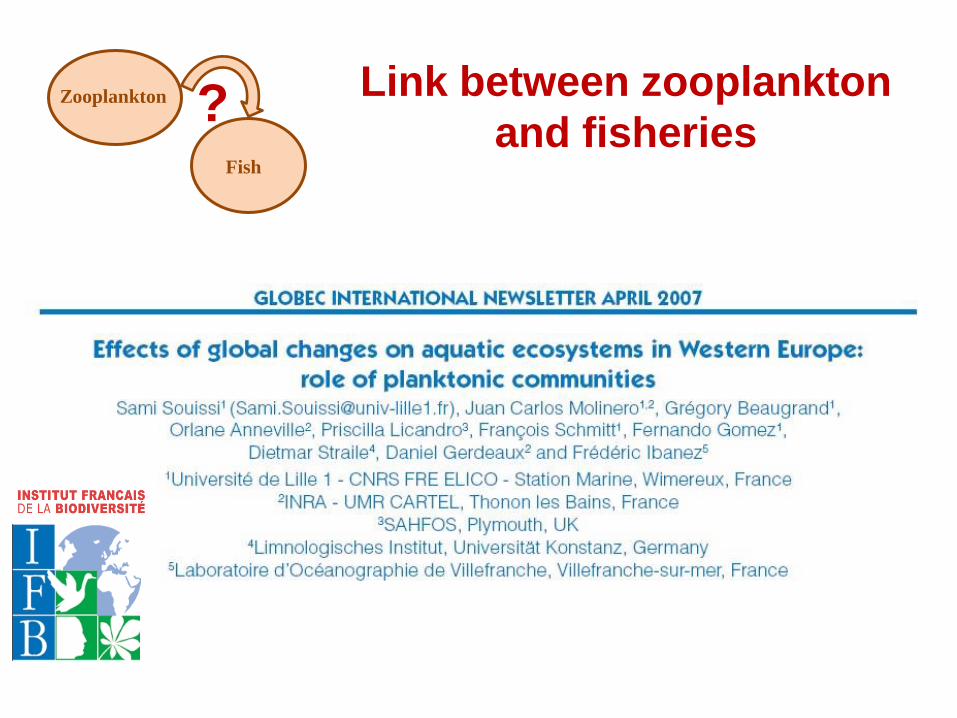
Link between zooplankton
and fisheries Zooplankton
Fish
?

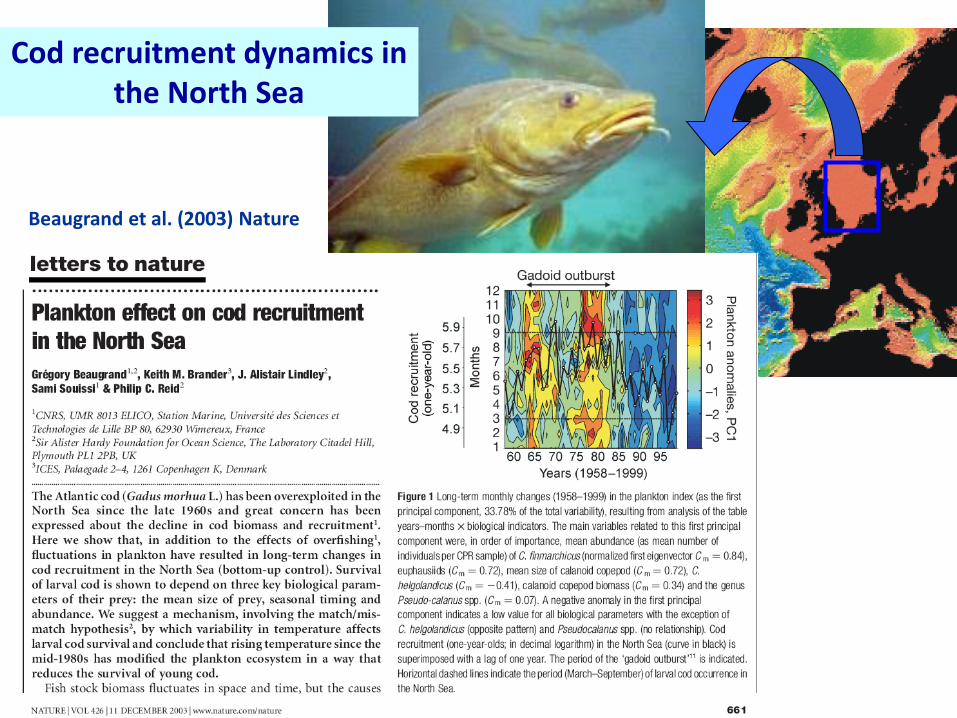
Cod recruitment dynamics in the North Sea
Beaugrand et al. (2003) Nature

Empirical biological indicator for cod recruitment
March October July
Fish larvae
Euphausids
Early life cycle
Calanus (from eggs to adults)
Pseudocalanus
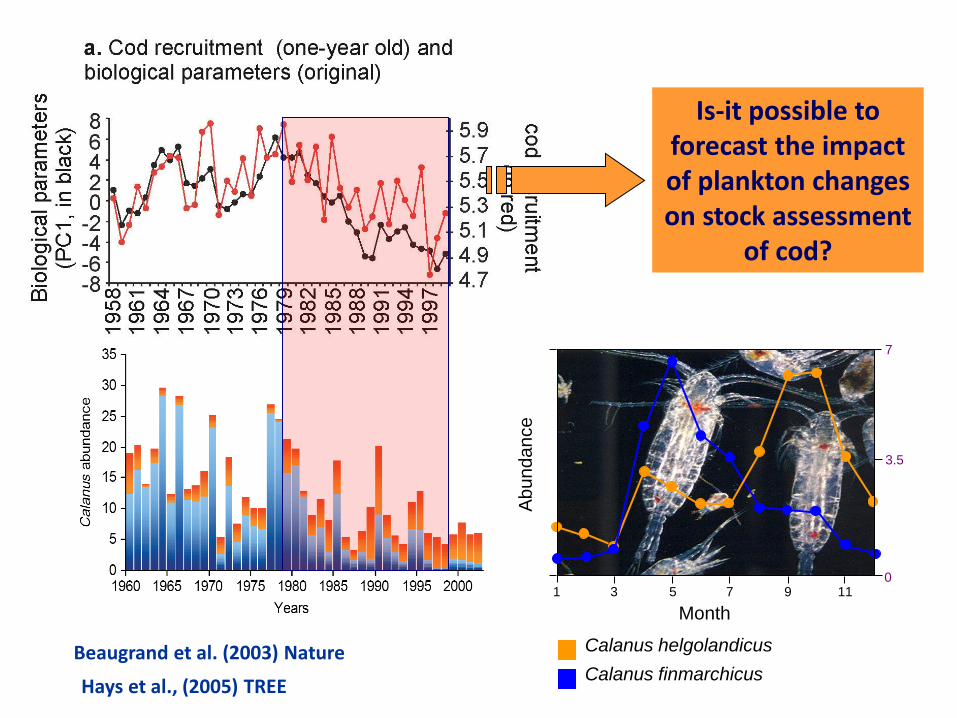
Beaugrand et al. (2003) Nature
Hays et al., (2005) TREE
Is-it possible to forecast the impact of plankton changes on stock assessment
of cod?
Calanus helgolandicus
Calanus finmarchicus
7 25
0 0
3.5
1 3 5 7 9
Abundance
11
Month

Start
End
Transients
?
?
Souissi et al. unpublished
Stock – recruitment – zoolankton: a dynamical system

Is-it possible to restore/improve the carrying capacity of an
aquatic ecosystem (i.e. California’s Bay-Delta ecosystem)?
Carrying capacity of an
ecosystem can oscillate
between several states
(attractors) that can be
determined by density-
dependent and density
independent factors.
Solari et al. (2010) ICES JMS
Stock – recruitment : need of a new paradigm

Catchment area ‘Susquehanna River’
172000 Km²
13000 Km²
From Kimmel et al. (2006, 2008)
Modifications of the pelagic ecosystem in the Chesapeake bay
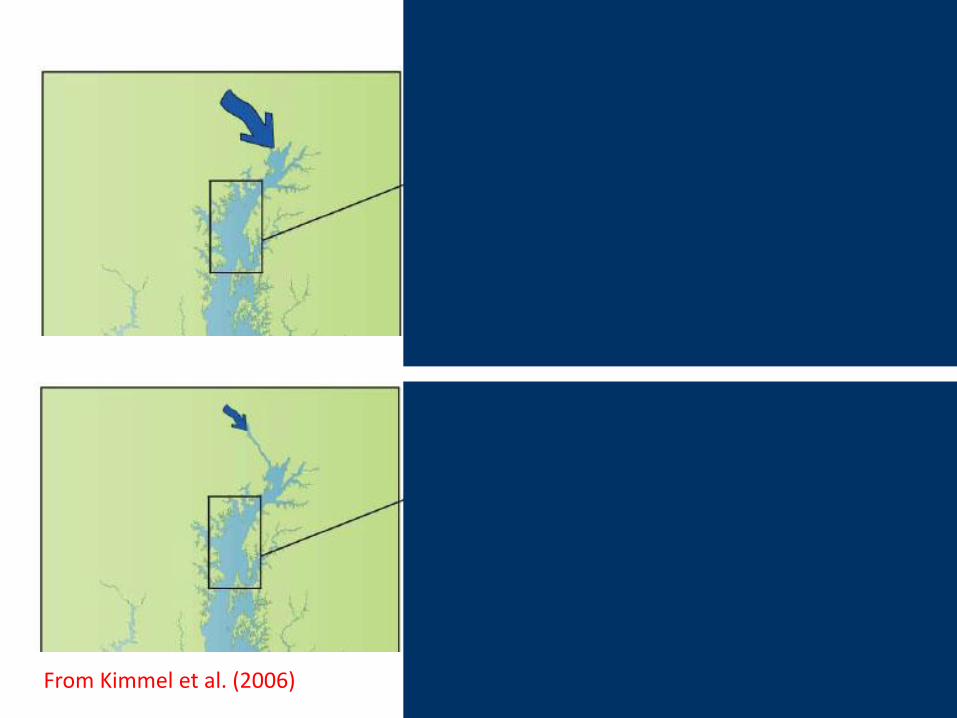
From Kimmel et al. (2006)
E. affinis
A. tonsa
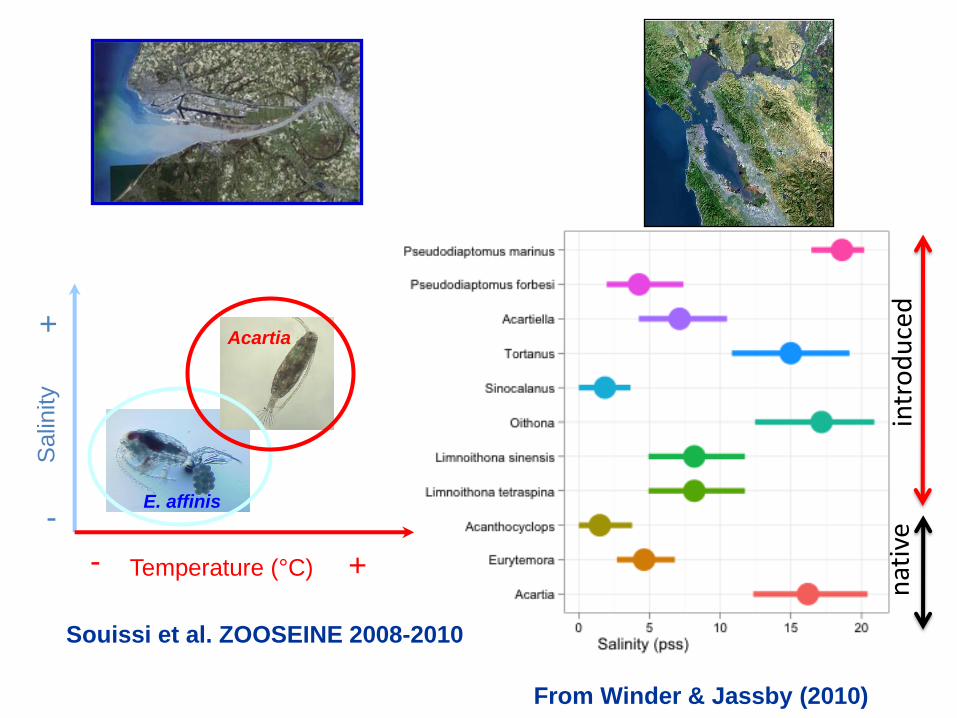
Salin
ity
-
+
Temperature (°C) - +
E. affinis
Acartia
Souissi et al. ZOOSEINE 2008-2010
intr
od
uce
d
nat
ive
From Winder & Jassby (2010)
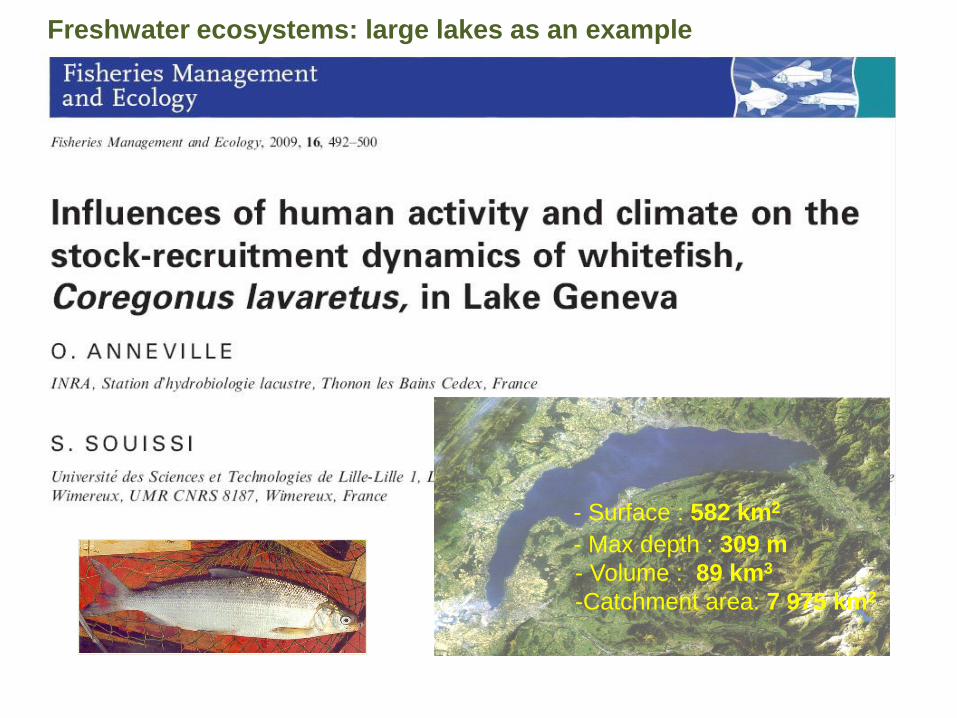
- Surface : 582 km2
- Max depth : 309 m
- Volume : 89 km3
-Catchment area: 7 975 km2
Freshwater ecosystems: large lakes as an example
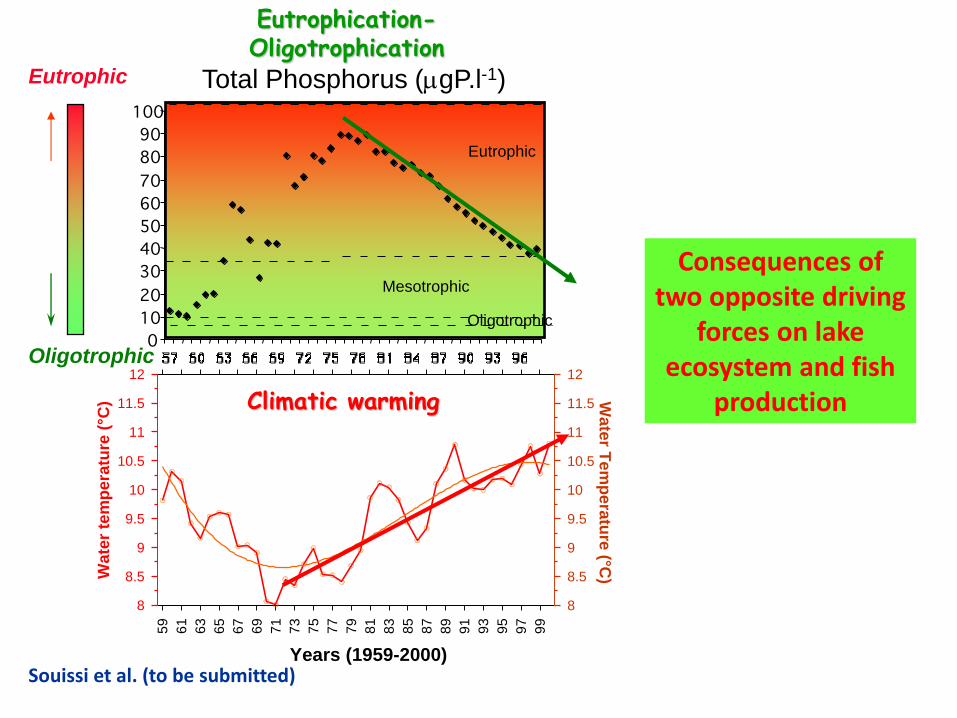
Total Phosphorus (gP.l-1)
0
10
20
30
40
50
60
70
80
90
100
Eutrophic
Mesotrophic
Oligotrophic
Oligotrophic
Eutrophic
Eutrophication-Oligotrophication
59
61
63
65
67
69
71
73
75
77
79
81
83
85
87
89
91
93
95
97
99
8
8.5
9
9.5
10
10.5
11
11.5
12
Wa
ter T
em
pe
ratu
re (°C
)Wate
r te
mp
era
ture
(°C
)
Years (1959-2000)
8
8.5
9
9.5
10
10.5
11
11.5
12
Consequences of two opposite driving
forces on lake ecosystem and fish
production
Souissi et al. (to be submitted)
Climatic warming

0 40 80 120 160 200 240 280 320
0
40
80
120
160
200
240
280
320
Spawning stock abundance index
6364
7678
68
6575
9473
9695
97
98
99
00
01
02
67
6669
70
71
72
74
7782
81
90
Fit B & H modelFit Shepherd model
Fit linear model
Data
Period63-96
Period63-02
Density-Dependence
Shepherd stock-recruitment model
Caranhac and Gerdeaux (1998) Arch. Hydrobiol.
No Density-Dependence
Linear stock-recruitment model
Anneville, Souissi et al. (2009)
Phosphorus reduction -Survival of eggs Water warming -Good match between zooplankton timing and larval development
Aquaculture -Stocking of eggs and release of whitefish larvae in the lake
Recruitment was improved

Phytoplankton
Zooplankton
Planctivorous fish
Predators
Top-Down
Bottom-Up
Diversity/dynamics/Production
Diversity/Abundance/Size
structure/Biomass/Production
Water quality and pelagic habitats
Higher trophic levels/consider
the spatial distribution
Partial conclusion
Bentho-pelagic coupling
Competitors (ZOO)
Competitors (FISH)

But we should not forget that the
biomass/production of zooplankton
can be controlled/limited by internal
mechanisms related to the complexity
of their life cycles.


Souissi et al. (1997); Souissi & Nival (1997); Souissi & Ban (2001);
Souissi et al. (2004, 2005)
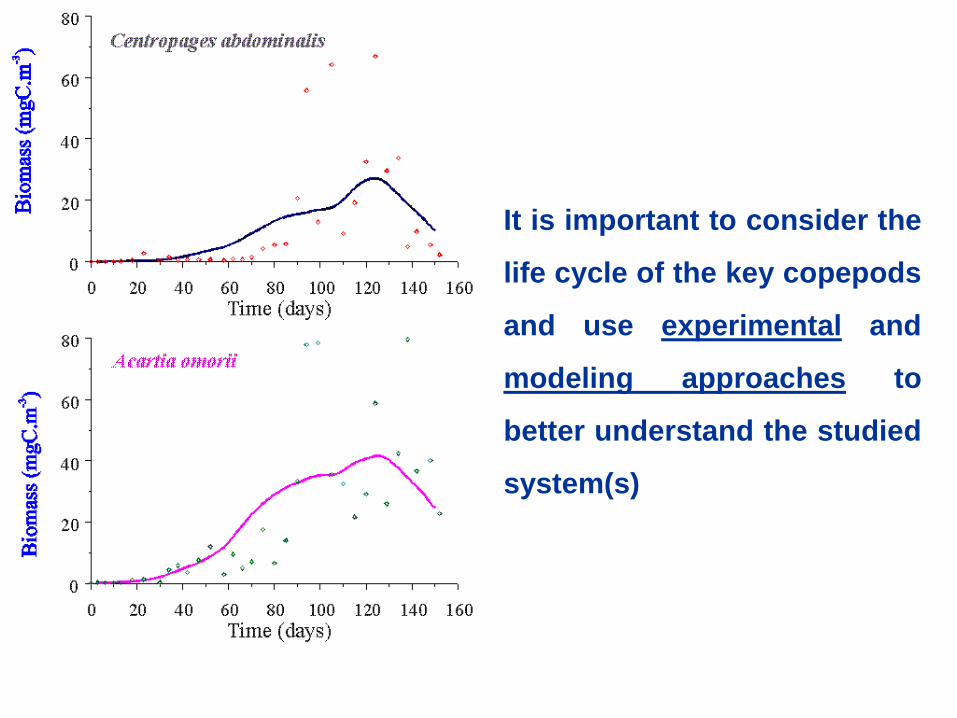
It is important to consider the
life cycle of the key copepods
and use experimental and
modeling approaches to
better understand the studied
system(s)
In conclusion
Zooplankton is one of the key components of
estuary food web and should be deeply studied
(see Wim’s talk for the review of the situation in
the SF estuary)
Make a global cost-benefit analysis based on the
objectives of the restoration program:
Why (mitigate natural and human impacts)?
How much (surface/type of habitat)?
Where (Upper or Lower estuary)?
How (Ecological Engineering)?
Define a list of indicators to be monitored in order
to assess the effect of the restoration program?
Thank you for your attention
Special thanks to my research group members, international collaborators and many funding sources