Zook making sense of geosocial media-final
26
8/4/2014 1 Matthew Zook Professor, University of Kentucky, Department of Geography Fulbright Scholar, University of Tartu, Mobility Lab 2013‐14 Visiting Fellow, Oxford Internet Institute, 2014 17 July 14 OII Summer School Oxford Making Sense of Geosocial Media: Asking Questions and Escaping Mental Ruts Pizza in Space…….. August 2005 June 2006
Transcript of Zook making sense of geosocial media-final
8/4/2014
1
Matthew ZookProfessor, University of Kentucky, Department of Geography
Fulbright Scholar, University of Tartu, Mobility Lab 2013‐14
Visiting Fellow, Oxford Internet Institute, 2014
17 July 14
OII Summer SchoolOxford
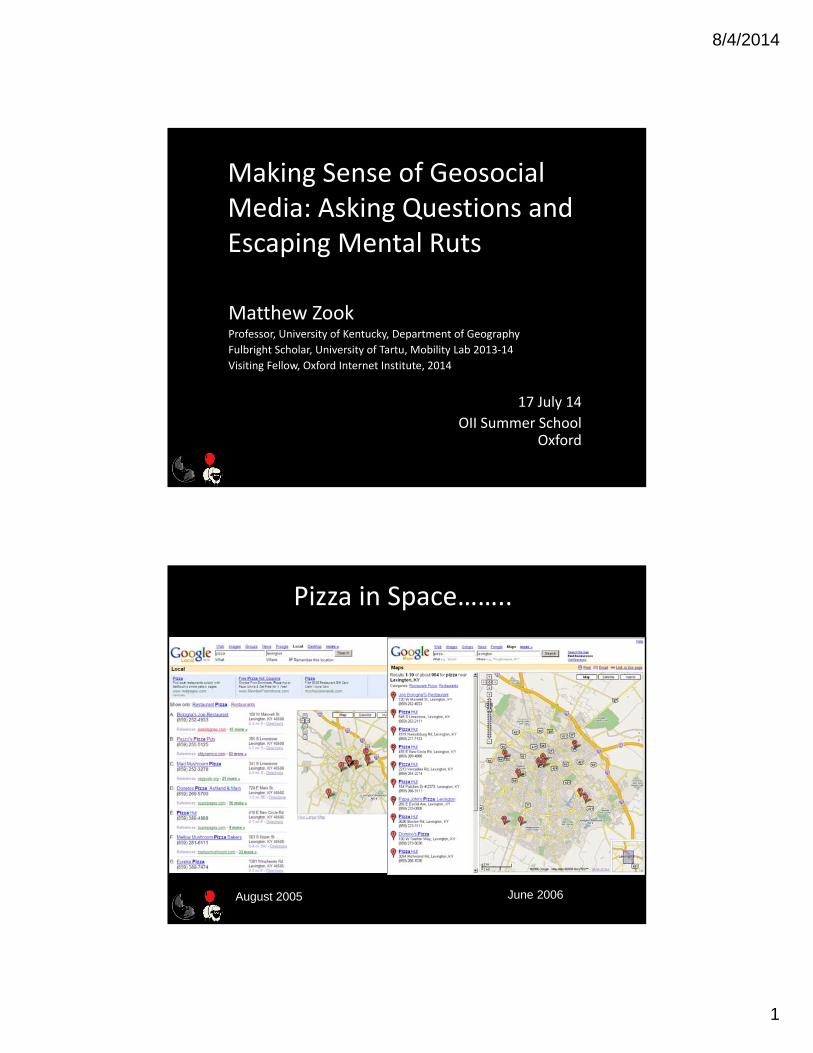
Making Sense of GeosocialMedia: Asking Questions and Escaping Mental Ruts
Pizza in Space……..
August 2005 June 2006
8/4/2014
2
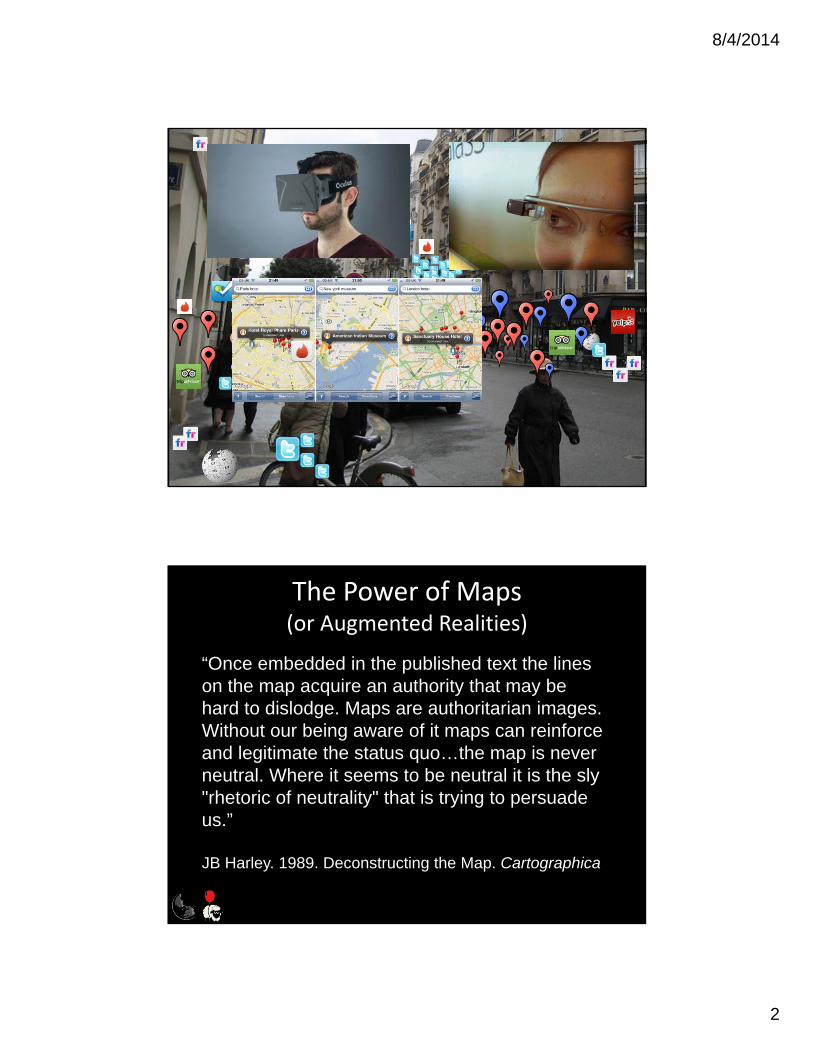
The Power of Maps(or Augmented Realities)
“Once embedded in the published text the lines on the map acquire an authority that may be hard to dislodge. Maps are authoritarian images. Without our being aware of it maps can reinforce and legitimate the status quo…the map is never neutral. Where it seems to be neutral it is the sly "rhetoric of neutrality" that is trying to persuade us.”
JB Harley. 1989. Deconstructing the Map. Cartographica

8/4/2014
3
Questions• How does geosocial media data connect to physical space?
– How do these data shadows contribute to the representation of places via augmented realities? How are these representations products of and productive of, social relationships and associated power relations?
• How do we go beyond “simple” spatial clustering questions?
– For example, what can geosocial media reveal about activity spaces of cities?
• How can we deal with bias in geosocial media?
Connecting geosocial media data to physical space
@mattzook
8/4/2014
4
@mattzook 7
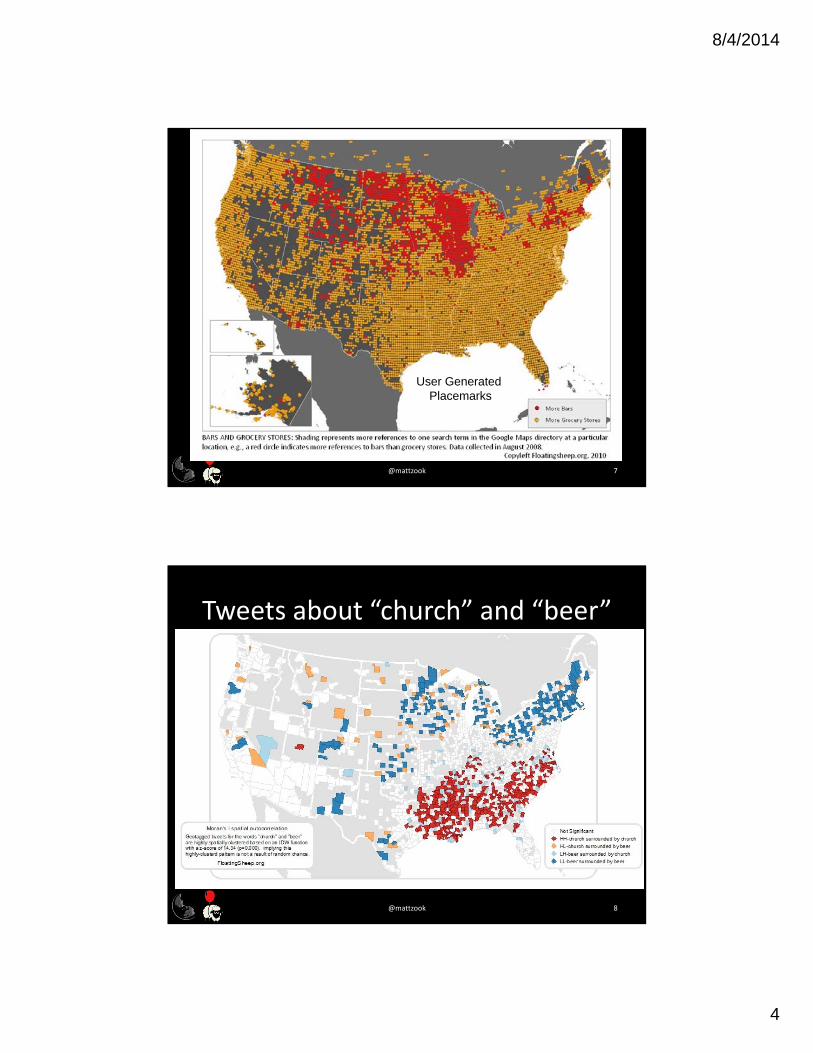
User Generated Placemarks
Tweets about “church” and “beer”
@mattzook 8
8/4/2014
5
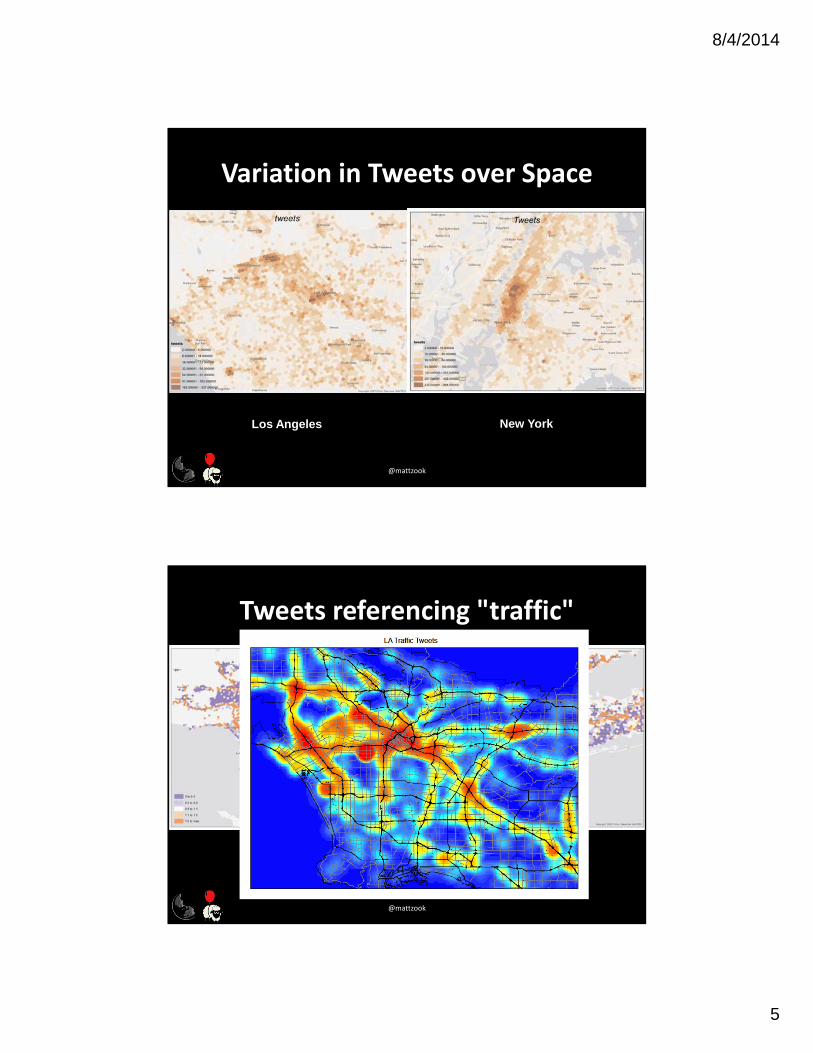
Variation in Tweets over Space
@mattzook
Los Angeles New York
Tweets referencing "traffic"
@mattzook
Los Angeles New York
8/4/2014
6
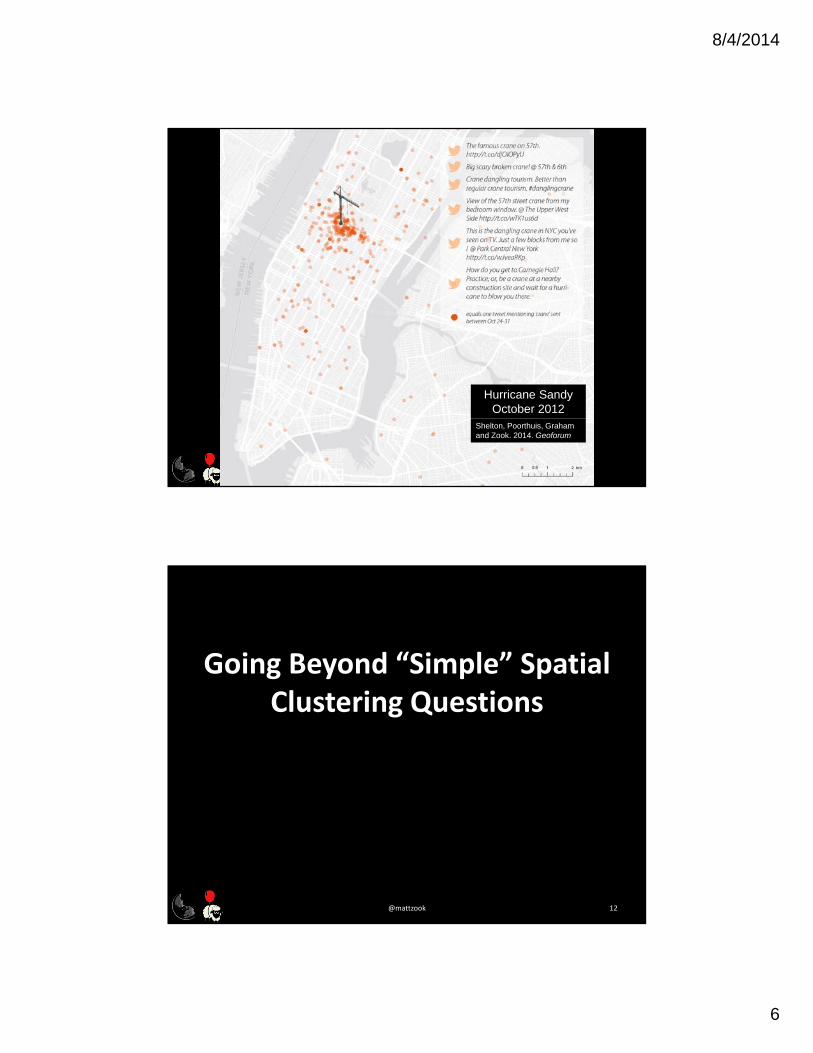
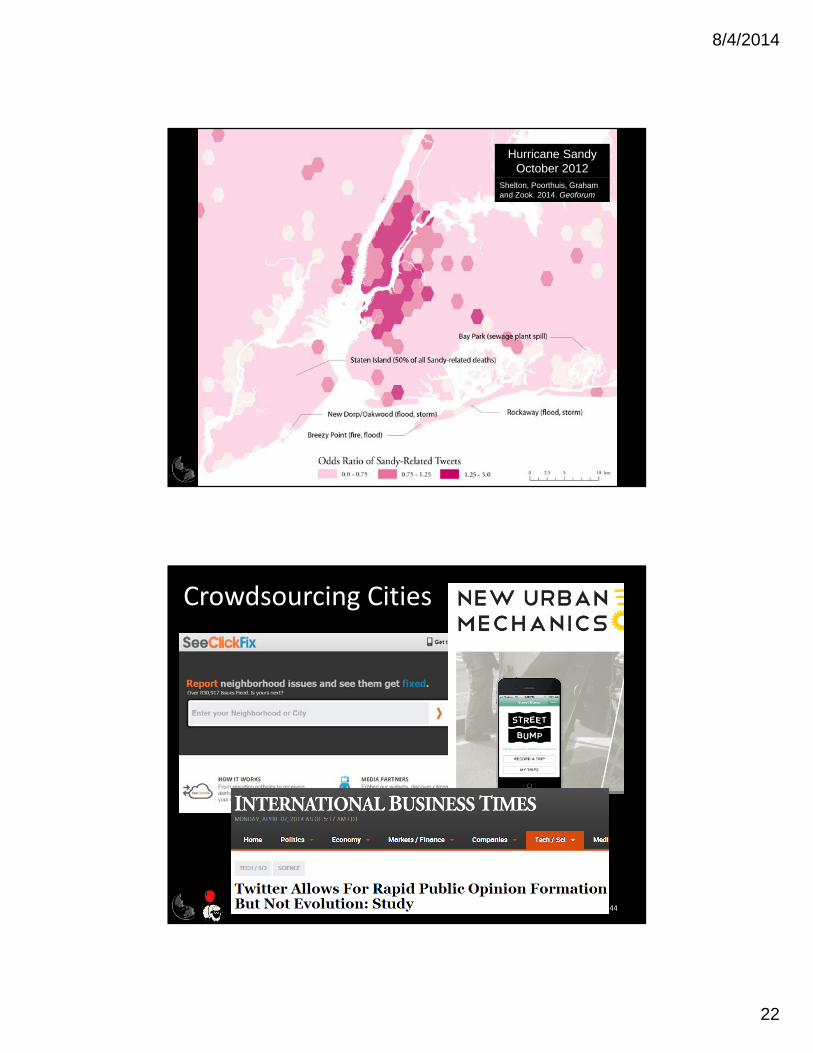
Hurricane Sandy October 2012
Shelton, Poorthuis, Graham and Zook. 2014. Geoforum
@mattzook 12
Going Beyond “Simple” Spatial Clustering Questions

8/4/2014
7
@mattzook 13
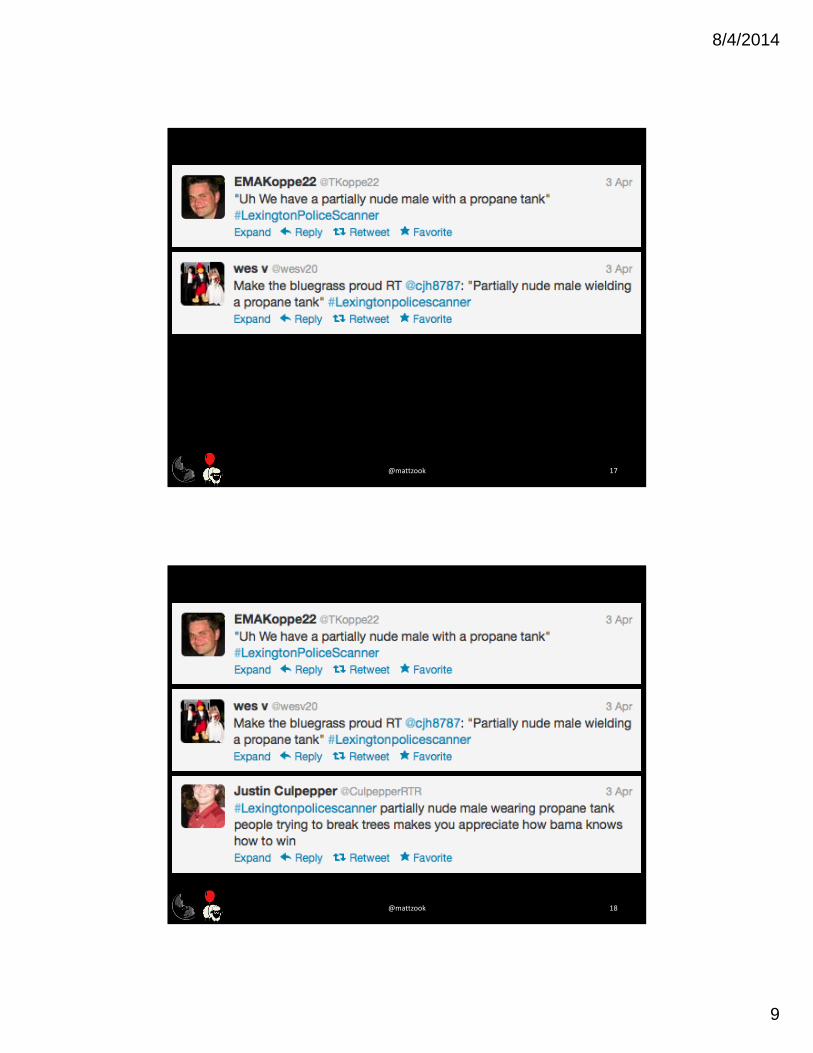
REUTERS 3 April 2012 http://www.reuters.com/article/2012/04/03/us-basketball-finalfour-celebration-idUSBRE8320YM20120403
@mattzook 14
WIRED 3 April 2012 http://www.wired.com/rawfile/2012/04/kentucky-wins-but-students-lose-in-basketball-riot-photos

8/4/2014
8
@mattzook 15
WIRED 3 April 2012 http://www.wired.com/rawfile/2012/04/kentucky-wins-but-students-lose-in-basketball-riot-photos
@mattzook 16
8/4/2014
9
@mattzook 17
@mattzook 18
8/4/2014
10
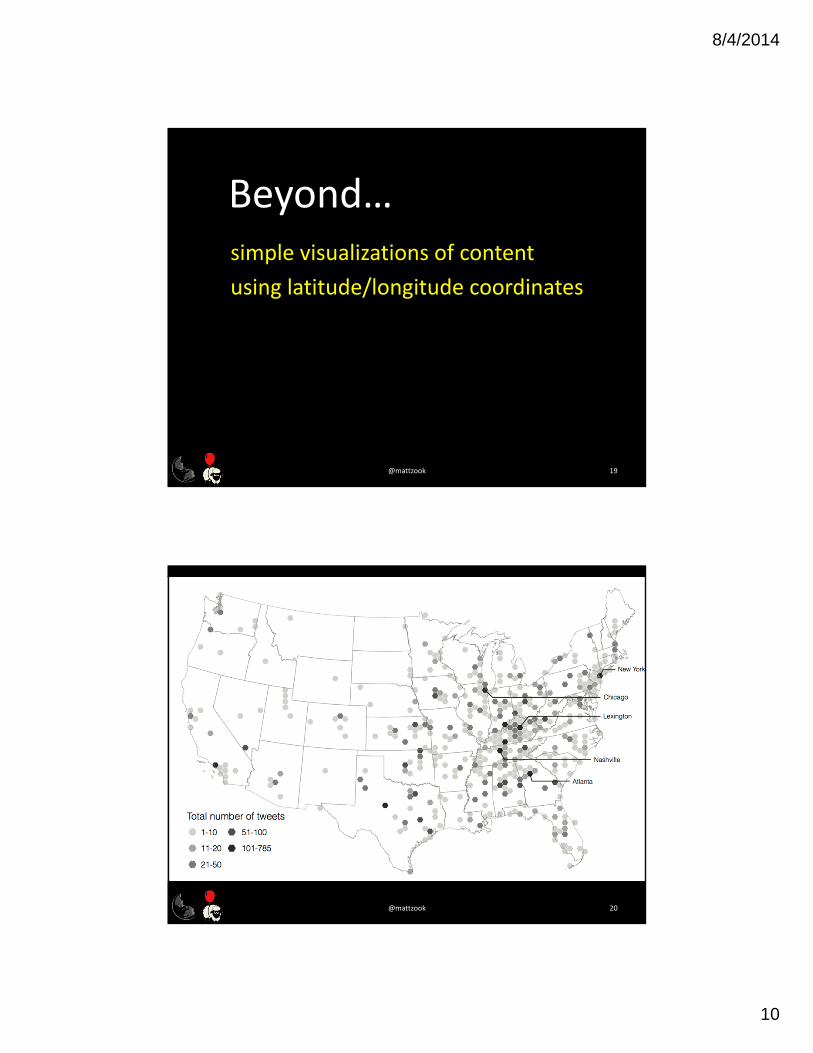
simple visualizations of content
using latitude/longitude coordinates
@mattzook 19
Beyond…
@mattzook 20
8/4/2014
11
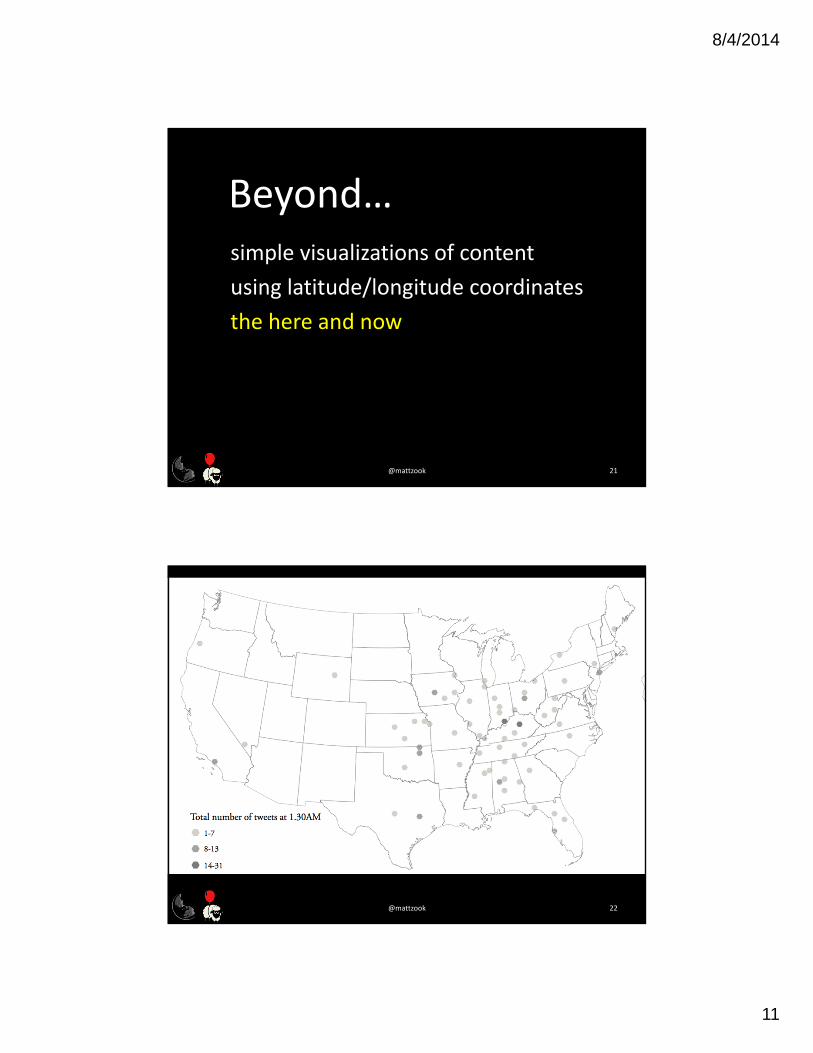
simple visualizations of content
using latitude/longitude coordinates
the here and now
@mattzook 21
Beyond…
@mattzook 22
8/4/2014
12
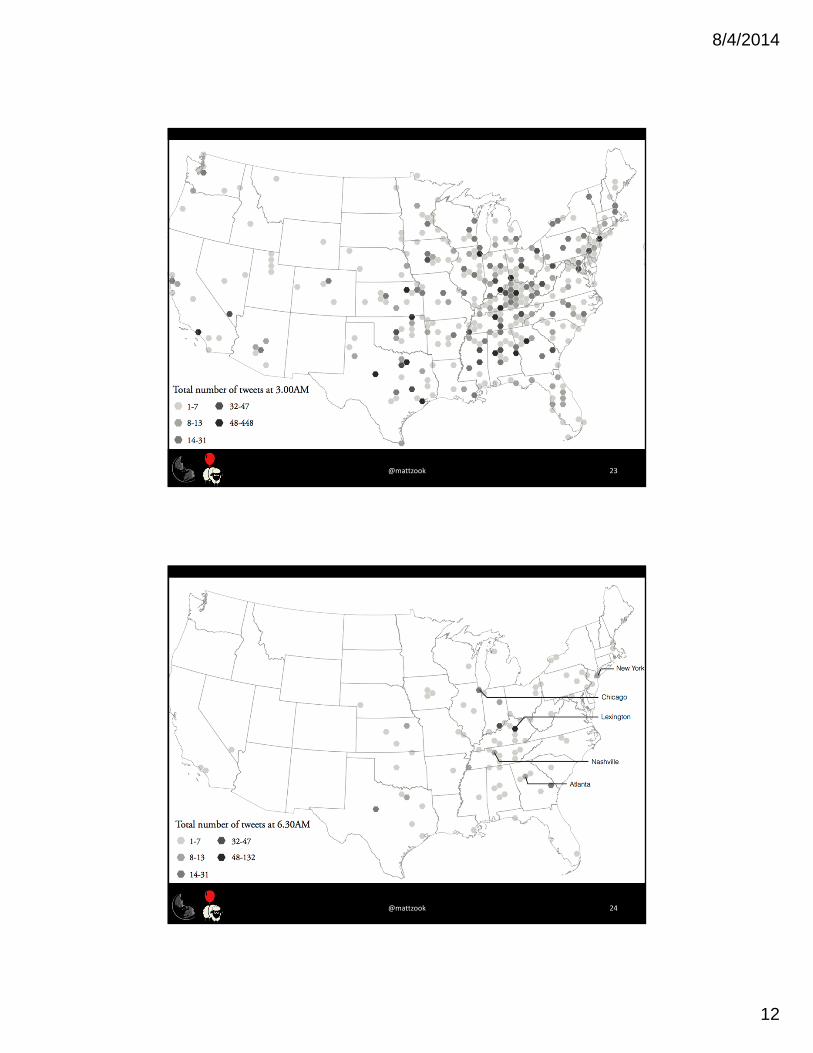
@mattzook 23
@mattzook 24
8/4/2014
13
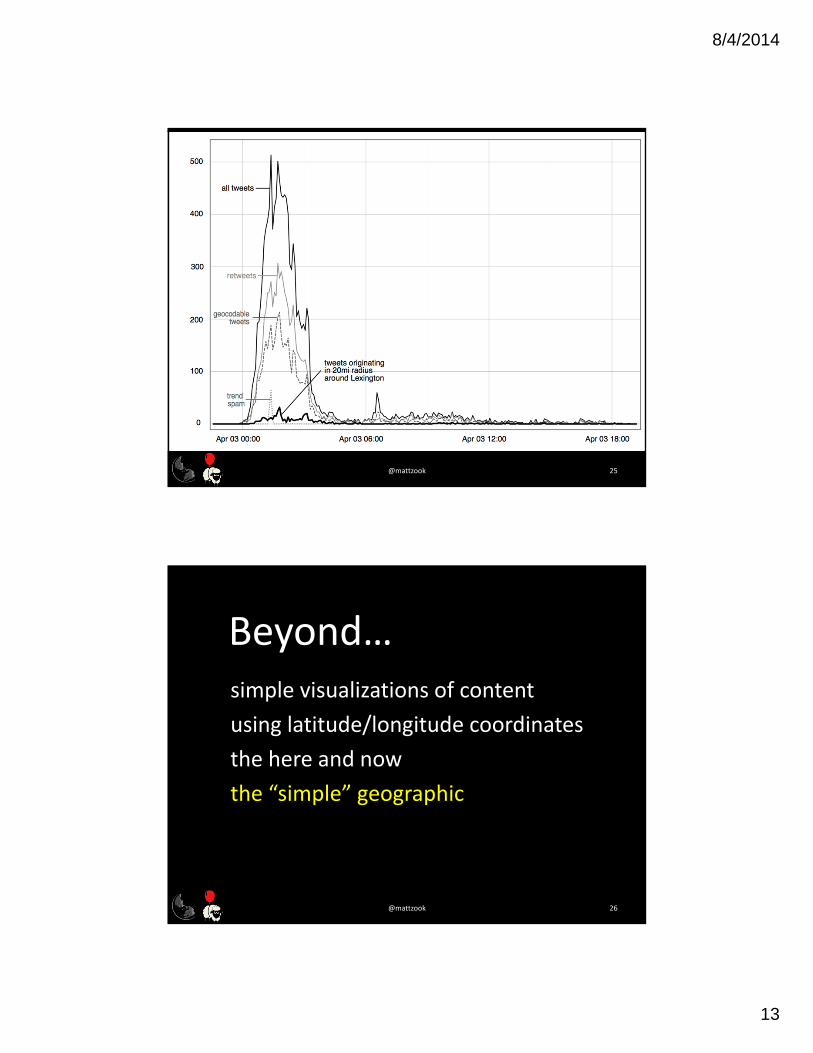
@mattzook 25
simple visualizations of content
using latitude/longitude coordinates
the here and now
the “simple” geographic
@mattzook 26
Beyond…
8/4/2014
14
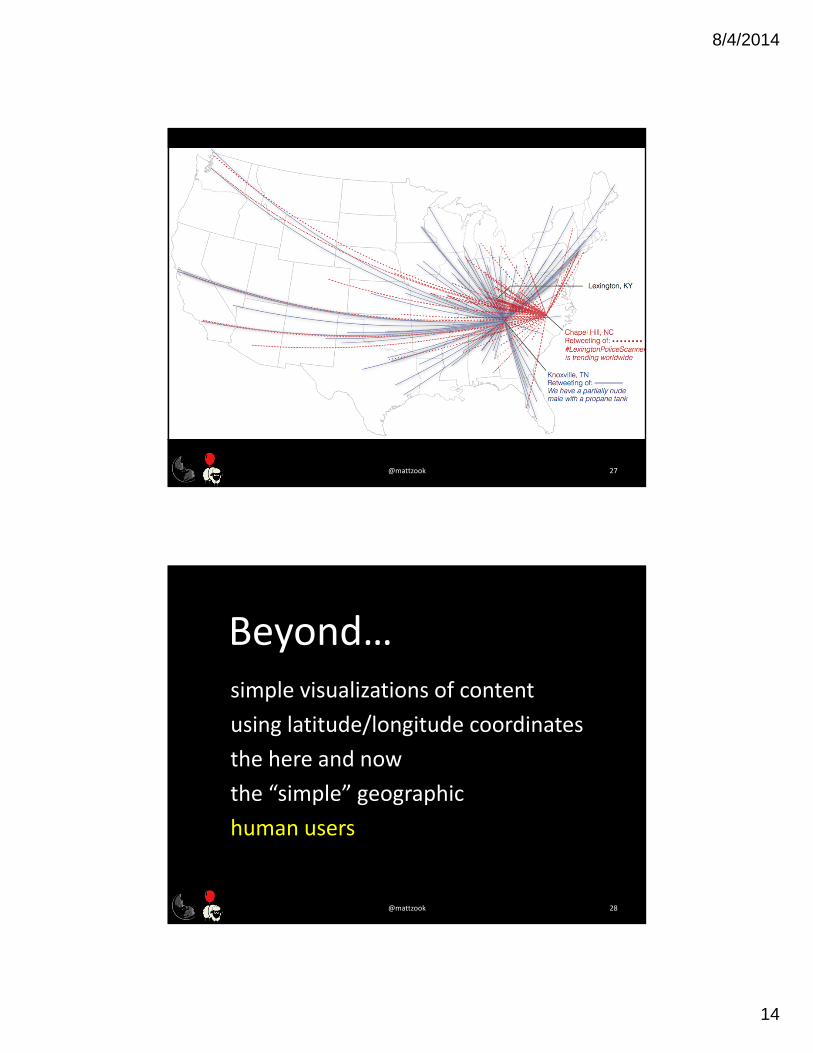
@mattzook 27
simple visualizations of content
using latitude/longitude coordinates
the here and now
the “simple” geographic
human users
@mattzook 28
Beyond…
8/4/2014
15
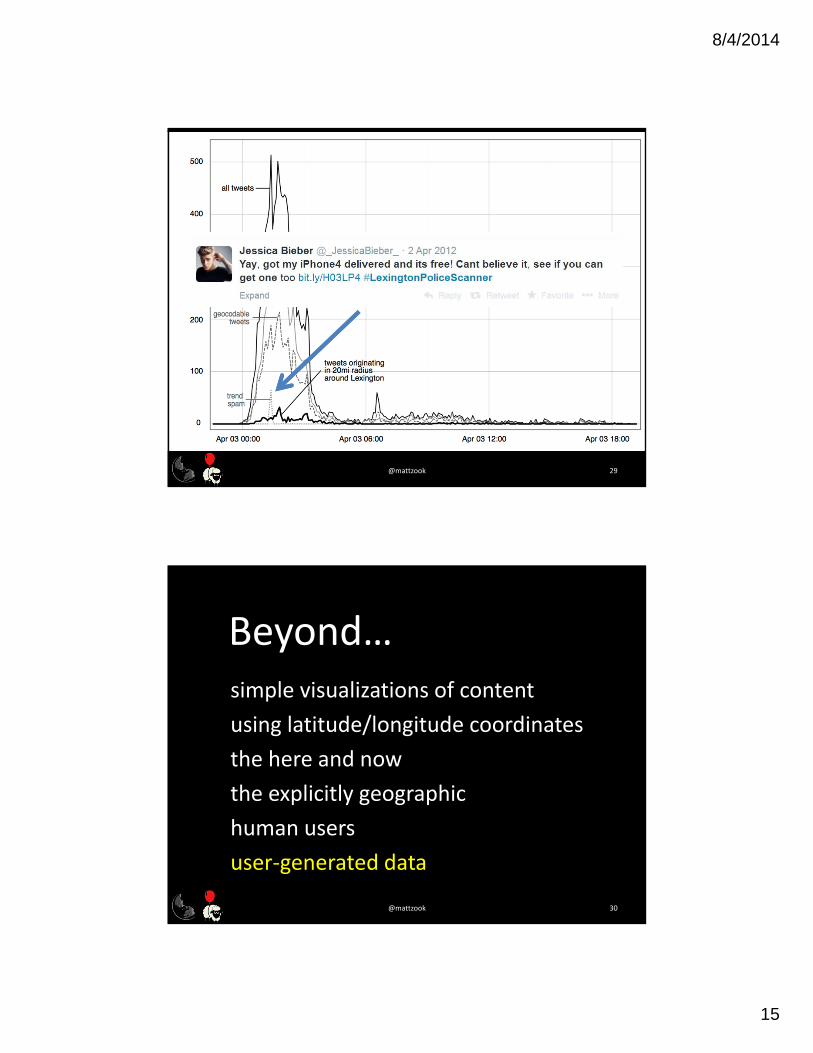
@mattzook 29
simple visualizations of content
using latitude/longitude coordinates
the here and now
the explicitly geographic
human users
user‐generated data
@mattzook 30
Beyond…
8/4/2014
16
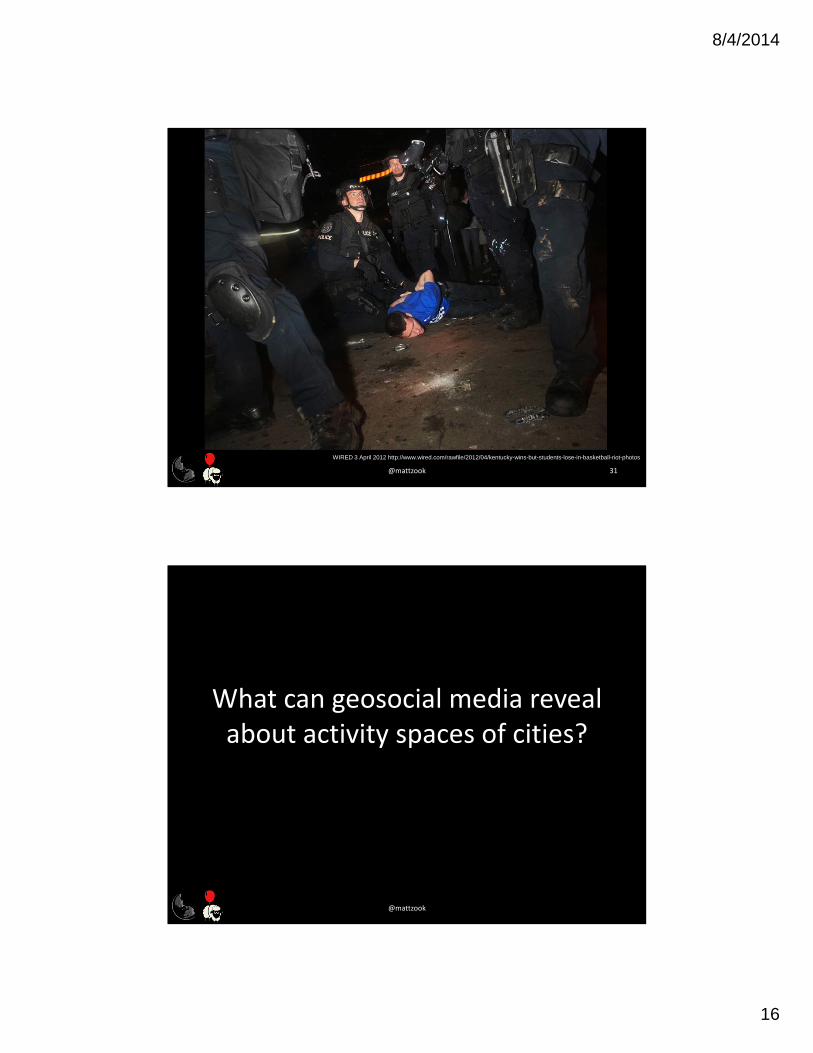
@mattzook 31
WIRED 3 April 2012 http://www.wired.com/rawfile/2012/04/kentucky-wins-but-students-lose-in-basketball-riot-photos
What can geosocial media reveal about activity spaces of cities?
@mattzook
8/4/2014
17
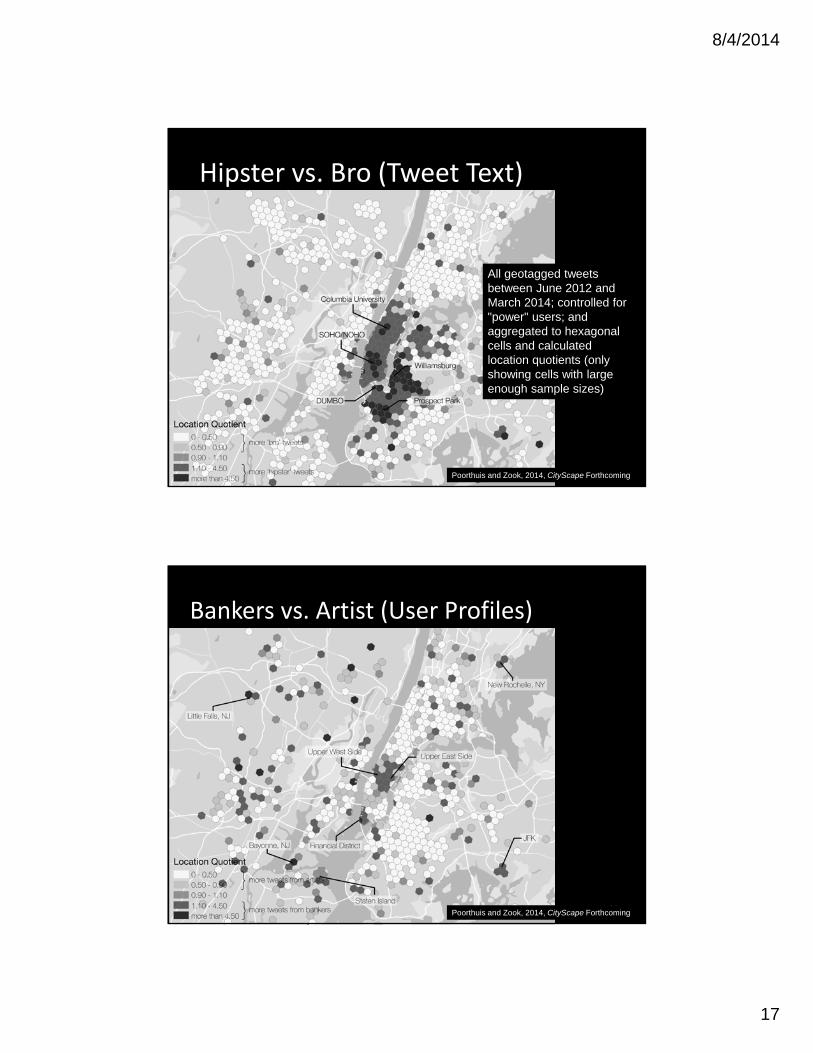
Hipster vs. Bro (Tweet Text)
All geotagged tweets between June 2012 and March 2014; controlled for "power" users; and aggregated to hexagonal cells and calculated location quotients (only showing cells with large enough sample sizes)
33Poorthuis and Zook, 2014, CityScape Forthcoming
Bankers vs. Artist (User Profiles)
34Poorthuis and Zook, 2014, CityScape Forthcoming
8/4/2014
18
@mattzook 35
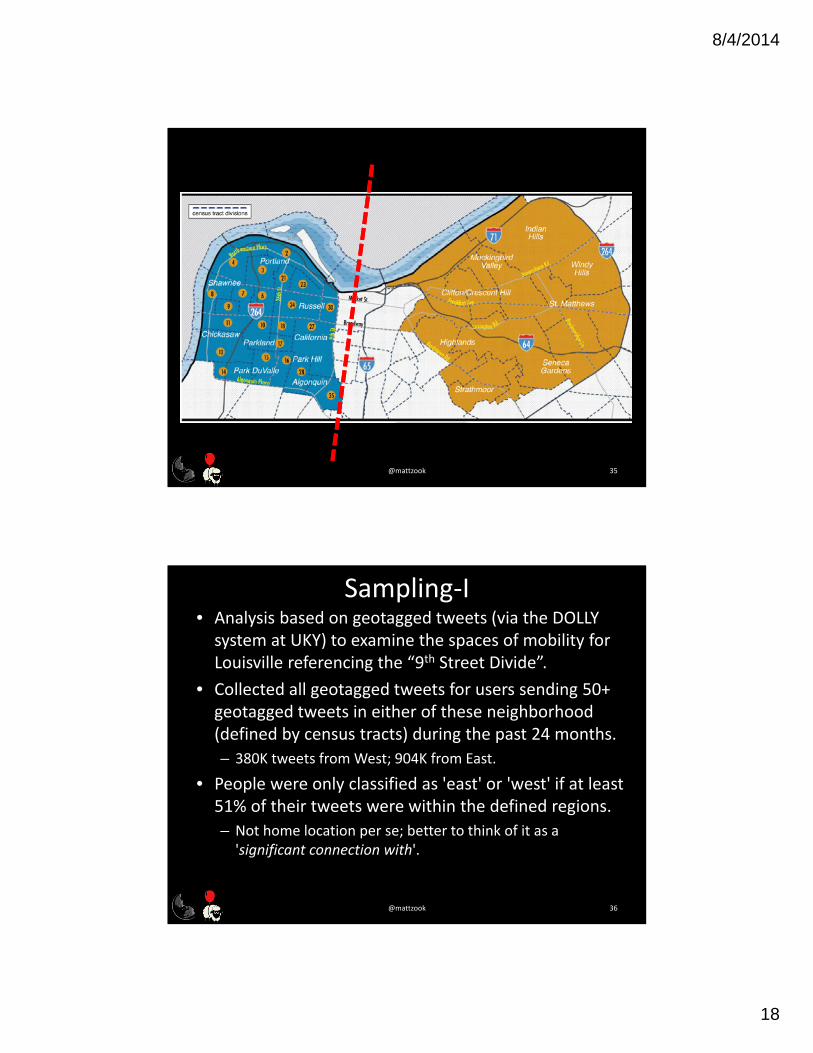
Sampling‐I• Analysis based on geotagged tweets (via the DOLLY system at UKY) to examine the spaces of mobility for Louisville referencing the “9th Street Divide”.
• Collected all geotagged tweets for users sending 50+ geotagged tweets in either of these neighborhood (defined by census tracts) during the past 24 months.
– 380K tweets from West; 904K from East.
• People were only classified as 'east' or 'west' if at least 51% of their tweets were within the defined regions.
– Not home location per se; better to think of it as a 'significant connection with'.
@mattzook 36
8/4/2014
19
@mattzook 37
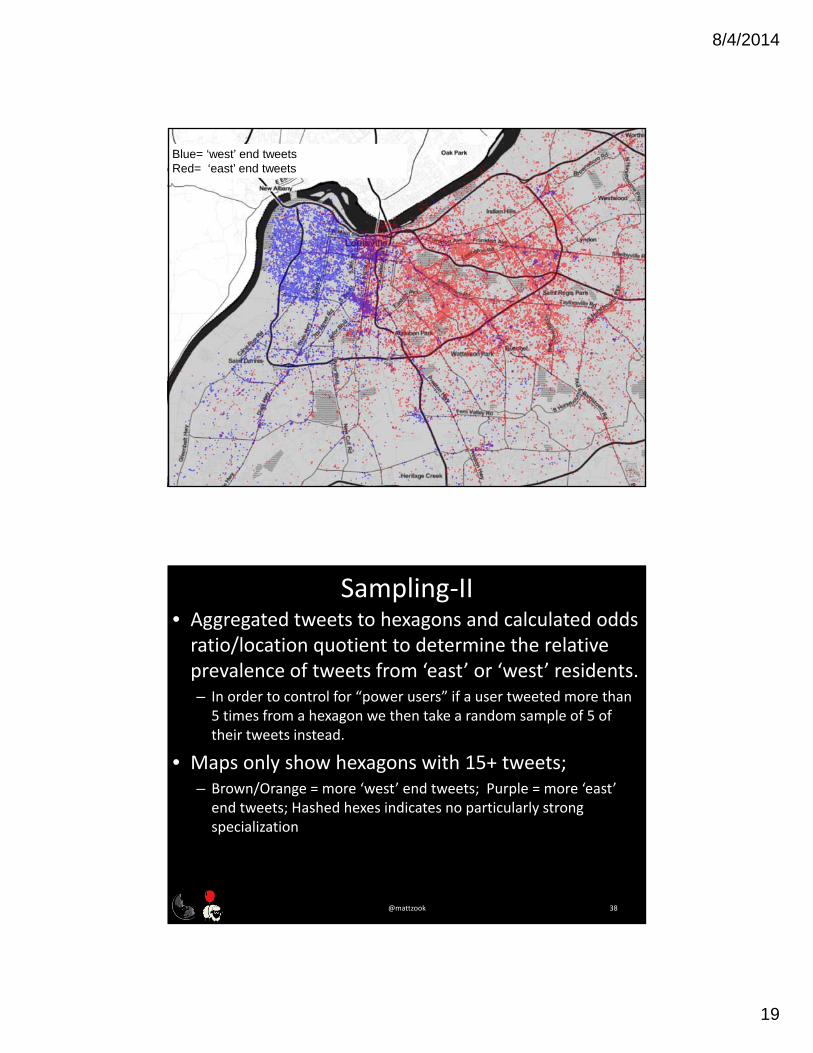
Blue= ‘west’ end tweetsRed= ‘east’ end tweets
Sampling‐II• Aggregated tweets to hexagons and calculated odds ratio/location quotient to determine the relative prevalence of tweets from ‘east’ or ‘west’ residents.– In order to control for “power users” if a user tweeted more than 5 times from a hexagon we then take a random sample of 5 of their tweets instead.
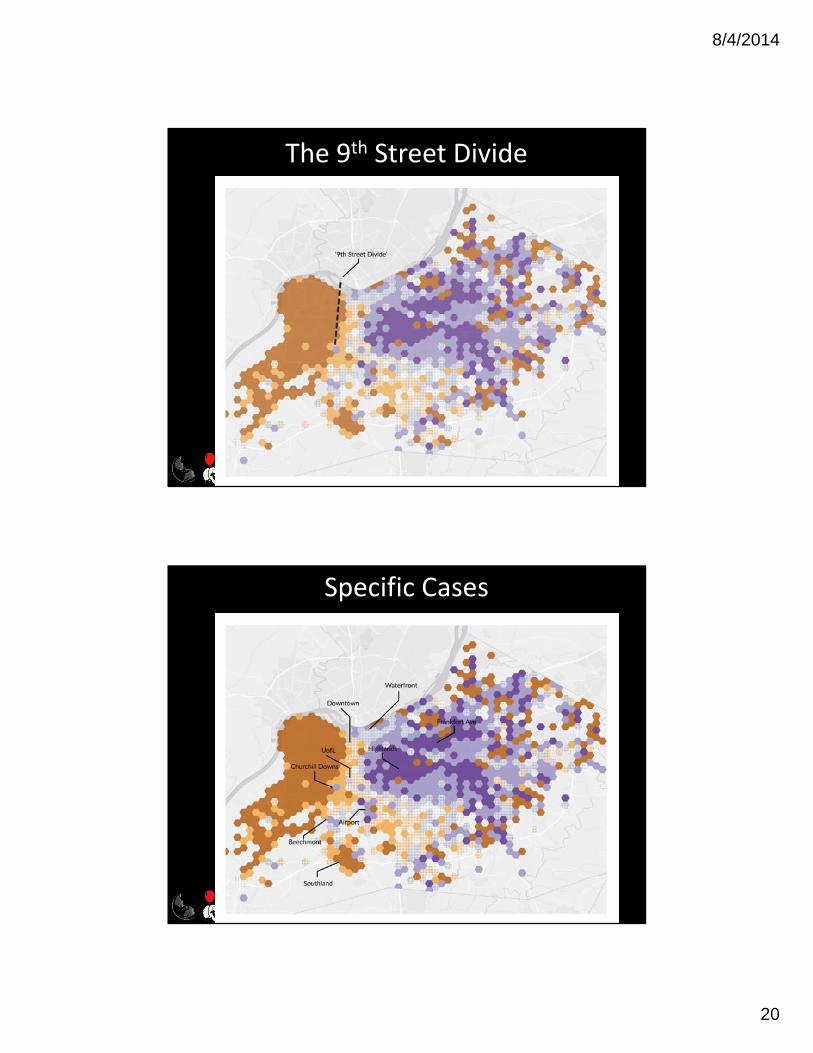
• Maps only show hexagons with 15+ tweets; – Brown/Orange = more ‘west’ end tweets; Purple = more ‘east’ end tweets; Hashed hexes indicates no particularly strong specialization
@mattzook 38
8/4/2014
20
The 9th Street Divide
@mattzook 39
@mattzook 40
Specific Cases

8/4/2014
21
How can we deal with bias in geoocial media? Whose voice?
What is measured?
@mattzook
Hurricane Sandy October 2012
Shelton, Poorthuis, Graham and Zook. 2014. Geoforum
8/4/2014
22
Hurricane Sandy October 2012
Shelton, Poorthuis, Graham and Zook. 2014. Geoforum
44
Crowdsourcing Cities
8/4/2014
23
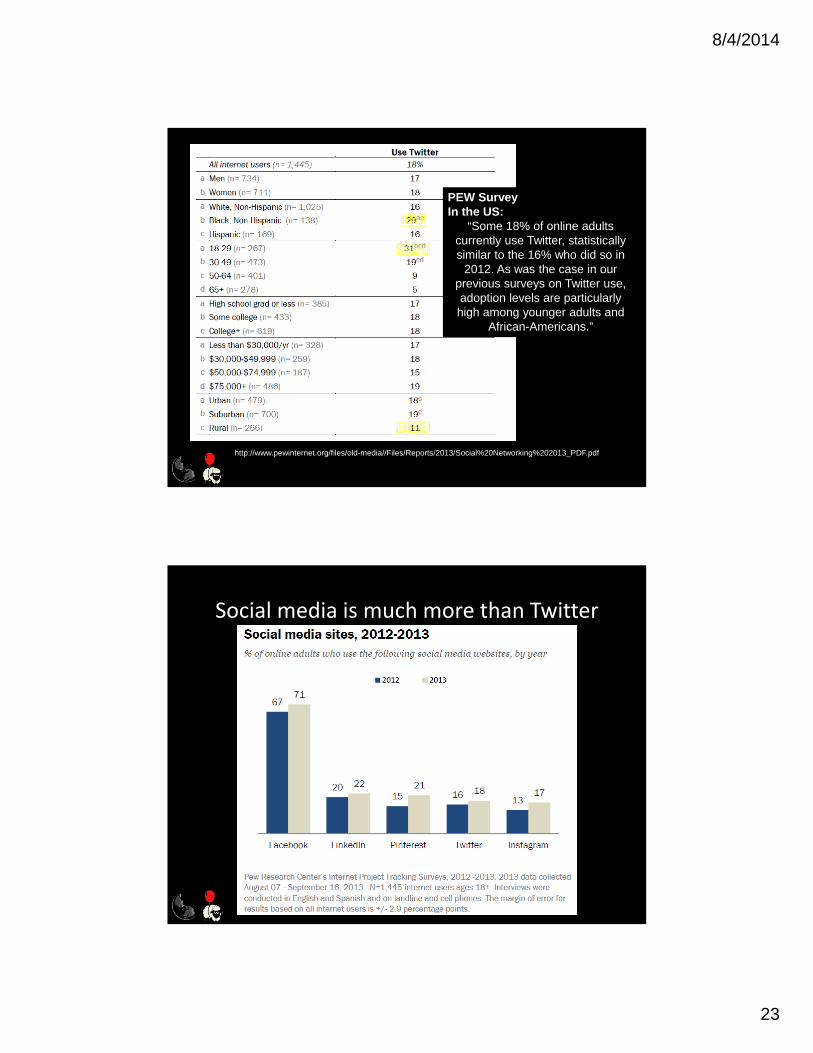
PEW SurveyIn the US:
“Some 18% of online adults currently use Twitter, statistically similar to the 16% who did so in
2012. As was the case in our previous surveys on Twitter use, adoption levels are particularly high among younger adults and
African-Americans.”
http://www.pewinternet.org/files/old-media//Files/Reports/2013/Social%20Networking%202013_PDF.pdf
Social media is much more than Twitter
8/4/2014
24
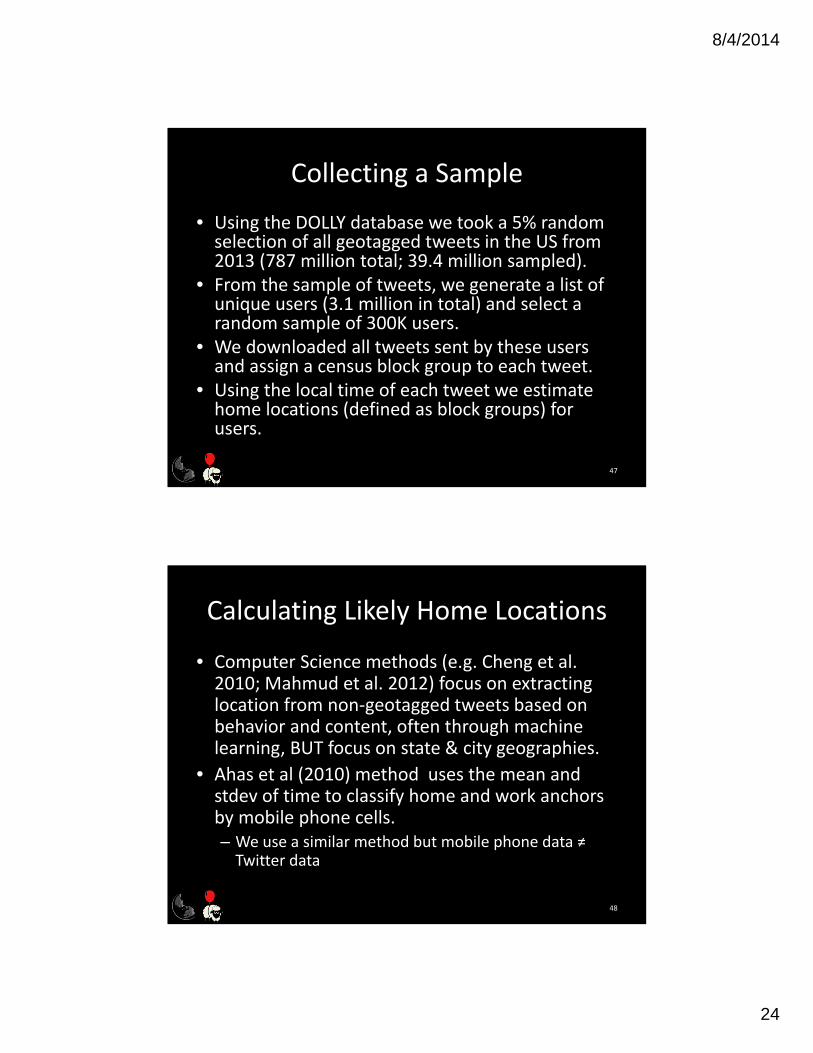
Collecting a Sample
• Using the DOLLY database we took a 5% random selection of all geotagged tweets in the US from 2013 (787 million total; 39.4 million sampled).
• From the sample of tweets, we generate a list of unique users (3.1 million in total) and select a random sample of 300K users.
• We downloaded all tweets sent by these users and assign a census block group to each tweet.
• Using the local time of each tweet we estimate home locations (defined as block groups) for users.
47
Calculating Likely Home Locations
• Computer Science methods (e.g. Cheng et al. 2010; Mahmud et al. 2012) focus on extracting location from non‐geotagged tweets based on behavior and content, often through machine learning, BUT focus on state & city geographies.
• Ahas et al (2010) method uses the mean and stdev of time to classify home and work anchors by mobile phone cells.– We use a similar method but mobile phone data ≠ Twitter data
48
8/4/2014
25
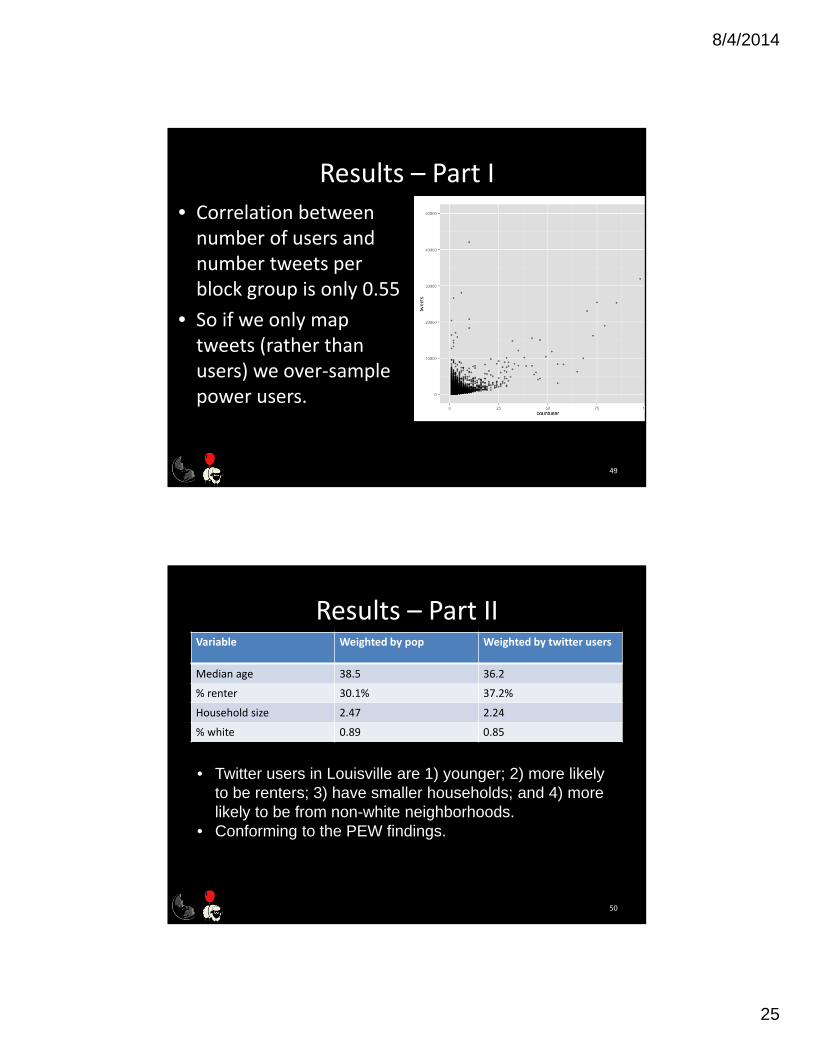
Results – Part I
• Correlation between number of users and number tweets per block group is only 0.55
• So if we only map tweets (rather than users) we over‐sample power users.
49
Results – Part IIVariable Weighted by pop Weighted by twitter users
Median age 38.5 36.2
% renter 30.1% 37.2%
Household size 2.47 2.24
% white 0.89 0.85
• Twitter users in Louisville are 1) younger; 2) more likely to be renters; 3) have smaller households; and 4) more likely to be from non-white neighborhoods.
• Conforming to the PEW findings.
50
8/4/2014
26
Big Data & Society: Critical Interdisciplinary Inquiries
http://bds.sagepub.com/
Big Data & Society is an open access, digital-only, peer-reviewed scholarly journal that publishes interdisciplinary work principally in the social sciences, humanities and computing and their intersections with the arts and natural sciences about the implications of Big Data for societies.
The Journal's key purpose is to provide a space for connecting debates about the emerging field of Big Data practices and how they are reconfiguring academic, social, industry, business and government relations, expertise, methods, concepts and knowledge.
BD&S seeks contributions that analyse Big Data practices and/or involve empirical engagements and experiments with innovative methods while also reflecting on the consequences for how societies are represented (epistemologies), realised (ontologies) and governed (politics).
52
Crampton, Jeremy W., Mark Graham, Ate Poorthuis, Taylor Shelton, Monica Stephens, Matthew W. Wilson, and Matthew A. Zook. 2013. Beyond the geotag: situating 'big data' and leveraging the potential of the geoweb. Cartography and Geographic Information Science 40 (2):130‐139.
Graham, M, Zook, M. and A. Boulton. 2013. Augmented Reality in the Urban Environment: Distorted Mirrors and Imagined Reflections. Transactions of the Institute of British Geographers. Vol. 38(3), 464–479. DOI: 10.1111/j.1475‐5661.2012.00539.x
Poorthuis, Ate and M. Zook.2014. Artists and Bankers and Hipsters, Oh My! Mapping Tweets in the New York Metropolitan Region. Cityscape. Forthcoming
Shelton, T., Poorthuis, A., Graham, M. and M. Zook. 2014. Mapping the Data Shadows of Hurricane Sandy: Uncovering the Sociospatial Dimensions of ‘Big Data’. Geoforum. http://dx.doi.org/10.1016/j.geoforum.2014.01.006
Zook, M., Graham, M, and A. Boulton. 2014. Crowd‐Sourced Augmented Realities: Social Media and the Power of Digital Representation. Chapter in S. Mains, J. Cupples, and C. Lukinbeal. Mediated Geographies/Geographies of Media. Springer Science International Handbooks in Human Geography.
[email protected]@mattzook
floatingsheep.org@floating_sheep