Zone 6 Of the Delaware River PCB TMDL - New Jersey · 2016-07-27 · Richard W. Greene is...
59
U.S. ENVIRONMENTAL PROTECTION AGENCY REGIONS II AND III TOTAL MAXIMUM DAILY LOAD FOR POLYCHLORINATED BIPHENYLS (PCBs) FOR ZONE 6 OF THE DELAWARE RIVER Signed 12/11/2006 ________________ ______________ Walter E. Mugdan Date Director Division of Environmental Planning and Protection EPA Region II Signed 12/14/2006 _____________ ___________ Jon M. Capacasa Date Director Water Protection Division EPA Region III Prepared by the DELAWARE RIVER BASIN COMMISSION WEST TRENTON, NJ December 2006
Transcript of Zone 6 Of the Delaware River PCB TMDL - New Jersey · 2016-07-27 · Richard W. Greene is...
U.S. ENVIRONMENTAL PROTECTION AGENCYREGIONS II AND III
TOTAL MAXIMUM DAILY LOAD FORPOLYCHLORINATED BIPHENYLS (PCBs)FOR ZONE 6 OF THE DELAWARE RIVER
Signed 12/11/2006________________ ______________Walter E. Mugdan DateDirectorDivision of Environmental Planning
and Protection EPA Region II
Signed 12/14/2006
_____________ ___________Jon M. Capacasa DateDirectorWater Protection DivisionEPA Region III
Prepared by theDELAWARE RIVER BASIN COMMISSION
WEST TRENTON, NJ
December 2006
TOTAL MAXIMUM DAILY LOAD FORPOLYCHLORINATED BIPHENYLS (PCBs)FOR ZONE 6 OF THE DELAWARE RIVER
DELAWARE RIVER BASIN COMMISSIONWEST TRENTON, NEW JERSEY
December 2006
Authority
This TMDL is established by the U.S. Environmental Protection Agency under the authority ofSection 303(d) of the Clean Water Act, 33 U.S.C. § 1251 et seq., and in accordance with EPA’simplementing regulations, 40 C.F.R., § 130.
Acknowledgments
This report was prepared by the Delaware River Basin Commission staff: Carol R. Collier,Executive Director. Dr. Namsoo Suk and Dr. Thomas J. Fikslin were the principal authors of thereport. Gregory Cavallo and John Yagecic of the Modeling & Monitoring Branch alsocontributed to this report. Dr. Suk is a Water Resources Engineer/Modeler in the Modeling &Monitoring Branch. Dr. Fikslin is the Head of the Commission’s Modeling & MonitoringBranch.
Richard W. Greene is gratefully acknowledged for his efforts in summarizing fish tissue data forPCBs, and for providing Figures 2 through 4 of the report. Technical recommendations fordeveloping Stage 1 TMDLs were provided by the Commission’s Toxic Advisory Committee andits TMDL Policies and Procedures Subcommittee.
Special acknowledgment is made to the following organizations for their support in developmentof the report and the studies leading up to it:
Delaware Department of Natural Resources & Environmental Control New Jersey Department of Environmental ProtectionPennsylvania Department of Environmental ProtectionU.S. Environmental Protection Agency, Region IIU.S. Environmental Protection Agency, Region IIIRutgers UniversityLimno-Tech, Inc.
Suggested Citation
Suk, N.S. and T.J. Fikslin. 2006. Total Maximum Daily Load for Polychlorinated Biphenyls(PCBs) for Zone 6 of the Delaware River. Delaware River Basin Commission. West Trenton,NJ. December 2006.
EXECUTIVE SUMMARY
On behalf of the states of Delaware and New Jersey, and in cooperation with the Delaware RiverBasin Commission (DRBC), the United States Environmental Protection Agency Regions II andIII (EPA) has developed a total maximum daily load (TMDL) for polychlorinated biphenyls(PCBs) from the head of the Delaware Bay at Liston Point to the mouth of the Bay at CapeHenlopen to Cape May. This area is also referred to as Delaware River Basin Commission WaterQuality Management Zone 6. EPA establishes this TMDL in order to achieve and maintain theapplicable water quality criteria for PCBs designed to protect human health from the carcinogeniceffects of eating the contaminated fish now found in the Delaware Estuary and Bay. Inaccordance with Section 303(d) of the Clean Water Act (CWA) and its implementing regulations,this TMDL provides allocations to point sources (WLAs) discharging PCBs as well as allocationsto nonpoint sources (LAs) of PCBs, and an explicit margin of safety to account for uncertainties. This TMDL meets all of the current federal regulatory requirements of a TMDL established underthe Clean Water Act. This TMDL report and its appendices set forth the basis for the TMDL and allocations, anddiscuss follow up strategies that will be necessary to achieve these substantial reductions ofPCBs. EPA will continue to work with the Commission and the States as they develop enhancedStage 2 PCB TMDLs for the entire Delaware Estuary (also referred to as Delaware River BasinCommission Water Quality Management Zones 2 through 6) based on information to be collectedand analyzed over the next several years. While EPA acknowledges that implementation of theseTMDLs will be difficult and may take decades to fully achieve, the establishment of theseTMDLs sets forth a framework and specific goals to protect human health and restore theDelaware River from the effects of PCB pollution.
Listing under Section 303(d) of the Clean Water Act
The Delaware Department of Natural Resources & Environmental Control (DNREC) first listedZones 5 and 6 of the Delaware River as impaired for toxics on the state's 1996 Section 303(d)List. In 1998, DNREC again listed Zone 5 of the Delaware River, but specifically listed PCBs asa pollutant contributing to the impairment. In Attachment B to a Memorandum of Agreement(MOA) between the Delaware Department of Natural Resources & Environmental Control andthe U.S. Environmental Protection Agency, Region III dated July 25, 1997, DNREC agreed tocomplete the TMDL for Zone 6 by December 31, 2006 provided that funding and certain otherconditions were met. In a Consent Decree between the American Littoral Society, the SierraClub, and the U.S. Environmental Protection Agency dated July 31, 1997, the U.S. EPA agreed toestablish all TMDLs by December 15 of the year following the state's deadline provided that allTMDLs be established by December 15, 2006. In June 2005, New Jersey listed all of DelawareBay and the tidal portions of tributaries to Delaware Bay (i.e., Zone 6) as impaired by PCBs ontheir 2004 Integrated List of Waterbodies.
Basis for TMDL
TMDLs must be based upon the water quality criteria and the designated uses for the water bodythat was listed under Section 303(d). In the Delaware River Basin, applicable water quality
-ii-
criteria and uses have been adopted in regulation by the states bordering the river as well as theDelaware River Basin Commission. The DRBC does not have specific numerical criteria fortoxic pollutants including PCBs for Zone 6. Delaware adopted a numerical water quality criterionof 64 pg/l for Total PCBs in 2004. New Jersey currently has a state-wide numerical water qualitycriterion of 170 pg/l for Total PCBs that was adopted in January 2002. In September 2005, theNJDEP proposed a state-wide numerical water quality criterion of 64 pg/l for Total PCBs. TheTMDL presented in this report is based upon a water quality criterion of 64 pg/l for Total PCBs. The TMDL must, however, also ensure that the water quality of adjacent water bodies is met. Numerical water quality criteria to protect designated uses for toxic pollutants including TotalPCBs for Zones 2 through 5 of the Delaware River were adopted by the DRBC in October 1996. These criteria do, however, differ from the criterion adopted by Delaware and New Jersey. Human health criteria in Zones 4 and 5 are based solely upon exposure to PCBs through ingestionof fish taken from these estuary zones. The water quality regulations of both Delaware and NewJersey specify that criteria formally adopted by the DRBC are the applicable criteria for thatportion of the Delaware River. DRBC criteria for Zones 4 and 5 are more stringent, and must beconsidered in developing the TMDL.
In January 2006, the Commission's Executive Director requested the concurrence of the U.S.Environmental Protection Agency Regions II and III that the existing human health water qualitycriteria namely: 64 pg/l in Zone 6, 7.9 pg/l in lower Zone 5 and 44.8 pg/l in upper Zone 5 and allof Zone 4 should be the basis for the Zone 6 TMDL. In a letter received on February 21, 2006,both U.S. EPA regional offices concurred with this approach.
TMDL Approach
The complexity of a TMDL for a class of compounds such as PCBs, the limited time imposed bythe MOA and Consent Decree, the limited data available, and the benefits of refining it throughtime with more data led to a decision to develop the TMDL for PCBs in two stages consistentwith EPA TMDL guidance. A staged approach provides for adaptive implementation throughexecution of load reduction strategies while additional monitoring and modeling efforts proceedin order to refine the wasteload and load allocations. The approach recognizes that additionalmonitoring data and modeling results will be available following issuance of this Stage 1 TMDLto enable a more refined analysis to form the basis of the Stage 2 TMDL. This staged approach toestablishing TMDLs will be utilized for the Zone 6 TMDL as it was for the Stage 1 TMDLs forZones 2 - 5.
In essence, the Zone 6 TMDL is an extension of the Stage 1 TMDLs developed for Zones 2 - 5. Due to the tidal nature of this portion of the Delaware River, the influence of Zone 6 on theupriver zones had to be considered in the development of the Zones 2 - 5 TMDLs. Similarly inthis TMDL, Zones 2 - 5 have a significant influence on the PCB concentrations in Zone 6 andmust be considered. The Zone 6 TMDL also needed to be staged due to the lack of any PCB dataon point sources as well as tributaries to Delaware Bay, the need to collect additional ambientdata in Delaware Bay, and the need for modifications to the penta-PCB water quality model tobetter describe the processes occurring in the estuarine turbidity maximum (ETM). Other planned
-iii-
enhancements include specification of sediment PCB concentrations based upon additionalsediment data and assignment of segment-specific gaseous air concentrations.
Wasteload allocations for individual discharges to Zone 6 were developed using a simplifiedmethodology, which still met all of the current regulatory requirements for establishing a TMDL. A number of key guiding principles were utilized in developing the TMDL and allocations. These principles were based on available scientific data, model simulation results, and policydecisions. The guiding principles are as follows:
1. The Stage 1 TMDL for Zone 6 (Delaware Bay) is built upon TMDLs developed for Zones2 to 5 in 2003.
2. Pentachlorobiphenyls, the penta-PCB homolog group, are used as a surrogate for TotalPCBs. The same ratio used in development of the Zones 2 to 5 TMDLs in 2003, 1:4 forpenta to total PCBs, is used in this TMDL.
3. Preliminary model simulations revealed that there are two potential critical locations thatcontrol the loading of PCBs to Zone 6. One location is at River Mile 68.75, the locationof Delaware Memorial Bridge, where the applicable water quality criteria changes from44.8 to 7.9 pg/L . The other location is at the boundary of Zone 5 and 6 (River Mile 48.2)where the applicable water quality criteria changes from 7.9 to 64 pg/L in an upstream todownstream direction. Allowable loadings of PCBs to Zone 6 or from the downstreamboundary will be determined while focusing on violations at those two locations
4. All WLAs and LAs in Zone 6 are allowed to discharge at the applicable water qualitycriterion of 64 picograms per liter of total PCBs. Since this Stage 1 TMDL for theDelaware Bay is limited to the mainstem of the Estuary not the individual tributaries, theinfluence from the WLAs and LAs are relatively minor compared to the influence fromthe upstream or the downstream boundaries (the Ocean) of Zone 6. .
5. As a policy decision, 5 percent of the TMDL is explicitly reserved for a margin of safety.This is consistent with the margin of safety used in the Zones 2 - 5 TMDLs.
TMDL Procedure
The TMDL for Total PCBs for Zone 6 of the Delaware Estuary is established using a seven stepprocedure. A brief description of each of the seven steps follows:
1 Using the revised model code and revised input conditions, re-confirm that the TMDLsdeveloped in 2003 are still valid. The governing criterion occurs at two locations, RiverMile 68.75 and River Mile 48.2, is 1.975 picograms per liter (pg/L). This value is 25% of7.9 pg/L, the water quality criterion for Total PCBs at these locations.
2. Determine the usable assimilative capacity for Stage 1 Zone 6 PCB TMDL at the two

-iv-
critical locations by assigning zero penta-PCBs at the ocean boundary, and for all pointand non-point sources to Zone 6. The difference between the simulation results andapplicable water quality target is the total assimilative capacity available for Zone 6.
3. Allowable loadings from all point and non-point sources having inflows into Zone 6 arethen calculated by multiplying their inflow by the applicable water quality target of 16pg/L for penta-PCBs. These loadings are distributed in the model proportional to themodel segment sizes in Zone 6. The only missing load will then be the influx from theocean boundary.
4. Determine the allowable ocean boundary by trial and error simulations using thepenta-PCB model, the re-confirmed TMDLs for Zones 2 to 5 developed in 2003 plus theZone 6 loads calculated from the previous step. Compare the results with the applicablewater quality target at the two critical locations.
5. Once the allowable ocean boundary is found, calculate and assign equilibrium gaseousatmospheric concentrations in the model. Run the model and go back to Step 4 until thedifference between the water quality target and the simulated water column penta PCBs isless than 0.02 pg/L.
6. Convert the ocean boundary concentration to a load and add it to the gross load allocationportion.
7. Reserve 5 percent of the wasteload allocation (WLA) and load allocation (LA) portionsfor a margin of safety.
Stage 1 TMDL for Zone 6
The Stage 1 TMDL for Total PCBs for Water Quality Management Zone 6 (the Delaware Bay)and its components are listed in the following table:
TMDL WLAs LAs MOS
Total PCBs 1876.45 mg/day 13.12 mg/day 1769.51 mg/day 93.82 mg/day
Percent of TMDL - 0.7% 94.3% 5.0%
The wasteload allocation portion of the TMDL represents those source categories that areregulated under the NPDES program (industrial discharges, municipal wastewater treatment plantdischarges, combined sewer overflows or CSOs, and municipal separate storm sewer systems orMS4s). Eight (8) industrial and municipal wastewater discharges are assigned wasteloadallocations in this TMDL. No CSOs were identified by state permitting authorities. 20 municipalseparate storm sewer systems or MS4s were included in the allocation for this point sourcecategory. The load allocation portion of the TMDL represents categories including contaminated
-v-
sites, non-NPDES regulated stormwater discharges, tributaries, air deposition and mostimportantly input from the Ocean.
Note that the load allocation portion of the TMDL is the largest portion of the TMDL due to therelatively large influence of the ocean on pollutant concentrations in the Bay. Despite this largeinfluence, the allocated loading from the ocean is equivalent to 14.5 picograms per liter (ppq)ofTotal PCBs rather than the applicable ocean water quality criterion of 64 pg/l. This is primarilyattributable to the need to meet the water quality criteria at the two critical locations in Zone 5. With the use of a uniform criterion for the entire estuary for the Stage 2 TMDLs for Zones 2 - 6,this issue should be resolved.
A Stage 2 TMDL, individual WLAs and LAs for Zone 6 will be developed concurrently withthose for Zones 2 - 5. They are targeted for development by December 31, 2008. Once the Stage2 TMDLs are finalized, EPA expects the WLAs developed in Stage 2 to replace the Stage 1WLAs. EPA expects the Stage 2 WLAs and LAs to be based on all of the monitoring dataobtained through the development of the Stage 2 TMDLs, and the additional modeling that willbe performed following the establishment of the Stage 1 TMDL. Stage 2 TMDLs will also bebased on the summation of those PCB homolog groups accumulated by resident fish and aquaticbiota, without the use of extrapolation. It is anticipated that the Stage 2 WLAs will be based upona more sophisticated allocation methodology than the Stage 1 WLAs, and will likely reflectapplication of the procedures set forth in the DRBC Water Quality Regulations.
Following establishment of the TMDL for Zone 6, the water quality-based effluent limitations(WQBELs) in NPDES permits that are issued, reissued or modified after the approval date mustbe consistent with the WLAs. The NPDES permitting authorities (i.e., U.S. EPA, DelawareDNREC and New Jersey DEP) believe that these WQBELs will include non-numeric controls inthe form of a best management practices (BMP) approach as the most appropriate way to identifyand control discharges of PCBs consistent with the Stage 1 WLAs. Federal regulations (40 CFRPart 122.44(k)(4)) allow the use of non-numeric, BMP-based WQBELs in permits. AppropriateNPDES permitting actions resulting from individual WLAs include 1) the use of Method 1668Afor any monitoring of the wastewater influent and effluent at a facility, 2) development of a PCBminimization plan, and 3) implementation of appropriate, cost-effective PCB minimizationmeasures identified through the plan. This approach is identical to the approach used inestablishing the TMDLs in Zones 2 - 5.
The identification of point source dischargers that are potentially significant sources of total PCBsis a dynamic process that depends on several factors including the availability and extent of PCBcongener data for each discharge, the detection limit of the method used to analyze for PCBcongeners, the flows used for each discharge, the procedure used to calculate the loadings, thelocation of the discharge in the estuary, and the proximity and loading of other sources of PCBs. EPA specifically requests comment on the list of significant point source dischargers contained inAppendix 1 during the public comment period.
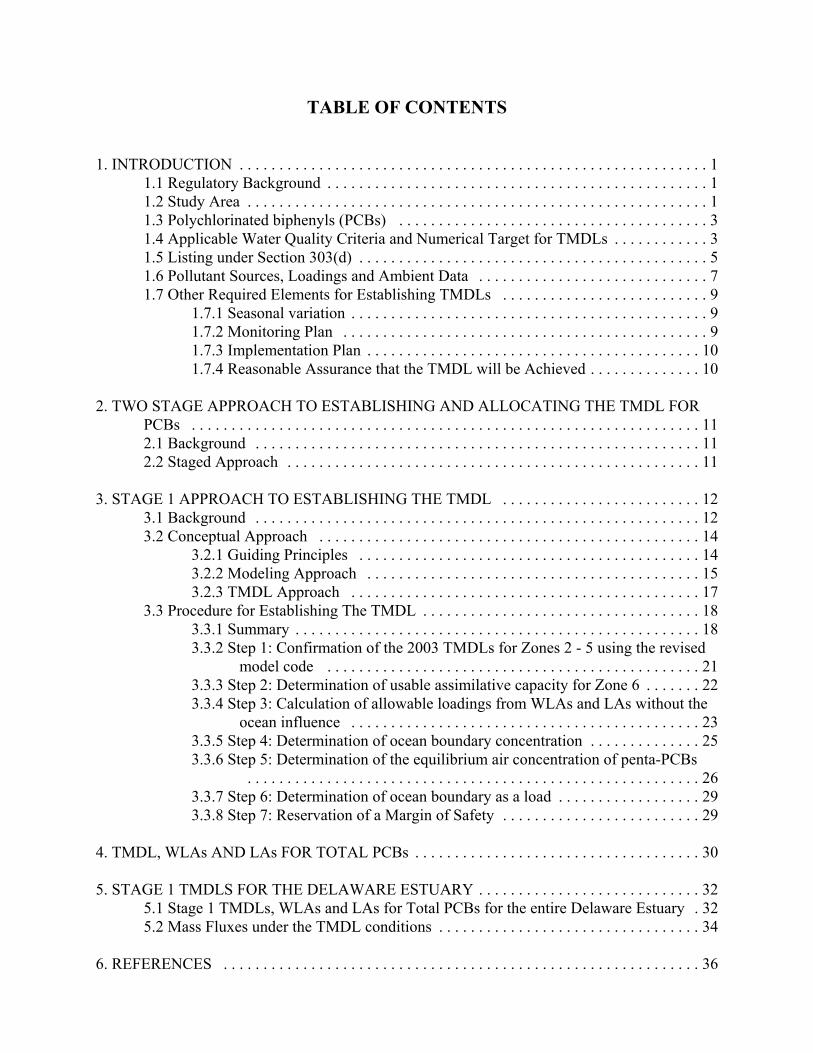
TABLE OF CONTENTS
1. INTRODUCTION . . . . . . . . . . . . . . . . . . . . . . . . . . . . . . . . . . . . . . . . . . . . . . . . . . . . . . . . . . . 11.1 Regulatory Background . . . . . . . . . . . . . . . . . . . . . . . . . . . . . . . . . . . . . . . . . . . . . . . . 11.2 Study Area . . . . . . . . . . . . . . . . . . . . . . . . . . . . . . . . . . . . . . . . . . . . . . . . . . . . . . . . . . 11.3 Polychlorinated biphenyls (PCBs) . . . . . . . . . . . . . . . . . . . . . . . . . . . . . . . . . . . . . . . 31.4 Applicable Water Quality Criteria and Numerical Target for TMDLs . . . . . . . . . . . . 31.5 Listing under Section 303(d) . . . . . . . . . . . . . . . . . . . . . . . . . . . . . . . . . . . . . . . . . . . . 51.6 Pollutant Sources, Loadings and Ambient Data . . . . . . . . . . . . . . . . . . . . . . . . . . . . . 71.7 Other Required Elements for Establishing TMDLs . . . . . . . . . . . . . . . . . . . . . . . . . . 9
1.7.1 Seasonal variation . . . . . . . . . . . . . . . . . . . . . . . . . . . . . . . . . . . . . . . . . . . . . 91.7.2 Monitoring Plan . . . . . . . . . . . . . . . . . . . . . . . . . . . . . . . . . . . . . . . . . . . . . . 91.7.3 Implementation Plan . . . . . . . . . . . . . . . . . . . . . . . . . . . . . . . . . . . . . . . . . . 101.7.4 Reasonable Assurance that the TMDL will be Achieved . . . . . . . . . . . . . . 10
2. TWO STAGE APPROACH TO ESTABLISHING AND ALLOCATING THE TMDL FORPCBs . . . . . . . . . . . . . . . . . . . . . . . . . . . . . . . . . . . . . . . . . . . . . . . . . . . . . . . . . . . . . . . . 112.1 Background . . . . . . . . . . . . . . . . . . . . . . . . . . . . . . . . . . . . . . . . . . . . . . . . . . . . . . . . 112.2 Staged Approach . . . . . . . . . . . . . . . . . . . . . . . . . . . . . . . . . . . . . . . . . . . . . . . . . . . . 11
3. STAGE 1 APPROACH TO ESTABLISHING THE TMDL . . . . . . . . . . . . . . . . . . . . . . . . . 123.1 Background . . . . . . . . . . . . . . . . . . . . . . . . . . . . . . . . . . . . . . . . . . . . . . . . . . . . . . . . 123.2 Conceptual Approach . . . . . . . . . . . . . . . . . . . . . . . . . . . . . . . . . . . . . . . . . . . . . . . . 14
3.2.1 Guiding Principles . . . . . . . . . . . . . . . . . . . . . . . . . . . . . . . . . . . . . . . . . . . 143.2.2 Modeling Approach . . . . . . . . . . . . . . . . . . . . . . . . . . . . . . . . . . . . . . . . . . 153.2.3 TMDL Approach . . . . . . . . . . . . . . . . . . . . . . . . . . . . . . . . . . . . . . . . . . . . 17
3.3 Procedure for Establishing The TMDL . . . . . . . . . . . . . . . . . . . . . . . . . . . . . . . . . . . 183.3.1 Summary . . . . . . . . . . . . . . . . . . . . . . . . . . . . . . . . . . . . . . . . . . . . . . . . . . . 183.3.2 Step 1: Confirmation of the 2003 TMDLs for Zones 2 - 5 using the revised
model code . . . . . . . . . . . . . . . . . . . . . . . . . . . . . . . . . . . . . . . . . . . . . . . 213.3.3 Step 2: Determination of usable assimilative capacity for Zone 6 . . . . . . . 223.3.4 Step 3: Calculation of allowable loadings from WLAs and LAs without the
ocean influence . . . . . . . . . . . . . . . . . . . . . . . . . . . . . . . . . . . . . . . . . . . . 233.3.5 Step 4: Determination of ocean boundary concentration . . . . . . . . . . . . . . 253.3.6 Step 5: Determination of the equilibrium air concentration of penta-PCBs
. . . . . . . . . . . . . . . . . . . . . . . . . . . . . . . . . . . . . . . . . . . . . . . . . . . . . . . . . 263.3.7 Step 6: Determination of ocean boundary as a load . . . . . . . . . . . . . . . . . . 293.3.8 Step 7: Reservation of a Margin of Safety . . . . . . . . . . . . . . . . . . . . . . . . . 29
4. TMDL, WLAs AND LAs FOR TOTAL PCBs . . . . . . . . . . . . . . . . . . . . . . . . . . . . . . . . . . . . 30
5. STAGE 1 TMDLS FOR THE DELAWARE ESTUARY . . . . . . . . . . . . . . . . . . . . . . . . . . . . 325.1 Stage 1 TMDLs, WLAs and LAs for Total PCBs for the entire Delaware Estuary . 325.2 Mass Fluxes under the TMDL conditions . . . . . . . . . . . . . . . . . . . . . . . . . . . . . . . . . 34
6. REFERENCES . . . . . . . . . . . . . . . . . . . . . . . . . . . . . . . . . . . . . . . . . . . . . . . . . . . . . . . . . . . . 36
APPENDICES
Appendix 1 - Point source discharges included in the WLAs for penta-PCBs for the Zone 6 TMDL
Appendix 2 - Wasteload Allocation Estimates for Municipal Separate Storm Sewer Systems (MS4s) inWatersheds in Delaware and New Jersey that Drain to Zone 6
Appendix 3 - Summary of mass flux exchanges for penta-PCBs and Total PCBs for Zones 2 to 6 underthe TMDL conditions
LIST OF TABLES
Table 1: Applicable Water Quality Criteria for PCBs for Zones 4 to 6 of the Delaware Estuary . 4
Table 2: TMDL for penta-PCBs for Zone 6 (Delaware Bay) in milligrams per day. . . . . . . . . . 30
Table 3: Apportionment of the TMDL for penta-PCBs and Total PCBs for Zone 6 in milligramsper day. . . . . . . . . . . . . . . . . . . . . . . . . . . . . . . . . . . . . . . . . . . . . . . . . . . . . . . . . . . . . . 30
Table 4: Calculation of individual wasteload allocations (WLAs) for Total PCBs for point sourceswith 5 percent reserved for a MOS. . . . . . . . . . . . . . . . . . . . . . . . . . . . . . . . . . . . . . . . . 31
Table 5: TMDLs, WLAs, LAs and MOS for Total PCBs for the entire Delaware Estuary . . . . . 33
LIST OF FIGURES
Figure1: Water Quality Management Zones of the Delaware River. . . . . . . . . . . . . . . . . . . . . . . . 2
Figure 2: PCB concentrations in fillet samples of striped bass from Zones 5 and 6 of the DelawareEstuary from 1988 to 2004. Units are in parts per billion (ppb) or micrograms perkilogram wet weight of fillet. The range of values (minimum to maximum) is indicatedby the full extent of the whiskers which extent from the ends of the boxes. The boxencloses the 25th and 75th percentile. The line indicates the median and the red plus signindicates the mean. Graphs provided by Richard Greene, Delaware DNREC. . . . . . . 5
Figure 3: PCB concentrations in fillet samples of white perch from Zones 2 through 6 of theDelaware Estuary from 1969 to 2002. Units are in parts per billion (ppb)or microgramsper kilogram wet weight of fillet. Bars indicate the mean value. Lines represent thestandard error of the mean. Graphs provided by Richard Greene, Delaware DNREC. . 6
Figure 4: PCB concentrations in fillet samples of weakfish from Zone 6 of the Delaware Estuaryfrom 1978 to 2004. Units are in parts per billion (ppb)or micrograms per kilogram wetweigh of fillet. Graphs provided by Richard Greene, Delaware DNREC. . . . . . . . . . . . 7
Figure 5: Concentrations of 124 PCB congeners at 5 locations in Zone 6 of the Delaware Estuaryduring varying flow conditions. . . . . . . . . . . . . . . . . . . . . . . . . . . . . . . . . . . . . . . . . . . . . 8
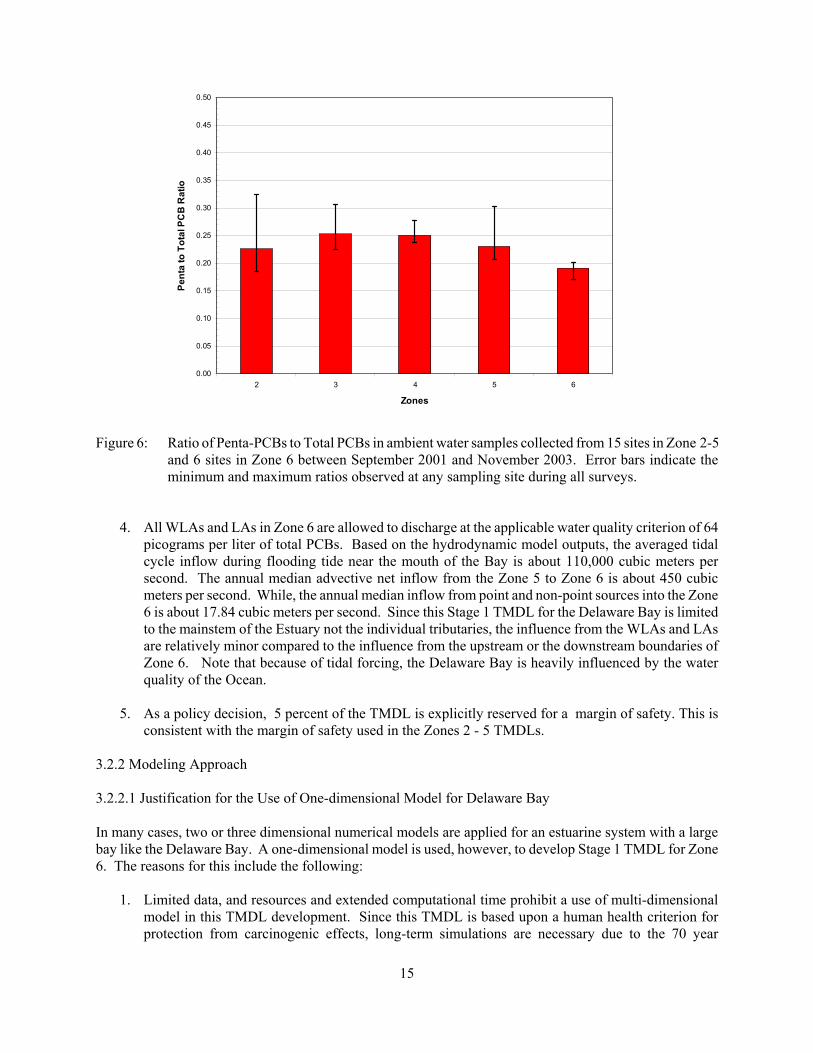
Figure 6: Ratio of Penta-PCBs to Total PCBs in ambient water samples collected from 15 sites inZone 2-5 and 6 sites in Zone 6 between September 2001 and November 2003. Error barsindicate the minimum and maximum ratios observed at any sampling site during allsurveys. . . . . . . . . . . . . . . . . . . . . . . . . . . . . . . . . . . . . . . . . . . . . . . . . . . . . . . . . . . . . . 15
Figure 7: Exemplary simulation showing two potential critical locations at River mile 48 and 68because of sharp transition of the applicable water quality criteria in Zone 6 TMDLDevelopment. . . . . . . . . . . . . . . . . . . . . . . . . . . . . . . . . . . . . . . . . . . . . . . . . . . . . . . . . . 16
Figure 8: Seven Step Procedure for Establishing TMDL for Zone 6. . . . . . . . . . . . . . . . . . . . . . . 20
Figure 9: Comparison and validation of Zones 2 to 5 TMDLs established in 2003 using the revisedDELPCB model code and input conditions (full Y-axis scale). Blue and red solid linesshow median water column Penta-PCBs concentrations from the 99th and 100th year ofthe simulation using the old and revised code. . . . . . . . . . . . . . . . . . . . . . . . . . . . . . . . 21
Figure 10: Comparison and validation of Zones 2 to 5 TMDLs established in 2003 using the revisedDELPCB model code and input conditions (smaller range in Y-axis scale). Blue and redsolid lines show median water column Penta-PCBs concentrations from 99th and 100thyear of the simulation using the old and revised code. . . . . . . . . . . . . . . . . . . . . . . . . . 22
Figure 11: 100 year simulation results under the Zones 2 to 5 TMDLs with zero penta-PCBconcentration for the ocean boundary. The solid green line represents median values for99th and 100th year. . . . . . . . . . . . . . . . . . . . . . . . . . . . . . . . . . . . . . . . . . . . . . . . . . . . . 23
Figure 12: Allowable loadings for point and non-point sources in mg/day for the Delaware Bayexcluding influences from the ocean without 5 percent of MOS reservation. . . . . . . . . 24

Figure 13: Simulation results under the loading conditions developed up to Step 3 and assignedocean boundary at the penta-PCB water quality target of 16pg/L. . . . . . . . . . . . . . . . . 25
Figure 14: Yearly, back calculated, equilibrium, gas phase penta-PCB concentration for DelawareBay. . . . . . . . . . . . . . . . . . . . . . . . . . . . . . . . . . . . . . . . . . . . . . . . . . . . . . . . . . . . . . . . . 26
Figure 15: Equilibrium, carbon normalized sediment penta-PCB concentrations after 200yearsimulation. . . . . . . . . . . . . . . . . . . . . . . . . . . . . . . . . . . . . . . . . . . . . . . . . . . . . . . . . . . . 27
Figure 16: Simulation results after the Step 5 of the TMDL development process. The lower figureis an expansion of the upper figure with a finer scale for the penta-PCB concentration.. . . . . . . . . . . . . . . . . . . . . . . . . . . . . . . . . . . . . . . . . . . . . . . . . . . . . . . . . . . . . . . . . . . . 28
Figure 17: Stage 1 TMDL for Total PCBs for the entire Delaware Estuary . . . . . . . . . . . . . . . . . . 33
Figure 18: Comparison of 100 year simulation results under Stage - 1 PCB TMDLs developed in2003 and 2006. . . . . . . . . . . . . . . . . . . . . . . . . . . . . . . . . . . . . . . . . . . . . . . . . . . . . . . . . 34

1
1. INTRODUCTION
1.1 Regulatory Background
Total Maximum Daily Loads or TMDLs are one of the approaches defined in the Clean Water Act (CWA)for addressing water pollution. The first approach of the CWA that was implemented by the U.S. EPA wasthe technology-based approach to controlling pollutants (Section 301). This approach was implemented inthe mid-1970s through the issuance of permits authorized under Section 402 of the Act. The approachspecified minimum levels of treatment for sanitary sewage and for various categories of industries. The otherwater quality-based approach was implemented in the 1980s. This approach includes water quality-basedpermitting and planning to ensure that standards of water quality established by States are achieved andmaintained.
Section 303(d) of the Act establishes TMDLs as one of the tools to address those situations where thetechnology-based controls are not sufficient to meet applicable water quality standards for a water body (U.S.EPA, 1991). They are defined as the maximum amount of a pollutant that can be assimilated by a water bodywithout causing the applicable water quality criteria to be exceeded. The basis of a TMDL is thus the waterquality criteria to protect the designated uses of the waterbody. The designated uses for which criteria maybe established include the protection of aquatic life, human health through ingestion of drinking water orresident fish, or wildlife. Under Section 303(d), States are required to identify, establish a priority ranking,and to develop TMDLs for those waters that do not achieve or are not expected to achieve water qualitycriteria approved by the U.S. EPA. Federal regulations implementing Section 303(d) of the Clean Water Actprovide that a TMDL must be expressed as the sum of the individual wasteload allocations for point sources(WLA) plus the load allocation for non-point sources (LA) plus a margin of safety (MOS). This definitionmay be expressed as the equation:
TMDL = WLA + LA + MOS
This TMDL meets all of the current federal regulatory requirements of a TMDL established under the CleanWater Act.
1.2 Study Area
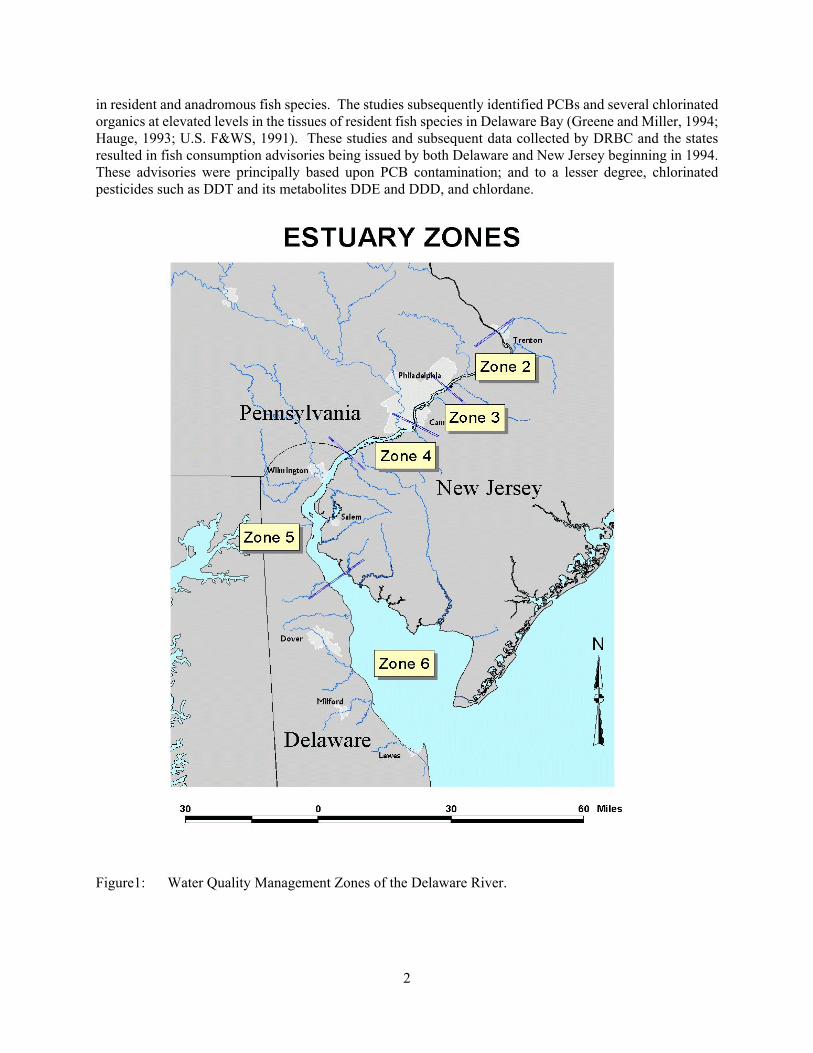
Water Quality Management Zone 6 of the Delaware River (Figure 1) has been designated by the DelawareRiver Basin Commission as that section of the mainstem of the Delaware River including the tidal portionsof the tributaries thereto, between the head of Delaware Bay at Liston Point (River Mile 48.2) and the mouthof Delaware Bay between Cape Henlopen and Cape May (River Mile 0.0). Zone 6 is bordered by the Statesof Delaware and New Jersey.
In 1989, the Delaware River Basin Commission created the Estuary Toxics Management Program to addressthe impact of toxic pollutants in the tidal Delaware River. By 1993, Commission staff identified severalclasses of pollutants and specific chemicals that were likely to exceed water quality criteria currently beingdeveloped under the program for Zones 2 through 5 of the Delaware River (Figure 1). These includedpolychlorinated biphenyls (PCBs), volatile organics, metals, chlorinated pesticides, chronic toxicity and acutetoxicity. While this program did not specifically address Zone 6, oyster tissue data collected under NOAA’sStatus and Trends Program indicated that a number of these pollutants, including PCBs, were beingtransported into Zone 6 from upstream sources (NOAA, 1989).
Beginning in the late 1980's, concern regarding the possible contamination of fish populations that wererebounding as dissolved oxygen levels improved resulted in a number of investigations of contaminant levels
2
in resident and anadromous fish species. The studies subsequently identified PCBs and several chlorinatedorganics at elevated levels in the tissues of resident fish species in Delaware Bay (Greene and Miller, 1994;Hauge, 1993; U.S. F&WS, 1991). These studies and subsequent data collected by DRBC and the statesresulted in fish consumption advisories being issued by both Delaware and New Jersey beginning in 1994.These advisories were principally based upon PCB contamination; and to a lesser degree, chlorinatedpesticides such as DDT and its metabolites DDE and DDD, and chlordane.
Figure1: Water Quality Management Zones of the Delaware River.

3
1.3 Polychlorinated biphenyls (PCBs)
Polychlorinated biphenyls (PCBs) are a class of man-made compounds that were manufactured and usedextensively in electrical equipment such as transformers and capacitors, paints, printing inks, pesticides,hydraulic fluids and lubricants. Individual PCB compounds called congeners can have up to 10 chlorineatoms on a basic structure consisting of two connected rings of six carbon atoms each. There are 209 possiblepatterns where chlorine atoms can be substituted on this ring structure resulting in 209 possible PCBcompounds. PCB compounds can be grouped by the number of chlorine atoms attached to the carbon rings.These groups are called homologs. For example, one homolog group, the pentachlorobiphenyls or penta-PCBs, consists of all of the congeners that contain five chlorine atoms.
Although their manufacture and use were generally banned by federal regulations in the late 1970s, existinguses in electrical equipment and certain exceptions to the ban were allowed. In addition, PCBs may also becreated as a by-product in certain manufacturing processes such as dye and pigment production. PCBs arehydrophobic, sorbing to organic particles such as soils and sediments and concentrating in the tissues ofaquatic biota either directly or indirectly through the food chain.
1.4 Applicable Water Quality Criteria and Numerical Target for TMDLs
In the Delaware River Basin, applicable water quality criteria have been adopted in regulation by the statesbordering the river as well as the Delaware River Basin Commission. The DRBC does not have specificnumerical criteria for toxic pollutants including PCBs for Zone 6. Delaware adopted a numerical waterquality criterion of 64 pg/l for Total PCBs in 2004. New Jersey currently has a state-wide numerical waterquality criterion of 170 pg/l for Total PCBs that was adopted in January 2002. In September 2005, theNJDEP proposed a state-wide numerical water quality criterion of 64 pg/l for Total PCBs. The basis for thevalue of 64 pg/l is the use of a revised cancer slope factor of 2.0 mg/kg-day and a fish consumption rate of17.5 grams per day. This consumption rate is the U.S. EPA recommended default consumption rate (U.S.EPA, 2000), and is also consistent with site-specific consumption data collected by the State of Delaware(DNREC, 1994). Therefore, a value of 64 pg/l was selected as the applicable water quality criterion for Zone6 of the Delaware River including both the tidal and non-tidal portions of tributaries draining to the zone.
The TMDL must, however, also ensure that the water quality of adjacent water bodies is met. On October23, 1996, the Commission adopted numerical water quality criteria for toxic pollutants including Total PCBsfor Zones 2 through 5 of the Delaware River. These criteria do, however, differ from the criterion adoptedby Delaware and New Jersey. In Zone 4 (from River Mile 95.0 to River Mile78.8) and Zone 5 (from RiverMile 68.75 to River Mile78.8), use of the water for public water supply is not a designated use, and humanhealth criteria are based solely upon exposure to PCBs through ingestion of fish taken from these estuaryzones. Current DRBC criterion in Zone 4 and upper Zone 5 is 44.8 pg/l based upon a consumption rate of

4
6.5 grams per day. This rate was the U.S. EPA recommended default national value for freshwater fishconsumption at the time that the DRBC criteria were adopted. In lower Zone 5, a consumption rate of 37grams per day was used. This rate was consistent with the rate utilized by the State of Delaware followingan evaluation of information available at that time on consumption rates. The current DRBC criterion inlower Zone 5 (below River Mile 68.75) is 7.9 pg/l based upon this consumption rate. The water qualityregulations of both Delaware and New Jersey specify that criteria formally adopted by the DRBC are theapplicable criteria for that portion of the Delaware River. DRBC criteria for Zones 4 and 5 are morestringent, and must be considered in developing the TMDL.
The TMDL is therefore based upon the most stringent water quality criteria for protecting human health fromthe carcinogenic effect of PCBs through ingestion of fish taken from these estuary zones. Table 1containsthe applicable Delaware, New Jersey and DRBC water quality criteria for this TMDL:
Table 1: Applicable Water Quality Criteria for PCBs for Zones 4 to 6 of the Delaware Estuary
Delaware RiverManagement Zone
Water Quality Criteria for Total PCBs for the Protection of Human Health from Carcinogenic Effects
Delaware New Jersey DRBC
Zone 4 170 pg/l1 44.8 pg/l
Zone 5 64 pg/l 170 pg/l1 44.8 pg/l (above RM 68.75)7.9 pg/l (below RM 68.75)
Zone 6 64 pg/l 170 pg/l1 NA
1 - NJDEP proposed a criterion of 64 pg/l in September 2005.
As part of the effort to establish Stage 2 TMDLs for Total PCBs for Zones 2 - 6 and to update adopted waterquality standards based upon new information, the Commission’s Toxic Advisory Committee developedrevised human health criteria for carcinogens for Total PCBs using an updated cancer potency factor (i.e.,slope factor), site-specific consumption data for Zones 2 through 6, and a site-specific bioaccumulation factor(BAF) in accordance with revised guidance on developing human health water quality criteria issued by theU.S. EPA in October 2000 (U.S. EPA, 2000). In July 2005, the Toxics Advisory Committee recommendedthat the Commission proceed with the process of public notice and comment on the adoption of a revisedcriterion for Total PCBs for Zones 2 - 6. On December 7, 2005, the Commission passed a resolutionauthorizing public participation of the revised human health criterion for carcinogens of 16 picograms perliter for Zones 2 through 6. Since the basis for the TMDL could be affected by adoption of either newwildlife criteria by the NJDEP or the revised criterion by the DRBC, and the TMDL must be based on thewater quality criteria in force when the TMDL is approved, the Commission further directed that theCommission’s Executive Director to request the concurrence of the U.S. Environmental Protection AgencyRegions II and III that the existing human health water quality criteria namely: 64 pg/l in Zone 6, 7.9 pg/l inlower Zone 5 and 44.8 pg/l in upper Zone 5 and all of Zone 4 should be the basis for the Zone 6 TMDL. Ina letter received on February 21, 2006, both U.S. EPA regional offices concurred with this approach.

5
1.5 Listing under Section 303(d)
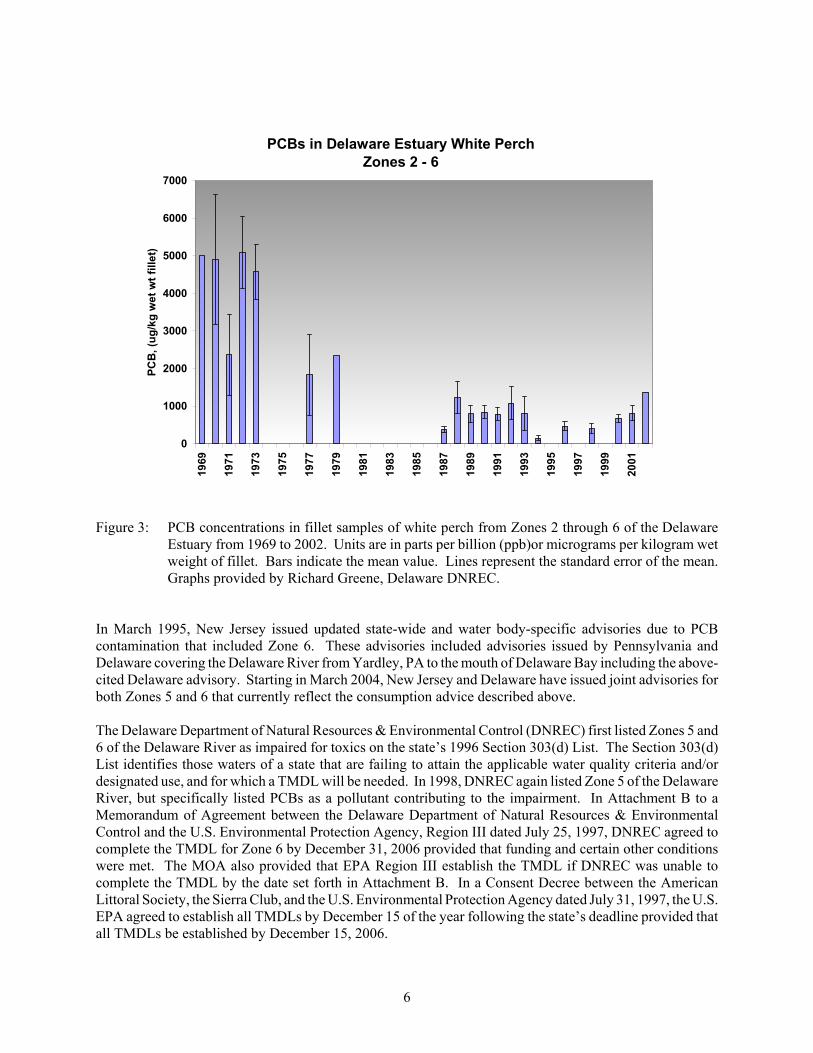
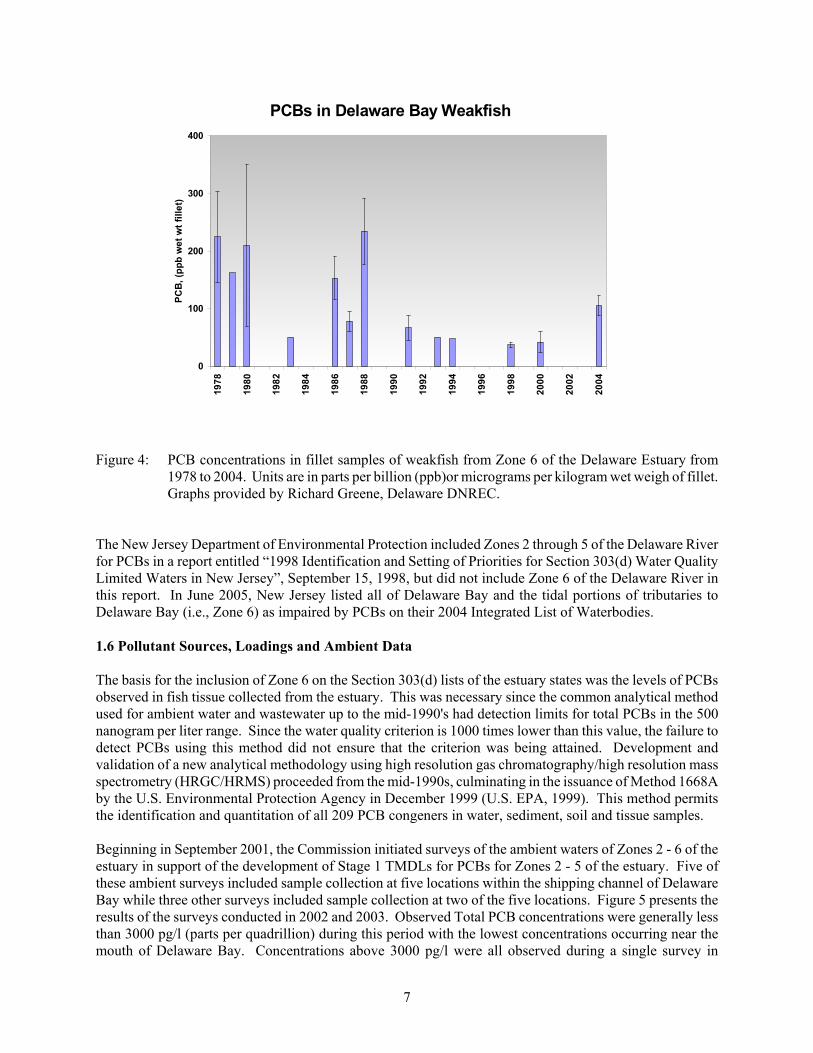
Until recently, the attainment of water quality standards for total PCBs could not be measured directly insamples of ambient water so States relied on measurements of contaminants in fish fillet samples collectedfrom the estuary. This is possible since the amount in fish tissue is related to the water concentration by afactor known as the bioaccumulation factor or BAF. This factor accounts for the uptake and concentrationof a contaminant in the tissue either directly from the water or through the target species’ food chain. Currentand historical concentrations of total PCBs in filet samples collected from striped bass, white perch andweakfish collected in Zones 2 through 6 are shown in Figures 2 through 4. While tissue concentrations havedeclined since the banning in the late 1970s, current levels in these species are approximately 50 to 200 partsper billion (ppb), one to two orders of magnitude above the level expected to occur when estuary waters areat the water quality standards for total PCBs.
Figure 2: PCB concentrations in fillet samples of striped bass from Zones 5 and 6 of the Delaware Estuaryfrom 1988 to 2004. Units are in parts per billion (ppb) or micrograms per kilogram wet weightof fillet. The range of values (minimum to maximum) is indicated by the full extent of thewhiskers which extent from the ends of the boxes. The box encloses the 25th and 75th percentile.The line indicates the median and the red plus sign indicates the mean. Graphs provided byRichard Greene, Delaware DNREC.
After conducting sampling in Zone 5 and 6, Delaware issued an advisory in 1994 recommending limitedconsumption (no more than five 8-ounce meals per year) of striped bass, channel catfish and white catfishcaught between the Chesapeake and Delaware Canal (C&D Canal) and the mouth of Delaware Bay. In 1999,Delaware increased the restrictions to one 8-ounce meal per year and added white perch and eel. By early2006, bluefish greater than 14 inches had been added to the existing list of species, and consumption ofweakfish of all sizes and bluefish less than 14 inches were limited to no more than five 8-ounce meals permonth.
6
PCBs in Delaware Estuary White PerchZones 2 - 6
0
1000
2000
3000
4000
5000
6000
7000
1969
1971
1973
1975
1977
1979
1981
1983
1985
1987
1989
1991
1993
1995
1997
1999
2001
PCB
, (ug
/kg
wet
wt f
illet
)
Figure 3: PCB concentrations in fillet samples of white perch from Zones 2 through 6 of the DelawareEstuary from 1969 to 2002. Units are in parts per billion (ppb)or micrograms per kilogram wetweight of fillet. Bars indicate the mean value. Lines represent the standard error of the mean.Graphs provided by Richard Greene, Delaware DNREC.
In March 1995, New Jersey issued updated state-wide and water body-specific advisories due to PCBcontamination that included Zone 6. These advisories included advisories issued by Pennsylvania andDelaware covering the Delaware River from Yardley, PA to the mouth of Delaware Bay including the above-cited Delaware advisory. Starting in March 2004, New Jersey and Delaware have issued joint advisories forboth Zones 5 and 6 that currently reflect the consumption advice described above.
The Delaware Department of Natural Resources & Environmental Control (DNREC) first listed Zones 5 and6 of the Delaware River as impaired for toxics on the state’s 1996 Section 303(d) List. The Section 303(d)List identifies those waters of a state that are failing to attain the applicable water quality criteria and/ordesignated use, and for which a TMDL will be needed. In 1998, DNREC again listed Zone 5 of the DelawareRiver, but specifically listed PCBs as a pollutant contributing to the impairment. In Attachment B to aMemorandum of Agreement between the Delaware Department of Natural Resources & EnvironmentalControl and the U.S. Environmental Protection Agency, Region III dated July 25, 1997, DNREC agreed tocomplete the TMDL for Zone 6 by December 31, 2006 provided that funding and certain other conditionswere met. The MOA also provided that EPA Region III establish the TMDL if DNREC was unable tocomplete the TMDL by the date set forth in Attachment B. In a Consent Decree between the AmericanLittoral Society, the Sierra Club, and the U.S. Environmental Protection Agency dated July 31, 1997, the U.S.EPA agreed to establish all TMDLs by December 15 of the year following the state’s deadline provided thatall TMDLs be established by December 15, 2006.
7
PCBs in Delaware Bay Weakfish
0
100
200
300
400
1978
1980
1982
1984
1986
1988
1990
1992
1994
1996
1998
2000
2002
2004
PCB
, (pp
b w
et w
t fill
et)
Figure 4: PCB concentrations in fillet samples of weakfish from Zone 6 of the Delaware Estuary from1978 to 2004. Units are in parts per billion (ppb)or micrograms per kilogram wet weigh of fillet.Graphs provided by Richard Greene, Delaware DNREC.
The New Jersey Department of Environmental Protection included Zones 2 through 5 of the Delaware Riverfor PCBs in a report entitled “1998 Identification and Setting of Priorities for Section 303(d) Water QualityLimited Waters in New Jersey”, September 15, 1998, but did not include Zone 6 of the Delaware River inthis report. In June 2005, New Jersey listed all of Delaware Bay and the tidal portions of tributaries toDelaware Bay (i.e., Zone 6) as impaired by PCBs on their 2004 Integrated List of Waterbodies.
1.6 Pollutant Sources, Loadings and Ambient Data
The basis for the inclusion of Zone 6 on the Section 303(d) lists of the estuary states was the levels of PCBsobserved in fish tissue collected from the estuary. This was necessary since the common analytical methodused for ambient water and wastewater up to the mid-1990's had detection limits for total PCBs in the 500nanogram per liter range. Since the water quality criterion is 1000 times lower than this value, the failure todetect PCBs using this method did not ensure that the criterion was being attained. Development andvalidation of a new analytical methodology using high resolution gas chromatography/high resolution massspectrometry (HRGC/HRMS) proceeded from the mid-1990s, culminating in the issuance of Method 1668Aby the U.S. Environmental Protection Agency in December 1999 (U.S. EPA, 1999). This method permitsthe identification and quantitation of all 209 PCB congeners in water, sediment, soil and tissue samples.
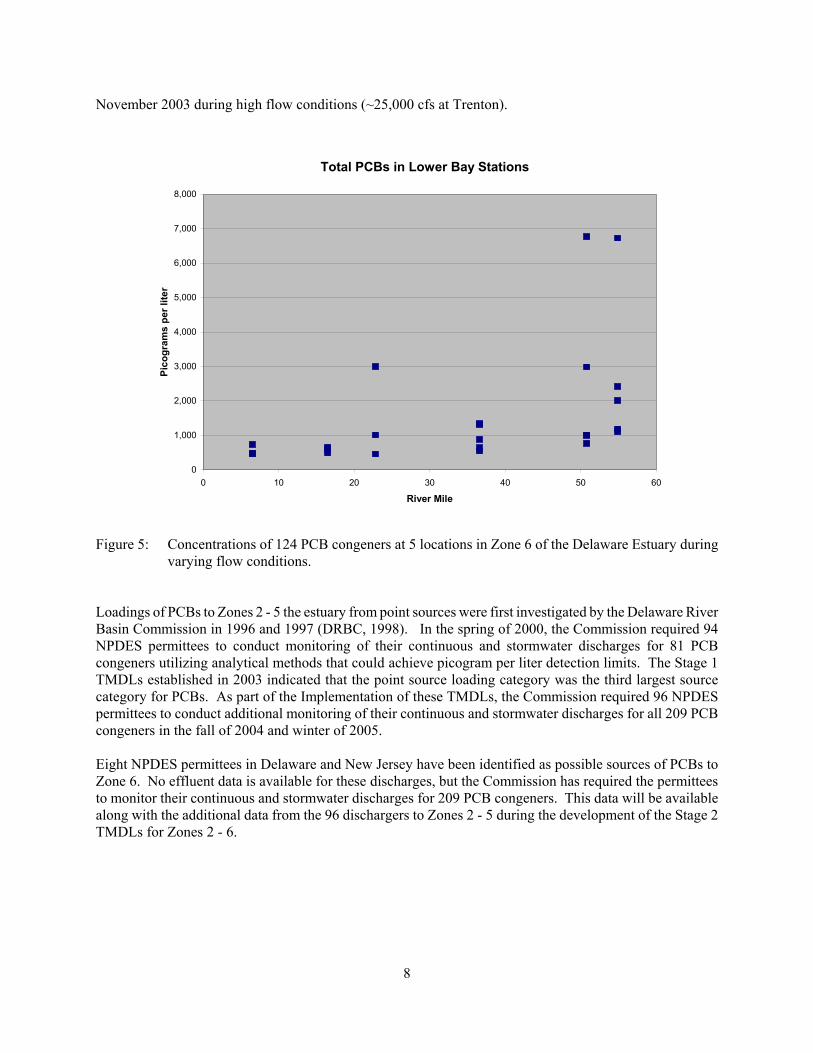
Beginning in September 2001, the Commission initiated surveys of the ambient waters of Zones 2 - 6 of theestuary in support of the development of Stage 1 TMDLs for PCBs for Zones 2 - 5 of the estuary. Five ofthese ambient surveys included sample collection at five locations within the shipping channel of DelawareBay while three other surveys included sample collection at two of the five locations. Figure 5 presents theresults of the surveys conducted in 2002 and 2003. Observed Total PCB concentrations were generally lessthan 3000 pg/l (parts per quadrillion) during this period with the lowest concentrations occurring near themouth of Delaware Bay. Concentrations above 3000 pg/l were all observed during a single survey in
8
Total PCBs in Lower Bay Stations
0
1,000
2,000
3,000
4,000
5,000
6,000
7,000
8,000
0 10 20 30 40 50 60
River Mile
Pico
gram
s pe
r lite
r
November 2003 during high flow conditions (~25,000 cfs at Trenton).
Figure 5: Concentrations of 124 PCB congeners at 5 locations in Zone 6 of the Delaware Estuary duringvarying flow conditions.
Loadings of PCBs to Zones 2 - 5 the estuary from point sources were first investigated by the Delaware RiverBasin Commission in 1996 and 1997 (DRBC, 1998). In the spring of 2000, the Commission required 94NPDES permittees to conduct monitoring of their continuous and stormwater discharges for 81 PCBcongeners utilizing analytical methods that could achieve picogram per liter detection limits. The Stage 1TMDLs established in 2003 indicated that the point source loading category was the third largest sourcecategory for PCBs. As part of the Implementation of these TMDLs, the Commission required 96 NPDESpermittees to conduct additional monitoring of their continuous and stormwater discharges for all 209 PCBcongeners in the fall of 2004 and winter of 2005.
Eight NPDES permittees in Delaware and New Jersey have been identified as possible sources of PCBs toZone 6. No effluent data is available for these discharges, but the Commission has required the permitteesto monitor their continuous and stormwater discharges for 209 PCB congeners. This data will be availablealong with the additional data from the 96 dischargers to Zones 2 - 5 during the development of the Stage 2TMDLs for Zones 2 - 6.
9
1.7 Other Required Elements for Establishing TMDLs
1.7.1 Seasonal variation
TMDL regulations at Section 130.32(b)(9) require the consideration of seasonal variation in environmentalfactors that affect the relationship between pollutant loadings and water quality impacts. Although seasonalvariation is usually not as important for TMDLs based upon human health criteria for carcinogens since theduration for this type of criteria is a 70 year exposure, the Stage 1 TMDL for Zone 6 for Total PCBs doinclude seasonal variation in several ways. Due to the interaction of PCBs with the sediments of the estuary,long-term model simulations were necessary to both confirm the model parameters established during theshort-term calibration, and evaluate the time required for the sediments to reach pseudo steady-state with theoverlying water column as loadings of PCBs were reduced.
Model simulations utilize inputs from the period February 1, 2002 until January 31, 2003. This one yearperiod is considered to be representative of long-term hydrological conditions (Section 3.2.3.1, DRBC2003c). This one year period is also utilized for long-term, decadal scale model simulations by repeating orcycling the same conditions. Use of this one year cycling period, allowed consideration of seasonal variationin model input parameters such as tributary flows, tidal forcing functions, air and water temperature, windvelocity and loadings of penta-PCBs.
1.7.2 Monitoring Plan
The Delaware River Basin Commission has conducted eight surveys of the ambient waters of Zone 6between August 2002 and June 2006 to provide data for calibrating the water quality model for penta-PCBs.Samples collected during these surveys were analyzed using a more sensitive HRGC/HRMS method (Method1668A) and larger sample volumes to obtain data at picogram per liter levels. The Commission plans toconduct additional surveys in the Estuary with particular emphasis on Delaware Bay (Zone 6) as part of theeffort to calibrate water quality models for the other PCB homologs, and to establish and refine the TMDLsand associated WLAs and LAs for Stage 2 TMDLs for all zones. Contingent on available funding, theCommission plans to continue the ambient water surveys on a yearly basis to track the progress in achievingthe load reductions and applicable water quality standards for PCBs.
Twice in the last six years, the Commission has required ~94 NPDES permittees to conduct monitoring oftheir continuous and stormwater discharges for PCB congeners utilizing analytical methods that could achievepicogram per liter detection limits. The results of this monitoring indicated that loadings to the estuary zonesfrom point sources were significant and of such magnitude to cause the water quality standards to beexceeded. The results showed that significant differences occurred between discharges with 90% of theloadings attributable to 11 discharges. These results have been used to determine the need for and thefrequency of additional monitoring in NPDES permits as they have been reissued. These monitoringrequirements will provide data in future years to assess the progress in achieving the TMDLs.
Eight NPDES permittees discharging to the tidal portions of tributaries to Zone 6 have been identified aspotential sources of PCBs. No direct point source discharges to Zone 6 have been identified. In the summerof 2006, the Commission required these permittees to conduct similar monitoring for 209 PCB congeners.Data from this monitoring requirement will be used to refine the wasteload allocations during thedevelopment of the Stage 2 TMDL for Zone 6, and to establish the need for and the frequency of additionalmonitoring in the NPDES permits for these facilities as their permits are reissued.
The Commission is also continuing to work cooperatively with Rutgers University to continue air monitoringat Lums Pond near the western end of the C&D Canal and at an urban site in Camden, NJ. Contingent on

10
available funding, this program is anticipated to continue for the long-term. Monitoring data at these sitesand at a long-term site at Rutgers University will provide data to assess the long-term trends in regionalbackground concentrations of PCBs (Lums Pond) and in regional concentrations in the estuary airshed.
1.7.3 Implementation Plan
Current EPA regulations do not require an implementation plan to be included with TMDLs. EPA NPDESregulations do require that effluent limitations must be consistent with approved WLAs [40 CFR Part122.44(8)(1)(vii)(B)]. EPA regulations allow the use of non-numeric effluent limits in certain circumstances[40 CFR Part 122.44(K)]. In addition to EPA regulations, the Commission and its signatory parties currentlyhave in place an implementation procedure for utilizing wasteload allocations and other effluent requirementsformally issued by the Commission's Executive Director. This procedure has been in use for over 25 yearswith wasteload allocations for carbonaceous oxygen demand and other pollutants that were developed fordischarges to the estuary. Section 4.30.7B.2.c.6). of the Commission regulations requires that WLAsdeveloped by the Commission shall be referred to the appropriate state agency for use, as appropriate, indeveloping effluent limitations, schedules of compliance and other effluent requirements in NPDES permits.As part of the implementation strategy for this TMDL, the NPDES permitting authorities believe that it isappropriate for 8 NPDES point source discharges to Zone 6 to receive non-numeric WQBELs consistent withthe WLAs. It is expected that the non-numeric WQBELs resulting from the Stage 1 WLAs will result inadditional monitoring using Method 1668A consistent with state and federal NPDES regulations, and mayresult in a requirement to submit and implement a pollutant minimization plan (PMP). The New JerseyDepartment of Environmental Protection has proposed regulations requiring PMPs for discharges to watersimpaired by PCBs. In addition, the Commission adopted regulations in May 2005 allowing point and non-point discharges to be required to submit and implement a PMP for PCBs or other designated toxic pollutants. These permit requirements are intended to expedite the reduction in PCB loadings to the Delaware River andBay while Stage 2 TMDLs and WLAs are being completed.
1.7.4 Reasonable Assurance that the TMDL will be Achieved
Data available to assess whether the TMDL will be achieved include ambient water quality data collected bythe Commission during routine surveys of Zones 2 through 6 of the Delaware River. Effluent quality dataand PMPs required by the Commission or through NPDES permits issued by state permitting authorities willprovide the basis for assessments regarding consistency with the WLAs developed or issued in Stage 1 andStage 2. Commission regulations also require that the WLAs be reviewed and, if required, revised every fiveyears, or as directed by the Commission. This will ensure that additional discharges of the pollutant orincreased non-point source loadings in the future will be considered.
Achieving the reductions in the load allocations for tributaries to Zones 2 through 6 will require the listingof the tributary on future Section 303(d) lists submitted by the estuary states for those tributaries that are notcurrently listed for impairment by PCBs, and completion and implementation of TMDLs for PCBs for thosetributaries that are already listed as impaired by PCBs. Achieving the load reductions required forcontaminated sites will require close coordination with the federal CERCLA programs and state programsoverseeing the assessment and cleanup of these sites. Actions by federal and state authorities to reduce airemissions from point and non-point air sources will also be necessary before achievement of the applicablewater quality criteria is achieved.
The Commission also has broad powers under Article 5 of the Delaware River Basin Compact (Public Law87-328) to control future pollution and abate existing pollution in the waters of the basin including Section2.3.5B of the Commission's Rules of Practice and Procedure (DRBC, 2002).
11
2. TWO STAGE APPROACH TO ESTABLISHING AND ALLOCATING THE TMDL FOR PCBs
2.1 Background
Developing TMDLs for a complex pollutant in a complex estuarine ecosystem with numerous point and non-point sources is an enormous task requiring substantial levels of effort, funding and time. As discussedabove, the deadlines contained in the Section 303(d) lists prepared by the States and approved by the U.S.EPA, Memoranda of Understanding, and Consent Decrees discussed above imposed limited time fordeveloping the TMDLs for Zones 2 through 6. A coordinated effort to develop the TMDLs (with emphasison the initial deadline for Zones 2 - 5) was initiated in 2000 when Carol R. Collier, Executive Director of theDelaware River Basin Commission in a letter dated May 25, 2000 requested that U.S. EPA Regions II andIII endorse the Commission as the lead agency in developing the TMDLs for PCBs in the Delaware Estuary.In a letter dated August 7, 2000, Region II endorsed the Commission’s role as the lead agency to develop theTMDLs. An August 11, 2000 letter from Region III also acknowledge the important role of the Commissionwhile identifying the legal constraints on the date for establishing the TMDLs for Zones 2 - 5. On July 26,2000, the Commission passed Resolution 2000-13 stating that the Commission would continue its ongoingprogram to control the discharge of toxic substances, including PCBs, to the Delaware Estuary, and wouldwork cooperatively with the signatory parties to the Delaware River Basin Compact and their agencies andaffected parties in this effort.
2.2 Staged Approach
As noted in Section 1 of this document, this TMDL meets all of the federal regulatory requirements of aTMDL. However, the states and DRBC are working on a Stage 2 TMDL that would be submitted to EPAfor review and approval consideration. The states and DRBC are undertaking this effort because of thecomplexity of a TMDL for a class of compounds such as PCBs, the limited time and data available, and thebenefits of refining it through time with more data led to a decision to develop the TMDLs for PCBs in twostages consistent with EPA TMDL guidance concerning phased TMDL development and stagedimplementation. A staged approach provides for adaptive implementation through execution of loadreduction strategies while additional monitoring and modeling efforts proceed in order to refine the wasteloadand load allocations. The approach recognizes that additional monitoring data and modeling results will beavailable following issuance of the Stage 1 TMDLs to enable a more refined analysis to form the basis of theStage 2 TMDLs. This staged approach to establishing TMDLs would be utilized for the Zone 6 TMDL asit was for the Stage 1 TMDLs for Zones 2 - 5.
In essence, the Zone 6 TMDL is an extension of the Stage 1 TMDLs developed for Zones 2 - 5. Due to thetidal nature of this portion of the Delaware River, the influence of Zone 6 on the upriver zones had to beconsidered in the development of the Zones 2 - 5 TMDLs. Similarly in this TMDL, Zones 2 - 5 have asignificant influence on the PCB concentrations in Zone 6 and must be considered. The States and DRBCare committed to development of a Stage 2 TMDL due to the lack of any PCB data on point sources, the needto incorporate the results of on going data collection surveys in tributaries to Delaware Bay, the need tocollect additional ambient data in Delaware Bay and nearshore coastal waters, and the need to makemodifications to the penta-PCB water quality model to better describe the processes occurring in the estuarineturbidity maximum (ETM). Other planned enhancement include specification of sediment PCBconcentrations based upon additional sediment data and assignment of segment-specific gaseous airconcentrations.
Like the Zones 2 - 5 TMDLs, the Stage 2 TMDL for Zone 6 will be based upon an improved water qualitymodel. While Total PCBs are extrapolated from penta-PCBs in Stage 1, the Stage 2 TMDL will be basedupon the sum of the PCB homologs that occur in the tissue of resident fish and biota. Data collected to date
12
indicate that this will be the sum of the tetra, penta, hexa and hepta homologs that constitute 90% of the PCBtissue burden in resident fish.
Wasteload allocations for individual discharges to Zone 6 were developed using a simplified methodology,which still met all of the current regulatory requirements for establishing a TMDL. Consistent with therecommendations of an expert panel of scientists experienced with PCB modeling, this TMDL wasextrapolated from penta homolog data using the observed ratio in the ambient waters of the Delaware Estuaryof the penta homolog to total PCBs (see Section 3.2.3 and 3.2.4). A Stage 2 TMDL, individual WLAs and LAs for Zone 6 is being developed by the DRBC concurrently withthose for Zones 2 - 5. Once the Stage 2 TMDLs are completed, EPA expects WLAs developed in Stage 2to replace Stage 1 WLAs. EPA expects the Stage 2 WLAs and LAs to be based on all of the monitoring dataobtained through the development of the Stage 2 TMDLs, and the additional modeling that will be performedfollowing the establishment of the Stage 1 TMDL. Stage 2 TMDLs will also be based on the summation ofthose PCB homolog groups accumulated by resident fish and aquatic biota, without the use of extrapolation.It is anticipated that the Stage 2 WLAs will be based upon a more sophisticated allocation methodology thanthe Stage 1 WLAs, and will likely reflect application of the procedures set forth in the DRBC Water QualityRegulations.
Following establishment of the TMDL for Zone 6, the water quality-based effluent limitations (WQBELs)in NPDES permits that are issued, reissued or modified after the approval date must be consistent with theWLAs. The NPDES permitting authorities (i.e., U.S. EPA, Delaware DNREC and New Jersey DEP) believethat these WQBELs will include non-numeric controls in the form of a best management practices (BMP)approach as the most appropriate way to identify and control discharges of PCBs consistent with the Stage1 WLAs. Federal regulations (40 CFR Part 122.44(k)(4)) allow the use of non-numeric, BMP-basedWQBELs in permits. Appropriate NPDES permitting actions resulting from individual WLAs include 1) theuse of Method 1668A for any monitoring of the wastewater influent and effluent at a facility, 2) developmentof a PCB minimization plan, and 3) implementation of appropriate, cost-effective PCB minimizationmeasures identified through the plan. This approach is identical to the approach used in establishing theTMDLs in Zones 2 - 5.
The identification of point source dischargers that are potentially significant sources of total PCBs is adynamic process that depends on several factors including the availability and extent of PCB congener datafor each discharge, the detection limit of the method used to analyze for PCB congeners, the flows used foreach discharge, the procedure used to calculate the loadings, the location of the discharge in the estuary, andthe proximity and loading of other sources of PCBs. EPA specifically requests comment on the list ofsignificant point source dischargers during the public comment period (see Appendix 1).
An important component of the staged approach is the assessment and evaluation of options to control non-point sources of PCBs. These sources include contaminated sites (sites covered under CERCLA or RCRA),non-NPDES regulated stormwater discharges, tributaries to the estuary, air deposition, and contaminatedsediments.
3. STAGE 1 APPROACH TO ESTABLISHING THE TMDL
3.1 Background
A TMDL for total PCBs is an estimate of the loading of the sum of all the PCB homologs that can enter theestuary and still meet the current water quality criteria. TMDLs are, by nature, abstract. They are the

13
projected, not the current, loadings from all sources that should result in the achievement of water qualitystandards at all points in the estuary.
In order to meet standards at all points in the estuary, some parts of the estuary will have to be less than thestandard for that portion of the estuary. This is particularly true for this TMDL for Delaware Bay as it wasfor the Stage 1 TMDLs for Zones 2 - 5 that were established in 2003. Similar to those TMDLs, the waterquality standards vary between the zones, and the controlling standard in lower Zone 5 (7.9 pg/l) below theDelaware Memorial Bridges is approximately 8 times lower than the controlling standard of 64 pg/l in Zone6 (see Section 1.4).
Even though the task is to develop a Zone 6 TMDL, it is necessary to consider all upstream zones. Anyloadings or exchanges of PCBs within or through interfaces of the entire Delaware Estuary has to be includedin this Zone 6 TMDL development because Zone 6 is the most downstream of the water quality managementzones and is heavily influenced by the ocean through tidal exchanges.
As emphasized in the TMDL document for Zones 2 - 5 (DRBC, 2003c), theoretically, there will be no netexchange between air and water column when the water column reaches the water quality criterion. Thiscan be implemented in the water quality model by assigning the atmospheric gaseous PCBs at aconcentration that will be in equilibrium with the truly dissolved PCBs in water column under the continuousinput of total maximum daily loadings. This is very important concept to bear in mind throughout any TMDLdevelopment case. It is important to distinguish TMDL conditions from the existing conditions. Even thoughit may take decades to reach ambient concentrations that are equal to the water quality criterion, the TMDLnumeric number has to be calculated under this equilibrium condition. At present time, atmospheric gaseousPCBs alone may be sufficient to cause the impairment of the Delaware Estuary, however, TMDLs have tobe calculated assuming no effect from atmosphere.
The same principle applies to the sediments of the estuary. PCBs are exchanged between the water columnand the underlying sediments through resuspension/settling of particles and diffusion of pore water. Whenthe water quality criterion is achieved, the sediments will also be in equilibrium with the overlying watercolumn. In order to shorten the computation time for model simulations, PCB concentrations can be assignedthat will be in equilibrium with the overlying water column under the input of continuous TMDL loadings.These PCB concentrations in the sediment layer can also be far lower than the existing conditions.
While simplistic approaches can be used to estimate TMDLs, significant effort has been devoted todeveloping and calibrating a hydrodynamic and water quality model for the Delaware Estuary to be used inestablishing PCB TMDLs for this water body (DRBC, 2003a; DRBC, 2003b; DRBC, 2006). There areseveral reasons why a more sophisticated approach is appropriate. These reasons include:
1. The Delaware River and Bay are significantly influenced by tidal forces producing a 6 foot tidalrange at Trenton, NJ and tidal excursions of up to 12 miles. The model incorporates this tidalmovement in the hydrodynamic model (DRBC, 2003a).
2. PCBs are hydrophobic, sorb to dissolved, colloidal and particulate carbon, and are transported withcarbon molecules and particulates associated with carbon. The model incorporates thesecharacteristics, partitions PCBs to each of these phases, and simulates the concentrations of the 3phases in the estuary (DRBC, 2003b).
3. PCBs are a class of chemicals; each having different physical-chemical properties such asvolatilization rate and partitioning rate. The model can incorporate these properties for each of theten homolog groups (DRBC, 2003b).
4. There are many sources of PCBs that enter the estuary at different locations in different amounts andat different times. The model can simulate the spatial and temporal nature of these sources (DRBC,
14
2006).5. A model can simulate the additional assimilative capacity provided by the burial of PCBs into the
deeper layers of the estuary sediments, and the exchange of PCBs in the gas phase in the estuaryairshed with the dissolved phase of PCBs in the ambient waters of the estuary (DRBC, 2003b).
A modified version of the U.S. EPA’s TOXI5/DYNHYD5 numerical models which were used in the Zone2 to 5 TMDL development in the year of 2003 were also used in the development of this TMDL. TheDelaware Estuary PCB Model has been updated and detailed revisions are described in DRBC (2006). Onekey update in this newer version of the model, compared to the version used in 2003, is correction of minorerrors in wind velocity calculation which affects to the gaseous PCB exchanges between water column andatmosphere. The impact on Stage 1 TMDLs developed for Zones 2 to 5 by use of this revised version of themodel is evaluated and discussed in Section 3.3.2. The physical model domain remains the same as that usedfor the Stage 1 TMDLs for Zones 2 - 5. The hydrodynamic and water quality models incorporate all influxesand effluxes within and through interfaces of the entire Estuary and calculate instream concentrations.
3.2 Conceptual Approach
3.2.1 Guiding Principles
TMDLs require that each source of PCBs meet the water quality criterion by itself and in conjunction withall other sources. A number of key guiding principles were developed based on available scientific data,model simulation results, and policy decisions for the development of the Zone 6 TMDL. The guidingprinciples are as follows:
1. Stage 1 TMDL for Zone 6 (Delaware Bay) is built upon TMDLs developed for Zones 2 to 5 in 2003.The revised version of Delaware Estuary PCB model is used in this TMDL development. TotalMaximum Daily Loads developed for Zones 2 to 5 will not be changed either by the use of therevised version of the model or by this Stage-1 Zone 6 TMDL development. In addition, theassigned equilibrium PCB concentrations for the atmosphere will be remain the same as that used forZones 2 to 5.
2. Pentachlorobiphenyls, the penta-PCB homolog group, are used as a surrogate for Total PCBs. Thesame ratio used in development of the Zones 2 to 5 TMDLs in 2003, 1:4 for penta to total PCBs, isused in this TMDL. A comparison of penta to total PCB concentrations in ambient water samplesfor the entire estuary are depicted in Figure 6. Simulating a single homolog group rather than totalPCBs allows the model to simulate kinetic transfers accurately. Therefore, all the model simulationsand applicable water quality target (i.e., criteria) for the development of the TMDL for the DelawareBay is based on penta-PCBs. The TMDL for total PCBs is calculated by multiplying the penta-PCBTMDL and their components by four to obtain the Total PCB TMDL.
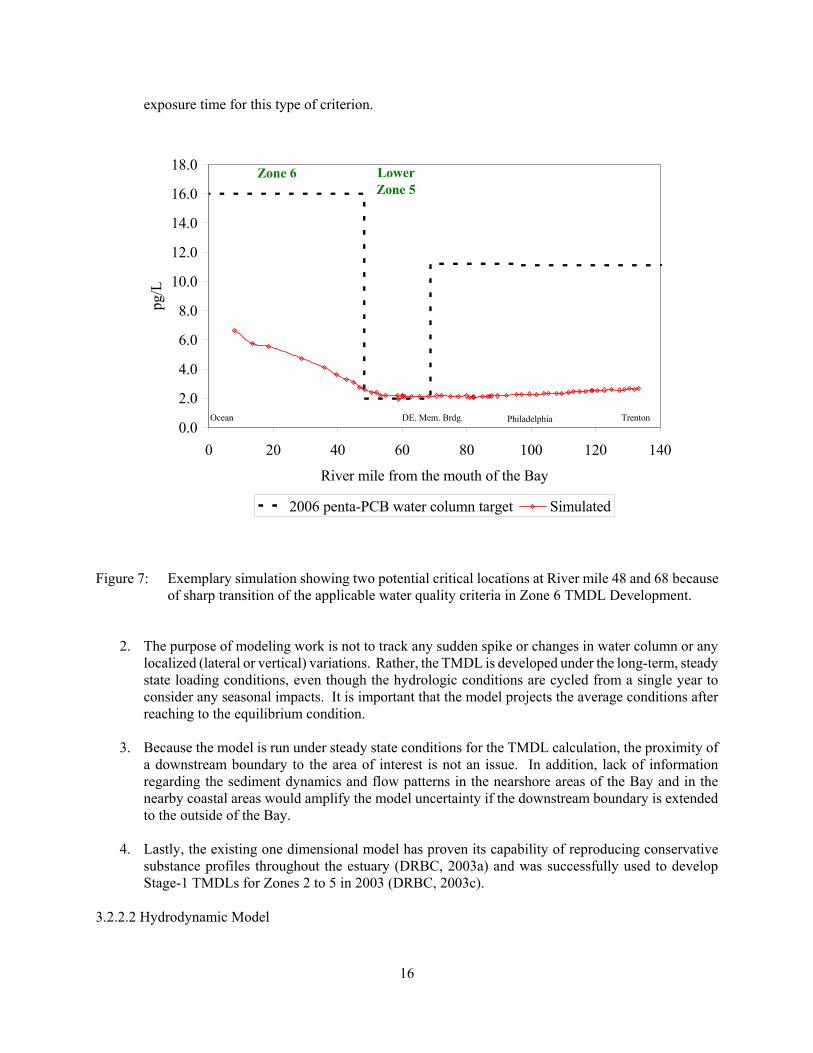
3. Preliminary model simulations revealed that there are two potential critical locations that control theloading of PCBs to Zone 6. These locations occur at transitions between different water qualitycriteria as described in Section 1.4. One location is at River Mile 68.75, the location of DelawareMemorial Bridge, where the applicable water quality criteria changes from 44.8 to 7.9 pg/L as thewater quality changes from freshwater to marine conditions. Another potential location is at theboundary of Zone 5 and 6 (River Mile 48.2) where the applicable water quality criteria changes from7.9 to 64 pg/L in an upstream to downstream direction. If any exceedance occurs during modelsimulations, it will occur either of these two locations as shown in example scenario results shownin Figure 7. Therefore, allowable loadings to Zone 6 or from the downstream boundary will bedetermined while focusing on violations at those two locations.
15
0.00
0.05
0.10
0.15
0.20
0.25
0.30
0.35
0.40
0.45
0.50
2 3 4 5 6
Zones
Pent
a to
Tot
al P
CB
Rat
io
Figure 6: Ratio of Penta-PCBs to Total PCBs in ambient water samples collected from 15 sites in Zone 2-5and 6 sites in Zone 6 between September 2001 and November 2003. Error bars indicate theminimum and maximum ratios observed at any sampling site during all surveys.
4. All WLAs and LAs in Zone 6 are allowed to discharge at the applicable water quality criterion of 64picograms per liter of total PCBs. Based on the hydrodynamic model outputs, the averaged tidalcycle inflow during flooding tide near the mouth of the Bay is about 110,000 cubic meters persecond. The annual median advective net inflow from the Zone 5 to Zone 6 is about 450 cubicmeters per second. While, the annual median inflow from point and non-point sources into the Zone6 is about 17.84 cubic meters per second. Since this Stage 1 TMDL for the Delaware Bay is limitedto the mainstem of the Estuary not the individual tributaries, the influence from the WLAs and LAsare relatively minor compared to the influence from the upstream or the downstream boundaries ofZone 6. Note that because of tidal forcing, the Delaware Bay is heavily influenced by the waterquality of the Ocean.
5. As a policy decision, 5 percent of the TMDL is explicitly reserved for a margin of safety. This isconsistent with the margin of safety used in the Zones 2 - 5 TMDLs.
3.2.2 Modeling Approach
3.2.2.1 Justification for the Use of One-dimensional Model for Delaware Bay
In many cases, two or three dimensional numerical models are applied for an estuarine system with a largebay like the Delaware Bay. A one-dimensional model is used, however, to develop Stage 1 TMDL for Zone6. The reasons for this include the following:
1. Limited data, and resources and extended computational time prohibit a use of multi-dimensionalmodel in this TMDL development. Since this TMDL is based upon a human health criterion forprotection from carcinogenic effects, long-term simulations are necessary due to the 70 year
16
0.0
2.0
4.0
6.0
8.0
10.0
12.0
14.0
16.0
18.0
0 20 40 60 80 100 120 140
River mile from the mouth of the Bay
pg/L
2006 penta-PCB water column target Simulated
Ocean PhiladelphiaDE. Mem. Brdg. Trenton
Zone 6 Lower Zone 5
exposure time for this type of criterion.
Figure 7: Exemplary simulation showing two potential critical locations at River mile 48 and 68 becauseof sharp transition of the applicable water quality criteria in Zone 6 TMDL Development.
2. The purpose of modeling work is not to track any sudden spike or changes in water column or anylocalized (lateral or vertical) variations. Rather, the TMDL is developed under the long-term, steadystate loading conditions, even though the hydrologic conditions are cycled from a single year toconsider any seasonal impacts. It is important that the model projects the average conditions afterreaching to the equilibrium condition.
3. Because the model is run under steady state conditions for the TMDL calculation, the proximity of
a downstream boundary to the area of interest is not an issue. In addition, lack of informationregarding the sediment dynamics and flow patterns in the nearshore areas of the Bay and in thenearby coastal areas would amplify the model uncertainty if the downstream boundary is extendedto the outside of the Bay.
4. Lastly, the existing one dimensional model has proven its capability of reproducing conservativesubstance profiles throughout the estuary (DRBC, 2003a) and was successfully used to developStage-1 TMDLs for Zones 2 to 5 in 2003 (DRBC, 2003c).
3.2.2.2 Hydrodynamic Model
17
A representative one year hydrologic condition is used for this Zone 6 TMDL development. This samecondition was used in the development of the Zones 2 to 5 TMDLs in 2003. The hydrological conditions andthe logic in selecting this condition is described in the Stage 1 Zones 2 - 5 TMDLs document in Section3.2.4.1 (DRBC, 2003d). The description of the hydrodynamic model and calibration results are documentedin DRBC (2003a). The representative hydrologic condition is then input into the hydrodynamic model andthe output of this hydrodynamic model is fed to the water quality model. Decadal or centennial PCB modelsimulations are conducted by using this one year hydrologic condition year after year to develop the PCBTMDL.
Using the gaged daily flow data and drainage area, flow rate per unit area is calculated for the gagedtributaries. This information are then utilized to obtain flow rates for the nearby ungaged tributaries anddirect runoff into Zone 6 of the Delaware Estuary. Median daily inflow value for the sum of point and non-point source inflows from Zone 6 during the cycling year is calculated at 17.84 m3/sec.
3.2.3 TMDL Approach
Although the water quality standards are expressed as Total PCBs and the TMDL must be expressed as TotalPCBs, the current water quality model only addresses penta-PCBs. As discussed in Section 2.2, the TMDLfor Total PCBs is extrapolated from the TMDL for penta-PCBs using the observed ratio in the DelawareRiver/Estuary of the penta homolog to Total PCBs. Therefore, a water quality target for penta-PCBs mustbe established for use in the TMDL procedures. This target is determined by assuming that the ratio of penta-PCBs to Total PCBs is approximately 0.25. Figure 6 presents the ratio of penta-PCBs to Total PCBs inambient water samples collected in Zones 2 through 6. While difference between zones are evident, 0.25 isa reasonable value for the ratio, and makes the Stage 1 Zone 6 TMDL consistent with the Stage 1 TMDLsfor Zones 2 - 5.
The TMDL for Total PCBs for Zone 6 of the Delaware Estuary is established using a seven step procedure.A flow chart of these steps is presented in Figure 8. The TMDL is calculated over a one year period (annualmedian) to be consistent with both the model simulations and the 70 year exposure used for human healthcriteria.
The wasteload allocation portion of the TMDL represents those source categories that are regulated underthe NPDES program (industrial discharges, municipal wastewater treatment plant discharges, combined seweroverflows or CSOs, and municipal separate storm sewer systems or MS4s). Eight (8) industrial and municipalwastewater discharges are assigned wasteload allocations in this TMDL. No CSOs were identified by statepermitting authorities. Twenty (20) municipal separate storm sewer systems or MS4s were included in theallocation for this point source category. The load allocation portion of the TMDL represents categoriesincluding contaminated sites, non-NPDES regulated stormwater discharges, tributaries, air deposition andmost importantly input from the Ocean.
In accordance with the TMDL regulations, a portion of TMDL must be allocated to a margin of safety. Themargin of safety (MOS) is intended to account for any lack of knowledge concerning the relationshipsbetween pollutant loadings and receiving water quality. Commission regulations also require that a portionof the TMDL be set aside as a margin of safety, with the proportion reflecting the degree of uncertainty inthe data and resulting water quality-based controls. The MOS can be incorporated into the TMDL eitherimplicitly in the design conditions under which the TMDL is calculated or explicitly by assigning a fixedproportion of the TMDL. Since the conditions under which the TMDL is determined like tributary flows arerelated to the long-term conditions and not to design conditions associated with human health water qualitystandard for carcinogens (such as the harmonic mean flow of tributaries), expression of the MOS as anexplicit percentage of each zone TMDL was considered the more appropriate approach. An explicit

18
percentage of 5% was then utilized in the apportionment of the Zone 6 TMDL, which is in accordance withMOS used in Zones 2 to 5 TMDLs in 2003.
3.3 Procedure for Establishing The TMDL
3.3.1 Summary
The TMDL for total PCBs for Zone 6 of the Delaware Estuary is established using a multi-step procedure thatincorporated the guiding principles discussed in Section 3.2.1. As discussed in Section 1.4, the existinghuman health water quality criterion for PCBs adopted by the State of Delaware of 64 pg/l, and the existingDRBC criteria are used as the basis for the Stage 1 TMDL. The lower DRBC criterion of 7.9 pg/L from theDelaware Memorial Bridge to the head of the Bay result in two critical locations. The resultant PCBloadings are thus limited to meet the criterion in this section of the estuary.
The DRBC Water Quality Management Zone 6 is located at the downstream end of the Delaware River.Inflows from upstream, tributaries, direct runoff, point sources, and exchanges with Atlantic Ocean throughthe mouth of the Bay are all contributors to the water quality of Delaware Bay. Because of this geophysicallocation, entire tidal Delaware River and Atlantic Ocean (or conditions at the mouth of the bay), has to beconsidered in the development of TMDL for Delaware Bay. In addition, because of the lower water qualitycriterion in lower Zone 5 which form critical locations, it is crucial to evaluate the conditions upstream ofZone 6.
Stage-1 PCB TMDLs for the entire tidal Delaware River, or Zones 2 to 5, were established in 2003. In the2003 TMDLs, zero loadings were assigned for both point and non-point sources with exception of the oceanboundary condition which was set at one-fourth of the applicable water quality criterion of 7.9 pg/L (1.975pg/L of penta-PCBs). The applicable water quality criterion has changed to 64 pg/L of Total PCBs; a waterquality target of 16 pg/L of penta-PCBs for this Zone 6 TMDL development. While maintaining the Zones2 to 5 TMDLs developed in 2003, the Zone 6 TMDL is calculated by multiplying inflows and water qualitytarget for point and non-point sources. The ocean boundary condition, which has a substantial influence onwater quality in Zone 6, was determined by trial and error methods through model simulations so as not tocause exceedances of the applicable water quality targets throughout the estuary. The gas phaseconcentrations for the lower Bay that would be in equilibrium with the penta-PCB water concentrations arethen updated in the water quality model. The model is then run to confirm that the water quality targets arestill being met.
The Zone 6 TMDL is calculated in a seven step procedure. A brief description of seven steps is as follows:
1. Using the revised model code and revised input conditions, re-confirm that the TMDLsdeveloped in 2003 are still valid. The governing value occurs at two locations, River Mile 68.75and River Mile 48.2, is 1.975 pg/L. This value is 25% of 7.9 pg/L, the applicable water qualitycriterion for Total PCBs at these locations.
2. Determine the usable assimilative capacity for Stage 1 Zone 6 PCB TMDL at the two criticallocations by assigning zero penta-PCBs at the ocean boundary. The difference between thesimulation results and the governing value is the total assimilative capacity available for Zone6.
3. Allowable loadings from all point and non-point sources having inflows into Zone 6 are thencalculated by multiplying their inflow by 16 pg/L for penta-PCB. These loadings are distributedin the model proportional to the model segment sizes in Zone 6. The only missing load will thenbe the influx from the ocean boundary.
4. Determine allowable ocean boundary by trial and error simulations using the penta-PCB model,
19
re-confirmed TMDLs for Zones 2 to 5 developed in 2003, and the Zone 6 load calculated fromthe previous step. Compare the results with the applicable water quality target at the two criticallocations.
5. Once the allowable ocean boundary is found, calculate and assign equilibrium gaseousatmospheric concentrations in the model. Run the model and go back to Step 4 until thedifference between the water quality target of 16pg/Land the simulated water column penta PCBsis less than 0.02 pg/L.
6. Convert the ocean boundary concentration to a load and add it to the gross load allocationportion.
7. In steps 1 through 6, the load of penta-PCBs that is required to meet applicable water qualitytarget for penta-PCBs was determined. In step 7, five (5) percent of wasteload allocation (WLA)and load allocation (LA) are allocated to margin of safety (MOS).
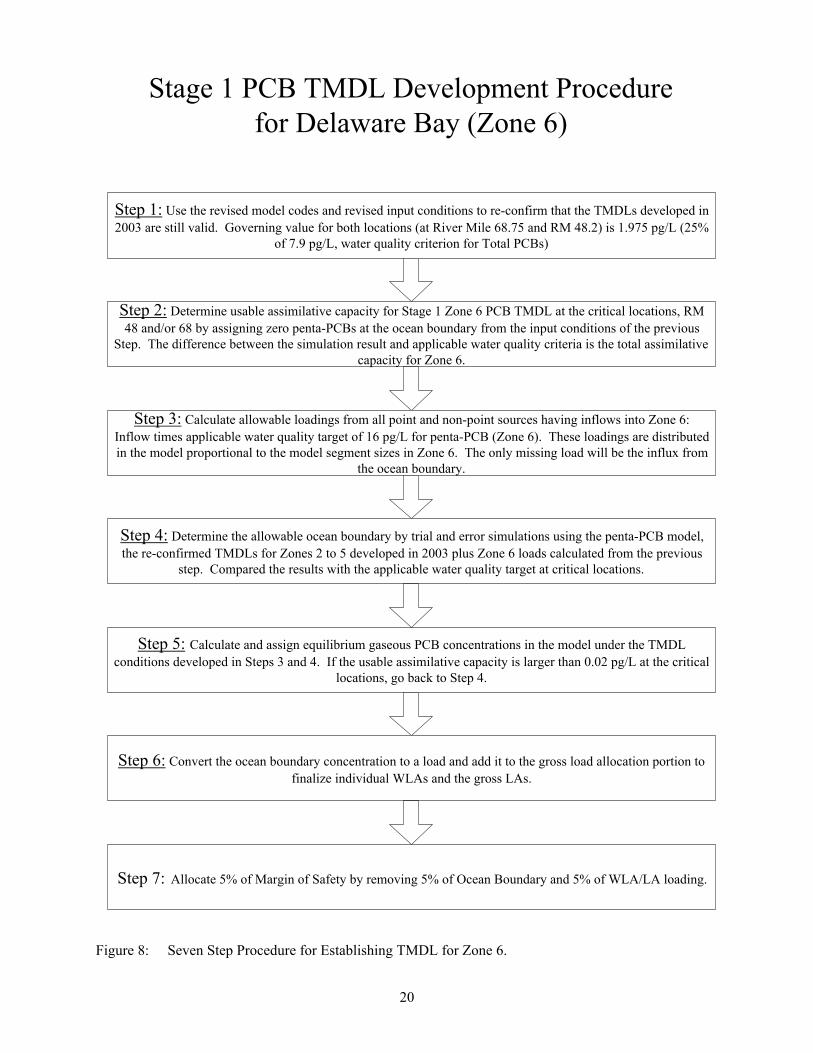
20
Step 1: Use the revised model codes and revised input conditions to re-confirm that the TMDLs developed in2003 are still valid. Governing value for both locations (at River Mile 68.75 and RM 48.2) is 1.975 pg/L (25%
of 7.9 pg/L, water quality criterion for Total PCBs)
Step 2: Determine usable assimilative capacity for Stage 1 Zone 6 PCB TMDL at the critical locations, RM48 and/or 68 by assigning zero penta-PCBs at the ocean boundary from the input conditions of the previous
Step. The difference between the simulation result and applicable water quality criteria is the total assimilativecapacity for Zone 6.
Step 4: Determine the allowable ocean boundary by trial and error simulations using the penta-PCB model,the re-confirmed TMDLs for Zones 2 to 5 developed in 2003 plus Zone 6 loads calculated from the previous
step. Compared the results with the applicable water quality target at critical locations.
Step 5: Calculate and assign equilibrium gaseous PCB concentrations in the model under the TMDLconditions developed in Steps 3 and 4. If the usable assimilative capacity is larger than 0.02 pg/L at the critical
locations, go back to Step 4.
Step 6: Convert the ocean boundary concentration to a load and add it to the gross load allocation portion tofinalize individual WLAs and the gross LAs.
Step 7: Allocate 5% of Margin of Safety by removing 5% of Ocean Boundary and 5% of WLA/LA loading.
Step 3: Calculate allowable loadings from all point and non-point sources having inflows into Zone 6:Inflow times applicable water quality target of 16 pg/L for penta-PCB (Zone 6). These loadings are distributedin the model proportional to the model segment sizes in Zone 6. The only missing load will be the influx from
the ocean boundary.
Stage 1 PCB TMDL Development Procedurefor Delaware Bay (Zone 6)
Figure 8: Seven Step Procedure for Establishing TMDL for Zone 6.

21
0.02.04.06.08.0
10.012.014.016.018.0
0 20 40 60 80 100 120 140
River mile from the mouth of the Bay
pg/L
2006 penta-PCB water column targetPCB TMDL issued in December 2003PCB TMDL issued in December 2003 using revised code in 2006
Ocean PhiladelphiaDE. Mem. Brdg. Trenton
Zone 6 Lower Zone 5
3.3.2 Step 1: Confirmation of the 2003 TMDLs for Zones 2 - 5 using the revised model code
A concern was raised after revisions to the model code and input file parameters to correctly simulate thevolatilization that these revisions may have affected the Zone 2 - 5 TMDLs. Because the Zone 6 TMDL isbuilt upon the TMDLs for Zones 2 to 5, it was necessary to confirm the validity of 2003 TMDL results usingthe revised model code as a first step.
The 100 year simulations with the revised DELPCB model were conducted with the input conditions for theTMDLs developed in 2003 for Zones 2 to 5. Long-term, or 100 year in this case, simulations are requiredto assure that the model reaches steady state. The simulated results using the new code are compared withthe simulation results generated with the model code in 2003 as shown in TMDL report (DRBC, 2003c).Figure 9 and 10 are the same comparison plots with different y-axes to visually compare the two simulationresults. Simulation results were summarized to generate spatial plots with annual median values in the 99thand 100th years of the simulation. Slight differences are apparent between the simulation results in Figure10. The relative differences between two models are from -3.2 to 2.7 percent. Simulation results from therevised code tend to show slightly lower water column PCBs concentrations compared to concentrations fromthe 2003 modeling results in the lower Zone 5 and Zone 6. This implies that Zone 6 will get additionalassimilative capacity because of the use of the improved version of the model. It is also important to notethat no exceedances are observed in both simulation results confirming that the TMDLs established for theDelaware Estuary Zones 2 to 5 are valid under the revised model coded and input conditions. All thesimulation results presented in the rest of the report are generated by the revised model code.
Figure 9: Comparison and validation of Zones 2 to 5 TMDLs established in 2003 using the revisedDELPCB model code and input conditions (full Y-axis scale). Blue and red solid lines showmedian water column Penta-PCBs concentrations from the 99th and 100th year of the simulationusing the old and revised code.
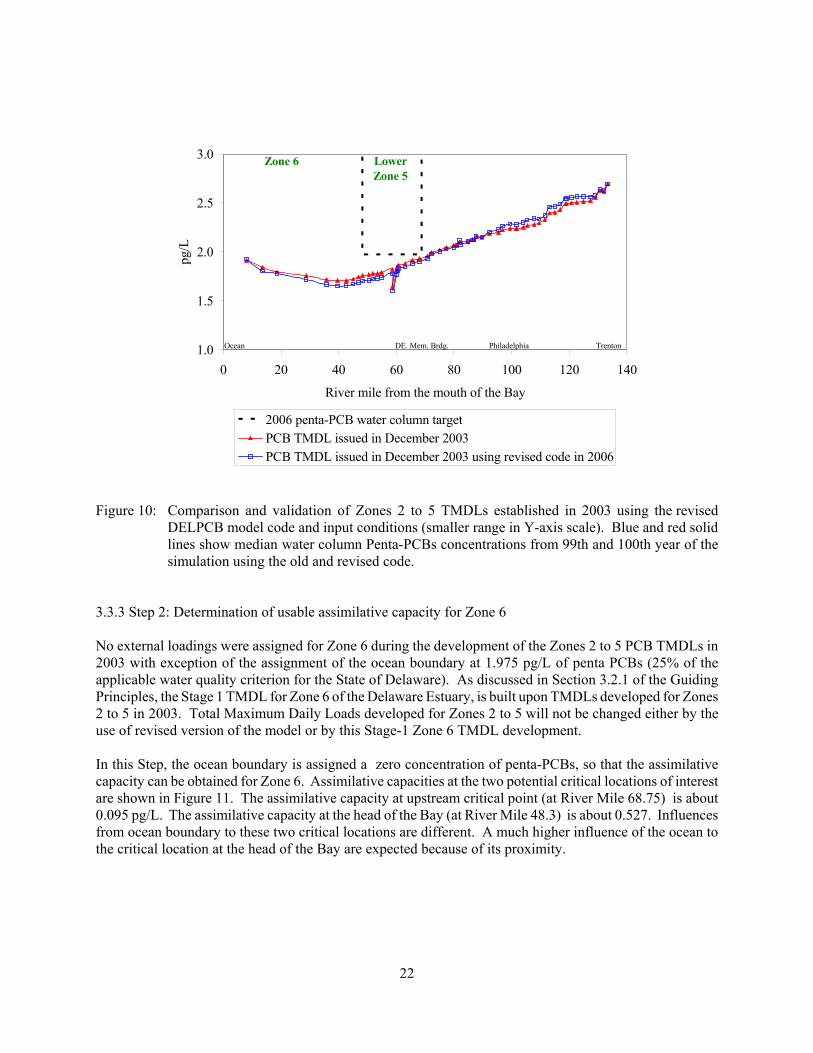
22
1.0
1.5
2.0
2.5
3.0
0 20 40 60 80 100 120 140
River mile from the mouth of the Bay
pg/L
2006 penta-PCB water column targetPCB TMDL issued in December 2003PCB TMDL issued in December 2003 using revised code in 2006
Ocean PhiladelphiaDE. Mem. Brdg. Trenton
Zone 6 Lower Zone 5
Figure 10: Comparison and validation of Zones 2 to 5 TMDLs established in 2003 using the revisedDELPCB model code and input conditions (smaller range in Y-axis scale). Blue and red solidlines show median water column Penta-PCBs concentrations from 99th and 100th year of thesimulation using the old and revised code.
3.3.3 Step 2: Determination of usable assimilative capacity for Zone 6
No external loadings were assigned for Zone 6 during the development of the Zones 2 to 5 PCB TMDLs in2003 with exception of the assignment of the ocean boundary at 1.975 pg/L of penta PCBs (25% of theapplicable water quality criterion for the State of Delaware). As discussed in Section 3.2.1 of the GuidingPrinciples, the Stage 1 TMDL for Zone 6 of the Delaware Estuary, is built upon TMDLs developed for Zones2 to 5 in 2003. Total Maximum Daily Loads developed for Zones 2 to 5 will not be changed either by theuse of revised version of the model or by this Stage-1 Zone 6 TMDL development.
In this Step, the ocean boundary is assigned a zero concentration of penta-PCBs, so that the assimilativecapacity can be obtained for Zone 6. Assimilative capacities at the two potential critical locations of interestare shown in Figure 11. The assimilative capacity at upstream critical point (at River Mile 68.75) is about0.095 pg/L. The assimilative capacity at the head of the Bay (at River Mile 48.3) is about 0.527. Influencesfrom ocean boundary to these two critical locations are different. A much higher influence of the ocean tothe critical location at the head of the Bay are expected because of its proximity.
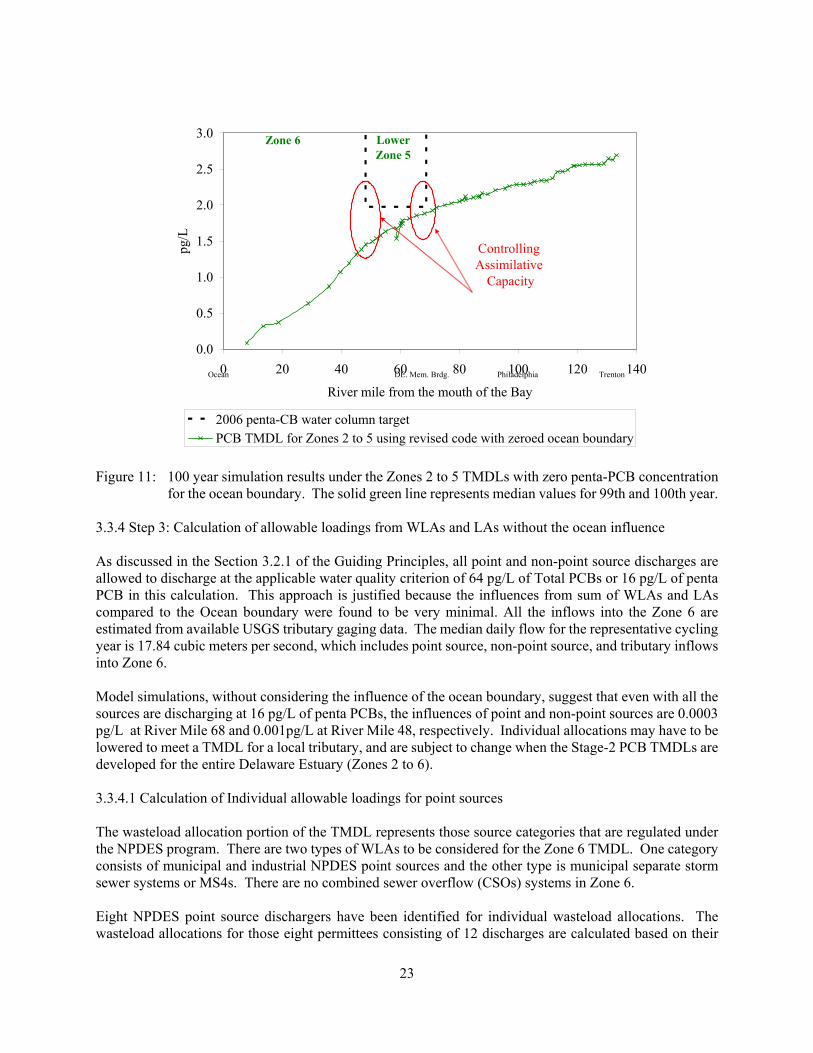
23
0.0
0.5
1.0
1.5
2.0
2.5
3.0
0 20 40 60 80 100 120 140
River mile from the mouth of the Bay
pg/L
2006 penta-CB water column targetPCB TMDL for Zones 2 to 5 using revised code with zeroed ocean boundary
Ocean PhiladelphiaDE. Mem. Brdg. Trenton
Zone 6 Lower Zone 5
Controlling Assimilative
Capacity
Figure 11: 100 year simulation results under the Zones 2 to 5 TMDLs with zero penta-PCB concentrationfor the ocean boundary. The solid green line represents median values for 99th and 100th year.
3.3.4 Step 3: Calculation of allowable loadings from WLAs and LAs without the ocean influence
As discussed in the Section 3.2.1 of the Guiding Principles, all point and non-point source discharges areallowed to discharge at the applicable water quality criterion of 64 pg/L of Total PCBs or 16 pg/L of pentaPCB in this calculation. This approach is justified because the influences from sum of WLAs and LAscompared to the Ocean boundary were found to be very minimal. All the inflows into the Zone 6 areestimated from available USGS tributary gaging data. The median daily flow for the representative cyclingyear is 17.84 cubic meters per second, which includes point source, non-point source, and tributary inflowsinto Zone 6.
Model simulations, without considering the influence of the ocean boundary, suggest that even with all thesources are discharging at 16 pg/L of penta PCBs, the influences of point and non-point sources are 0.0003pg/L at River Mile 68 and 0.001pg/L at River Mile 48, respectively. Individual allocations may have to belowered to meet a TMDL for a local tributary, and are subject to change when the Stage-2 PCB TMDLs aredeveloped for the entire Delaware Estuary (Zones 2 to 6). 3.3.4.1 Calculation of Individual allowable loadings for point sources
The wasteload allocation portion of the TMDL represents those source categories that are regulated underthe NPDES program. There are two types of WLAs to be considered for the Zone 6 TMDL. One categoryconsists of municipal and industrial NPDES point sources and the other type is municipal separate stormsewer systems or MS4s. There are no combined sewer overflow (CSOs) systems in Zone 6.
Eight NPDES point source dischargers have been identified for individual wasteload allocations. Thewasteload allocations for those eight permittees consisting of 12 discharges are calculated based on their
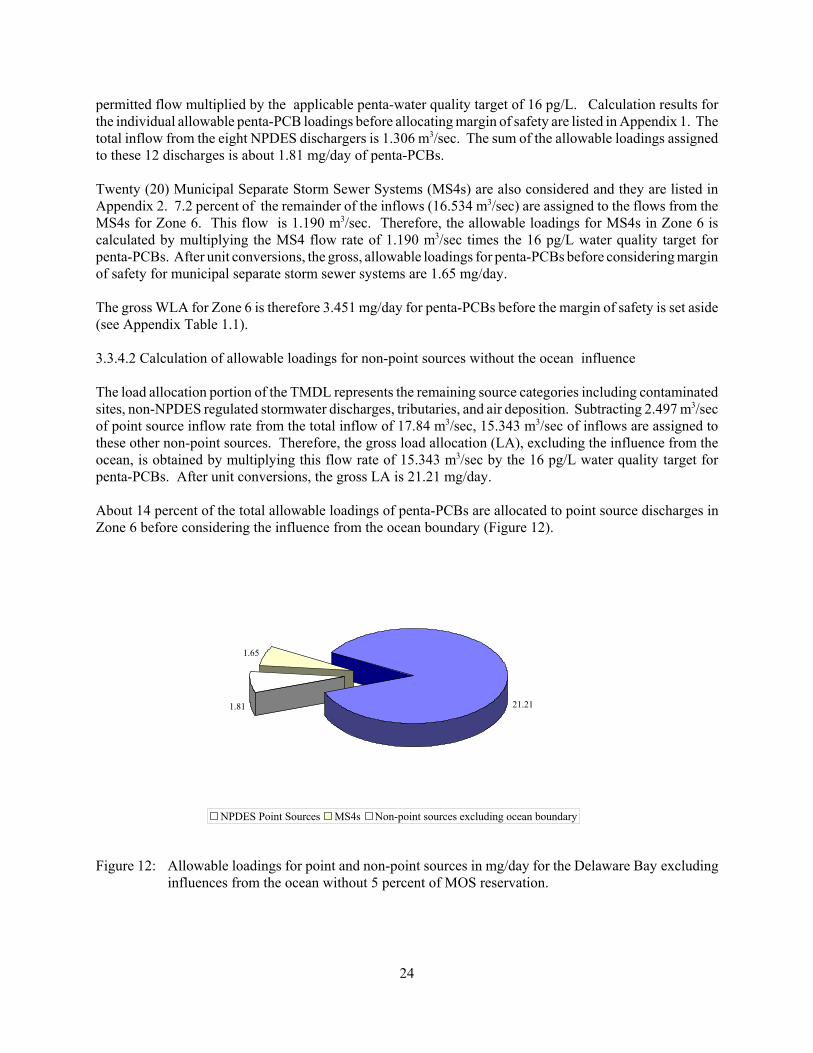
24
1.81
1.65
21.21
NPDES Point Sources MS4s Non-point sources excluding ocean boundary
permitted flow multiplied by the applicable penta-water quality target of 16 pg/L. Calculation results forthe individual allowable penta-PCB loadings before allocating margin of safety are listed in Appendix 1. Thetotal inflow from the eight NPDES dischargers is 1.306 m3/sec. The sum of the allowable loadings assignedto these 12 discharges is about 1.81 mg/day of penta-PCBs.
Twenty (20) Municipal Separate Storm Sewer Systems (MS4s) are also considered and they are listed inAppendix 2. 7.2 percent of the remainder of the inflows (16.534 m3/sec) are assigned to the flows from theMS4s for Zone 6. This flow is 1.190 m3/sec. Therefore, the allowable loadings for MS4s in Zone 6 iscalculated by multiplying the MS4 flow rate of 1.190 m3/sec times the 16 pg/L water quality target forpenta-PCBs. After unit conversions, the gross, allowable loadings for penta-PCBs before considering marginof safety for municipal separate storm sewer systems are 1.65 mg/day.
The gross WLA for Zone 6 is therefore 3.451 mg/day for penta-PCBs before the margin of safety is set aside(see Appendix Table 1.1).
3.3.4.2 Calculation of allowable loadings for non-point sources without the ocean influence
The load allocation portion of the TMDL represents the remaining source categories including contaminatedsites, non-NPDES regulated stormwater discharges, tributaries, and air deposition. Subtracting 2.497 m3/secof point source inflow rate from the total inflow of 17.84 m3/sec, 15.343 m3/sec of inflows are assigned tothese other non-point sources. Therefore, the gross load allocation (LA), excluding the influence from theocean, is obtained by multiplying this flow rate of 15.343 m3/sec by the 16 pg/L water quality target forpenta-PCBs. After unit conversions, the gross LA is 21.21 mg/day.
About 14 percent of the total allowable loadings of penta-PCBs are allocated to point source discharges inZone 6 before considering the influence from the ocean boundary (Figure 12).
Figure 12: Allowable loadings for point and non-point sources in mg/day for the Delaware Bay excludinginfluences from the ocean without 5 percent of MOS reservation.

25
0.0
2.0
4.0
6.0
8.0
10.0
12.0
14.0
16.0
18.0
0 20 40 60 80 100 120 140
River mile from the mouth of the Bay
pg/L
2006 penta-PCB water column targetOcean boundary at penta-PCB target of 16pg/L
Ocean PhiladelphiaDE. Mem. Brdg. Trenton
Zone 6 Lower Zone 5
3.3.5 Step 4: Determination of ocean boundary concentration
The mouth of Delaware Bay is one of the downstream boundaries in the DELPCB model. The otherdownstream boundary is the western end of the C&D Canal which is located in Zone 5. In establishing theStage-1 PCB TMDLs for Zones 2 through 5, these downstream boundaries were set at the water qualitycriteria of 7.9 pg/L of Total PCBs. In the Zone 6 TMDL development, the ocean boundary is the onlydownstream boundary of concern. A fixed concentration can be assigned at the downstream boundary sincethe TMDL is established under the steady state, or equilibrium conditions. As the applicable water qualitycriterion in Zone 6 is now 64 pg/L, the ocean boundary was set at a value of 16 pg/L. However, because ofthe reversing tidal flows and massive volume of ocean water entering the Bay during the flooding tide,exceedances can occur at the critical locations by the influence of the ocean boundary (Figure 13). Section4.20.4B.1 of the Commission's Water Quality Regulations specify that in establishing WLAs, theconcentrations at the boundaries of the area of interest shall be set at the lower of actual data or the applicablewater quality criteria (DRBC, 1996). Even though the exceedances are not occurring within Zone 6, theocean boundary condition has to be reduced below this criteria so as not to cause any violations in Zone 5.
Figure 13: Simulation results under the loading conditions developed up to Step 3 and assigned oceanboundary at the penta-PCB water quality target of 16pg/L.
A series of simulations were performed while lowering the ocean downstream boundary concentration from16 pg/L until no violations was observed at the critical locations. In these simulations, daily loadingsestablished for Zones 2 to 5 are maintained and th Zone 6 WLAs and LAs, which are calculated in theprevious Step 3, are input to the model as distributed loadings based on sizes of model segments. The oceanboundary concentration that did not cause any violations at critical locations was determined to 3.62 pg/L ofpenta-PCBs. Even though the applicable water quality target for penta-PCBs in Delaware Bay is 16 pg/L,the ocean boundary has to be limited to 3.62 pg/L. These critical locations exist because of changes in thewater quality criteria in Zones 2 - 6.
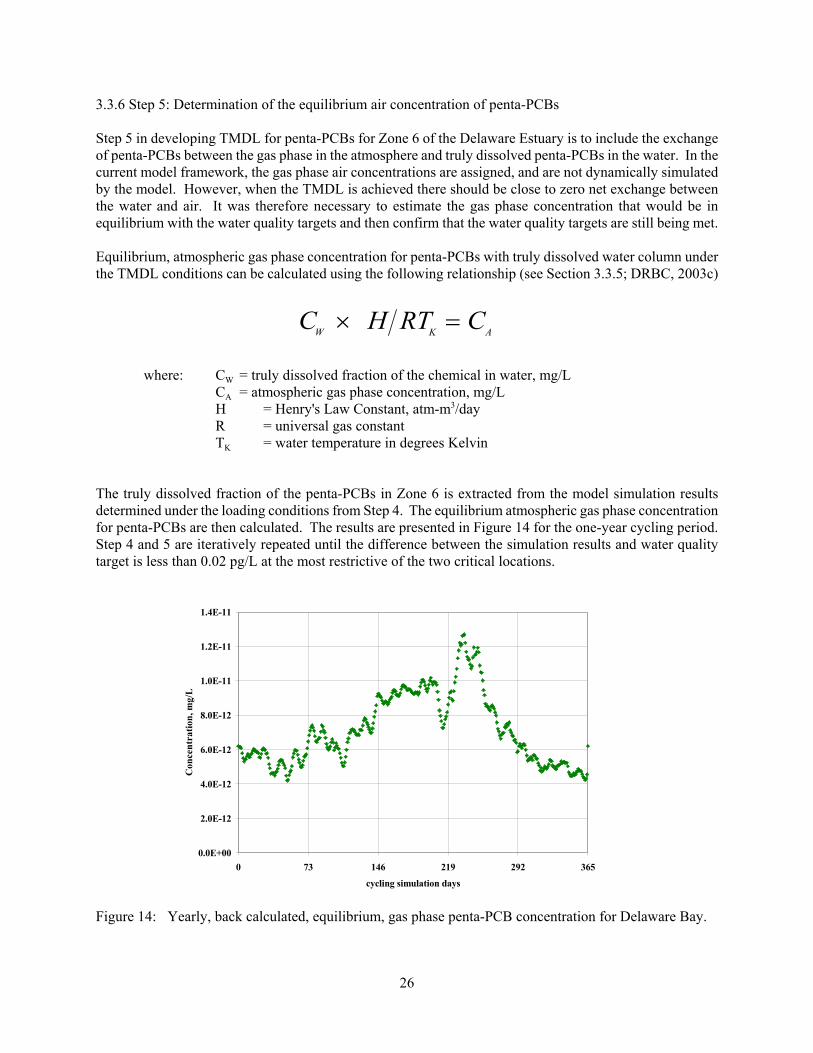
26
C H RT CW K A× =
0.0E+00
2.0E-12
4.0E-12
6.0E-12
8.0E-12
1.0E-11
1.2E-11
1.4E-11
0 73 146 219 292 365
cycling simulation days
Con
cent
ratio
n, m
g/L
3.3.6 Step 5: Determination of the equilibrium air concentration of penta-PCBs
Step 5 in developing TMDL for penta-PCBs for Zone 6 of the Delaware Estuary is to include the exchangeof penta-PCBs between the gas phase in the atmosphere and truly dissolved penta-PCBs in the water. In thecurrent model framework, the gas phase air concentrations are assigned, and are not dynamically simulatedby the model. However, when the TMDL is achieved there should be close to zero net exchange betweenthe water and air. It was therefore necessary to estimate the gas phase concentration that would be inequilibrium with the water quality targets and then confirm that the water quality targets are still being met.
Equilibrium, atmospheric gas phase concentration for penta-PCBs with truly dissolved water column underthe TMDL conditions can be calculated using the following relationship (see Section 3.3.5; DRBC, 2003c)
where: CW = truly dissolved fraction of the chemical in water, mg/LCA = atmospheric gas phase concentration, mg/LH = Henry's Law Constant, atm-m3/dayR = universal gas constantTK = water temperature in degrees Kelvin
The truly dissolved fraction of the penta-PCBs in Zone 6 is extracted from the model simulation resultsdetermined under the loading conditions from Step 4. The equilibrium atmospheric gas phase concentrationfor penta-PCBs are then calculated. The results are presented in Figure 14 for the one-year cycling period.Step 4 and 5 are iteratively repeated until the difference between the simulation results and water qualitytarget is less than 0.02 pg/L at the most restrictive of the two critical locations.
Figure 14: Yearly, back calculated, equilibrium, gas phase penta-PCB concentration for Delaware Bay.
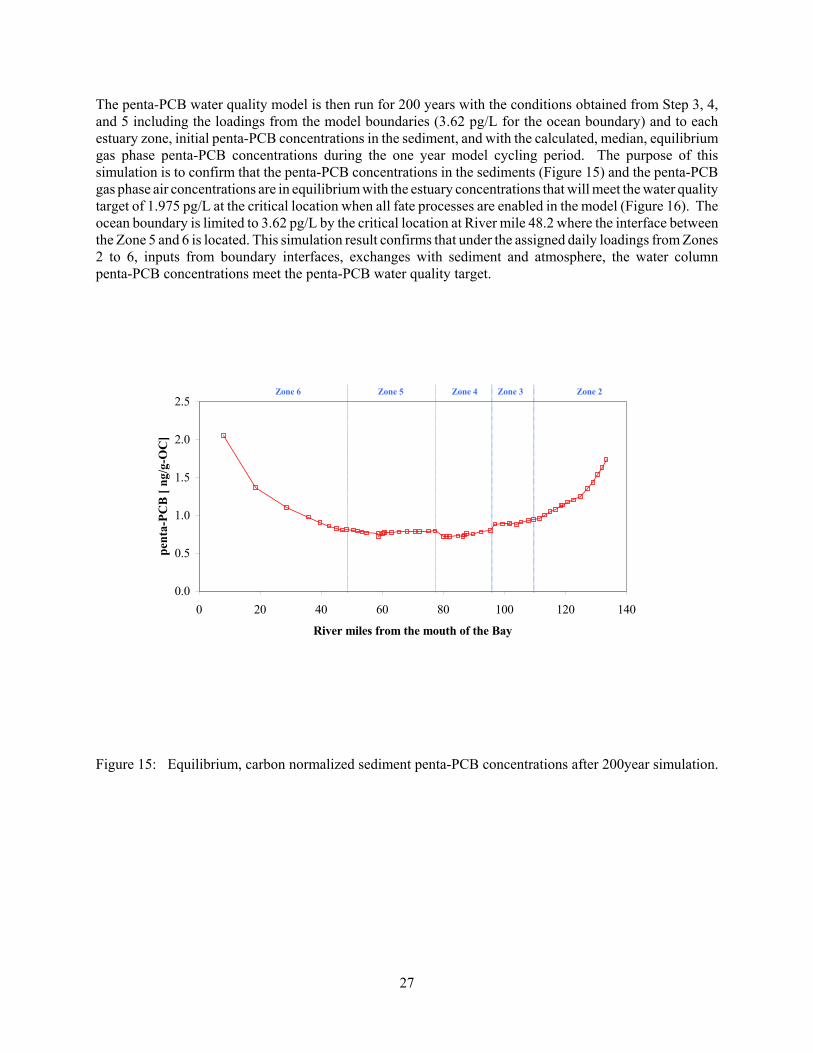
27
0.0
0.5
1.0
1.5
2.0
2.5
0 20 40 60 80 100 120 140
River miles from the mouth of the Bay
pent
a-PC
B [
ng/g
-OC
]
Zone 6 Zone 5 Zone 4 Zone 3 Zone 2
The penta-PCB water quality model is then run for 200 years with the conditions obtained from Step 3, 4,and 5 including the loadings from the model boundaries (3.62 pg/L for the ocean boundary) and to eachestuary zone, initial penta-PCB concentrations in the sediment, and with the calculated, median, equilibriumgas phase penta-PCB concentrations during the one year model cycling period. The purpose of thissimulation is to confirm that the penta-PCB concentrations in the sediments (Figure 15) and the penta-PCBgas phase air concentrations are in equilibrium with the estuary concentrations that will meet the water qualitytarget of 1.975 pg/L at the critical location when all fate processes are enabled in the model (Figure 16). Theocean boundary is limited to 3.62 pg/L by the critical location at River mile 48.2 where the interface betweenthe Zone 5 and 6 is located. This simulation result confirms that under the assigned daily loadings from Zones2 to 6, inputs from boundary interfaces, exchanges with sediment and atmosphere, the water columnpenta-PCB concentrations meet the penta-PCB water quality target.
Figure 15: Equilibrium, carbon normalized sediment penta-PCB concentrations after 200year simulation.
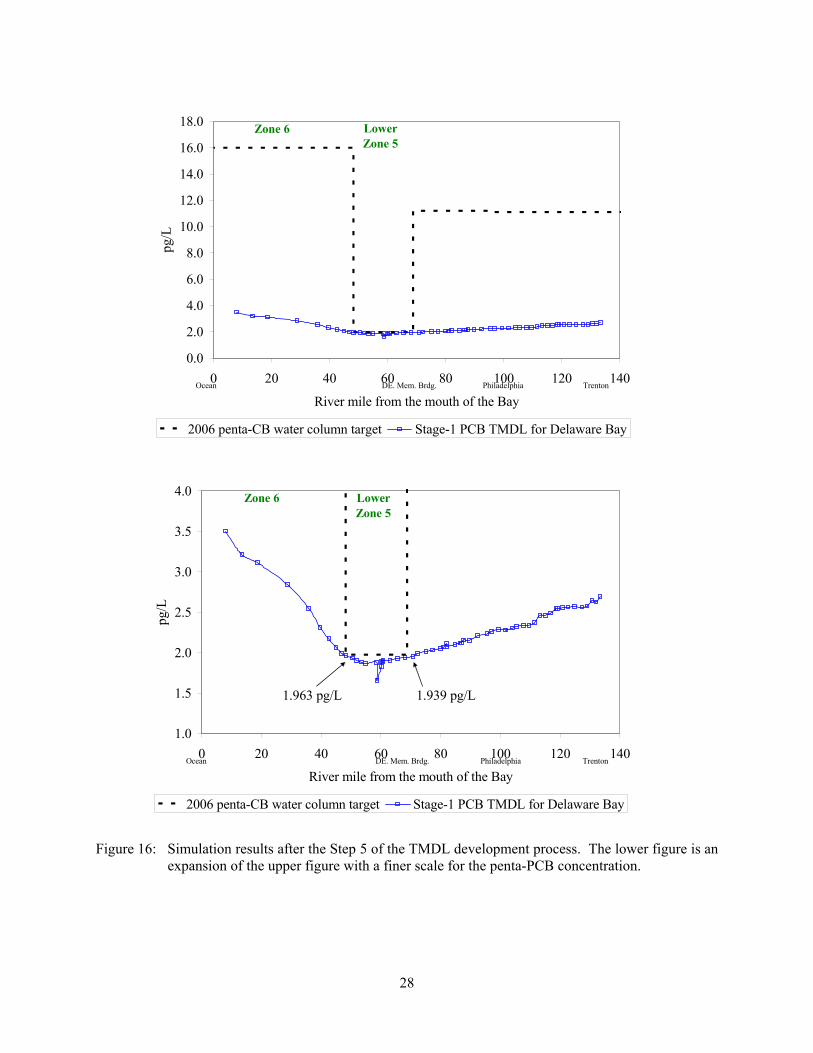
28
0.0
2.0
4.0
6.0
8.0
10.0
12.0
14.0
16.0
18.0
0 20 40 60 80 100 120 140
River mile from the mouth of the Bay
pg/L
2006 penta-CB water column target Stage-1 PCB TMDL for Delaware Bay
Ocean PhiladelphiaDE. Mem. Brdg. Trenton
Zone 6 Lower Zone 5
1.0
1.5
2.0
2.5
3.0
3.5
4.0
0 20 40 60 80 100 120 140
River mile from the mouth of the Bay
pg/L
2006 penta-CB water column target Stage-1 PCB TMDL for Delaware Bay
Ocean PhiladelphiaDE. Mem. Brdg. Trenton
Zone 6 Lower Zone 5
1.963 pg/L 1.939 pg/L
Figure 16: Simulation results after the Step 5 of the TMDL development process. The lower figure is anexpansion of the upper figure with a finer scale for the penta-PCB concentration.
29
3.3.7 Step 6: Determination of ocean boundary as a load
TMDL development is a process of determining allowable loadings of a pollutant of concern that does notresult in exceedances of water quality standards. A TMDL is expressed as a unit of daily loading. Asdescribed in Step 4 of this TMDL calculation (Section 3.3.5), the ocean boundary is determined as a unit ofconcentration under the existing modeling framework. The amount and direction of loading flux at thisboundary is internally calculated within the model as influenced by tidal conditions and concentrationgradients. The updated version of DELPCB model used in Zone 6 TMDL development, has been revised totrack mass exchanges of PCBs between segments throughout the simulation. This update allowed thequantitation of the influence of the ocean into Delaware Bay as a unit of daily loading. The ocean boundaryis limited to a concentration of 3.62 pg/L to achieve the applicable penta-PCB water quality target at thecritical location at the head of the Bay. The influence from the ocean boundary is extracted from the 100 yearmodel simulation results under the conditions obtained up to previous Step 5. The average daily loadingsfrom the ocean boundary is calculated to be 444.45 mg/day of penta- PCBs under the TMDL condition. Thisamount is added to LA portion calculated in Step 3 of 21.21 mg/day to complete the gross load allocation fornon-point sources. The gross allocation to the non-point sources in Zone 6 is 465.66 mg/day before themargin of safety is set aside.
3.3.8 Step 7: Reservation of a Margin of Safety
The TMDL and allocations to WLAs and LAs is calculated through Step 6. As a final step, a portion of theTMDL must be allocated to a margin of safety. The Commission's Toxics Advisory Committee made severalrecommendations on the policies and procedures to be used to establish allocations for Zones 2 to 5 in 2003.Federal regulations at 40 CFR Part 130.7(c)(1) require a margin of safety or MOS to be included in a TMDLto account for any lack of knowledge concerning the relationships between pollutant loadings and receivingwater quality. Commission regulations (Section 4.30.7B.2.b.) also require that a portion of the TMDL be setaside as a margin of safety, with the proportion reflecting the degree of uncertainty in the data and resultingwater quality-based controls.
The margin of safety can be incorporated either implicitly in the design conditions used in establishing theTMDL or explicitly by assigning a proportion of each TMDL. Both of these approaches were considered bythe Toxics Advisory Committee in the development of the Stage 1 TMDLs for Zones 2 - 5. This committeerecommended that an explicit margin of safety of 5% be assigned in allocating the zone-specific TMDLs atthat time. This recommendation was based upon the use of a one year cycling period for the hydrodynamicand water quality model that mimics the period of record for the two major tributaries to the estuary ratherthan design tributary flows; and the use of tide data, precipitation data and the actual effluent flows thatoccurred during the one year cycling period. Since the TMDL for Zone 6 is developed using similar designconditions, this recommendation is also implemented in the development and allocation of the Zone 6 TMDL.
From Section 3.3.4.1 (Step 3), the gross WLA is 3.45 mg/day, and from Section 3.3.7 (Step 6), the gross LAis 465.66 mg/day before reserving a margin of safety. A total maximum daily loading or TMDL for Zone6 is therefore 469.11 mg/day of penta PCBs. The TMDL and its allocation to WLAs, LAs and a MOS issummarized in Table 2.
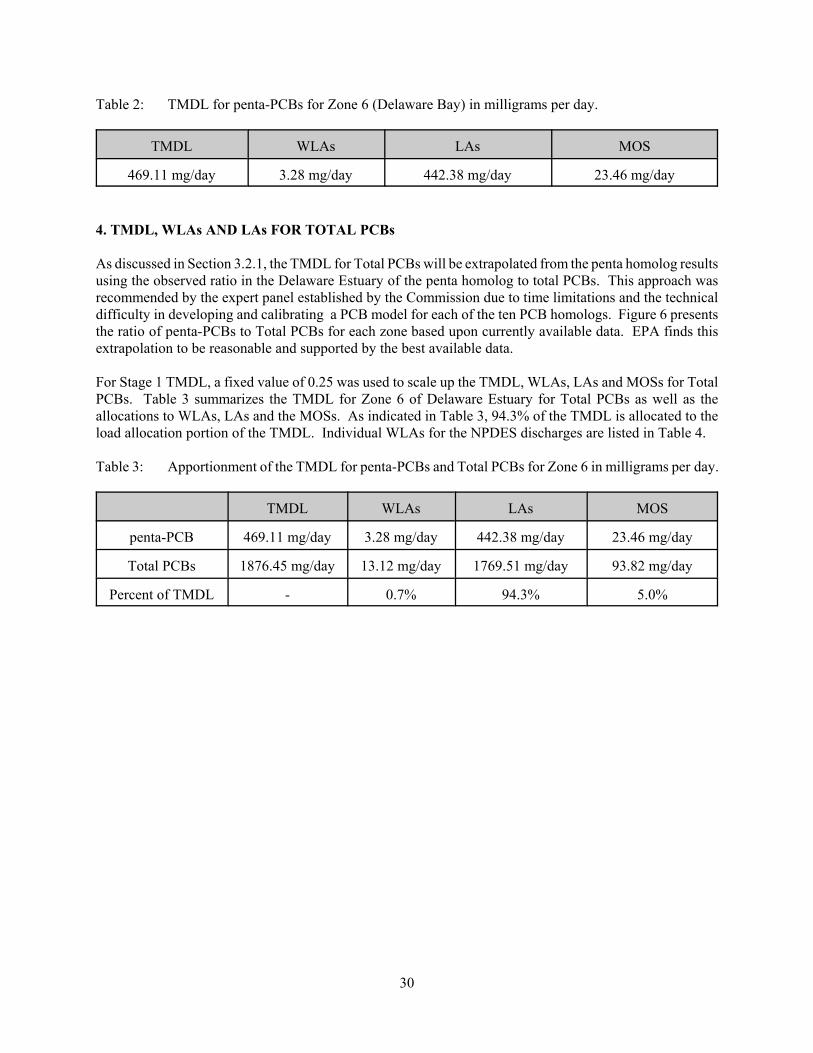
30
Table 2: TMDL for penta-PCBs for Zone 6 (Delaware Bay) in milligrams per day.
TMDL WLAs LAs MOS
469.11 mg/day 3.28 mg/day 442.38 mg/day 23.46 mg/day
4. TMDL, WLAs AND LAs FOR TOTAL PCBs
As discussed in Section 3.2.1, the TMDL for Total PCBs will be extrapolated from the penta homolog resultsusing the observed ratio in the Delaware Estuary of the penta homolog to total PCBs. This approach wasrecommended by the expert panel established by the Commission due to time limitations and the technicaldifficulty in developing and calibrating a PCB model for each of the ten PCB homologs. Figure 6 presentsthe ratio of penta-PCBs to Total PCBs for each zone based upon currently available data. EPA finds thisextrapolation to be reasonable and supported by the best available data.
For Stage 1 TMDL, a fixed value of 0.25 was used to scale up the TMDL, WLAs, LAs and MOSs for TotalPCBs. Table 3 summarizes the TMDL for Zone 6 of Delaware Estuary for Total PCBs as well as theallocations to WLAs, LAs and the MOSs. As indicated in Table 3, 94.3% of the TMDL is allocated to theload allocation portion of the TMDL. Individual WLAs for the NPDES discharges are listed in Table 4.
Table 3: Apportionment of the TMDL for penta-PCBs and Total PCBs for Zone 6 in milligrams per day.
TMDL WLAs LAs MOS
penta-PCB 469.11 mg/day 3.28 mg/day 442.38 mg/day 23.46 mg/day
Total PCBs 1876.45 mg/day 13.12 mg/day 1769.51 mg/day 93.82 mg/day
Percent of TMDL - 0.7% 94.3% 5.0%

31
Table 4: Calculation of individual wasteload allocations (WLAs) for Total PCBs for point sources with5 percent reserved for a MOS.
Facility NPDES No. DSN PermittedFlow
(MGD)
PermittedFlow
(m3/sec)
WLA
(mg/day)
MOS
(mg/day)
City of Dover,McKee Run
DE0050466 001 1.250 0.0548 0.2877 0.0151
004 0.006 0.0003 0.0014 0.0001
005 0.001 0.0000 0.0002 0.0000
Harrington STP DE0020036 001 0.750 0.0329 0.1726 0.0091
Kent County STP DE0020338 001 15.000 0.6572 3.4523 0.1817
Reichhold Chemicals DE0000591 001 0.150 0.0066 0.0345 0.0018
002* 0.005 0.0002 0.0011 0.0001
003* 0.032 0.0014 0.0074 0.0004
Millville City NJ0029467 001A 5.000 0.2191 1.1508 0.0606
Cumberland CountyUA (CCUA)
NJ0024651 001A 7.000 0.3067 1.6111 0.0848
Glass TubingAmericas – MillvilleTubing
NJ0004171 005A 0.514 0.0225 0.1183 0.0062
Lower AllowaysCreek – CantonVillage
NJ0062201 001A 0.050 0.0022 0.0115 0.0006
MS4s - - 27.171 1.1904 6.2535 0.3291
Total 56.929 2.49 13.10 0.69
* Flow is estimated based on their drainage area, assumed runoff coefficient, and 45 inch of annual rainfall.
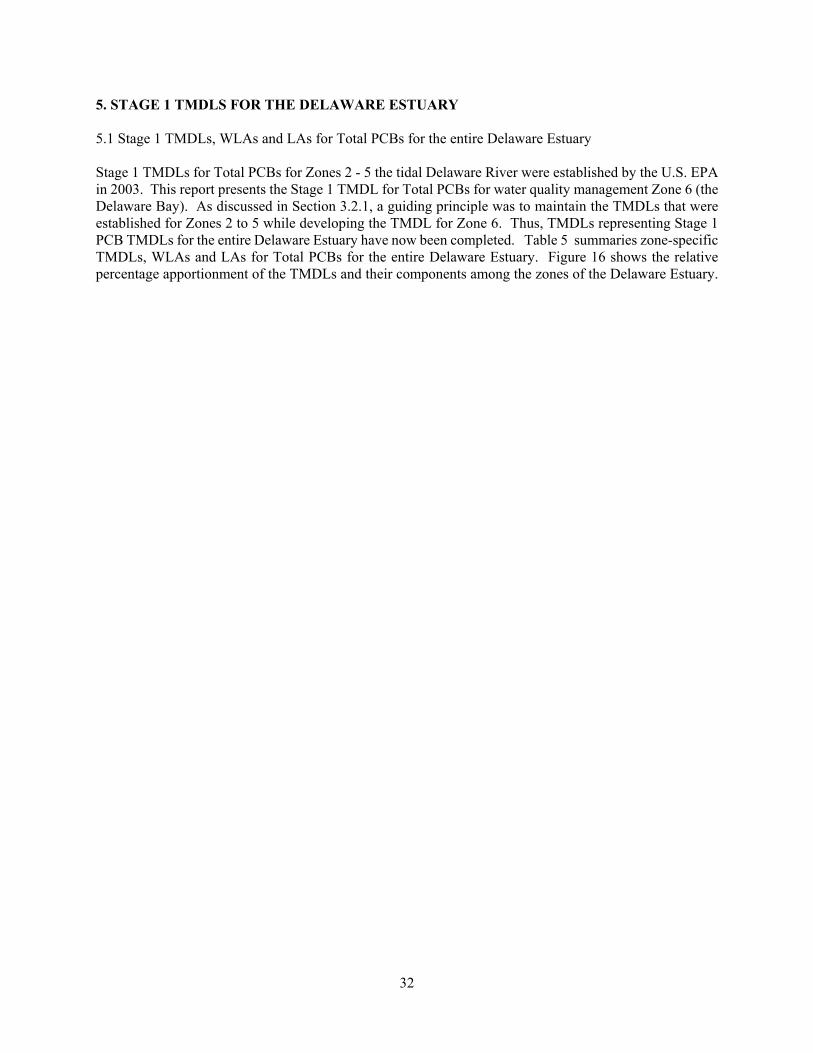
32
5. STAGE 1 TMDLS FOR THE DELAWARE ESTUARY
5.1 Stage 1 TMDLs, WLAs and LAs for Total PCBs for the entire Delaware Estuary
Stage 1 TMDLs for Total PCBs for Zones 2 - 5 the tidal Delaware River were established by the U.S. EPAin 2003. This report presents the Stage 1 TMDL for Total PCBs for water quality management Zone 6 (theDelaware Bay). As discussed in Section 3.2.1, a guiding principle was to maintain the TMDLs that wereestablished for Zones 2 to 5 while developing the TMDL for Zone 6. Thus, TMDLs representing Stage 1PCB TMDLs for the entire Delaware Estuary have now been completed. Table 5 summaries zone-specificTMDLs, WLAs and LAs for Total PCBs for the entire Delaware Estuary. Figure 16 shows the relativepercentage apportionment of the TMDLs and their components among the zones of the Delaware Estuary.
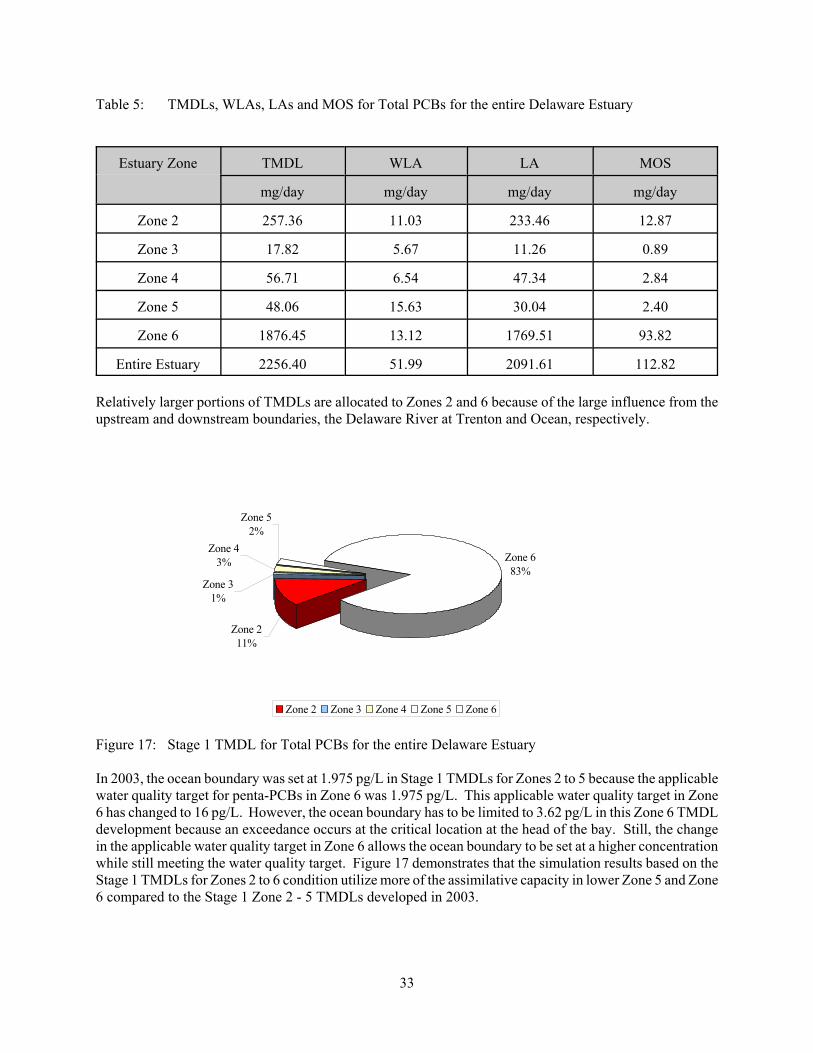
33
Zone 683%
Zone 52%
Zone 43%
Zone 31%
Zone 211%
Zone 2 Zone 3 Zone 4 Zone 5 Zone 6
Table 5: TMDLs, WLAs, LAs and MOS for Total PCBs for the entire Delaware Estuary
Estuary Zone TMDL WLA LA MOS
mg/day mg/day mg/day mg/day
Zone 2 257.36 11.03 233.46 12.87
Zone 3 17.82 5.67 11.26 0.89
Zone 4 56.71 6.54 47.34 2.84
Zone 5 48.06 15.63 30.04 2.40
Zone 6 1876.45 13.12 1769.51 93.82
Entire Estuary 2256.40 51.99 2091.61 112.82
Relatively larger portions of TMDLs are allocated to Zones 2 and 6 because of the large influence from theupstream and downstream boundaries, the Delaware River at Trenton and Ocean, respectively.
Figure 17: Stage 1 TMDL for Total PCBs for the entire Delaware Estuary
In 2003, the ocean boundary was set at 1.975 pg/L in Stage 1 TMDLs for Zones 2 to 5 because the applicablewater quality target for penta-PCBs in Zone 6 was 1.975 pg/L. This applicable water quality target in Zone6 has changed to 16 pg/L. However, the ocean boundary has to be limited to 3.62 pg/L in this Zone 6 TMDLdevelopment because an exceedance occurs at the critical location at the head of the bay. Still, the changein the applicable water quality target in Zone 6 allows the ocean boundary to be set at a higher concentrationwhile still meeting the water quality target. Figure 17 demonstrates that the simulation results based on theStage 1 TMDLs for Zones 2 to 6 condition utilize more of the assimilative capacity in lower Zone 5 and Zone6 compared to the Stage 1 Zone 2 - 5 TMDLs developed in 2003.
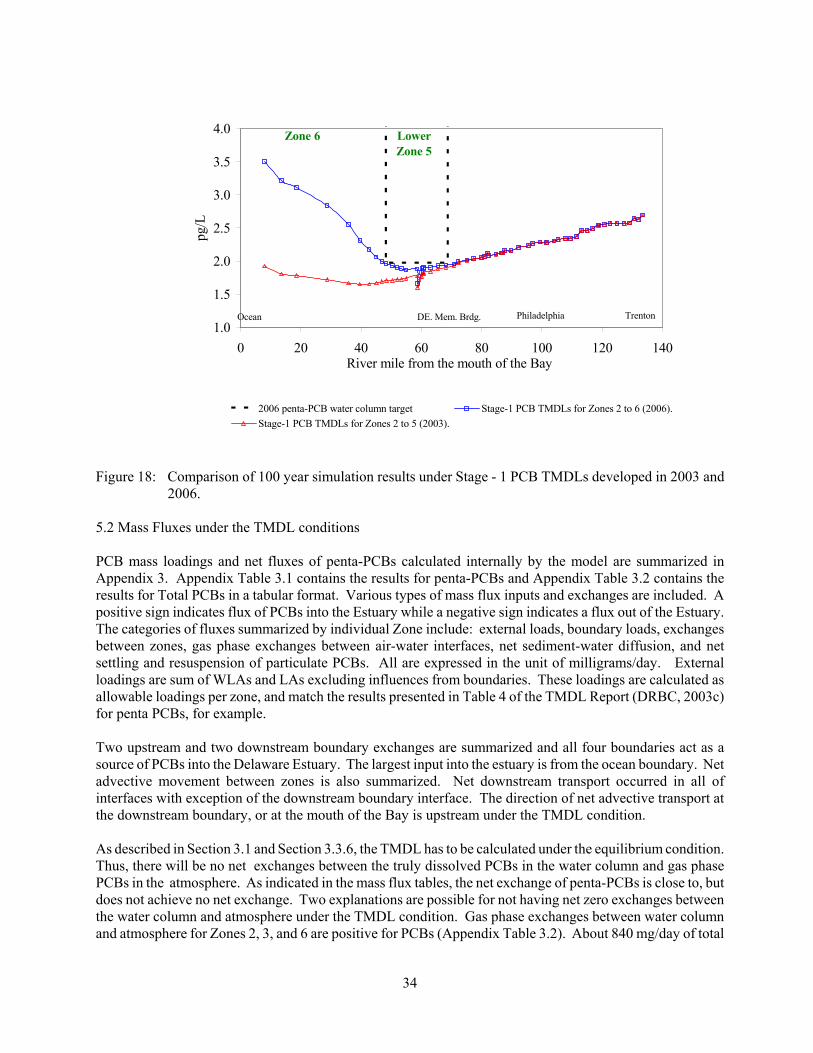
34
1.0
1.5
2.0
2.5
3.0
3.5
4.0
0 20 40 60 80 100 120 140River mile from the mouth of the Bay
pg/L
2006 penta-PCB water column target Stage-1 PCB TMDLs for Zones 2 to 6 (2006).Stage-1 PCB TMDLs for Zones 2 to 5 (2003).
Ocean PhiladelphiaDE. Mem. Brdg. Trenton
Zone 6 Lower Zone 5
Figure 18: Comparison of 100 year simulation results under Stage - 1 PCB TMDLs developed in 2003 and2006.
5.2 Mass Fluxes under the TMDL conditions
PCB mass loadings and net fluxes of penta-PCBs calculated internally by the model are summarized inAppendix 3. Appendix Table 3.1 contains the results for penta-PCBs and Appendix Table 3.2 contains theresults for Total PCBs in a tabular format. Various types of mass flux inputs and exchanges are included. Apositive sign indicates flux of PCBs into the Estuary while a negative sign indicates a flux out of the Estuary.The categories of fluxes summarized by individual Zone include: external loads, boundary loads, exchangesbetween zones, gas phase exchanges between air-water interfaces, net sediment-water diffusion, and netsettling and resuspension of particulate PCBs. All are expressed in the unit of milligrams/day. Externalloadings are sum of WLAs and LAs excluding influences from boundaries. These loadings are calculated asallowable loadings per zone, and match the results presented in Table 4 of the TMDL Report (DRBC, 2003c)for penta PCBs, for example.
Two upstream and two downstream boundary exchanges are summarized and all four boundaries act as asource of PCBs into the Delaware Estuary. The largest input into the estuary is from the ocean boundary. Netadvective movement between zones is also summarized. Net downstream transport occurred in all ofinterfaces with exception of the downstream boundary interface. The direction of net advective transport atthe downstream boundary, or at the mouth of the Bay is upstream under the TMDL condition.
As described in Section 3.1 and Section 3.3.6, the TMDL has to be calculated under the equilibrium condition.Thus, there will be no net exchanges between the truly dissolved PCBs in the water column and gas phasePCBs in the atmosphere. As indicated in the mass flux tables, the net exchange of penta-PCBs is close to, butdoes not achieve no net exchange. Two explanations are possible for not having net zero exchanges betweenthe water column and atmosphere under the TMDL condition. Gas phase exchanges between water columnand atmosphere for Zones 2, 3, and 6 are positive for PCBs (Appendix Table 3.2). About 840 mg/day of total
35
PCBs are volatilized from Zone 6 under the TMDL condition. This magnitude of volatilization flux is about100 times more than that of Zone 2, and more than 1000 times higher than in Zone 5. The reason for the largenet gaseous flux exchanges in Zone 6 are the larger surface area in Zone 6 compared to other water qualitymanagement zones. The surface area normalized gas phase exchange flux are in same order of magnitude asthe flux in Zones 2, 4, and 6. The reason for any existence of net gaseous exchanges under the TMDLcondition is because gaseous PCB concentrations for the atmosphere are calculated and assigned for spatiallyaverage (median) condition for the entire lower bay rather than model segment by segment. In Stage 2 TMDLsdevelopment, the model will be refined so that segment-specific gaseous PCB concentrations can be assignedto achieve true equilibrium conditions.
Pore water diffusion provides a source of PCBs to water column by squeezing the sediment layer when theburial of solids (carbon) and PCBs occurs in the model. Because the model was calibrated to have a net burialof solids at any point of the Estuary in the Stage 1 TMDL development, based on limited core data, thesediment layers act as a net sink for PCBs. Net settling of solids (carbon) causes the net sink for the PCBsunder the TMDL condition. This net settling to the sediment layer provides approximately 25 percent of thetotal assimilative capacity at the critical location in Stage 1 TMDLs for Zones 2 to 5. Solids, or carbondynamics in the model are expected to be refined in Stage 2 TMDLs development utilizing more recent surveyresults.
The mass flux exchange table provides valuable insight of the direction and the magnitude of flux exchangesbetween media when the TMDL condition is met. Under the Stage-1 TMDLs for the Delaware Estuary forZone 2 through Zone 6, PCB loadings are allocated for point and non-point sources including boundaries.These loadings into the Estuary are dissipated to the atmosphere by volatilization and to the sediment layerby net burial to maintain the applicable water quality criteria.
36
6. REFERENCES
Delaware River Basin Commission. 1996. Administrative Manual - Part III, Water Quality Regulations.Delaware River Basin Commission. West Trenton, NJ. October 1996.
Delaware River Basin Commission. 1998. Study of the Loadings of Polychlorinated Biphenyls fromTributaries and Point Sources Discharging to the Tidal Delaware River. Delaware River Basin Commission.West Trenton, NJ. June 1998.
Delaware River Basin Commission. 2002. Administrative Manual, Rules of Practice and Procedure.Delaware River Basin Commission. West Trenton, NJ. May 2002.
Delaware River Basin Commission. 2003a. DYNHYD5 Hydrodynamic Model (Version 2.0) and ChlorideWater Quality Model for the Delaware Estuary. Delaware River Basin Commission. West Trenton, NJ.September 2003.
Delaware River Basin Commission. 2003b. PCB Water Quality Model for the Delaware Estuary (DELPCB).Delaware River Basin Commission. West Trenton, NJ. September 2003.
Delaware River Basin Commission. 2003c. Total Maximum Daily Loads for Polychlorinated Biphenyls(PCBs) For Zones 2 - 5 of the Tidal Delaware River. West Trenton, NJ. December 2003.
Delaware River Basin Commission. 2006. Revised Calibration of the Water Quality Model of the DelawareEstuary for Penta-PCBs and Carbon. Delaware River Basin Commission. West Trenton, NJ. September2006.
Greene R.W. and R.W. Miller. 1994. Summary and Assessment of Polychlorinated Biphenyls and SelectedPesticides in Striped Bass from the Delaware Estuary. Delaware Department of Natural Resources &Environmental Control. Dover, DE. March 1994.
Hauge, P. 1993. Polychlorinated Biphenyl (PCBs), Chlordane, and DDTs in Selected Fish and Shellfish FromNew Jersey Waters, 1988-1991: Results from New Jersey's Toxics in Biota Monitoring Program. NewJersey Department of Environmental Protection. Trenton, NJ. 95pp.
National Oceanic and Atmospheric Administration. 1989. A Summary of Data on Tissue Contamination fromthe First Three Years (1986-1988) of the Mussel Watch Project. NOAA Technical Memorandum NOS OMA49, August 1989.
U.S. Environmental Protection Agency. 1991. Guidance for Water Quality-based Decisions: The TMDLProcess. Office of Water. Washington, D.C. EPA 440/4-91-001.
U.S. Environmental Protection Agency. 1999. Method 1668, Revision A: Chlorinated Biphenyl Congenersin Water, Soil, Sediment, and Tissue by HRGC/HRMS. Office of Water. Washington, D.C. EPA-821-R-00-002. December 1999.
U.S. Environmental Protection Agency. 2000. Methodology for Deriving Ambient Water Quality Criteriafor the Protection of Human Health (2000). Office of Water. Office of Science and Technology. Washington,D.C. EPA-822-B-00-004. October 2000.
U.S. Fish & Wildlife Service. 1991. Assessment of Organochlorine and Metal Contamination in the Lower
37
Delaware River Estuary (AFO-C91-04). U.S. Fish and Wildlife Service, EnvironmentalContaminants Division. Annapolis, MD.
Appendix 1
Point source discharges included in the WLAsfor penta-PCBs for the Zone 6 TMDL
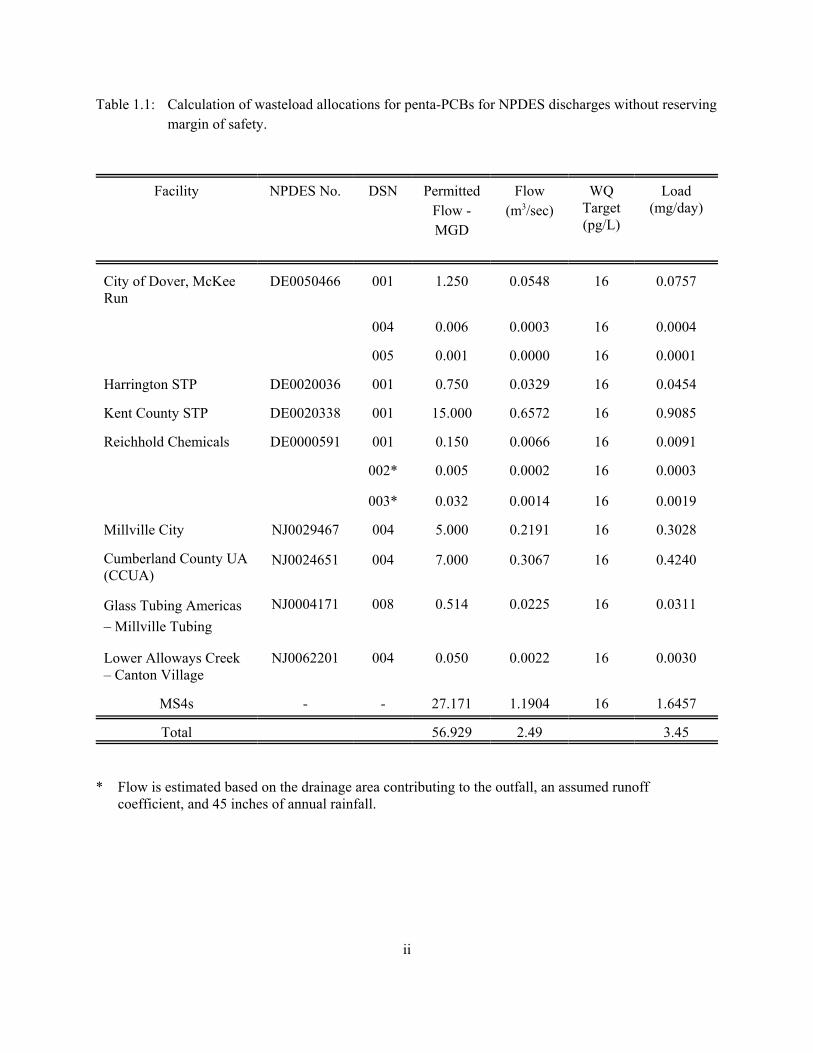
ii
Table 1.1: Calculation of wasteload allocations for penta-PCBs for NPDES discharges without reservingmargin of safety.
Facility NPDES No. DSN PermittedFlow -MGD
Flow(m3/sec)
WQTarget(pg/L)
Load(mg/day)
City of Dover, McKeeRun
DE0050466 001 1.250 0.0548 16 0.0757
004 0.006 0.0003 16 0.0004
005 0.001 0.0000 16 0.0001
Harrington STP DE0020036 001 0.750 0.0329 16 0.0454
Kent County STP DE0020338 001 15.000 0.6572 16 0.9085
Reichhold Chemicals DE0000591 001 0.150 0.0066 16 0.0091
002* 0.005 0.0002 16 0.0003
003* 0.032 0.0014 16 0.0019
Millville City NJ0029467 004 5.000 0.2191 16 0.3028
Cumberland County UA(CCUA)
NJ0024651 004 7.000 0.3067 16 0.4240
Glass Tubing Americas– Millville Tubing
NJ0004171 008 0.514 0.0225 16 0.0311
Lower Alloways Creek– Canton Village
NJ0062201 004 0.050 0.0022 16 0.0030
MS4s - - 27.171 1.1904 16 1.6457
Total 56.929 2.49 3.45
* Flow is estimated based on the drainage area contributing to the outfall, an assumed runoffcoefficient, and 45 inches of annual rainfall.
Appendix 2
Wasteload Allocation Estimates for Municipal Separate Storm Sewer Systems (MS4s) inWatersheds in Delaware and New Jersey that Drain to Zone 6
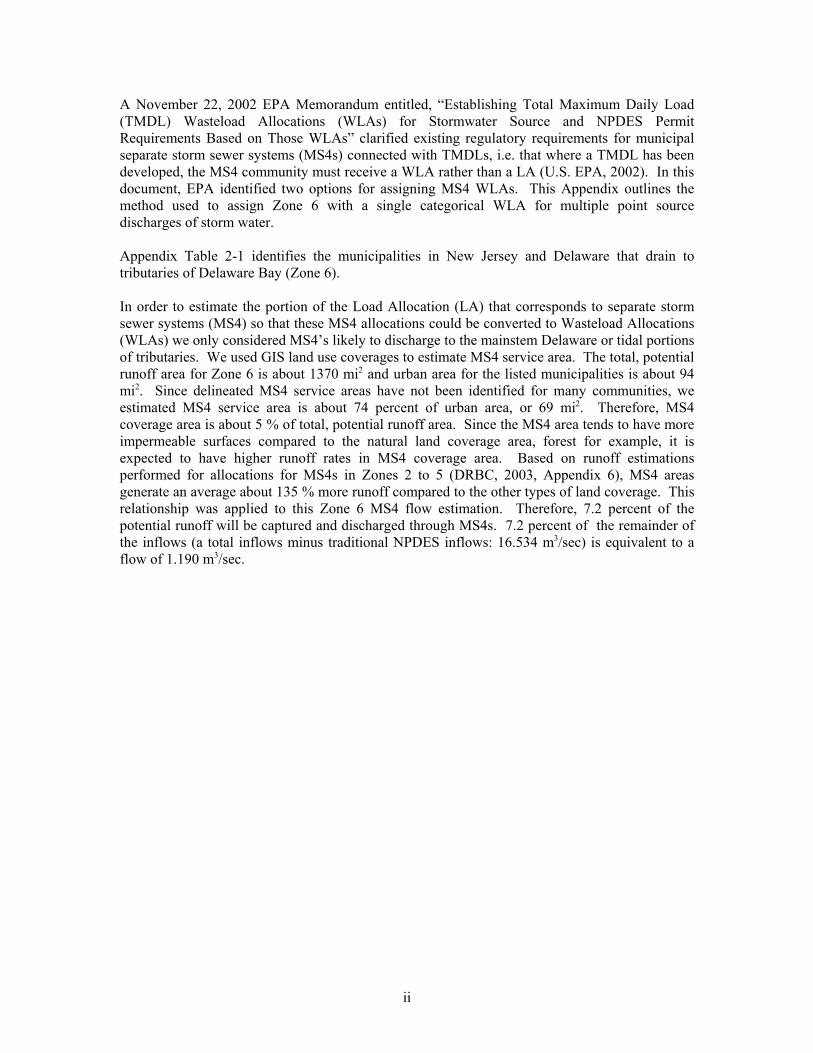
ii
A November 22, 2002 EPA Memorandum entitled, “Establishing Total Maximum Daily Load(TMDL) Wasteload Allocations (WLAs) for Stormwater Source and NPDES PermitRequirements Based on Those WLAs” clarified existing regulatory requirements for municipalseparate storm sewer systems (MS4s) connected with TMDLs, i.e. that where a TMDL has beendeveloped, the MS4 community must receive a WLA rather than a LA (U.S. EPA, 2002). In thisdocument, EPA identified two options for assigning MS4 WLAs. This Appendix outlines themethod used to assign Zone 6 with a single categorical WLA for multiple point sourcedischarges of storm water.
Appendix Table 2-1 identifies the municipalities in New Jersey and Delaware that drain totributaries of Delaware Bay (Zone 6).
In order to estimate the portion of the Load Allocation (LA) that corresponds to separate stormsewer systems (MS4) so that these MS4 allocations could be converted to Wasteload Allocations(WLAs) we only considered MS4’s likely to discharge to the mainstem Delaware or tidal portionsof tributaries. We used GIS land use coverages to estimate MS4 service area. The total, potentialrunoff area for Zone 6 is about 1370 mi2 and urban area for the listed municipalities is about 94mi2. Since delineated MS4 service areas have not been identified for many communities, weestimated MS4 service area is about 74 percent of urban area, or 69 mi2. Therefore, MS4coverage area is about 5 % of total, potential runoff area. Since the MS4 area tends to have moreimpermeable surfaces compared to the natural land coverage area, forest for example, it isexpected to have higher runoff rates in MS4 coverage area. Based on runoff estimationsperformed for allocations for MS4s in Zones 2 to 5 (DRBC, 2003, Appendix 6), MS4 areasgenerate an average about 135 % more runoff compared to the other types of land coverage. Thisrelationship was applied to this Zone 6 MS4 flow estimation. Therefore, 7.2 percent of thepotential runoff will be captured and discharged through MS4s. 7.2 percent of the remainder ofthe inflows (a total inflows minus traditional NPDES inflows: 16.534 m3/sec) is equivalent to aflow of 1.190 m3/sec.
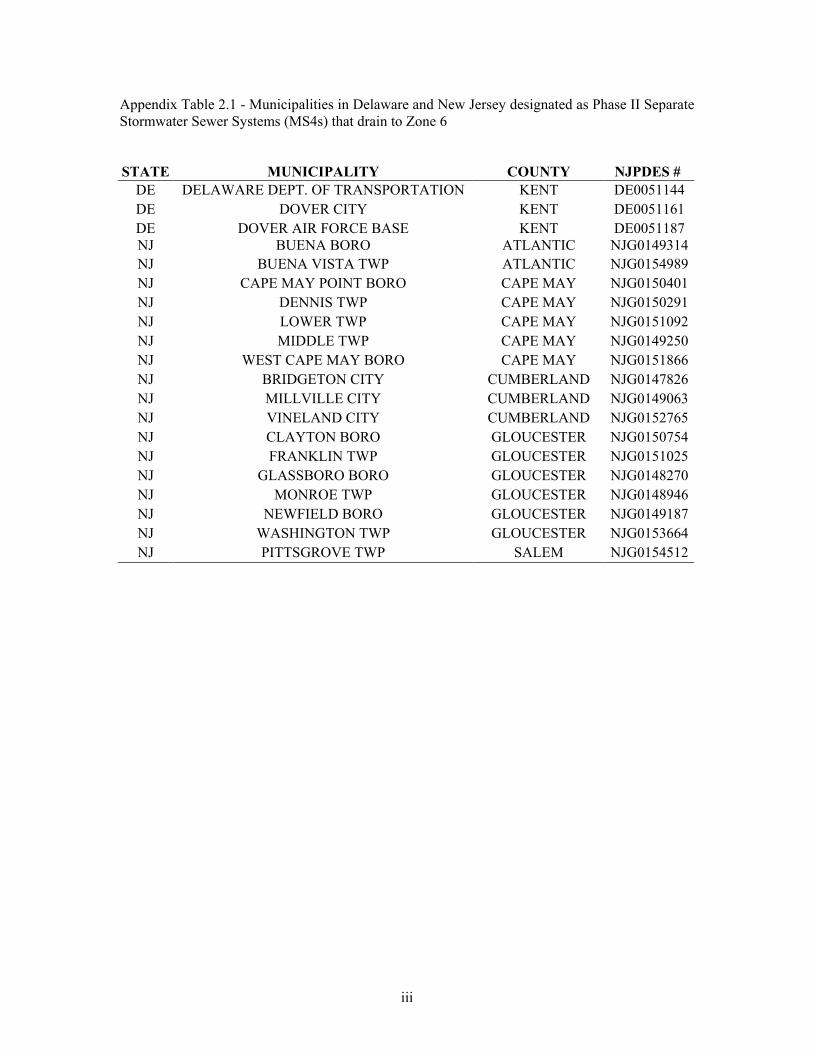
iii
Appendix Table 2.1 - Municipalities in Delaware and New Jersey designated as Phase II SeparateStormwater Sewer Systems (MS4s) that drain to Zone 6
STATE MUNICIPALITY COUNTY NJPDES # DE DELAWARE DEPT. OF TRANSPORTATION KENT DE0051144DE DOVER CITY KENT DE0051161DE DOVER AIR FORCE BASE KENT DE0051187NJ BUENA BORO ATLANTIC NJG0149314NJ BUENA VISTA TWP ATLANTIC NJG0154989NJ CAPE MAY POINT BORO CAPE MAY NJG0150401NJ DENNIS TWP CAPE MAY NJG0150291NJ LOWER TWP CAPE MAY NJG0151092NJ MIDDLE TWP CAPE MAY NJG0149250NJ WEST CAPE MAY BORO CAPE MAY NJG0151866NJ BRIDGETON CITY CUMBERLAND NJG0147826NJ MILLVILLE CITY CUMBERLAND NJG0149063NJ VINELAND CITY CUMBERLAND NJG0152765NJ CLAYTON BORO GLOUCESTER NJG0150754NJ FRANKLIN TWP GLOUCESTER NJG0151025NJ GLASSBORO BORO GLOUCESTER NJG0148270NJ MONROE TWP GLOUCESTER NJG0148946NJ NEWFIELD BORO GLOUCESTER NJG0149187NJ WASHINGTON TWP GLOUCESTER NJG0153664NJ PITTSGROVE TWP SALEM NJG0154512
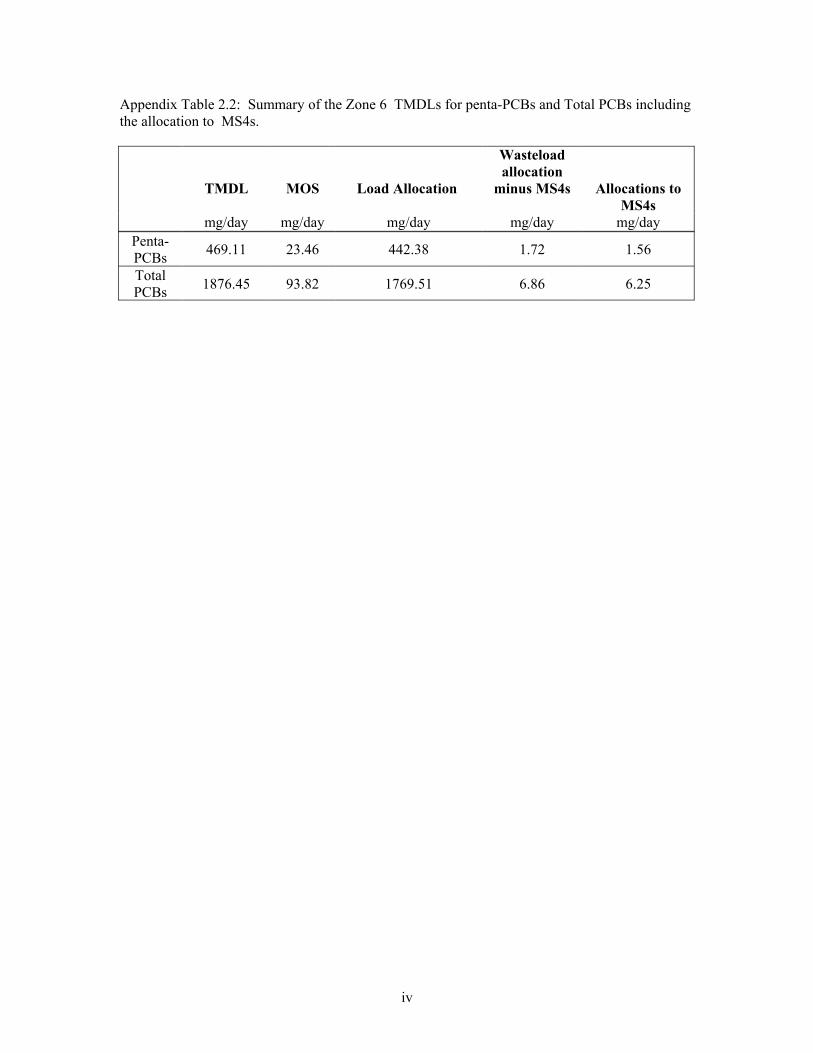
iv
Appendix Table 2.2: Summary of the Zone 6 TMDLs for penta-PCBs and Total PCBs includingthe allocation to MS4s.
TMDL MOS Load Allocation
Wasteloadallocation
minus MS4s Allocations toMS4s
mg/day mg/day mg/day mg/day mg/dayPenta-PCBs 469.11 23.46 442.38 1.72 1.56
TotalPCBs 1876.45 93.82 1769.51 6.86 6.25

Appendix 3
Summary of mass flux exchanges for penta-PCBs and Total PCBs for Zones 2 to 6 under the TMDL conditions
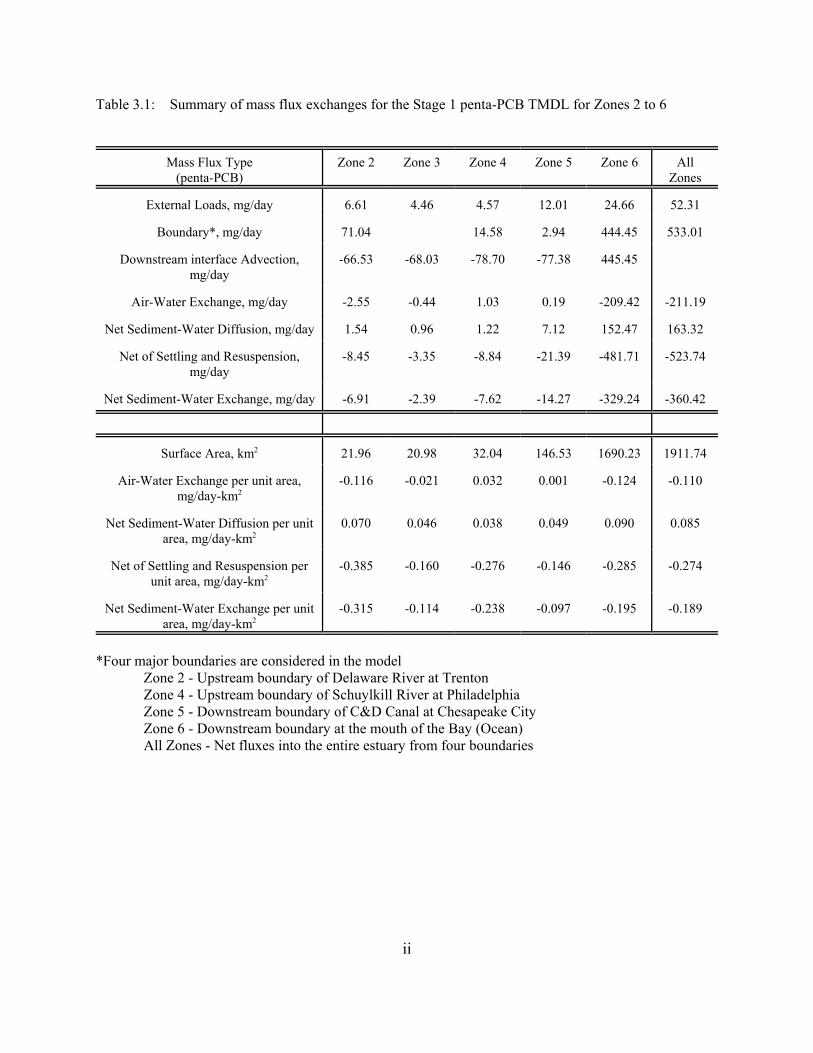
ii
Table 3.1: Summary of mass flux exchanges for the Stage 1 penta-PCB TMDL for Zones 2 to 6
Mass Flux Type(penta-PCB)
Zone 2 Zone 3 Zone 4 Zone 5 Zone 6 AllZones
External Loads, mg/day 6.61 4.46 4.57 12.01 24.66 52.31
Boundary*, mg/day 71.04 14.58 2.94 444.45 533.01
Downstream interface Advection,mg/day
-66.53 -68.03 -78.70 -77.38 445.45
Air-Water Exchange, mg/day -2.55 -0.44 1.03 0.19 -209.42 -211.19
Net Sediment-Water Diffusion, mg/day 1.54 0.96 1.22 7.12 152.47 163.32
Net of Settling and Resuspension,mg/day
-8.45 -3.35 -8.84 -21.39 -481.71 -523.74
Net Sediment-Water Exchange, mg/day -6.91 -2.39 -7.62 -14.27 -329.24 -360.42
Surface Area, km2 21.96 20.98 32.04 146.53 1690.23 1911.74
Air-Water Exchange per unit area,mg/day-km2
-0.116 -0.021 0.032 0.001 -0.124 -0.110
Net Sediment-Water Diffusion per unitarea, mg/day-km2
0.070 0.046 0.038 0.049 0.090 0.085
Net of Settling and Resuspension perunit area, mg/day-km2
-0.385 -0.160 -0.276 -0.146 -0.285 -0.274
Net Sediment-Water Exchange per unitarea, mg/day-km2
-0.315 -0.114 -0.238 -0.097 -0.195 -0.189
*Four major boundaries are considered in the modelZone 2 - Upstream boundary of Delaware River at TrentonZone 4 - Upstream boundary of Schuylkill River at PhiladelphiaZone 5 - Downstream boundary of C&D Canal at Chesapeake CityZone 6 - Downstream boundary at the mouth of the Bay (Ocean)All Zones - Net fluxes into the entire estuary from four boundaries

iii
Table 3.2: Summary of mass flux exchanges for the Stage 1 Total PCB TMDL for Zones 2 to 6
Mass Flux Type(total-PCBs)
Zone 2 Zone 3 Zone 4 Zone 5 Zone 6 AllZones
External Loads, mg/day 26.45 17.82 18.27 48.06 98.65 209.25
Boundary*, mg/day 284.15 58.33 11.76 1777.79 2132.03
Downstream interface Advection,mg/day
-266.12 -272.12 -314.79 -309.52 1777.79
Air-Water Exchange, mg/day -10.20 -1.77 4.16 0.75 -837.68 -844.77
Net Sediment-Water Diffusion, mg/day 6.14 3.86 4.89 28.49 609.90 653.28
Net of Settling and Resuspension,mg/day
-33.81 -13.39 -35.37 -85.56 -1926.82 -2094.94
Net Sediment-Water Exchange, mg/day -27.67 -9.53 -30.48 -57.07 -1316.92 -1441.67
Surface Area, km2 21.96 20.98 32.04 146.53 1690.23 1911.74
Air-Water Exchange per unit area,mg/day-km2
-0.464 -0.084 0.130 0.005 -0.496 -0.442
Net Sediment-Water Diffusion per unitarea, mg/day-km2
0.280 0.184 0.153 0.194 0.361 0.342
Net of Settling and Resuspension perunit area, mg/day-km2
-1.540 -0.638 -1.104 -0.584 -1.140 -1.096
Net Sediment-Water Exchange per unitarea, mg/day-km2
-1.260 -0.454 -0.951 -0.389 -0.779 -0.754
* Four major boundaries are considered in the model:Zone 2 - Upstream boundary of Delaware River at TrentonZone 4 - Upstream boundary of Schuylkill River at PhiladelphiaZone 5 - Downstream boundary of C&D Canal at Chesapeake CityZone 6 - Downstream boundary at the mouth of the Bay (Ocean)All Zones - Net fluxes into the entire estuary from four boundaries