ZD10 (Zigzag Device) Check Book ZD10 (Zigzag Device) Sunstar Precision Co.,Ltd.

Zigzag Kiln Performance Assessment – 2012 &
2013
September 2013
A report prepared by
Greentech Knowledge Solutions, New Delhi (India)
In association with
Enzen Global Solutions, Bangalore (India) University of Illinois, Illinois (USA)
Clean Air Task Force, Boston (USA)
A Shakti Sustainable Energy Foundation Supported Initiative

Project Team
Greentech Knowledge Solutions Pvt. Ltd., New Delhi (India)
Dr. Sameer Maithel, Mr. Dheeraj Lalchandani, Mr. Sonal Kumar, Mr. Prashant
Bhanware, Mr. Sandeep Ahuja
Enzen Global Solutions Pvt. Ltd., Bangalore (India)
Dr. R. Uma, Mr. Vasudev Athalye, Mr. Santhosh Ragavan, Mr. Rashmin Joshi
University of Illinois at Urbana-Champaign, Illinois (USA)
Dr. Tami Bond, Ms. Cheryl Weyant
Clean Air Task Force, Boston (USA)
Ms. Ellen Baum
A Shakti Sustainable Energy Foundation supported initiative
Disclaimer
The views expressed in this publication are those of the authors/project team and do not
necessarily reflect the views of Shakti Sustainable Energy Foundation and
ClimateWorks Foundation. Shakti Sustainable Energy Foundation and ClimateWorks
Foundation do not guarantee the accuracy of the data included in this publication and
do not accept responsibility for the consequences of their use.
For further information, please contact
Dr. Sameer Maithel ([email protected])
Dr. R. Uma ([email protected])
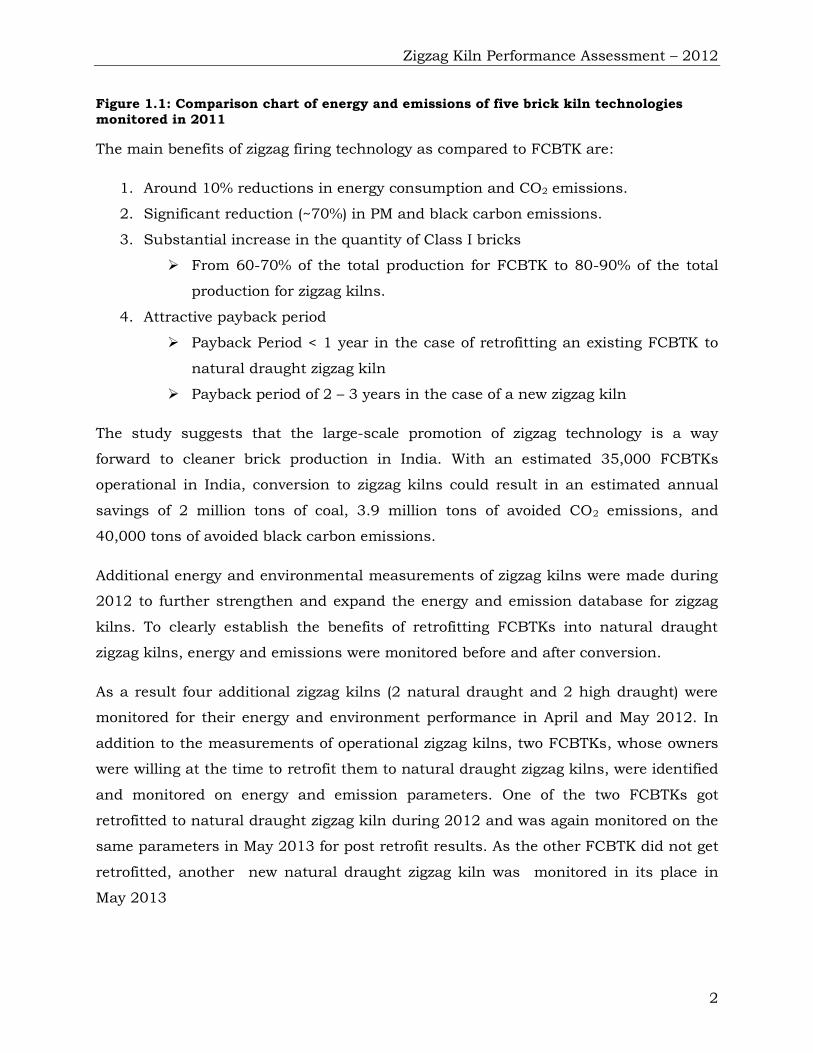
Preface
India is the second largest producer of clay-fired brick in the world, contributing to
more than 10% of the global production. India’s brick sector is characterized as an
unorganized sector. It uses traditional kiln technologies, employs more than 10 million
migratory workers, consumes around 35 Million tons of coal annually, and creates
large amounts of emissions.
Like many traditional unorganized sectors, the clay brick sector has been very slow to
adopt new technology and management practices. However, in recent years, a shortage
of migratory workers due to the employment guarantee scheme of the government of
India, a sharp increase in coal and clay prices, and new regulations on clay mining
and environmental pollution are putting pressure on the brick sector to adopt new
technology and management practices.
With a goal of evaluating various brick kiln technologies and preparing a roadmap for
cleaner brick production in India, a team consisting of Greentech Knowledge Solutions
(GKSPL), Enzen Global Solutions, Entec AG, and the University of Illinois, with
support from the Clean Air Task Force, Shakti Sustainable Energy Foundation, and
Climate Works Foundation, conducted a comprehensive technical and financial
analysis of five brick firing technologies in 2011.
The assessment concluded that the performance of the zigzag firing technology is
superior to the current baseline technology, the fixed chimney bulls trench kiln
(FCBTK) on all important technical and financial parameters. The study suggested
that the large-scale promotion of zigzag firing and the replacement of all FCBTKs with
zigzag fired kilns will be an important step in the transition towards cleaner brick
production. With an estimated 35,000 FCBTKs operational in India, conversion to
zigzag kilns could result in an estimated annual savings of 2 million tons of coal, 3.9
million tons of avoided CO2 emissions, and 40,000 tons of avoided black carbon
emissions.
Additional energy and environmental measurements of zigzag kilns were made during
the years 2012 and 2013 to further strengthen and expand the energy and emission
database for zigzag kilns. To further investigate the benefits of retrofitting FCBTKs into

natural draught zigzag kilns, energy and emissions were monitored before and after
conversion.
Energy and emission monitoring (including black carbon monitoring) of four zigzag
kilns (two natural draught and two high draught) was conducted in April and May
2012. In addition to the measurements of these operational zigzag kilns, two FCBTKs,
whose owners were willing at the time to convert them to natural draught zigzag kilns,
were identified and monitored on energy and emission parameters. One of the two
FCBTKs converted to natural draught zigzag kiln was again monitored on the same
parameters in May 2013 for post conversion results. One new natural draught zigzag
kiln constructed in Bihar was also monitored in May 2013.
This report provides the results of the monitoring conducted on these eight brick kilns
during 2012 and 2013.

Table of Content
Chapter I – Introduction ......................................................................................................... 1 Background ................................................................................................................................. 1 Objective ...................................................................................................................................... 3 Monitored Kilns ........................................................................................................................... 3 Organization Of Report .............................................................................................................. 4
Chapter 2: Introduction to Zigzag Technology ................................................................... 5 The Concept ............................................................................................................................... 5 Main Differences Between Zigzag Kilns And Fcbtk ................................................................ 5 Types Of Zigzag Kiln ................................................................................................................. 6
Chapter 3 - Analysis and Results of Zigzag Kiln ............................................................. 8 Natural Draught Zigzag Kiln ...................................................................................................... 8
General Description Of Kilns ........................................................................................................ 8 Energy Performance ...................................................................................................................... 9 Emissions ..................................................................................................................................... 12 Emission Factors.......................................................................................................................... 14
High Draught Zigzag Kiln ........................................................................................................ 15
General Description Of Kilns ...................................................................................................................... 17 Energy Performance ...................................................................................................................................... 19
Emissions ......................................................................................................................................................... 19
Emission Factors ............................................................................................................................................ 22
Chapter 4 – Analysis and Results of Pre-Conversion Monitoring of FCBTK .............. 23 Energy Performance ............................................................................................................. 24 Emissions ............................................................................................................................... 25 Emission Factors ................................................................................................................... 26
Chapter 5 – Conclusion ........................................................................................................ 30 Energy Performance ................................................................................................................. 30 Environment Performance ........................................................................................................ 31 Financial Performance .............................................................................................................. 34 Summary ................................................................................................................................... 36
Annexure I – Fuel Analysis of the Monitored Kilns ........................................................ 37

Annexure II – Best Practices In Preparation Of Fuel Mix and Fuel Feeding In Natural Draught Zigzag Kiln ............................................................................................... 39
Annexure III – Price Trend Of Coal ................................................................................... 41

Zigzag Kiln Performance Assessment – 2012
1
Chapter I – Introduction
1.1. Background
In 2011, a detailed assessment of brick kiln technologies prevalent in India was
carried out to gain a deeper understanding of the energy utilization and emissions
from current technologies as well as from technologies that offer the promise of cleaner
brick production.
The results of the study were based on detailed energy and emission monitoring of
nine individual brick kilns pertaining to five brick kiln technologies:
1. Fixed Chimney Bulls Trench Kiln Traditional technology
2. Down Draught Kiln Traditional technology
3. Zigzag Kiln Alternate technology
4. Vertical Shaft Brick Kiln Alternate technology
5. Tunnel Kiln Alternate technology
Apart from measuring energy and environment performance, the financial
performance of the individual technologies was also assessed. The assessment
concluded that the performance of zigzag firing technology is superior to the current
baseline technology of fixed chimney bulls trench kilns (FCBTK) on all three
parameters. A comparison of the energy and environment performance is shown in
Figure 1.1.
0
0.5
1
1.5
2
2.5
3
MJ/kg f
ired b
rick
0
0.2
0.4
0.6
0.8
1
1.2
1.4
1.6SPM (g /kg of fired brick)
PM2.5 (g/kg of fired brick)
Zigzag Kiln Performance Assessment – 2012
2
Figure 1.1: Comparison chart of energy and emissions of five brick kiln technologies
monitored in 2011
The main benefits of zigzag firing technology as compared to FCBTK are:
1. Around 10% reductions in energy consumption and CO2 emissions.
2. Significant reduction (~70%) in PM and black carbon emissions.
3. Substantial increase in the quantity of Class I bricks
➢ From 60-70% of the total production for FCBTK to 80-90% of the total
production for zigzag kilns.
4. Attractive payback period
➢ Payback Period < 1 year in the case of retrofitting an existing FCBTK to
natural draught zigzag kiln
➢ Payback period of 2 – 3 years in the case of a new zigzag kiln
The study suggests that the large-scale promotion of zigzag technology is a way
forward to cleaner brick production in India. With an estimated 35,000 FCBTKs
operational in India, conversion to zigzag kilns could result in an estimated annual
savings of 2 million tons of coal, 3.9 million tons of avoided CO2 emissions, and
40,000 tons of avoided black carbon emissions.
Additional energy and environmental measurements of zigzag kilns were made during
2012 to further strengthen and expand the energy and emission database for zigzag
kilns. To clearly establish the benefits of retrofitting FCBTKs into natural draught
zigzag kilns, energy and emissions were monitored before and after conversion.
As a result four additional zigzag kilns (2 natural draught and 2 high draught) were
monitored for their energy and environment performance in April and May 2012. In
addition to the measurements of operational zigzag kilns, two FCBTKs, whose owners
were willing at the time to retrofit them to natural draught zigzag kilns, were identified
and monitored on energy and emission parameters. One of the two FCBTKs got
retrofitted to natural draught zigzag kiln during 2012 and was again monitored on the
same parameters in May 2013 for post retrofit results. As the other FCBTK did not get
retrofitted, another new natural draught zigzag kiln was monitored in its place in
May 2013

Zigzag Kiln Performance Assessment – 2012
3
This report provides the analysis of the results of the measurements of four additional
zigzag kilns and two FCBTKs before conversion monitored during 2012; and of one
natural draft zigzag kiln after retrofitting and one newly constructed natural draught
zigzag kiln, both monitored during 2013.
1.2. Objective
The objective of the study was to carry out a detailed performance assessment of zigzag
kiln technologies and to gain better understanding of the benefits of conversion to
natural draught zigzag kilns from FCBTK.
Greentech Knowledge Solutions Pvt. Ltd. (GKSPL), Enzen Global Solutions Pvt. Ltd.
(Enzen) and the University of Illinois (UoI), with the Clean Air Task Force (CATF),
conducted monitoring of brick kilns during April and May 2012, and in May 2013.
1.3. Monitored Kilns
Four zigzag kilns, two natural draught and two high draught, were monitored on the
following parameters:
➢ Energy performance: Specific Energy Consumption (SEC)
➢ Environment performance: Emission measurements for particulate matter (PM),
black carbon (BC), and selected gaseous pollutants.
To establish the benefits of retrofitting/conversion of FCBTK to natural draught zigzag
kilns, a pre and post conversion monitoring of energy consumption and environment
parameters was conducted.
The salient features of the monitored kilns are presented in Table 1.1.

Zigzag Kiln Performance Assessment – 2012
4
Table 1.1 Salient features of brick kilns monitored during 2012
Type of kiln
Number of
kilns
monitored
Features of monitored kilns
Location Fuel used
Natural Draught Zigzag 4
Varanasi (U.P.) Coal, Sawdust
and Petcoke
Varanasi (U.P.) Coal and
Sawdust
Barh (Bihar)* Coal
Varanasi (UP)** Coal & Sawdust
High Draught Zigzag 2
Howrah (W.B.) Coal
Howrah (W.B.) Coal
FCBTK 2
Varanasi (U.P.) Coal
Varanasi (U.P.) Coal
*newly constructed
**converted from one of the pre-monitored FCBTK
1.4. Organization of Report
The report is organized as follows: Chapter 2 provides an introduction to the zigzag
kiln technology and its types. Chapters 3 and 4 present the analysis and results of the
energy and environment assessment of zigzag kilns and FCBTKs. Chapter 5 concludes
the study by comparing the consolidated results of zigzag kilns with the baseline
technology of FCBTK.

Zigzag Kiln Performance Assessment – 2012
5
Chapter 2: Introduction to Zigzag Technology
2.1. The Concept
The zigzag kiln is an improvement over the FCBTK due to the benefits of its increased
air path.
Straight air flow in FCBTK Zigzag air flow in Zigzag kiln
Figure 2.1: Concept of Zigzag kiln
2.2. Main Differences between Zigzag kilns and FCBTK
1. In a zigzag kiln, air moves in a zigzag path, whereas in an FCBTK, air moves in
a straight path. The length of the zigzag air path is around 3 times longer than
the straight air path. This longer air path, coupled with turbulence imparted by
the zigzag air flow, improves the heat transfer between the bricks and air. The
zigzag air path also facilitates the settling of dust particles in the flue gases by
gravity.
Air flow in Zigzag kiln Air Flow in FCBTK
Figure 2.2: Comparison of air flow in FCBTK and Zigzag kiln

Zigzag Kiln Performance Assessment – 2012
6
2. In a zigzag kiln, the fuel feeding zone is 2 – 3 times longer than in an FCBTK.
This longer firing zone provides more time for mixing fuel and air; turbulence
created by the zigzag air movement also facilitates mixing fuel and air. Better
mixing of fuel and air results in near complete combustion and lower
generation of soot and particulate matter.
Fuel feeding zone in Zigzag Kiln Fuel feeding zone in FCBTK Figure 2.3: Comparison of fuel feeding zone in FCBTK and Zigzag kiln
3. FCBTK is oval or circular in shape, while zigzag kiln is rectangular.
Oval shape of FCBTK Rectangular shape of Zigzag kiln Figure 2.4: Shape of FCBTK and Zigzag kiln
2.3. Types of Zigzag Kilns
Based on the method of producing a draught, zigzag kilns can be classified as natural
draught (in which draught is created by hot gases in the chimney) and high draught
(in which draught is created by a suction fan). A comparison of the two types of zigzag
kilns is provided in Table 2.1

Zigzag Kiln Performance Assessment – 2012
7
Table 2.1 Comparison of natural draught and high draught zigzag kiln
Natural draught Zigzag kiln High draught Zigzag kiln
➢ Operates under a draught of 8-12
mm WG, created due to the
buoyancy effect of hot gases in the
chimney.
➢ No electricity or diesel is required for
operation of the kiln.
➢ Brick setting is less dense.
➢ Height of the chimney is 120’ – 130’.
➢ Uses double and triple zigzag paths.
➢ Operates under a draught of around
50 mm WG, created with the help of
a suction fan.
➢ Electricity or diesel is required to
operate the fan.
➢ Brick setting is very dense.
➢ Height of the chimney is 50’ – 80’ .
➢ Uses only a single zigzag path.
Natural draught Zigzag kiln High draught Zigzag kiln
Figure 2.5: Schematic of natural and high draught Zigzag kiln

Zigzag Kiln Performance Assessment – 2012
8
Chapter 3 - Analysis and Results of Zigzag Kilns
3.1. Natural Draught Zigzag Kiln
General Description of Kilns
Three natural draught zigzag kilns, two located in Varanasi and one in Barh (Bihar),
were monitored. A description of all three kilns is provided in Table 3.1.
Table 3.1: Description of the monitored natural draught zigzag kilns
Kiln 10_ZigzagND Kiln 11_ZigzagND Kiln 16_ZigzagND
Name &
Location
Prayag Clay Products,
Ganeshpur,Varanasi,
UP
Payal Bricks, Aundi,
Varanasi, UP
Pawan Bricks, Barh,
Bihar
Monitoring
dates
13 – 15 April 2012 16 – 18 April 2012 23 – 24 May 2013
Description of
company
➢ The owner is a
second-generation
brick maker
➢ Currently the
company operates
three zigzag kilns,
all natural
draught.
➢ Family business
for last 70 years
➢ The owner is a
second-generation
brick maker
➢ Currently the
company operates
two zigzag kilns,
both natural
draught.
➢ The owner is a
first generation
but very
experienced brick
maker
➢ The kiln was
newly constructed
in 2012
➢ Before
constructing the
new zigzag kiln,
the owner
operated two
FCBTKs
Annual
Production
➢ 4– 5 million
bricks/ year
➢ 4 – 5 million
bricks/ year
➢ 7 – 8 million
bricks/year
Supplying
Market
➢ Majority of the
market in the
radius of 50 km
➢ Varanasi & near-
by areas.
➢ Majority of the
market in the
radius of 50 km
➢ Varanasi & near-
by areas.
➢ Majority of the
market in the
radius of 50 km
➢ Barh & near-by
areas.
Operational
period
➢ Dry months
(December to
June)
➢ Operation period
➢ Dry months
(December to
June)
➢ Operation period
➢ Dry months
(December to
June)
➢ Operation period

Zigzag Kiln Performance Assessment – 2012
9
Kiln 10_ZigzagND Kiln 11_ZigzagND Kiln 16_ZigzagND
is short because
the kiln is open to
air
is short because
the kiln is open to
air
is short because
the kiln is open to
air
Kiln
Description
➢ Converted from
traditional FCBTK
to Zigzag natural
draught 8 years
ago.
➢ Double Zigzag
firing
➢ Kiln trench width:
18’ (5.5 m)
➢ Height of chimney
from the roof of
the kiln: 70’ (21.3
m)
➢ Converted from
traditional FCBTK
to Zigzag natural
draught in 2011.
➢ Double Zigzag
firing
➢ Kiln trench width:
22’ (6.7 m)
➢ Height of chimney
from the roof of
the kiln: 125’
(38.1 m)
➢ Newly constructed
natural draught
zigzag kiln in
2012
➢ Triple Zigzag firing
➢ Kiln trench width:
33’ (10.06 m)
➢ Height of chimney
from the roof of
the kiln: 135.5’
(41.3 m)
Moulding ➢ Hand moulded
solid bricks
➢ Hand moulded
solid bricks
➢ Hand moulded
solid bricks
Firing Fuel Coal, Sawdust,
Petcoke
Coal, Sawdust Coal
Energy Performance
Based on the fuel consumption (kg of fuel consumed per day) and brick production (kg
of bricks fired per day), specific energy consumption (SEC) was computed and is
shown in Table 3.2.
Table 3.2: Specific energy consumption of the monitored natural draught zigzag kiln
Fuel Consumption*
(kg/day) Brick Production
SEC
(MJ/kg
fired brick)
Kiln 10_ZigzagND
Coal Sawdust Petcoke Bricks/day kg/day
1.02
2061 644 468 21600 61920
Kiln 11_ZigzagND Coal Mix of Sawdust &
Coal Bricks/day kg/day 1.02

Zigzag Kiln Performance Assessment – 2012
10
1319 1168 16400 50020
Kiln 16_ZigzagND
Coal Bricks/day kg/day
1.03
3484 20160 61286
*Calorific values of the fuels used in the monitored kilns are provided in Annexure I
The SEC for the three natural draught zigzag kilns are very close to each other and lie
between1.02 – 1.03 MJ/kg of fired bricks. The SEC of the single natural draught
zigzag kiln monitored in 20111, i.e Kiln 3_Zigzag_ND, was 1.2 MJ/kg fired brick. The
higher SEC in 2011 was attributed to the fact that the kiln was monitored during its
first cycle2 of operation when the SEC is highest. The kilns monitored in 2012 and
2013 were in their last firing cycle, when the SEC is lowest.
Specific Energy Consumption of FCBTKs lies in the range of 1.1 - 1.46 MJ/kg fired
brick (average 1.3 MJ/kg fired brick). The lower SEC (1.02 – 1.20 MJ/kg fired brick) in
natural draught zigzag kilns compared to FCBTKs can be attributed mainly to better
heat transfer and more complete combustion.
The details regarding the fuel mix and fuel feeding practices in the first two monitored
natural draught zigzag kilns (Kiln 10_ZigzagND and Kiln 11_ZigzagND) are provided in
Annexure II.
Carbon-monoxide (CO) concentration in the flue gas is an indicator of the combustion
efficiency of the kiln. Figure 3.1 provides a comparison of CO concentrations in the
two monitored natural draught zigzag kilns in 2012 with one of the FCBTKs monitored
in 2011.
1 Brick Kiln Performance Assessment 2011, GKSPL, Enzen Global, University of Illinois & CATF
http://www.gkspl.in/FinalBrick.11Aprl%20Print%20version.pdf 2 The fire in a zigzag kiln moves in a closed circuit. Typically 15-20 days are required for
completing one circuit, which is referred here as one cycle. In a firing season of 180-200
days/year, typically 10 to 12 cycles are completed.

Zigzag Kiln Performance Assessment – 2012
11
Figure 3.1: Comparison of CO concentration in zigzag kilns (measured at the chimney
port in Kiln 10 & 11 and at the bottom of the chimney in Kiln 16) with a typical FCBTK
(measured at the bottom of the chimney)
The CO concentrations in FCBTKs show a large variation with time due to the
intermittent fuel feeding practice and the short combustion zone. The CO
concentrations are higher during the fuel feeding period (reaching a peak of around
3500 ppm) and lower during the non-fuel feeding period (reaching the lowest value of
around 1000 ppm). The average (weighted time average) concentration of CO was
found to be around 1700 ppm. In a natural draught zigzag kiln, the non-feeding
intervals are shorter, with fuel fed almost continuously in small quantities; this along
with turbulence and the longer fuel feeding zone results in more uniform and complete
combustion. Hence large variations in CO concentration are not observed. In the first
two natural draught zigzag kilns, the CO concentration was near to 450 ppm, which is
0
500
1000
1500
2000
2500
3000
3500
4000
4500
5000
11:38 12:00 12:21 12:43 13:04
CO
(ppm
)
Kiln1_FCBTK (2011)
7:04 AM 7:33 AM 8:02 AM
Kiln10_ZigzagND (2012)
19:27 19:42 19:56
Kiln11_ZigzagND (2012)
0.0
500.0
1000.0
1500.0
2000.0
2500.0
3000.0
3500.0
4000.0
4500.0
5000.0
12:21 12:28 12:36 12:43 12:50
Kiln 16_Zigzag ND (2013)

Zigzag Kiln Performance Assessment – 2012
12
~70% less than the average CO concentration of the FCBTK. In the third natural
draught zigzag kiln, the fuel feeding was not as continuous as compared to the first
two kilns, hence a higher CO concentration – 860 ppm – with peaks during charging
periods is observed.
Emissions
A minimum of three samples was collected at each kiln. The samples were collected
from the sampling port located at a height of 11 – 20 m above ground level. Sampling
was done for a period of 30 to 60 minutes, which includes both coal feeding and non-
feeding periods. Prior to sample collection, the temperature and velocity of the flue
gases were measured at the sampling port. Iso-kinetic sampling was followed for
particulate matter sampling. At the same sampling port, a second sampling kit was
used to measure the chemical and optical properties of emitted aerosols and PM2.5.
Aerosol properties (elemental & organic carbon concentrations and PM2.5) were
monitored only on Kilns 10 & 11. Results of the emissions sampling are shown in
Table 3.3.
Table 3.3: Emission concentrations in monitored natural draught zigzag kilns
Kiln 10_ZigzagND Kiln 11_ZigzagND Kiln 16_ZigzagND
Flue gas temperature
(⁰C) 97 95 73
Concentration of pollutants in the flue gas
PM (mg/Nm3) 263
(176 - 339)
255
(227 - 290)
79
(35 – 125)
PM2.5 (mg/Nm3) 15.6
(13.7 – 18.6)
108.6
(96.7 – 124.9) N/A
SO2 (mg/Nm3) 18
(12 - 26)
134
(119 - 149)
1.7
(1.2 – 2.2)
NOx (mg/Nm3) 39
(22 - 50)
19
(19 - 21)
33
(12 – 60)
Note: The single figure in the table above denotes the simple average of the three samples and
the numbers in parentheses provide the minimum and maximum value obtained in three tests.

Zigzag Kiln Performance Assessment – 2012
13
The average PM concentration in the first two monitored natural draught zigzag kilns
is around 260 mg/Nm3, while in the third kiln PM concentrations are much lower – 79
mg/Nm3. The emission standard prescribed by the MoEF for a large category kiln is
750 mg/Nm3. Hence PM emissions in the three natural draught zigzag kilns are much
lower than the prescribed norm of the MoEF.
It may be observed that while PM concentrations for the first two kilns are
comparable, the concentration of PM2.5 in the second kiln is seven times higher than
that of the first. This large variation in PM2.5 concentrations between the two kilns is
explained by the use of different fuel mixes in the front chambers of the firing zone.
The first kiln used sawdust, which burns completely at lower temperatures and hence
results in lower soot, whereas the second kiln used a mixture of coal and sawdust,
which resulted in greater soot formation.
Sulphur content in the fuel mix of Kiln 10_ZigzagND was 0.80%, whereas
Kiln11_ZigzagND had 1.52% sulphur. The use of a high sulphur fuel mix in Kiln
11_ZigzagND resulted in higher concentrations of SO2. The average concentration of
NOX was reported in the range of 19 – 39 mg/Nm3.
Aerosol Properties
Table 3.4 provides measured values of Elemental and Organic Carbon concentrations
obtained from the fraction of particles smaller than 2.5 microns in the stack.
Table 3.4: Scattering and absorption for Red λ and elemental and organic carbon
concentration results for natural draught zigzag kilns
Unit Kiln 10_ZigzagND Kiln 11_ZigzagND
Scattering 1/m 0.03 0.19
Absorption* 1/m N/A N/A
Elemental Carbon mg/Nm3 4.41
(1.66 – 8.83)
6.67
(5.45 – 8.75)
Organic Carbon mg/Nm3 Not detected 1.3
(0 – 1.97)
* Absorption measurements were not conducted in the two kilns

Zigzag Kiln Performance Assessment – 2012
14
The scattering measurements performed at the natural draught zigzag kiln in 2011, i.e
Kiln 3_Zigzag_ND, were inconsistent and might have been affected by measurement
errors. Therefore, present scattering results cannot be compared with 2011 results.
The scattering result in kiln 11, like the PM2.5 result, was also about 7 times higher
than in kiln 10.
The elemental carbon concentrations are within the range of results of the earlier
study3, while the organic carbon concentrations were slightly lower, but within the
uncertainty of the analyser (Sunset Laboratory OC-EC Aerosol Analyser).
Emission Factors
Pollutant emissions vary according to type of kiln, fuel used and operating conditions.
Comparing the emissions across different fuel/operating conditions requires
normalization, either to unit of fuel consumed or to unit of energy consumed, or to
kilograms of fired brick. All emission factors were derived from emission rate (ER), fuel
consumption rate, energy content of the fuel, and production rate.
A summary of the emission factors of various pollutants is presented in Table 3.5.
3 Brick Kiln Performance Assessment 2011, GKSPL, Enzen Global, University of Illinois & CATF
http://www.gkspl.in/FinalBrick.11Aprl%20Print%20version.pdf

Zigzag Kiln Performance Assessment – 2012
15
Table 3.5: Emission factors of pollutants in two monitored natural draught zigzag kilns -
2012
Pollutants g/kg fuel g/MJ g/kg fired brick
Flu
e G
as
Polluta
nts
CO 4.04 0.22 0.22
CO2 1950 100 102
SO2 1.3 0.06 0.06
NOx 0.89 0.05 0.05
Part
icula
te M
att
er PM
PM 6.3 0.32 0.32
PM 2.5 1.76
0.09
0.09
Aero
sol Pro
pert
ies
Elemental Carbon 0.18
0.01
0.01
Organic Carbon 0.02
0.001
0.001
m2/ kg fuel m2/ MJ m2/kg fired
brick Scattering (Red λ) 3.85 0.19 0.19
Absorption (Red λ) N/A N/A N/A
3.2. High/Forced Draught Zigzag Kiln
In India, the zigzag firing concept was first introduced in the form of the high draught
(HD) kiln. The original design was provided by CBRI. In forty years, many
modifications have been made to the original design and several variations of high
draught kilns can be found in the field. The monitored high draught kilns of Howrah
were of modified design.
The original design consisted of a rectangular shaped annular kiln, having 24
chambers. The draught was created by an induced draught fan with a 15 hp motor. A
sketch of the original design is given in figure 3.2 below:

Zigzag Kiln Performance Assessment – 2012
16
Figure 3.2: Original design of High draught Zigzag kiln, Source: CBRI
The small size of the kiln and issues of leakages from the valves were among the major
problems which acted as a catalyst for the modifications in the original design of the
high draught kiln.
In the modified design, the length of the kiln has been increased to 192’ (58.5m) and
an underground flue gas duct is constructed on the central island with a shunt
mechanism to connect fan with kiln, as in figure 3.3. Figure 3.4 shows the actual kilns
that were monitored.
Underground tunnel
Flue passage
Valves
Partition wall made up of green brick
Fan
Source: CBRI.1994
22’
85’ 11’

Zigzag Kiln Performance Assessment – 2012
17
Figure 3.3: Modified design of the monitored high draught zigzag kiln
Figure 3.4 -Monitored Modified High Draught Zigzag kilns, Howrah
General Description of Kilns
Two high draught zigzag kilns, located in Howrah, were monitored. A description of
both kilns is provided in Table 3.6.
170’ 11’
22’
Fan

Zigzag Kiln Performance Assessment – 2012
18
Table 3.6: Description of the monitored high/forced draught zigzag kilns
Kiln 12_ZigzagFD Kiln 13_ZigzagFD
Name & Location LMB Bricks, Panchpara,
Howrah, West Bengal
Bisco Brick Field, Panchpara.
Howrah, West Bengal
Monitoring dates 8 – 11 May 2012 (last firing
cycle)
12 – 14 May 2012 (last firing
cycle)
Description of
company
➢ The owner is an experienced
brick maker known for his
sound technical knowledge
of brick making and for
innovative management
practices
➢ The owner is a second-
generation brick maker
Annual
Production
➢ 4 – 5 million bricks/ year ➢ 4 – 5 million bricks/ year
Supplying
Market
➢ Kolkata, Howrah and near-
by areas
➢ Kolkata, Howrah and near-
by areas
Operational
period
➢ Dry months (December to
May)
➢ Operation period is short
because the kiln is open to
air
➢ Dry months (December to
May)
➢ Operation period is short
because the kiln is open to
air
Kiln Description
➢ Modified high draught design
➢ Kiln is open to air
➢ Kiln trench width: 22’ (6.7m)
➢ Height of chimney: 135’
(41.15 m)
➢ Use of shunt type
mechanism
➢ Modified high draught design
➢ Kiln is open to air
➢ Kiln trench width: 20.5’
(6.25m)
➢ Height of chimney: 105’
(32m)
➢ Use of shunt type
mechanism
Moulding
➢ The main raw-material is silt
from Hooghly river
➢ Hand moulding
o Solid Bricks
➢ The main raw-material is silt
from Hooghly river
➢ Hand moulding
o Solid Bricks
Firing Fuel ➢ Coal ➢ Coal

Zigzag Kiln Performance Assessment – 2012
19
Energy Performance
Based on the fuel consumption (kg of fuel consumed per day) and brick production (kg
of bricks fired per day), the specific energy consumption (SEC) was computed and is
shown in table 3.7.
Table 3.7: Specific energy consumption of the monitored high/forced draught zigzag kiln
Fuel Consumption
(kg/day) Production
SEC
(MJ/kg fired
brick)
Kiln 12_ZigzagFD
Coal Bricks/day kg/day
1.11
3511 20,800 62,348
Kiln 13_ZigzagFD Coal Bricks/day kg/day
0.95
3025 15,750 58,768
The SEC for the two high draught zigzag kilns was measured to be 1.11 and 0.95
MJ/kg of fired bricks respectively. The SEC of the high draught zigzag kiln measured
in the previous study4 of 2011, i.e Kiln 4_Zigzag_FD, was reported to be 1.03 MJ/kg
fired brick, which lies in the range of the presently monitored high draught zigzag
kilns.
In the earlier study FCBTKs reported an SEC in the range of 1.1 - 1.46 MJ/kg fired
brick. The lower SEC of high draught zigzag kilns compared to FCBTKs can be
attributed mainly to better heat transfer and almost complete combustion caused by
high excess air (draught created by fan) coupled with turbulence created due to zigzag
air movement.
Emissions
A minimum of three samples was collected at each kiln. The samples were collected
from the sampling port located at a height of 11 – 20 m above ground level. Sampling
was done for a period of 30 to 60 minutes, which includes both coal feeding and non-
4 Brick Kiln Performance Assessment 2011, GKSPL, Enzen Global, University of Illinois & CATF
http://www.gkspl.in/FinalBrick.11Aprl%20Print%20version.pdf

Zigzag Kiln Performance Assessment – 2012
20
feeding periods. Prior to sample collection, the temperature and velocity of the flue
gases were measured at the sampling port. Iso-kinetic sampling was followed for
particulate matter sampling. At the same sampling port, a second sampling kit was
used to measure the chemical and optical properties of emitted aerosols and PM2.5.
Table 3.8 presents concentrations of the pollutants in the two monitored high draught
zigzag kilns.
Table 3.8: Emission concentrations in monitored high draught zigzag kilns
Kiln 12_ZigzagFD Kiln 13_ZigzagFD
Flue gas temperature (⁰C) 54 72
Concentration of pollutants in the flue gas
PM (mg/Nm3) 71
(51 - 92)
34
(26 - 46)
PM2.5 (mg/Nm3) 37.8
(34.9 – 39.5)
18.5
(4.4 – 32.2)
SO2 (mg/Nm3) 32
(17 - 42)
14
(11 -15)
NOx (mg/Nm3) 27
(20 - 37)
25
(19 - 34)
Note: The single figure in the table above denotes the average of the three samples and the
numbers in parentheses provide the minimum and maximum value obtained in three tests.
The average PM concentration in the two monitored high draught zigzag kilns is 71
and 34 mg/Nm3 respectively. The emission standard prescribed by the MoEF for large
category kiln is 750 mg/Nm3, hence the PM emissions of high draught zigzag kilns are
much less than the prescribed norm of the MoEF.
The earlier study5 of 2011 reported average PM concentration of 183 mg/Nm3 for the
only monitored high draught zigzag kiln located in Varanasi. The present kiln, located
in Howrah, witnessed a more humid climate than that of Varanasi at the time of
monitoring. The recorded relative humidity at the time of monitoring of both the earlier
and the present kiln is shown in Figure 3.5. The water content of green bricks loaded
5 Brick Kiln Performance Assessment 2011, GKSPL, Enzen Global, University of Illinois & CATF
http://www.gkspl.in/FinalBrick.11Aprl%20Print%20version.pdf

Zigzag Kiln Performance Assessment – 2012
21
in a kiln located in a humid climate is higher than that in a dry climate. Also the flue
gas temperature of the earlier monitored high draught zigzag kiln was around 100 –
110 ⁰C, whereas in the presently monitored high draught kilns, the flue gas
temperature is 54 and 72 ⁰C respectively. Low flue gas temperature coupled with high
water content in the flue gas results in a large amount of condensed water in the
chimney, thereby reducing the PM emission because of the scrubbing effect.
Figure 3.5: Recorded average humidity at the time of monitoring the high draught kilns
in 2011 and 2012
Aerosol Properties
Table 3.9 provides measured values of Elemental and Organic Carbon concentrations
obtained from the fraction of particles smaller than 2.5 microns in the stack.
Table 3.9: Scattering and absorption for Red λ and elemental and organic carbon
concentration results for high/forced draught zigzag kilns
Unit Kiln 12_ZigzagFD Kiln 13_ZigzagFD
Scattering 1/m 0.14 0.08
Absorption 1/m 0.03 0.02
Elemental mg/Nm3 5.19 1.14
0%
10%
20%
30%
40%
50%
60%
70%
80%
90%
Kiln 3_ZigzagFD2011
Kiln 12_ZigzagFD2012
Kiln 13_ZigzagFD2012
Rela
tive h
um
idit
y %

Zigzag Kiln Performance Assessment – 2012
22
Carbon
Organic Carbon mg/Nm3 2.2 0.1
Values of real time measured scattering and absorption concentrations, reported in
table 3.9, are in range with the concentrations reported in the earlier study. Due to
lower PM concentrations, elemental and organic carbon concentrations in the
monitored high draught kilns are also lower than the earlier study.
Emission Factors
Pollutant emissions vary according to type of kiln, fuel used and operating conditions.
Comparing the emissions across different fuel/operating conditions requires
normalization, either to unit of fuel consumed, or to unit of energy consumed, or to
kilograms of fired brick. All reported emission factors were derived from emission rate
(ER), fuel consumption rate, energy content of the fuel, and production rate.
A summary of the emission factors of various pollutants is presented in Table 3.10.
Table 3.10: Emission factors of pollutants in monitored high/forced draught zigzag kilns
Pollutants g/kg fuel g/MJ g/kg fired brick
Flu
e G
as
Polluta
nts
CO 22.98 1.20 1.25
CO2 1894 99 102
SO2 1.03 0.05 0.06
NOx 1.21 0.06 0.06
Part
icula
te M
att
er PM
PM 2.36 0.12 0.13
PM 2.5 1.11
0.06
0.06
Aero
sol Pro
pert
ies
Elemental Carbon 0.13
0.01
0.01
Organic Carbon 0.05
0.002
0.003
m2/ kg fuel m2/ MJ m2/kg fired
brick Scattering (Red λ) 4.87 0.25 0.26
Absorption (Red λ) 1.04 0.05 0.06
Zigzag Kiln Performance Assessment – 2012
23
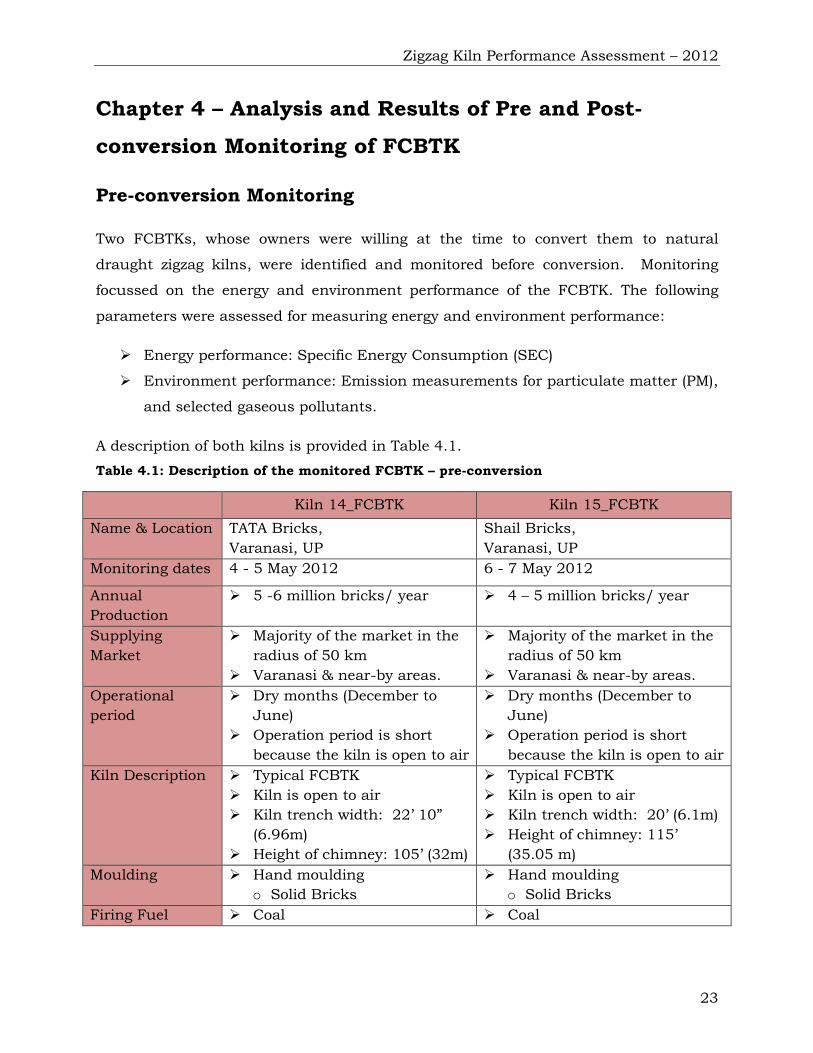
Chapter 4 – Analysis and Results of Pre and Post-
conversion Monitoring of FCBTK
Pre-conversion Monitoring
Two FCBTKs, whose owners were willing at the time to convert them to natural
draught zigzag kilns, were identified and monitored before conversion. Monitoring
focussed on the energy and environment performance of the FCBTK. The following
parameters were assessed for measuring energy and environment performance:
➢ Energy performance: Specific Energy Consumption (SEC)
➢ Environment performance: Emission measurements for particulate matter (PM),
and selected gaseous pollutants.
A description of both kilns is provided in Table 4.1.
Table 4.1: Description of the monitored FCBTK – pre-conversion
Kiln 14_FCBTK Kiln 15_FCBTK
Name & Location TATA Bricks,
Varanasi, UP
Shail Bricks,
Varanasi, UP
Monitoring dates 4 - 5 May 2012 6 - 7 May 2012
Annual
Production
➢ 5 -6 million bricks/ year ➢ 4 – 5 million bricks/ year
Supplying
Market
➢ Majority of the market in the
radius of 50 km
➢ Varanasi & near-by areas.
➢ Majority of the market in the
radius of 50 km
➢ Varanasi & near-by areas.
Operational
period
➢ Dry months (December to
June)
➢ Operation period is short
because the kiln is open to air
➢ Dry months (December to
June)
➢ Operation period is short
because the kiln is open to air
Kiln Description ➢ Typical FCBTK
➢ Kiln is open to air
➢ Kiln trench width: 22’ 10”
(6.96m)
➢ Height of chimney: 105’ (32m)
➢ Typical FCBTK
➢ Kiln is open to air
➢ Kiln trench width: 20’ (6.1m)
➢ Height of chimney: 115’
(35.05 m)
Moulding ➢ Hand moulding
o Solid Bricks
➢ Hand moulding
o Solid Bricks
Firing Fuel ➢ Coal ➢ Coal
Zigzag Kiln Performance Assessment – 2012
24
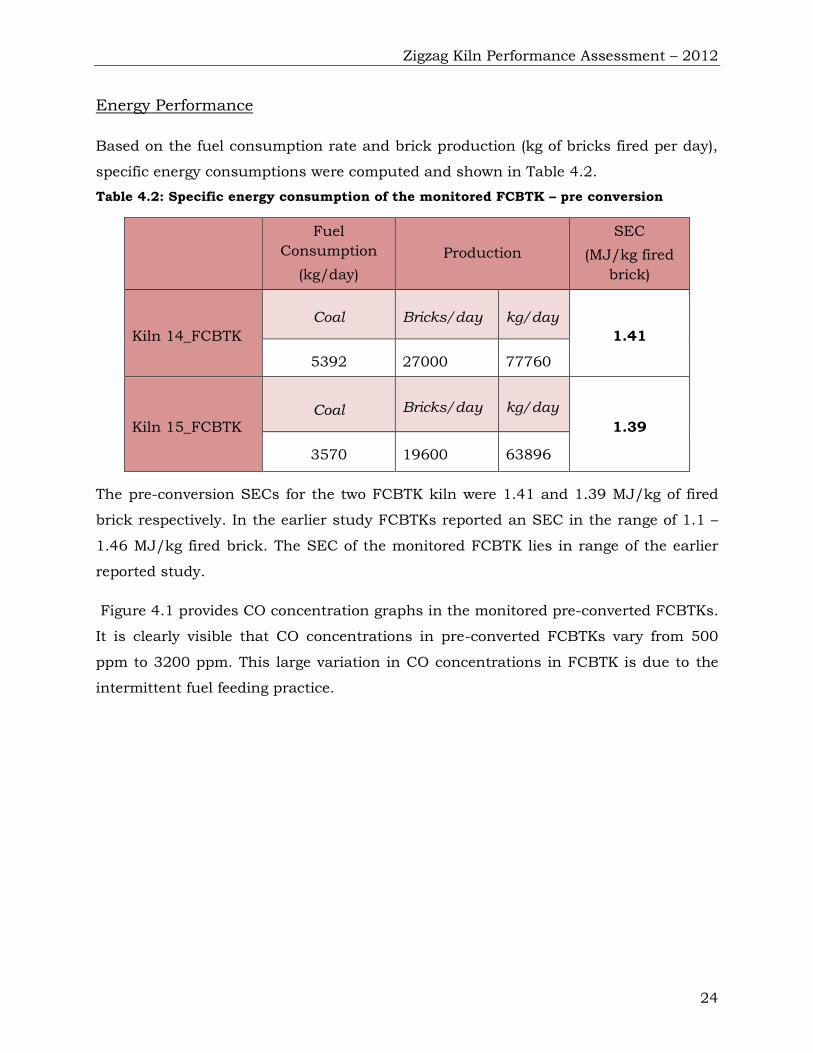
Energy Performance
Based on the fuel consumption rate and brick production (kg of bricks fired per day),
specific energy consumptions were computed and shown in Table 4.2.
Table 4.2: Specific energy consumption of the monitored FCBTK – pre conversion
Fuel
Consumption
(kg/day)
Production
SEC
(MJ/kg fired
brick)
Kiln 14_FCBTK
Coal Bricks/day kg/day
1.41
5392 27000 77760
Kiln 15_FCBTK Coal Bricks/day kg/day
1.39
3570 19600 63896
The pre-conversion SECs for the two FCBTK kiln were 1.41 and 1.39 MJ/kg of fired
brick respectively. In the earlier study FCBTKs reported an SEC in the range of 1.1 –
1.46 MJ/kg fired brick. The SEC of the monitored FCBTK lies in range of the earlier
reported study.
Figure 4.1 provides CO concentration graphs in the monitored pre-converted FCBTKs.
It is clearly visible that CO concentrations in pre-converted FCBTKs vary from 500
ppm to 3200 ppm. This large variation in CO concentrations in FCBTK is due to the
intermittent fuel feeding practice.

Zigzag Kiln Performance Assessment – 2012
25
Figure 4.1: CO charts for the FCBTKs monitored in 2012
Emissions
A minimum of three samples was collected at each kiln. The samples were collected
from the sampling port located at a height of 11 – 20 m above ground level. Sampling
was done for a period of 30 to 60 minutes, which includes both coal feeding and non-
feeding periods. Prior to sample collection, the temperature and velocity of the flue
gases were measured at the sampling port. Iso-kinetic sampling was followed for
particulate matter sampling. Table 4.3 presents concentrations of the pollutants in the
two monitored high draught zigzag kilns.
Table 4.3: Emission concentrations in monitored FCBTK – Before conversion
Kiln 14_FCBTK Kiln 15_FCBTK
Flue gas temperature (⁰C) 98 73
Concentration of pollutants in the flue gas
PM (mg/Nm3) 1255
(251 - 2740)
316
(218 - 397)
SO2 (mg/Nm3) 58
(24 – 96)
284
(157 - 437)
NOx (mg/Nm3) 14
(14 – 17)
19
(18 – 21)
Note: The single figure in the table above denotes the average of the three samples and the
numbers in parentheses provide the minimum and maximum value obtained in three tests.
0
500
1000
1500
2000
2500
3000
3500
4000
4500
5000
18:36 18:50 19:04 19:19 19:33
CO
ppm
Kiln 14_FCBTK
0
500
1000
1500
2000
2500
3000
3500
4000
4500
5000
21:04 21:11 21:18 21:25
CO
ppm
Kiln 15_FCBTK

Zigzag Kiln Performance Assessment – 2012
26
The PM concentration in Kiln 14_FCBTK is around 4 times higher than Kiln
15_FCBTK. The PM concentrations in the flue gases are dependent on excess air in the
kiln and the amount of fuel fed during the sampling time. In Kiln 14_FCBTK, the
excess air was around 260% and during sampling around 480 kg of coal was fed in to
the kiln, whereas in Kiln 15_FCBTK, excess air was 345% and 300 kg of coal was fed
during the sampling time. Due to higher excess air and lower amount of coal feeding
in Kiln 15_FCBTK, the PM concentrations are lower than Kiln 14_FCBTK.
Emission Factors
Pollutant emissions vary according to type of kiln, fuel used and operating conditions.
Comparing the emissions across different fuel and operating conditions requires
normalization, either to unit of fuel consumed or to unit of energy consumed or to
kilograms of fired brick. Emission factors for PM and SO2 were derived from emission
rate (ER), fuel consumption rate, energy content of the fuel, and production rate.
A summary of the emission factors of various pollutants is presented in Table 4.4.
Table 4.4: Emission factors of pollutants in monitored FCBTK – Before conversion
Pollutants g/kg fuel g/MJ g/kg fired brick
CO 27.07 1.16 1.62
CO2 2510 112 156
SO2 6.42 0.27 0.37
PM 25.16 1.18 1.66
Post-conversion Monitoring
The second identified FCBTK, i.e. Kiln 15_FCBTK, deferred the conversion to natural
draught zigzag. Therefore post-conversion monitoring could only be conducted in the
first kiln, i.e. Kiln 14_FCBTK. For the sake of clarity, the converted kiln has been
renamed to Kiln 17_ZigzagND. The following parameters were assessed for measuring
energy and environment performance:
➢ Energy performance: Specific Energy Consumption (SEC)
➢ Environment performance: Emission measurements for particulate matter (PM),
and selected gaseous pollutants.

Zigzag Kiln Performance Assessment – 2012
27
A description of the converted kiln is provided in Table 4.5.
Table 4.5: Description of the post converted natural draught zigzag kiln
Kiln 17_ZigzagND
Name & Location TATA Bricks,
Varanasi, UP
Monitoring dates 27 - 28 May 2013
Annual
Production ➢ 5 -6 million bricks/ year
Supplying
Market
➢ Majority of the market in the
radius of 50 km
➢ Varanasi & near-by areas.
Operational
period
➢ Dry months (December to June)
➢ Operation period is short because
the kiln is open to air
Kiln Description
➢ Double Zigzag natural draught
➢ Kiln is open to air
➢ Kiln trench width: 22’ (6.70m)
➢ Height of chimney: 125’ (38.1m)
Moulding ➢ Hand moulding
o Solid Bricks
Firing Fuel ➢ Coal & Sawdust
Energy Performance
Based on the fuel consumption rate and brick production (kg of bricks fired per day),
specific energy consumption was computed and shown in Table 4.6.
Table 4.6: Specific energy consumption of the natural draught zigzag – post conversion
Fuel Consumption*
(kg/day) Brick Production
SEC
(MJ/kg
fired brick)
Kiln 17_ZigzagND
Coal Sawdust Bricks/day kg/day
1.05
3278 497 27,000 78,840
*Calorific values of the fuels used in the monitored kilns are provided in Annexure I
Zigzag Kiln Performance Assessment – 2012
28
The pre-conversion SEC of the FCBTK kiln was 1.41 MJ/kg of fired brick. After
converting to natural draught zigzag kiln, the energy consumption was reduced by
~25%.
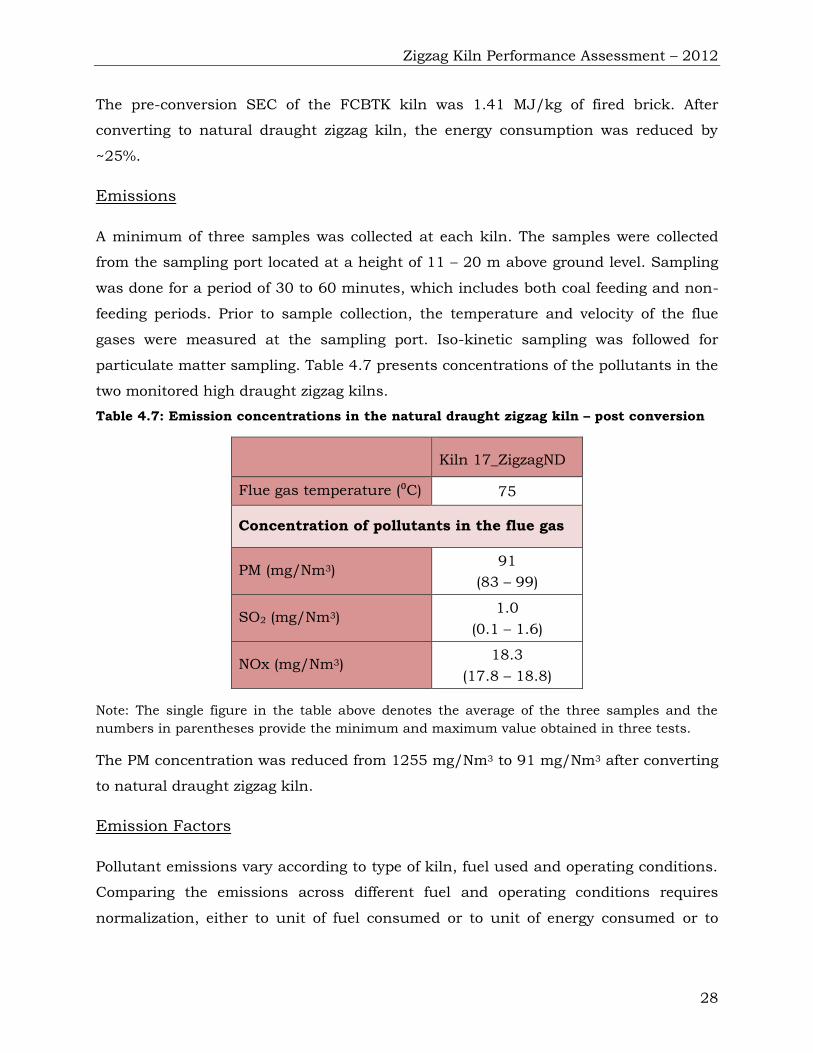
Emissions
A minimum of three samples was collected at each kiln. The samples were collected
from the sampling port located at a height of 11 – 20 m above ground level. Sampling
was done for a period of 30 to 60 minutes, which includes both coal feeding and non-
feeding periods. Prior to sample collection, the temperature and velocity of the flue
gases were measured at the sampling port. Iso-kinetic sampling was followed for
particulate matter sampling. Table 4.7 presents concentrations of the pollutants in the
two monitored high draught zigzag kilns.
Table 4.7: Emission concentrations in the natural draught zigzag kiln – post conversion
Kiln 17_ZigzagND
Flue gas temperature (⁰C) 75
Concentration of pollutants in the flue gas
PM (mg/Nm3) 91
(83 – 99)
SO2 (mg/Nm3) 1.0
(0.1 – 1.6)
NOx (mg/Nm3) 18.3
(17.8 – 18.8)
Note: The single figure in the table above denotes the average of the three samples and the
numbers in parentheses provide the minimum and maximum value obtained in three tests.
The PM concentration was reduced from 1255 mg/Nm3 to 91 mg/Nm3 after converting
to natural draught zigzag kiln.
Emission Factors
Pollutant emissions vary according to type of kiln, fuel used and operating conditions.
Comparing the emissions across different fuel and operating conditions requires
normalization, either to unit of fuel consumed or to unit of energy consumed or to

Zigzag Kiln Performance Assessment – 2012
29
kilograms of fired brick. Emission factors for PM and SO2 were derived from emission
rate (ER), fuel consumption rate, energy content of the fuel, and production rate.
A summary of the emission factors of various pollutants for the post converted kiln is
presented in Table 4.8.
Table 4.8: Emission factors of pollutants in monitored natural draught zigzag kiln – post
conversion
Pollutants g/kg fuel g/MJ g/kg fired brick
CO 4.37 0.2 0.21
CO2 2138 96 101
SO2 0.03 0.001 0.001
PM 1.65 0.07 0.08
Summary
Table 4.9 provides a comparison on energy and emission performance of pre and post
conversion kiln.
Table 4.9: Comparison of energy and emission performance of pre and post converted
kiln
Pre-Conversion Post-Conversion
Energy Performance
Specific Energy Consumption - SEC (MJ/kg of fired brick)
1.41 1.05
Emission performance
PM (g/kg fired brick) 2.63 0.08
CO (g/kg fired brick) 1.09 0.21
CO2 (g/kg fired brick) 164 101
SO2 (g/kg fired brick) 0.12 0.001
Note: The emission factors given in table 4.9 are derived from the measurements of
Kiln 14_FCBTK, whereas emission factors presented in table 4.4 are average emission
factors for Kiln 14_FCBTK and Kiln 15_FCBTK.

Zigzag Kiln Performance Assessment – 2012
30
Chapter 5 – Conclusion
The 2011 performance assessment study of brick technologies concluded that zigzag
kilns are superior to conventional FCBTKs on energy, environment and financial
parameters. In 2012, further monitoring of the two zigzag technologies, natural
draught and high draught, was conducted to further expand the energy and emission
database and strengthen the case for zigzag kilns.
Overall in 2011, 2012 and 2013, five FCBTKs, five natural draught zigzag, and three
high draught zigzag kilns were monitored for their energy and environment
performance. A comprehensive assessment on energy, environment and financial
performance parameters of zigzag kilns over the conventional FCBTK
technology was conducted, based on the results of monitoring of 2011, 2012
and 2013. Subsequent sections of this chapter will discuss the results of the
assessment on each of the three performance indicators.
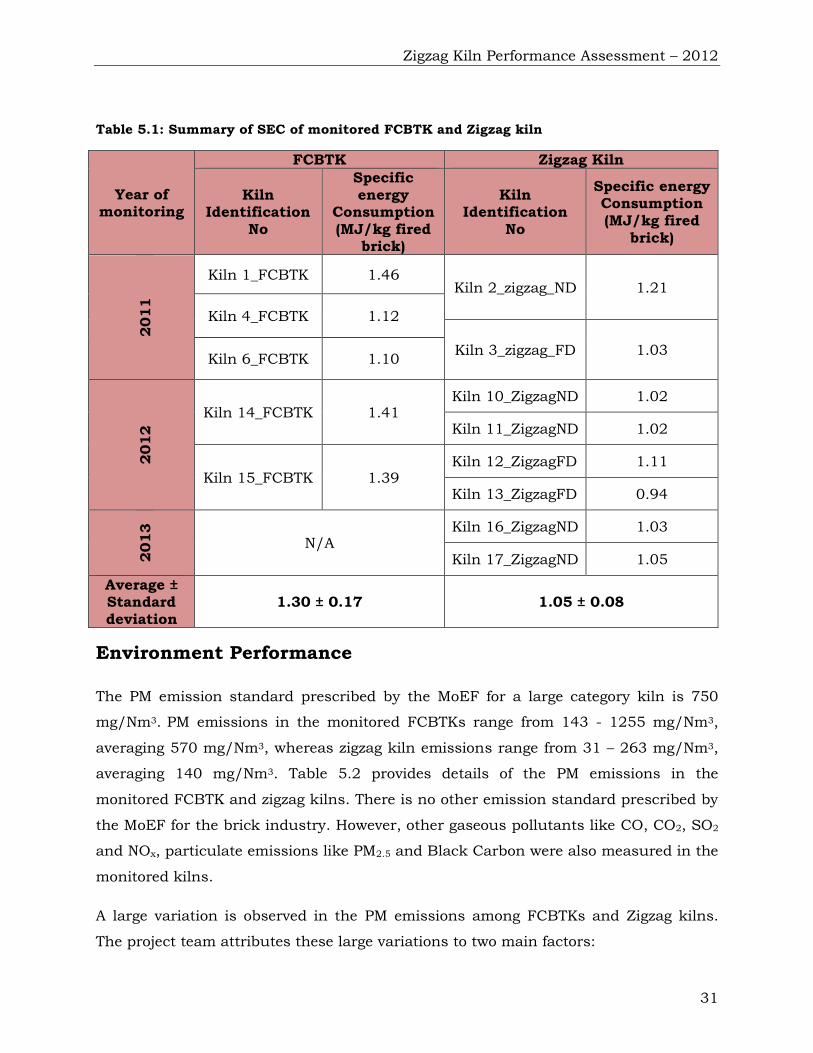
Energy Performance
A summary of the specific energy consumption for the monitored FCBTK and zigzag
kilns is presented in Table 5.1. The average SEC of monitored FCBTK is 1.30 MJ/kg
fired brick whereas the average for the zigzag is 1.05 MJ/kg fired brick. The
monitored results reflect that the zigzag kiln consumes ~20% less energy than
a conventional FCBTK.
Zigzag Kiln Performance Assessment – 2012
31
Table 5.1: Summary of SEC of monitored FCBTK and Zigzag kiln
Year of monitoring
FCBTK Zigzag Kiln
Kiln Identification
No
Specific energy
Consumption (MJ/kg fired
brick)
Kiln Identification
No
Specific energy Consumption (MJ/kg fired
brick)
2011
Kiln 1_FCBTK 1.46 Kiln 2_zigzag_ND 1.21
Kiln 4_FCBTK 1.12
Kiln 3_zigzag_FD 1.03 Kiln 6_FCBTK 1.10
2012
Kiln 14_FCBTK 1.41 Kiln 10_ZigzagND 1.02
Kiln 11_ZigzagND 1.02
Kiln 15_FCBTK 1.39 Kiln 12_ZigzagFD 1.11
Kiln 13_ZigzagFD 0.94
2013
N/A Kiln 16_ZigzagND 1.03
Kiln 17_ZigzagND 1.05
Average ± Standard deviation
1.30 ± 0.17 1.05 ± 0.08
Environment Performance
The PM emission standard prescribed by the MoEF for a large category kiln is 750
mg/Nm3. PM emissions in the monitored FCBTKs range from 143 - 1255 mg/Nm3,
averaging 570 mg/Nm3, whereas zigzag kiln emissions range from 31 – 263 mg/Nm3,
averaging 140 mg/Nm3. Table 5.2 provides details of the PM emissions in the
monitored FCBTK and zigzag kilns. There is no other emission standard prescribed by
the MoEF for the brick industry. However, other gaseous pollutants like CO, CO2, SO2
and NOx, particulate emissions like PM2.5 and Black Carbon were also measured in the
monitored kilns.
A large variation is observed in the PM emissions among FCBTKs and Zigzag kilns.
The project team attributes these large variations to two main factors:

Zigzag Kiln Performance Assessment – 2012
32
a) Operating conditions (mainly type of fuel, fuel feeding rate and excess air)
b) Weather conditions (mainly relative humidity).
Table 5.2: PM emissions in the monitored FCBTK and zigzag kilns
Year of monitoring
FCBTK Zigzag Kiln
Kiln Identification
No
PM (mg/Nm3)
Kiln Identification
No
PM (mg/Nm3)
2011
Kiln 1_FCBTK 766 Kiln 2_zigzag_ND 31
Kiln 4_FCBTK 143
Kiln 3_zigzag_FD 183 Kiln 6_FCBTK 370
2012
Kiln 14_FCBTK 1255 Kiln 10_ZigzagND 263
Kiln 11_ZigzagND 255
Kiln 15_FCBTK 316 Kiln 12_ZigzagFD 71
Kiln 13_ZigzagFD 36
2013
N/A Kiln 16_ZigzagND 79
Kiln 17_ZigzagND 91
Average ± Standard deviation
570 ± 446 126 ± 94
The effect of operating conditions on PM emissions has already been explained in
chapters 3 and 4. The effect of weather can be illustrated by a comparison of PM
emissions between high draught zigzag kilns monitored in Varanasi in 2011 (Kiln
3_Zigzag_FD) and the ones monitored in Howrah in 2012 (Kiln 12_ZigzagFD & Kiln
13_ZigzagFD). The difference between the climates of Varanasi6 and Howrah is
illustrated in Figure 5.1. During the time of monitoring, i.e. during summer months of
March to May, Varanasi has a dry climate (RH mostly <60%) while Howrah has a
humid climate (RH mostly >60%). The PM emission in the high draught zigzag kiln
(Kiln 3_Zigzag_FD) operating in dry conditions at Varanasi is 183 mg/Nm3, whereas
6 As long-term weather data for Varanasi is not available, the weather data for Allahabad which
is the nearest town for which data is available is used; similarly, data for Kolkata is used for
nearby Howrah.

Zigzag Kiln Performance Assessment – 2012
33
those operating in humid conditions at Kolkata have PM emissions of 36 and 71
mg/Nm3.
Emission factors of all the measured pollutants are summarized in table 5.3. It can be
observed that the emission factors of PM and elemental carbon in zigzag kilns
are ~75% and ~85% less than FCBTK respectively.
Fig 5.1 Comparison of humidity between Allahabad and Kolkata during March – May7
7 Based on weather data of Allahabad and Kolkata
http://apps1.eere.energy.gov/buildings/energyplus/cfm/weather_data3.cfm/region=2_asia_wmo_region_2/country=IND/cname=India
0 10 20 30 40 50
Dry Bulb Temperature (°C)
Allahabad (Varanasi)
Relative Humidity (%)
0 10 20 30 40 50
Dry Bulb Temperature (°C)
Kolkata (Howrah)
Relative Humidity (%)

Zigzag Kiln Performance Assessment – 2012
34
Table 5.3: Summary of emission factors of all the measured pollutants in FCBTK &
Zigzag kiln
Pollutants FCBTK
(g/kg fired brick)
Zigzag
(g/kg fired brick)
Flu
e G
as
Polluta
nts
CO 2.00 0.79
CO2 131 102
SO2 0.54 0.12
Part
icula
te M
att
er
PM
PM 1.18 0.23
PM* 2.5 0.18 0.09
Aero
sol
Elemental Carbon* 0.13 0.02
Organic Carbon* 0.010 0.008
*Black carbon monitoring was not carried out on FCBTK monitored in 2012 and zigzag kilns
monitored in 2013.
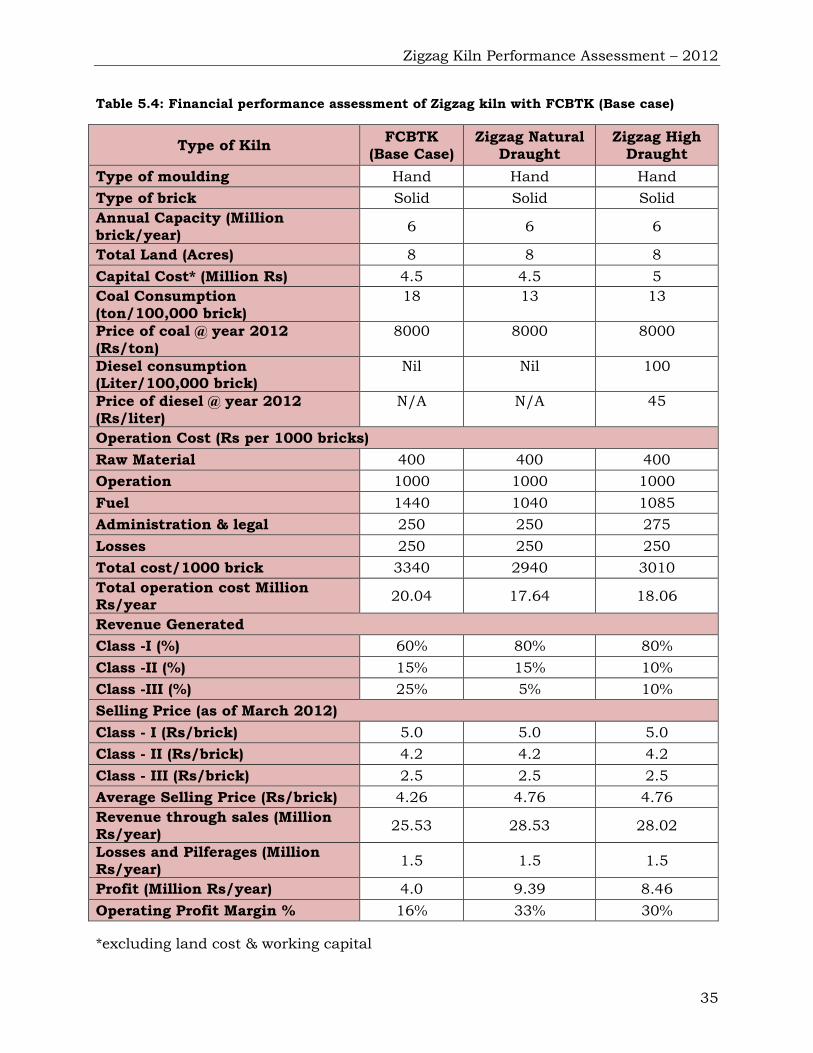
Financial Performance
The financial performance of the zigzag kiln compared to the FCBTK is assessed
considering a typical case of a brick enterprise of North India. General data required
for conducting the assessments was gathered by interviewing the brick kiln owners
operating the respective technologies. Table 5.4 provides details of the financial
performance of FCBTK, zigzag natural draught, and zigzag high draught kilns. The
capital cost of setting up a zigzag natural draught is equivalent to that of an FCBTK,
but the zigzag high draught requires a slightly higher capital investment, because of
the additional component of a fan. The two significant differences between FCBTK and
zigzag kilns are the amount of fuel required and the quality of the bricks produced.
Together, these two factors make for a significant improvement in the profitability of
zigzag kilns over FCBTKs. Table 5.4 states the assumptions and highlights financial
performance assessments.
Zigzag Kiln Performance Assessment – 2012
35
Table 5.4: Financial performance assessment of Zigzag kiln with FCBTK (Base case)
Type of Kiln FCBTK
(Base Case) Zigzag Natural
Draught Zigzag High
Draught
Type of moulding Hand Hand Hand
Type of brick Solid Solid Solid
Annual Capacity (Million brick/year)
6 6 6
Total Land (Acres) 8 8 8
Capital Cost* (Million Rs) 4.5 4.5 5
Coal Consumption (ton/100,000 brick)
18 13 13
Price of coal @ year 2012
(Rs/ton)
8000 8000 8000
Diesel consumption (Liter/100,000 brick)
Nil Nil 100
Price of diesel @ year 2012 (Rs/liter)
N/A N/A 45
Operation Cost (Rs per 1000 bricks)
Raw Material 400 400 400
Operation 1000 1000 1000
Fuel 1440 1040 1085
Administration & legal 250 250 275
Losses 250 250 250
Total cost/1000 brick 3340 2940 3010
Total operation cost Million Rs/year
20.04 17.64 18.06
Revenue Generated
Class -I (%) 60% 80% 80%
Class -II (%) 15% 15% 10%
Class -III (%) 25% 5% 10%
Selling Price (as of March 2012)
Class - I (Rs/brick) 5.0 5.0 5.0
Class - II (Rs/brick) 4.2 4.2 4.2
Class - III (Rs/brick) 2.5 2.5 2.5
Average Selling Price (Rs/brick) 4.26 4.76 4.76
Revenue through sales (Million Rs/year)
25.53 28.53 28.02
Losses and Pilferages (Million Rs/year)
1.5 1.5 1.5
Profit (Million Rs/year) 4.0 9.39 8.46
Operating Profit Margin % 16% 33% 30%
*excluding land cost & working capital

Zigzag Kiln Performance Assessment – 2012
36
Summary
The performance of the zigzag kiln was found to be superior to the FCBTK in terms of
energy, environment and financial parameters. To summarize:
➢ The zigzag kiln consumes ~20% less energy than a conventional FCBTK.
➢ Emission factors of PM and elemental carbon in the zigzag kiln are ~75%
and ~85% less than in the FCBTK respectively.
➢ The fuel savings of the zigzag kilns result in around 10% reduction in
the cost of producing bricks, at the same time that an increase in the
quality of the bricks produced (that is, a higher percentage of class I
bricks) allows for around 10 % increase in the average selling price. The
overall operating profit margin in zigzag kilns is almost double that of
FCBTKs. The retrofitting/conversion of FCBTK to natural draught zigzag
kiln reduces energy consumption by 20 – 25% and cuts down emissions
significantly.
Zigzag Kiln Performance Assessment – 2012
37
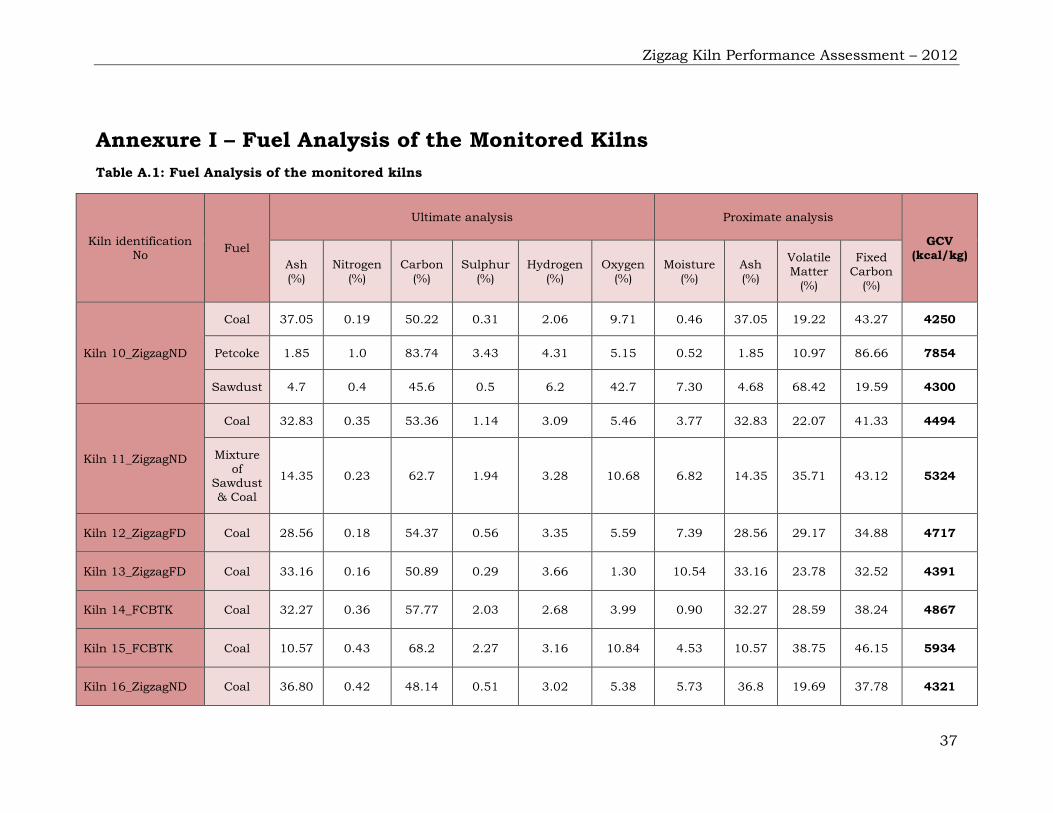
Annexure I – Fuel Analysis of the Monitored Kilns
Table A.1: Fuel Analysis of the monitored kilns
Kiln identification No
Fuel
Ultimate analysis Proximate analysis
GCV (kcal/kg)
Ash (%)
Nitrogen (%)
Carbon (%)
Sulphur (%)
Hydrogen (%)
Oxygen (%)
Moisture (%)
Ash (%)
Volatile
Matter (%)
Fixed
Carbon (%)
Kiln 10_ZigzagND
Coal 37.05 0.19 50.22 0.31 2.06 9.71 0.46 37.05 19.22 43.27 4250
Petcoke 1.85 1.0 83.74 3.43 4.31 5.15 0.52 1.85 10.97 86.66 7854
Sawdust 4.7 0.4 45.6 0.5 6.2 42.7 7.30 4.68 68.42 19.59 4300
Kiln 11_ZigzagND
Coal 32.83 0.35 53.36 1.14 3.09 5.46 3.77 32.83 22.07 41.33 4494
Mixture of
Sawdust & Coal
14.35 0.23 62.7 1.94 3.28 10.68 6.82 14.35 35.71 43.12 5324
Kiln 12_ZigzagFD Coal 28.56 0.18 54.37 0.56 3.35 5.59 7.39 28.56 29.17 34.88 4717
Kiln 13_ZigzagFD Coal 33.16 0.16 50.89 0.29 3.66 1.30 10.54 33.16 23.78 32.52 4391
Kiln 14_FCBTK Coal 32.27 0.36 57.77 2.03 2.68 3.99 0.90 32.27 28.59 38.24 4867
Kiln 15_FCBTK Coal 10.57 0.43 68.2 2.27 3.16 10.84 4.53 10.57 38.75 46.15 5934
Kiln 16_ZigzagND Coal 36.80 0.42 48.14 0.51 3.02 5.38 5.73 36.8 19.69 37.78 4321
Zigzag Kiln Performance Assessment – 2012
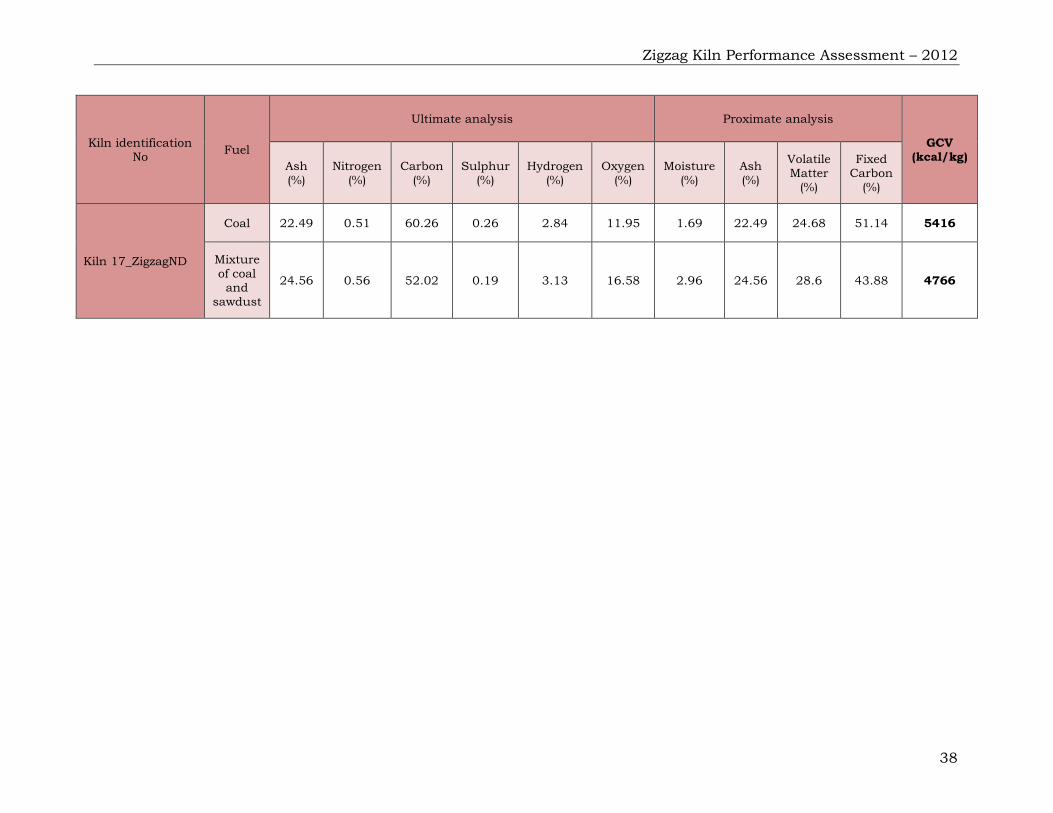
38
Kiln identification No
Fuel
Ultimate analysis Proximate analysis
GCV (kcal/kg)
Ash (%)
Nitrogen (%)
Carbon (%)
Sulphur (%)
Hydrogen (%)
Oxygen (%)
Moisture (%)
Ash (%)
Volatile Matter
(%)
Fixed Carbon
(%)
Kiln 17_ZigzagND
Coal 22.49 0.51 60.26 0.26 2.84 11.95 1.69 22.49 24.68 51.14 5416
Mixture
of coal and
sawdust
24.56 0.56 52.02 0.19 3.13 16.58 2.96 24.56 28.6 43.88 4766
Zigzag Kiln Performance Assessment – 2012
39
Annexure II – Best practices in preparation of fuel mix
and fuel feeding in Natural Draught Zigzag Kiln
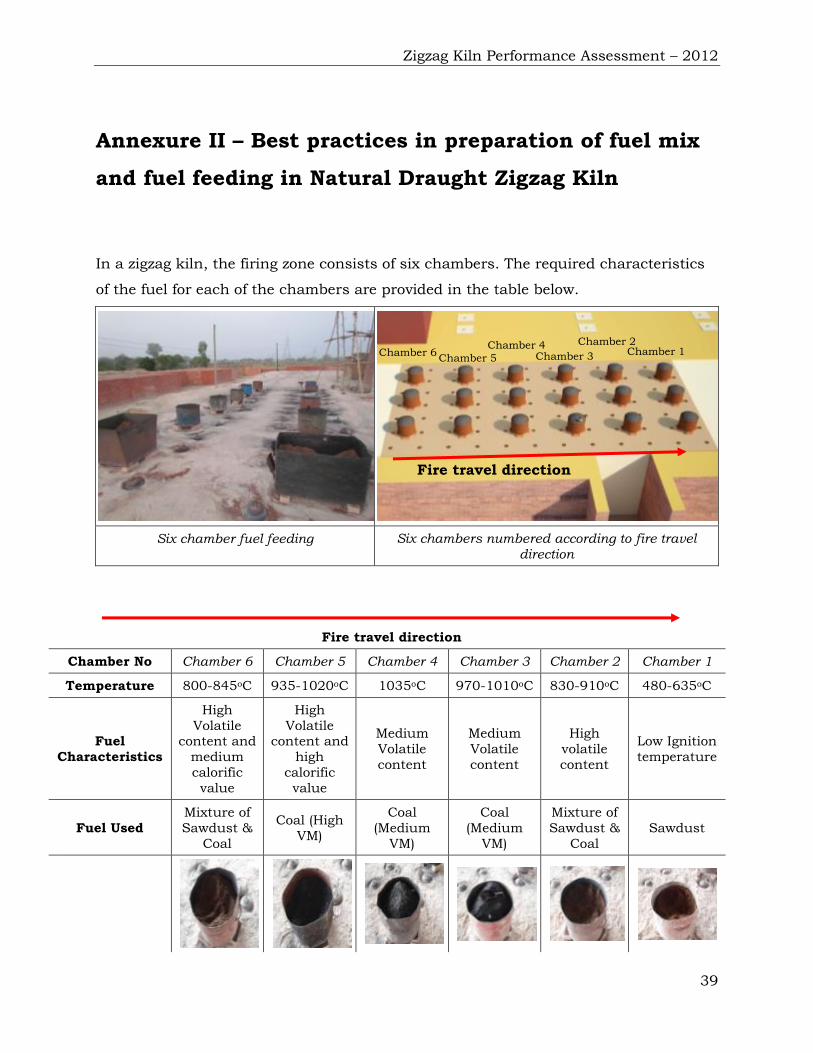
In a zigzag kiln, the firing zone consists of six chambers. The required characteristics
of the fuel for each of the chambers are provided in the table below.
Six chamber fuel feeding Six chambers numbered according to fire travel direction
Fire travel direction
Chamber No Chamber 6 Chamber 5 Chamber 4 Chamber 3 Chamber 2 Chamber 1
Temperature 800-845oC 935-1020oC 1035oC 970-1010oC 830-910oC 480-635oC
Fuel
Characteristics
High
Volatile content and
medium
calorific
value
High
Volatile content and
high
calorific
value
Medium
Volatile
content
Medium
Volatile
content
High
volatile
content
Low Ignition
temperature
Fuel Used
Mixture of
Sawdust &
Coal
Coal (High
VM)
Coal
(Medium
VM)
Coal
(Medium
VM)
Mixture of
Sawdust &
Coal
Sawdust
Fire travel direction
Chamber 1 Chamber 2
Chamber 3 Chamber 4
Chamber 5 Chamber 6
Zigzag Kiln Performance Assessment – 2012
40
In the front chambers (chamber 1 and 2) where the temperature is lower, fuel with low
ignition temperature i.e. sawdust and a mixture of sawdust and coal is used.
Chambers 3, 4 and 5 are the high temperature chambers and therefore coal is used as
the fuel. Chamber 6 is the back chamber; it is fed with either coal or a mixture of coal
and sawdust.
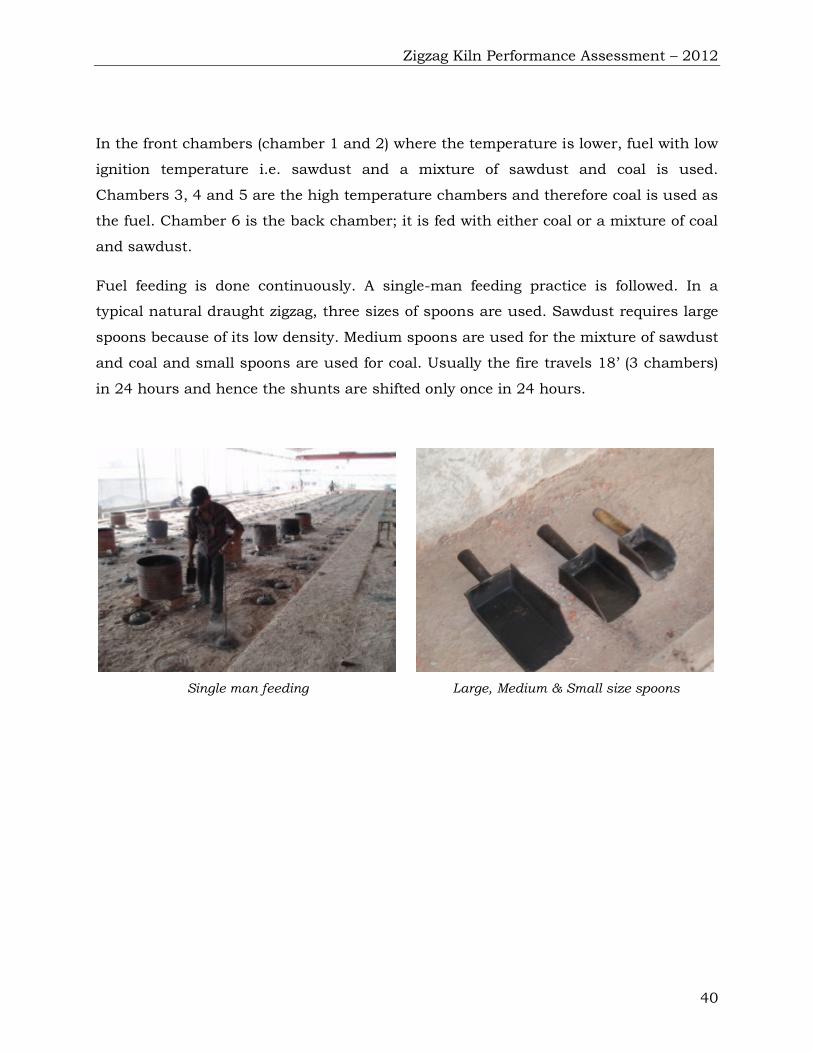
Fuel feeding is done continuously. A single-man feeding practice is followed. In a
typical natural draught zigzag, three sizes of spoons are used. Sawdust requires large
spoons because of its low density. Medium spoons are used for the mixture of sawdust
and coal and small spoons are used for coal. Usually the fire travels 18’ (3 chambers)
in 24 hours and hence the shunts are shifted only once in 24 hours.
Single man feeding Large, Medium & Small size spoons

Zigzag Kiln Performance Assessment – 2012
41
Annexure III – Price trend of Coal
Brick kilns generally purchase coal from the retail market for firing. Coal prices have
increased sharply in the last decade. The data collected from brick owners about the
purchase price of coal show that, in the last eleven years, coal prices have increased 3-
4 times. While, in 2001, coal prices ranged from Rs 950 – 4000 per ton, they rose to
Rs 5000 – 13000 per ton in 2012.
Figure A.3: Price trend of coal 2001 - 2012
0
2000
4000
6000
8000
10000
12000
14000
2001 2012
Co
al
pri
ce -
reta
il m
ark
et
(Rs/
ton
)