ZICA T4 - Economics
255
SECTION A MICROECONOMICS
-
Upload
mongu-rice -
Category
Documents
-
view
1.893 -
download
108
Transcript of ZICA T4 - Economics
SECTION A
MICROECONOMICS

1
CHAPTER 1 INTRODUCTION TO ECONOMICS ____________________________________________________________________________________________ After studying this chapter, the students should be able to: � Appreciate the subject matter of Economics � Explain how Economists derive their theories � Identify the nature of factors of production � Explain the law of diminishing Returns � Explain the relationship that exists between Scarcity, Opportunity Cost and Choice � Understand the basic Economic tables, graphs and models � Explain the Economic systems, their merits and demerits ____________________________________________________________________________ 1.0 INTRODUCTION – THE SUBJECT MATTER OF ECONOMICS Economics comes from the verb ‘to economise’, and this means making ends meet. This is a study of how society makes decisions, regarding the allocation of scarce resources. Economics as a subject is divided into two parts; (a) Microeconomics, which deals with individual economic decision makers or agents, namely households, firms etc. Households as resource owners supply factors of production to firms, and earn an income. In return households demand goods and services produced by firms, and spend their income. Firm in general demand and pay for factors of production from households and in return, supply goods and services at a price, to households. The interaction between the individual decision makers is known as the circular flow of income, it is dealt with in detail at a later chapter.
Economics assumes that these individual economic units behave rationally:
- Firms or producers always try to maximise their profits. - Households or consumers always try to maximise the satisfaction or utility they - derive from their income. - Governments always attempt to maximise the welfare of society
(b) Macroeconomics looks at the total (aggregate) picture, the practical effects of decisions of the Economic units.
Economics as a subject makes use of normative statements of Economic and social value judgments of what society thinks ought to happen in an ideal scenario, such as
Zambia winning the world cup!
Economics is also concerned with positive statements and objective explanations of what has happened in the past, and based on that, what is likely to happen in the future.
2
Economics is a social science subject; it deals with human behaviour, which is diverse. Therefore, it is difficult to come up with blanket conclusions. The assumption, ceteris paribus “all things remain equal”, usually applies. The subject matter of Economics is concerned with human beings “trying to make ends meet with what they have”, the basic Economic problem is that:-
• Human wants are unlimited or insatiable. Maybe because goods wear out and have to be replaced, or, new and improved products become available on the market, or people are just tired of what they own and want a change.
• Economic resources, which are required for the production of goods and services to satisfy human wants, are limited.
The above are the two pillars on which the whole subject matter of Economics rests, the scarcity of resources and the choices that have to be made to try to make ends meet, since not all of our unlimited wants can be satisfied! The scarce economic resources are commonly known, as factors of production and these have to be examined in relation to how they limit production.
1.1 Factors of production
The factors of production are the resources that are necessary for production, and if these were in plentiful supply, there would be no need to economise, and society would have free goods! What affects the rate of Economic growth that an economy can manage is the quantity and the quality of the factors of production they have.
The following are the four different groups into which factors of production are usually classified:
Land This refers to all natural resources such as farmlands, mineral wealth, fishing grounds provision of site where production can take place, and so on. Land differs from other factors of production in three main ways as follows:
1) It is a “gift of nature”, man has done nothing to bring it about. 2) It is limited in supply but man through schemes such as fertilizers, irrigation, better quality
seeds etc can improve it. 3) Since land is in limited supply, Diminishing returns tend to set in early.
The Law of Diminishing Returns.
Diminishing returns refers to a situation where a firm is trying to expand by using more of its
variable factors, but finds that the extra output they get each time they add one more variable
factor to a fixed factor of production such as land, gets progressively less and less. This usually
arises because the capacity of land for example, is limited in the short-run and the combination

3
of the fixed and variable factors becomes less than optimal.
The law, with reference to land, states, “after a certain point, successive application of equal amounts of resources to a given area of land produces less than proportionate return”.
If, for example, a farmer has one hectare of land (fixed factor) and produces the following bags of maize by employing more workers (variable factor).
Number of workers Output per year Addition to Output 1 100 100 2 210 110 3 300 90 4 250 -50
Fig: 1 The law of Diminishing Returns
Output 300
per
year 250
200
150
100
50
0 1 2 3 4
Number of workers
Note that diminishing returns start after the second worker is employed, when the additions to output start to decline from 110 to 90, and eventually being negative. It is no longer worthwhile to employ more workers on only one hectare of land, it costs more to employ than the additional revenue from an additional worker. Additional workers can only be employed when more land is acquired, but this can only be achieved in the long run.

4
Labour This is a human resource, it is human effort employed in production. Labour is considered as the most important economic resource, it is indispensable to all forms of production. It is the end user of everything that is produced. It differs from other factors in that ethical and moral consideration has to be taken into account when dealing with labour. The quantity and quality of labour has to be considered as they both relate to production and productivity. The supply of labour depends on:-
- Total population of a country - Proportion of the population available for employment - Number of hours worked per year
Quality, efficiency or productivity of labour varies, depending on a number of issues, such as
• The climate • Nutrition and health of the worker • Peace of mind • Working conditions • Education and training
Capital
This is composed of man-made aids to production, for example, factory, bridges, machinery, raw materials, means of transportation etc.
Quantity of capital depends on the wealth accumulated from previous production by firms and governments. ‘Wealthy’ or rich firms and governments have a lot of the latest sophisticated equipment, while poor countries have very little, depending on obsolete equipment and few ‘handouts’. The quality of capital is influenced by a nations Economic development and technological progress. Enterprise This is another human resource, but entrepreneurial ability requires organising land, labour and capital for production. It is concerned with decision-making. Therefore, there are two distinct functions of the entrepreneur, uncertainty bearing by supplying risk capital and organizing for production by making decisions on what to produce, how to produce and for whom to produce etc. Such decisions or choices are necessary because factors of production are not only scarce but they also have alternative, competing uses. Choices are made, to satisfy some wants and to forgo other wants. When a choice is made, an alternative has to be given up, this sacrifice is termed as the opportunity cost. Opportunity cost explains the fact that ‘the cost of something is what you have to give up in order to get what you want’ a ‘trade off’. It is the real cost of an action, which is considered as the next best alternative forgone. It usually has a monetary value, but it can also be a choice over the use of time, for example, choosing to watch a movie or to study Economics!

5
1.2 PRODUCTION POSSIBILITY CURVE The relationship between scarcity, choice and the forgone alternative is exhibited by a production possibilities curve or frontier, also known as the transformation curve, opportunity cost curve. It helps to explain the important Economic concept of opportunity cost. To simplify, assume that they are only two commodities, and if the society chooses more of one thing it must necessarily choose less or sacrifice something else, such as more of good X means less of good Y. The production possibility curve for any country is a graph showing the combination of two goods that can be produced using all of its scarce Economic resources in the most efficient manner, given a country’s Economic development and technological progress. Fig: 2 Production Possibility Curve A Good Y B E C D
Good X Any point along the PPF is the maximum of all possible combinations of the two products X and Y. Society can choose a specific combination of output, a single point along the PPF such as point A, B, C, and D. At point A the existing resources are all being used to produce commodity Y and no X is being produced. Alternatively, at point D the economy chooses to produce X without Y, or decide on large quantities of Y and small quantities of X (at point B), or vice versa, at point C. Any point inside the PPF (e.g. point E) or an inward shift to the left, is an indication that the economy is producing beneath its full potential, and therefore operating inefficiently or some resources are lying idle. An inward shift normally occurs when a country is at war and or the economy is contracting. There is no Economic growth. An outward shift to the right, as shown by the dotted lines, shows an increase in the productive capacity of the economy, Economic growth. Economic growth can occur from either better use of existing resources, increased productivity, or effective use of newly acquired inputs or resources, that is increased production. Increased output may also be due to division of labour and specialization.

6
It is important to note that the curve is normally drawn as being concave to the origin, a sign that some resources are well suited to the production of one good rather than another good and vice versa. Otherwise, the PPF would be a straight line slanting downwards from left to right, implying that if production of X reduces by one unit, then the production of Y would increase by one unit, if it reduces by two units, then the production of the other good would increase by two units, and so on. However, that is not the case. The existence of scarcity and choosing between competing ends creates decisions that must be made regarding resource allocation.
• What to produce • How to produce • For whom to produce • Where to produce • How to distribute etc.
Note that factors of production are not only scarce with competing uses, but they can also be specific, if they are of a specialized kind, and therefore cannot be easily used for any other purpose other than that for which they are originally intended. Examples of specific factors are bridges, factories, accountants, and economists, combine harvesters blast furnaces, etc. Alternatively, factors can be non-specific, that is, if a factor can easily be transferred from one use to another. For example, land used for animal grazing, growing maize, unskilled labour, raw materials like cotton is used to make blankets, carpets clothes or small tools like a knife used to cut meat, rope and so on. 1.3 ECONOMIC GROWTH AND ECONOMIC WELFARE When a country’s PPF shifts outwards, to the right, then Economic growth is judged to have taken place. It is measured by a ‘real’ increase in the national income figure. The national income is the total value of goods and services produced in a country in a year. When production is increasing then the economy is growing. Factors determining increases in output are both internal and external. Internal factors include the quantity and quality of a country’s factors of production, the amount of scarce Economic resources available and their productivity. The external factors result from a country’s relationships with the rest of the world, including the terms of trade.. Economic growth is an important subject in that it affects the measurement of Economic welfare, an improvement in the overall standard of living of the people in any country, more goods and services are available. The quality of life in terms of, for example, the life expectancy in Zambia improving to an average of eighty years or above instead of forty years or less! The other advantages of economic growth are an improvement in the social sector, better infrastructure, a lower doctor: patient, teacher: pupil ratio etc. Economic growth maybe balanced or unbalanced, that is some sectors and some areas grow faster than others. In Zambia, the mining, agriculture and tourism sectors as well as the some urban areas are expanding faster than others. Unfortunately, there are a number of disadvantages associated with economic growth. It is associated with a cost, the opportunity cost of diverting resources from present consumption. It

7
also implies that there is faster use of natural resources, it gets depleted quickly. There is need to continuously discover new natural resources to sustain Economic growth. Unfortunately, the wealth is not equally distributed; there is a marked difference between the rich and the poor people in the society. Economic growth also leads to less desirable attitudes, people leading carefree and selfish lifestyles, moving away from extended families to nuclear families in this era of H.I.V/A.I.D.S orphans prevalent in poor countries like Zambia, extended families are needed to assist in looking after orphans. Another problem is social costs, the undesirable effects of modernisation and industrialization as the economy grows. There is increased noise, traffic congestion, and loss of natural beauty, crime, pollution etc. Social benefits may also arise. The social costs and benefits are jointly known as externalities. Externalities are spillover effects, there are external to the transaction. An externality occurs when a cost or benefit of an Economic action is borne or received by society as a whole, and not just the cost to a firm or a benefit to the consumer, it is regarded as the difference between private and social costs, as well as private and social benefits. An example of the private cost and the private benefit to a person drinking a bottle of beer or smoking cigarettes is the actual cost of the items and the enjoyment by the customer. However, this transaction affects society in general through the social cost of drinking and drunkenness, fumes and generally the increased health care provision by the government. The loud music played in bars and enjoyed by the patrons is a private benefit, but, even passersby may enjoy the music. This is a social benefit.
1.4 ECONOMIC SYSTEMS The decisions to the central Economic problems of what to produce, how to produce and for whom to produce depend on the Economic system prevailing in any particular country. To a large extent, the Economic system depends on the political system and the manifesto of the political party that has formed the government. Society gives its mandate as to which political/Economic system they prefer by voting for a particular political party during the general elections. There are three (3) main Economic systems:
a) MARKET ECONOMY Also known as the ‘capitalist system’. This is the kind of Economic system generally characterized by advanced Western countries such as Germany, France, the United Kingdom in the 19th and 20th centuries. During the 20th century there has been rapid technological progress in many countries, many of them becoming capitalists. The features of this system is emphasis on the freedom of the individual or firm, both as a consumer and as the owner of productive resources, to make their own Economic choices on what, how and for whom to produce. In its pure form, there is no government interference in Economic activity, resources are allocated on the basis of price. Price signals facilitate change and show shifts in consumer wants, the concept

8
of consumer sovereignty. A consumer expresses his choice of goods through the price he is willing to pay for the product. The system responds to consumer preferences. There is no or very little wastage of resources.
The system is efficient and self-adjusting, there is an ‘invisible’ hand in the market which helps in the resource allocation. There is technical and Economic efficiency, and most importantly, it is more practical than the socialist system since there is a clear incentive by producers, this is self-interest! DISADVANTAGES
- Marked inequalities in income and wealth distribution. - It ‘suffers’ from market failure, that is failure to produce a satisfactory allocation of
resources - using the market forces of demand and supply for some commodities such as defence,
street lights etc, known as public goods. - Lack of adequate provision of goods considered worth providing in great volumes,
such as education providing in great volumes, such as education and health knowns merit goods.
- There are monopolies instead of competition - There is no guarantee that demand will match supply, there is usually a time lag.
b) PLANNED (COMMAND) ECONOMY This is a ‘socialist’ political system advocated by ‘idealists’, or anyone uncomfortable with the marked inequalities in income, which is a common characteristic of capitalism. In the planned Economic system, the government makes production decisions on what how and for whom to produce on behalf of the community, for the benefit of everyone. An attempt is made to create a new social order, where everyone is happy, and ‘utopianism’. The disadvantages of the market economy correspond closely to the merits of the centrally planned economy. The central planning authority can ensure that
- Adequate resources are devoted to community goods and merit goods. - An attempt is made to distribute resources equally. - There is full utilization of resource, no unemployment of resources. Sometimes, workers are
employed simply to keep them occupied. - Monopoly powers are used in the interest of the community, no self-interest. - There is certainty into production and improving mobility by directing resources, including
labour. - Inefficiencies, which result from competition, are eliminated - Weaker members of the society are well taken care of; their basic needs such as food, clothing
and shelter are met by the government. - Adequate resources are devoted to community

9
DISADVANTAGES - Lack of sensitivity and initiative, and even if the resources are fully employed, they are used
inefficiently. - There is too much bureaucracy. - Errors are easy to make so there are either surpluses (wastage) or shortages, resulting in black
markets. c) MIXED ECONOMIC SYSTEM There are few countries that follow entirely the market or the planned Economic system. Examples of socialist countries are Cuba and North Korea. In practice, most economies in the world make decisions and choices regarding resource allocation by adopting both free market and planned Economic policies. They do not make a complete choice between the two extremes, in order to enjoy the best of both ‘worlds’, thus following the ‘middle of the road’. Economic wealth is divided between the private and the public sectors. The major difference is the extent to which an economy is ‘leaning’ towards a market or a planned Economic system. A good example is Zambia, just after independence from Britain, the country was following a mixed system although the proportion of centrally planned decision making was more than that of the free market. Under the Movement for Multi party Democracy (MMD), the country is more towards capitalism than socialism. Yet it is still maintains a mixed Economic system. A government can have three-quarters of production carried out by private enterprises through the market, while the government is directly responsible for the other quarter. Government involvement is necessary because there is need for public provision of merit goods such as education and health, which are deemed to be worthwhile for everyone. The market forces cannot provide for public goods, such as defence, police, justice and national parks. Government involvement may also be in the form of public deterrence of commodities considered being harmful to society like beer and cigarettes.

10
1.5 CHAPTER SUMMARY The subject matter of Economics is on allocation of scarce resources, how to make ends meet by:-
• Explaining the number of theories, models that make up the principles of Economics; • Emphasizing that human wants are unlimited, while resources required to satisfy these
wants are limited; • Looking at the problem of scarcity of resources (factors of production) which have
competing uses and the related problem of making choices that involve sacrificing alternatives, called opportunity costs;
• Identifying the relationship between resources and Economic growth and Economic welfare;
• Allocating resources using the market system or the planned Economic system, the advantages and the disadvantages of each system;
• Looking at the real world, most economies have a the mixed Economic system; REVIEW QUESTIONS
1. What is the basic Economic problem facing all economies? 2. How would you describe positive and normative Economics? 3. What are the main production decisions that have to be made? 4. What are the four factors of production? 5. What is opportunity cost? 6. What does a production possibilities curve show? 7. How are the decisions and choices on the allocation of resources made in a planned
Economic system? 8. What is an externality? 9. How is actual Economic growth measured? 10. What is unbalanced Economic growth?
---------------------------------------------------------------------------------------------------------
EXAM TYPE QUESTION 1.1 (a)
i) Explain the term “opportunity cost”. (4 Marks) ii) Illustrate with examples the practical importance of this concept with reference to the
individual, the firm and the state (6 Marks) (b)
i) What is the opportunity cost of a non Economic (free) good? (2 Marks) ii) Which of the following are non-Economic goods and why?
- beer
- hedge trimmings

11
- a worn out suit case
- a second hand car
- a NATech Certificate
- sand in the Sahara
- sand in a builders’ yard (8 Marks)
(Total: 20 Marks) EXAM TYPE QUESTION 1.2 a) What is meant by the law of diminishing returns (6 Marks) b) How might the concept of Diminishing Returns be applied in the following cases:
i) Motor car production (2 Marks) ii) Wheat production (2 Marks) iii) Listening to lectures? (2 Marks)
c) How does the market system answer the key Economic questions relating
to the problem of the allocation of resources? (8 Marks)
(Total: 20 Marks)

12
CHAPTER TWO SUPPLY AND DEMAND _______________________________________________________________________________________________ After studying this chapter, the students should be able to: � Explain how decisions are made on what to produce, how to produce and for whom to
produce, how prices act to allocate resources within an economy � Explain Consumer behaviour and demand � Draw standard demand and supply curves � Explain Price determination � Explain why prices change from time to time, the main influences of demand and supply � Distinguish between a change in demand or supply, and a change in the quantity demanded
and supplied � Explain why and how the government intervenes � Explain the effects of government intervention _______________________________________________________________________________ 1.0 INTRODUCTION This chapter deals with how the free market Economic systems deals with the allocation of scarce resources, making choices on what, how and for whom to produce. This emphasis is on the market for goods and services. However, the factor market, which is the market for factors of production, land, labour, capital and enterprise, with the corresponding rewards, rent, wages, interest and profit respectively, works in almost a similar way. A market is where buyers and sellers meet, it does not necessarily mean a geographical location. What determines what and how much of anything to produce is the price, and price results from the operation of demand by buyers and supply from sellers. In a free market, prices, which are basically determined by demand and supply, combine to solve the problem of resource allocation. Prices act as a signal of what people want to buy, indicating to producers where their scarce factors will most profitably be utilized. 1.1 DEMAND Individual demand must be differentiated from wants or desires. Demand refers to the willingness by consumers to own goods, and it must be backed by money, it is therefore, qualified as effective demand. This is the quantity of a product or service that consumers are willing and able to buy at a given price. Emphasis is not only willingness, but this must be supported by the ability to pay. Market demand is the total quantity, which all customers are willing and able to buy at a particular price.

13
1.2 THE DEMAND SCHEDULE There is an inverse relationship between the quantity demanded and price, the amounts that a consumer is willing and able to purchase at various prices at any given time tends to be high at low prices, and low at high prices. Below is Mr Banda’s demand schedule for mangoes in the month of November. Price (K) Quantity demanded (units) 1 000 0 800 3 500 4
300 6 200 10
1.3 DEMAND CURVE When the data above is plotted into a line graph, a demand curve is produced. FIG 3: DEMAND CURVE Price D D Quantity A ‘normal’ demand curve slopes downwards from left to right, due to changes in price. A change in price never shifts the demand curve for any good, it results in a movement along a demand curve. This is a change in the quantity demanded. An increase in price from OP to OP1 causes a contraction in demand from OQ to OQ1. Alternatively, a reduction in price from OP1 to OP results in an extension in the quantity demanded from OQ1 to OQ.

14
Contraction in demand Extension in demand 1.4 UTILITY THEORY The standard shape of a demand curve, downward sloping, explains consumer behaviour with reference to utility theory. Utility is the satisfaction or the benefit derived from consuming a good or a service, and total utility is the total satisfaction. The utility theory assumes that consumers want to maximize the total utility they gain when they buy goods and services, a sign that they are behaving rationally.
In general, when a consumer buys more of a product, the total utility rises, but the marginal utility , which is the satisfaction gained from consuming one additional unit of a product, reduces. For example, if a very thirsty person drinks a glass of water, she will derive a lot of satisfaction from that, but the second glass of water will be less satisfying, by the time she drinks the third and fourth glasses of water, there is very little satisfaction derived from drinking water. This signifies that successive increases in consumption raise total utility but at a diminishing rate, known as diminishing marginal utility. A person is only prepared to pay less for an extra unit bought, more demand is at a lower price! This explains the shape of the demand curve, it slants downwards from left to right, signifying that the lower the price, the higher the quantity demanded and the higher the price the lower the quantity demanded. The normal demand curve is also partly explained by the substitution effect, which occurs due to relative price changes. Changes in the price of goods and services cause consumers to adjust their demand schedules. If the price of a good falls, there is a substitution effect, consumers buy more of that good and less of the other goods because of relative price changes. However, there is also an income effect, as the fall in price increases a consumer’s real income. The consumer is better off, and can buy more of a product, hence increasing demand as price falls. A consumer’s spending of a good is in equilibrium where the marginal utility is equal to price. Therefore the equilibrium for a combination of goods is Marginal utility of good A = MUB = MUC Price of good A PB PC
15
Note that the utility theory has a number of limitations, the important one being that it is subjective, an individual who does not smoke cannot derive any satisfaction from cigarette smoking. For some products such as beer, there is no diminishing marginal utility for some people! In addition, a poor person who is starving can pay dearly for basic foodstuffs, while a rich person will find this negligible in terms of price and utility.
1.5 A CHANGE IN DEMAND Demand curves shift only if there is a change in the conditions of demand other than price. The following are the main influences on demand:
• Household income An increase in income leads to an increase in the demand for goods and services, known as ‘normal’ goods. These are expensive, luxurious products. Demand falls when there is a reduction in income, indicating a positive relationship between household income and most goods and services.
• For some products, there is an inverse relationship between household income and demand.
Demand is high only when household income is low. Goods, whose demand decreases when income is high, are known as ‘inferior ’ goods. Examples are black and white television sets, cheap wine, some vegetables etc.
• The price of other goods
`This can either be substitute or competitive goods, those goods that are interchangeable, are competing with each other. Examples are margarine is a substitute for butter, and tea is a substitute for coffee. Different brands of tea, coffee and different cellular phone service providers like Celtel, Telecel and Zamtel are very close substitutes of each other!
• For substitute goods, a change in the price of one good causes a change in the demand for
the other good. Suppose there is an increase in the price of butter, the demand for margarine is likely to increase as consumers will switch to margarine, which will appear relatively cheaper.
• The other goods can also be complementary goods or those goods that are jointly
demanded such as cars and fuel, or cell phones and sim cards.
• For complementary goods, a change in the price of one good also causes a change in the demand for the other good, however, an increase in the price of motor vehicles causes a reduction in the demand for fuel.
• There is an increase in demand for herbal medicines because of the complexities of the
H.I.V A.I.D.S. scourge.

16
• Population An increase in population creates a larger market for goods and services, demand increases and vice versa.
• Price expectations
Expectations of future price increases in a commodity results in an increase in demand, the idea is to purchase a lot of goods at the current ‘low’ price and ‘beat’ future price increases.
• A change in demand is a shift in the whole demand curve either to the right or to the left,
indicating an increase or a decrease in demand respectively. Price D2 D1 D Quantity In the diagram above, a decrease in demand shifts the demand curve to the left from DD to D1D1 and an increase in demand would shift the demand curve to the right from DD to D2D2 2.0 SUPPLY Supply must be differentiated from production, which is the total value of goods in stock. Supply is the amounts of a good producer are willing and able to sell at a given price.
2.1 THE SUPPLY SCHEDULE There is a positive relationship between the quantity supplied and price. The amounts that producers or sellers are willing and able to sell at various prices at any given time tend to be high at high prices, and low at low prices. Below is Ms Chanda’s supply schedule in the month of November. Price (K) Quantity supplied (units)
1 000 0 800 3 500 4
300 6 200 10
17
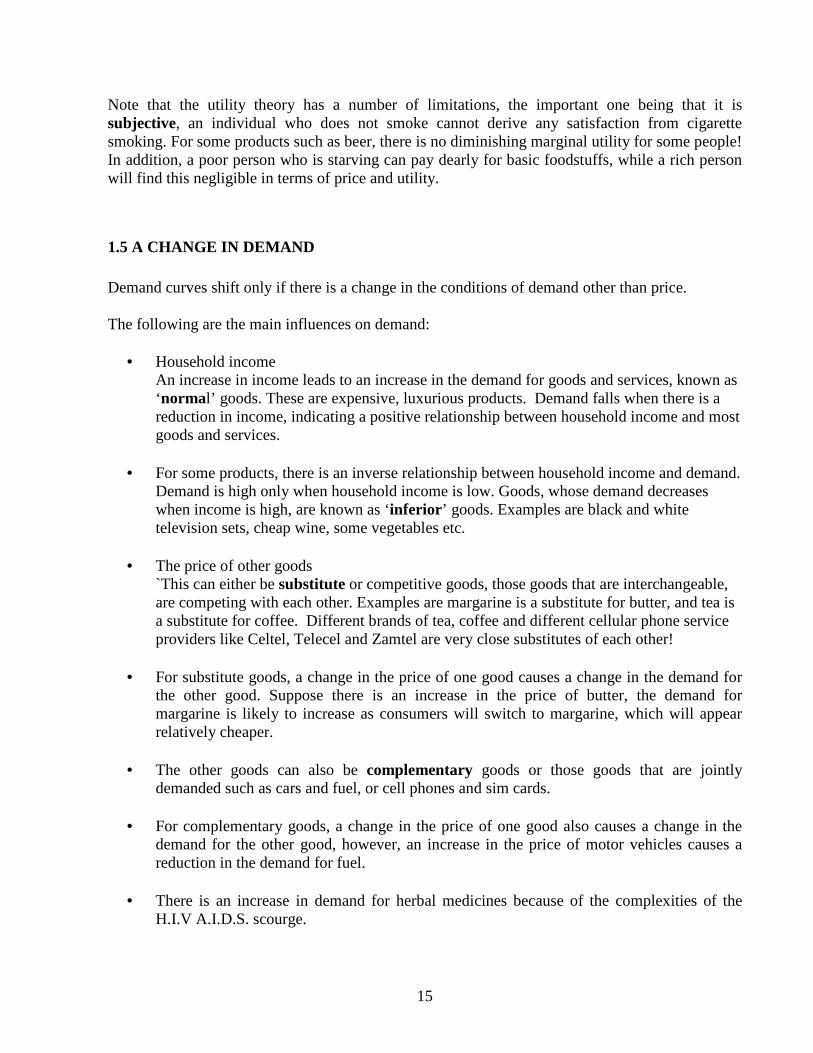
2.2 SUPPLY CURVE When the data above is plotted into a line graph, a supply curve is produced.
Price S S Quantity A ‘normal’ supply curve slopes upwards from left to right, an indication that at high prices, supply is high, while at low prices, supply is also low. A change in price never shifts the supply curve for any good, it results in a movement along a supply curve. This is a change in the quantity supplied. An increase in price from OP to OP1 results in an extension in supply from OQ to OQ1. Alternatively, a reduction in price from OP1 to OP results in a contraction in the quantity supplied from OQ1 to OQ.
Price
P1 P P P1 0 Q Q1 Quantity Q1 Q 2.3 A CHANGE IN SUPPLY The supply curve shifts only if there is a change in the conditions of supply either than price. If supply conditions change, a different supply curve must be drawn, unlike a change in the quantity supplied due to price changes,

18
The following are the main influences on supply:
- Cost of production A rise in costs generally decreases the amount of a commodity being supplied to the market, since firms cannot continue in business for long if they are failing to cover the costs of production. Low costs encourage production and therefore increases the supply of goods and services.
- Technological changes
Improvements in technology lead to more efficient production a method that reduce production cost per unit and therefore increases supply. Obsolete technological has the opposite effect.
- Weather conditions
For agricultural goods, natural disasters like floods, droughts or favorable weather conditions can reduce or increase the supply respectively.
- Prices of other goods
The goods can be either substitute goods or those that are jointly supplied.
- Suppose it is easy to shift resources into the production of other goods, then an increase in the producer price of one maize would lead to an increase in the production and supply of maize, and a decrease in the production and supply of groundnuts.
- An increase in the price of a good such as beef, would lead to an increase in its supply. In
addition, the supply of leather would also increase.
- Government policy, such as taxes and subsidies Taxes are treated as costs, subsidies are benefits to a firm. An increase in taxes reduces supply, while a reduction in taxes tends to increase the supply. A subsidy is when the government pays part of the costs in order to encourage the production of goods. Increased production increases supply.
- Other factors
Industrial and political unrest in the form of work stoppage, strikes, fire, wars, riots etc, can lead to a reduction in supply.
- A change in supply is a shift in the whole supply curve either to the right or to the left, an indication of an increase or a decrease in supply respectively.

19
In the diagram below, a decrease in supply shifts the supply curve to the left from SS to S1S1 and an increase in supply shifts the supply curve to the right from SS to S2S2. Price S1 S S2 S1
S S2
Quantity 4.0 PRICE DETERMINATION The equilibrium market price is the price at which consumers want to buy equals the price at which producers want to sell. Consumers and producers both act rationally. Consumers want to maximize their utility and therefore want to purchase goods as cheaply as possible, while producers also act rationally and aim at profit maximization, they charge high prices. The equilibrium market price therefore is determined by the interaction of the market forces of demand and supply. The point where the demand and supply curves intersect is the compromise price, both consumers and producers are satisfied at this point. Consumers are willing and able to purchase OQ quantities at price OP, while Producers are also willing and able to supply OQ quantities at price OP, as shown in the diagram below. Price D S P S D O Q Quantity

20
At the equilibrium price, there are neither surpluses nor shortages. The price is stable unless there are changes in either supply or demand conditions listed above under changes in demand and supply. Note that the marginal utility of consumers vary, with some consumers willing and able to pay for a product than the prevailing market price, since they are paying less, there is a consumer surplus. A producer surplus also arises when some suppliers are willing to sale at less than the prevailing market price, since they are selling at a higher price there is a producer surplus. Price S Consumer surplus Producer surplus D Quantity 4.1 PRICE CHANGES Shifts in the supply or demand curves will change the equilibrium price and quantity traded. If for example, there is a large increase in consumer’s income, the demand curve will shift to the right from DD to D1D1 signifying an increase in the demand for goods and services. The new equilibrium price is OP1 and the quantity traded also increases to OQ1. Price D1 S D P1 P D1 S D O Q Q1 Quantity

21
4.2 DISEQUILIBRIUM IN THE MARKET The market system is considered to be the best way of allocating scarce Economic resources, because prices act as signals to producers. An increase in the price of product X, is a signal to producers to transfer resources to the production of product X and vice versa. The objective of maximizing profits provides the incentive for firms to respond to changes in price. The system is self-adjusting. If the price is above the equilibrium at OP1, there is excess supply, surpluses. At this high price, producers are encouraged to supply more, but the quantity demanded at this high price is less. This causes a downward pressure of cutting down production to eliminate the surplus and reducing the price to encourage demand. At prices below the equilibrium at OP2, there is excess demand, shortages. Producers supply few quantities at low prices while more consumers are willing and able to purchase products at low prices. Excess demand causes an upward pressure on price resulting in a rise in price and output. Price D S Excess supply P1 P P2 Excess demand S D O Q Quantity 4.3 GOVERNMENT INTERVENTION Price regulation and government policy of taxation and subsidy interfere with the working of the free market system. MAXIMUM PRICE (PRICE CEILING) If the government thinks that the price determined by the market forces of supply and demand for a product or service is high, the government might decide to set a maximum price, that is the price should not go beyond the amount stipulated by the government. Maximum prices are normally set to encourage the consumption of goods and services, considered

22
to be essential, and therefore should be affordable to everyone. This has the same effect as the price being below the equilibrium, at OP2 in the diagram above. The result is excess demand, shortages. There is no self-adjustment as this is government policy; queues, black markets and tie in sales become common whenever there are shortages. The government may attempt to ration the few commodities, or subsidize consumers. Price D S P M S D O Q1 Q Q2 Quantity Maximum price OM, at this price OQ, quantities are supplied while OQ2 quantities are demanded, the result is a shortage. MINIMUM PRICE (PRICE FLOOR) This is set in order to protect producers. If the government feels that the price set by the market forces of supply and demand is too low for producers to earn a decent standard of living them a minimum price is set. This meaning that the goods should not be sold below the amount stipulated by the government. This has the same effect as the price being above the equilibrium at OP.
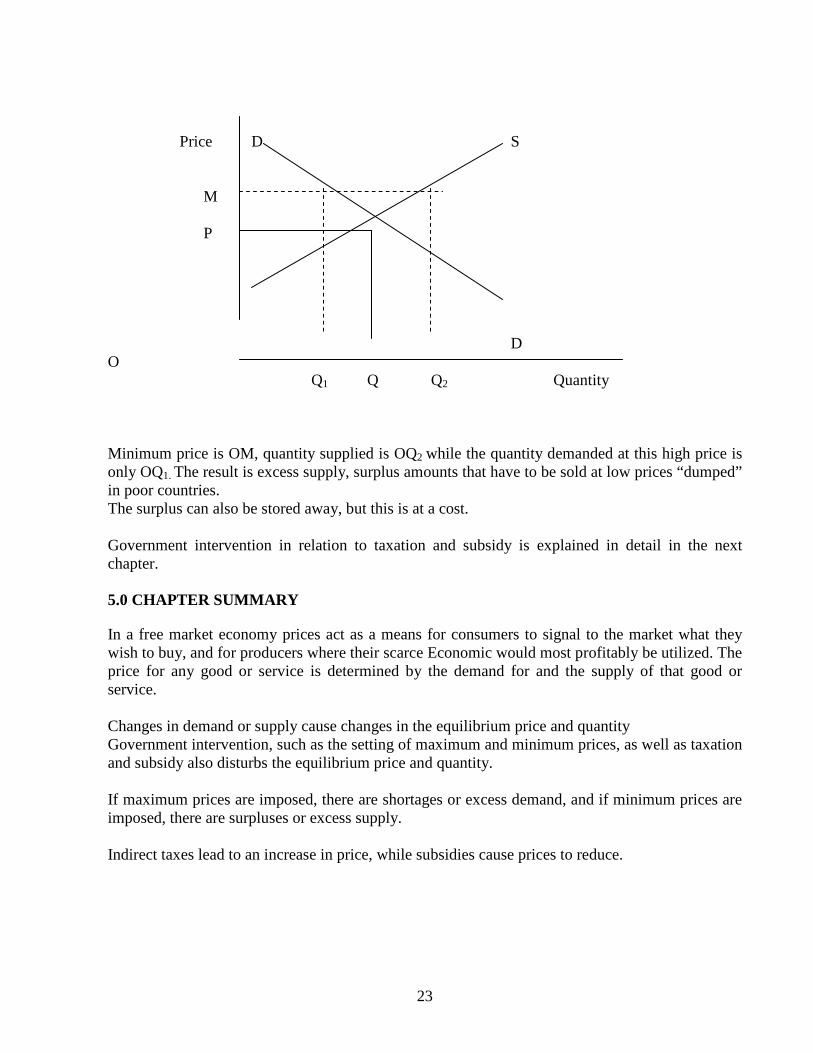
23
Price D S M P D O Q1 Q Q2 Quantity Minimum price is OM, quantity supplied is OQ2 while the quantity demanded at this high price is only OQ1. The result is excess supply, surplus amounts that have to be sold at low prices “dumped” in poor countries. The surplus can also be stored away, but this is at a cost. Government intervention in relation to taxation and subsidy is explained in detail in the next chapter. 5.0 CHAPTER SUMMARY
In a free market economy prices act as a means for consumers to signal to the market what they wish to buy, and for producers where their scarce Economic would most profitably be utilized. The price for any good or service is determined by the demand for and the supply of that good or service. Changes in demand or supply cause changes in the equilibrium price and quantity Government intervention, such as the setting of maximum and minimum prices, as well as taxation and subsidy also disturbs the equilibrium price and quantity. If maximum prices are imposed, there are shortages or excess demand, and if minimum prices are imposed, there are surpluses or excess supply. Indirect taxes lead to an increase in price, while subsidies cause prices to reduce.

24
REVIEW QUESTIONS 1. Describe the shape of a typical demand curve 2. What is the difference between a shift in demand and an expansion of demand? 3. If a cabinet minister urged people in Zambia to cut down on the high cost of living 4. by buying only ‘cheap’ products, is that Economically sound? 5. How does a consumer surplus arise? 6. List some factors which can cause a change in supply 7. What are substitute and complementary goods? Give two examples of each. 8. What is the shape of a typical supply curve? 9. When the price of a good is set above the equilibrium price, what is the result? 10. Illustrating graphically and specifying the assumptions upon which your reasoning is based,
describe briefly i) The effect on the price and output of fresh maize of adverse weather conditions. ii) The effects on the price and output of oranges of an increase in consumer’s income.
--------------------------------------------------------------------------------------- EXAM TYPE QUESTION 2.1 a) Explain the difference between ‘a change in supply’ and a ‘change in the quantity supplied’
(12marks) b) Zim Police warns dubious traders.
HARARE–“The Zimbabwean police warned last Monday unscrupulous traders selling commodities at above the government stipulated prices that they risked being arrested if caught doing the unlawful act. Police spokesperson Inspector, Cecilia Churu, said that police would not hesitate to arrest any retailer caught flouting the gazetted price. The warning comes in the wake of unjustified price increases of Mealie Meal in the past two weeks by millers without the approval of the government.”
Zambia Daily Mail, 24th July, 2003. You are required to: Explain, with the aid of a diagram, the effect of this form of government intervention on the price mechanism. (8 Marks) (Total: 20 marks)

25
CHAPTER 3 ELASTICITY ______________________________________________________________________________________________ After studying this chapter, the students should be able to: � Explain why demand or supply may not change in spite of price changes � Explain and measure the price elasticity of demand and supply. � Explain the determinants of price elasticity of demand and supply. � Assess the relationship between price elasticity of demand and total revenue � Explain why demand may change when income changes. � Explain why demand for one product changes when there is a change in the price of another product � Appreciate the use of elasticity in pricing of goods, taxation and subsidy of certain goods _______________________________________________________________________________ 1.0 INTRODUCTION The law of demand states that an increase in price causes a decrease in the quantity demanded, while a decrease in price causes an increase in the quantity demanded. Elasticity measures the degree of responsiveness or sensitivity of demand to a change in price. If a small change in price causes a big change in the quantity demanded then demand is elastic. However, if a big change in price causes only a small change in the quantity demanded, then it is inelastic. 2.0 PRICE ELASTICITY OF DEMAND (PED) It is measured by the formula: % change in quantity demanded % change in price There is an inverse relationship between price and quantity, as such the sign is negative. Note that the sign is always ignored when interpreting the elasticity value. 2.1 CATEGORIES OF PRICE ELASTICITY OF DEMAND There are five categories of PED, namely:-
Perfectly or completely inelastic demand When a change in price has no effect at all on the quantity demanded, PED when measured is equal to zero. This is an extreme situation, the closest it can be liked to is medicines. Consumers

26
purchase exactly the same quantities whatever the price is, whether it is high at OP or low at OP1, the quantity remains OQ. Price D P P1 O Q Quantity Inelastic demand This is when elastic is relatively or fairly inelastic, a big change in price results in only a small change in the quantity demanded and the conclusion is that demand is inelastic. Price changes by a big margin, from OP to OP1, but the demand reduces by a very small amount, from OQ to OQ1. PED when measured is greater than zero, but less than one. Inelastic demand applies to necessities such as mealie meal, sugar, salt, and addictive products such as cigarettes, beer, drugs. Price D P1 P D O Q1 Q Quantity
Unitary elasticity of demand This is a hypothetical scenario, based on the assumption that if demand changes by a certain percentage, then the quantity demanded should also change by exactly the same percentage. When measured, elasticity is equal to one exactly.

27
Price D P1 P D O Q1 Q Quantity Perfectly or completely elastic demand
This is another theoretical structure, it is important because a perfectly competitive market structure model is based on it.
At the compromise price of OP, demand is infinite, but a small change in price would cause demand to reduce to zero.
PRICE P D QUANTITY
28
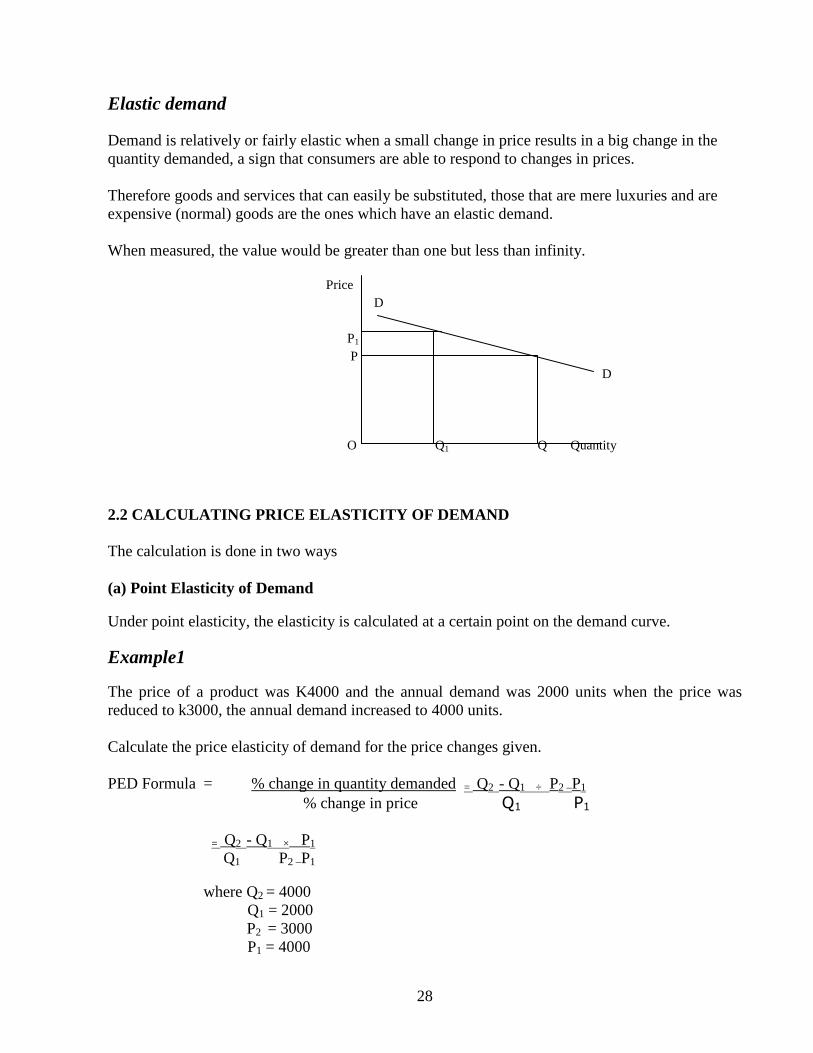
Elastic demand Demand is relatively or fairly elastic when a small change in price results in a big change in the quantity demanded, a sign that consumers are able to respond to changes in prices. Therefore goods and services that can easily be substituted, those that are mere luxuries and are expensive (normal) goods are the ones which have an elastic demand. When measured, the value would be greater than one but less than infinity. Price D P1 P D O Q1 Q Quantity 2.2 CALCULATING PRICE ELASTICITY OF DEMAND The calculation is done in two ways (a) Point Elasticity of Demand Under point elasticity, the elasticity is calculated at a certain point on the demand curve.
Example1 The price of a product was K4000 and the annual demand was 2000 units when the price was reduced to k3000, the annual demand increased to 4000 units. Calculate the price elasticity of demand for the price changes given. PED Formula = % change in quantity demanded = Q2 - Q1 ÷ P2 –P1 % change in price Q1 P1 = Q2 - Q1 × P1
Q1 P2 –P1
where Q2 = 4000 Q1 = 2000
P2 = 3000 P1 = 4000

29
= 4000 – 2000 x 100 2000
___________________ 3000 – 4000 x 100 4000 = 2000 x 4000 = -4_ 2000 -1000 Demand is elastic
Example 2 The price of a commodity was initially K10, 000 and 150 units were bought per day. When the price fell to K5, 000 the units being bought increased to 200 per day. What is the price elasticity of demand for the price changes given? PED Formula = % change in quantity demanded = Q2 - Q1 ÷ P2 –P1 % change in price Q1 P1 = Q2 - Q1 × P1
Q1 P2 –P1 where Q2 = 200 Q1 = 150
P2 = 5000 P1 = 10000 200 - 150 x 100 50 150 150 = _____ = 50 x 10 000 = 10 150 -5 000 -15
5 000 – 10 000 x 100 -5000
10,000 10000
= -2 = - 0.67 3 Demand is inelastic

30
Example 3 From the following data Price quantity bought
(K’000) ( units) 1.75 125 2.0 100
Calculate PED At price K1.75 % Change in quantity 25 x 100 = 20% 125 % Change in Price -0.25 x 100 = -14.2857% 1.75 PED Formula = % change in quantity demanded % change in price = 20% = -1.4 Demand is elastic -14.2857% (b) Arc elasticity of demand The elasticity is calculated over a range of values or an arc.
Example 1 The annual demand for a product is 1,800,000 at K2, 600 per unit and demand reduces to 1,500,000 when the price increases to K3, 000 per unit. What is the elasticity of demand over this price range? PED Formula = Percentage change in quantity demanded Percentage change in price

31
Q2 - Q1 x 100 Where Q2 = 1 800 00 Q1 + Q2 Q1 = 150 0000 ___ 2______________ P2 = 2600 ___ _______________________ P1 = 3000 P2 - P1 x 100 P1 + P2 2 18 00000 – 15 00 000 x100 1500000 + 18 00 000 2 2 600 – 3 000 3 000 +2 600 x 100 2 300,000 1650 000 = 300,000 x 2800 = -1.27
-400 1650 000 -400 demand is elastic 2800
Example 2 From the following data Price Quantity bought K’000 000 units 10 15 5 20 Calculate PED Change in quantity -5 x 100 = -28.57% 17.5 Change in price -5 x 100 = 66.67% 7.5 PED = -28.57% = - 0.43 66.67% demand is inelastic

32
2.3 PRICE ELASTICITY ALONG THE DEMAND CURVE The five categories of price elasticity of demand can be shown on one demand curve. Demand curves generally slope downwards from left to right, and elasticity varies along the length of a demand curve. The ranges of price elasticity of demand at different points along a demand curve are illustrated below. Price PED = ∞ PED>1 PED = 1 (mid-point of the line) PED<1 PED = 0 Quantity 0 Along the top half of the line, PED is greater than 1. We say that demand is elastic. Along the bottom half of the line, PED is less than 1 and we say that demand is inelastic. Exactly halfway along the line, PED = 1; demand is of ‘unitary elasticity’. The arithmetic accuracy can be examined by studying the demand schedule for beans shown below: Price Quantity (K’000) (kilograms)
10 0 9 10
8 20 7 30 6 40 5 50 4 60 3 70 2 80 1 90 0 100

33
If the price is lowered from 8 to 7, PED is 10/20 ÷ 1/8 = 10/20 x 8/1 = 4. Demand is therefore, elastic. If price is lowered from 4 to 3, PED is 10/60 ÷ ¼ = 10/60 x 4/1 = 2/3 = 0.66. Demand is therefore, inelastic At higher price ranges, demand is elastic. At lower price ranges, demand is inelastic. At the point where demand is changing from elastic to inelastic demand, demand is unitary. If price is lowered from 5 to 4, PED is 10/50 ÷ 1/5 = 10/50 x 5/1 = 1. Note that it is wrongly assumed that when calculating elasticity values, either an increase or a decrease in price calculations, given the same values, have the same elasticity coefficient. It is also wrongly assumed that two demand curves with the same shape will have the same elasticity coefficient, and yet the slope and position of the demand curve determine the numerical value of elasticity. In general, a big change in price causes only a small change in the quantity demanded, resulting in an inelastic demand curve if the demand curve is steep, further from the origin, and vice versa. 2.4 POSITIVE PRICE ELASTICITIES OF DEMAND OR EXCEPTIONAL DEMANDCURVES If the quantity demanded of certain goods falls as an individual’s income reduces, then the goods are said to be inferior goods. It is assumed that a person substitutes better quality alternatives, for example substituting a black and white television for a colour, flat plasma television set, from buying mixed cut beef to a high quality expensive steak. The quantity demanded for a good may also increase when the price increases if the product is a status maxi miser! Ostentatious goods such as gold and diamond jewels, private jets, etc., are more desirable to some consumers when the price is high, when the price falls, the products become common and are no longer desirable to those people. If consumers anticipate future price increases whenever the price of a product increases, they are likely to buy more to ‘beat’ inflation in the short term. 2.5 FACTORS DETERMINING PRICE ELASTICITY OF DEMAND Elasticity of demand depends on the consumer’s ability to increase or reduce the quantities being purchased when there is a change in price. This depends on the following:
• Availability of substitutes Substitutes have a very big impact on elasticity, if there are close substitutes available, then an increase in the price of a good, will enable consumers to react, and demand will be elastic. However, the demand for a unique product is likely to have an inelastic demand.
34
• Income This is when a commodity constitutes a small proportion of an individual’s income, a cheap product such as a razor blade, a rubber and pencil or a box of matches, items costing K100 or so would still be affordable even if there is a 100% percent increase in price. In contrast, the demand for luxurious expensive products is likely to be elastic. A 10% increase in the price of a product costing K2 million would make consumers responsive to changes in demand.
• Necessities The demand for commodities such as mealie meal, salt, sugar, milk etc is likely to be stable and inelastic.
• Additive or habit forming products
Consumers who are addicted to products such as beer, cigarettes, drugs etc feel that they cannot function properly without them. To them, the products are ‘necessities’, and therefore their demand is stable and inelastic.
• Time period
It takes time to adapt to changes in price. Consumers are likely to cling to a certain lifestyle until reality sets in and they are forced to adjust their spending habits. As such demand is more likely to be elastic in the long run rather than in the short run.
3.0 PRICE ELASTICITY OF SUPPLY (PES) Price elasticity of supply is analogous to price elasticity of demand, it measures the responsiveness of supply to changes in price. That is the extent to which producers increase production and therefore the quantity which they take to the market as a result of a rise in price.
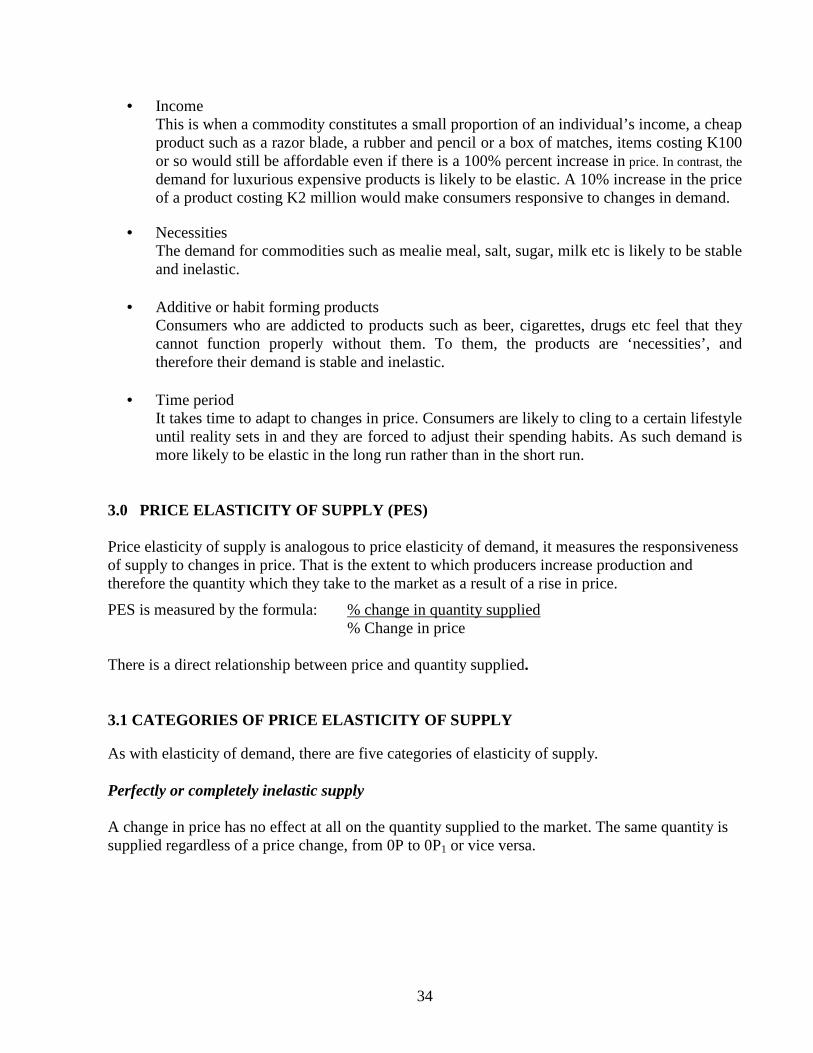
PES is measured by the formula: % change in quantity supplied % Change in price There is a direct relationship between price and quantity supplied. 3.1 CATEGORIES OF PRICE ELASTICITY OF SUPPLY As with elasticity of demand, there are five categories of elasticity of supply. Perfectly or completely inelastic supply A change in price has no effect at all on the quantity supplied to the market. The same quantity is supplied regardless of a price change, from 0P to 0P1 or vice versa.

35
Elasticity is equal to zero. Price S P P1 O Q Quantity Inelastic supply This is when elastic is relatively or fairly inelastic, a big change in price results in only a small change in the quantity supplied. A large increase in price results in only a small increase in the quantity produced and therefore supplied to the market. The conclusion is that supply is inelastic. Price changes by a big margin, from OP to OP1, but supply increases by a very small amount, from OQ to OQ1. PES when measured is greater than zero, but less than one. Price S P1 P S O Q Q1 Quantity

36
Unitary elasticity of supply This is a hypothetical, it is based on the assumption that if price changes by a certain percentage, then the quantity supplied should also change by exactly the same percentage. When measured, elasticity is equal to one exactly. Price S P1 P S O Q Q1 Quantity
Perfectly or completely elastic supply
This is another theoretical structure. At price OP, supply is infinite, producer will supply any amount, but a small change (reduction) in price would cause supply to reduce to zero. Absolutely nothing is supplied to the market even at the smallest decrease in price
37
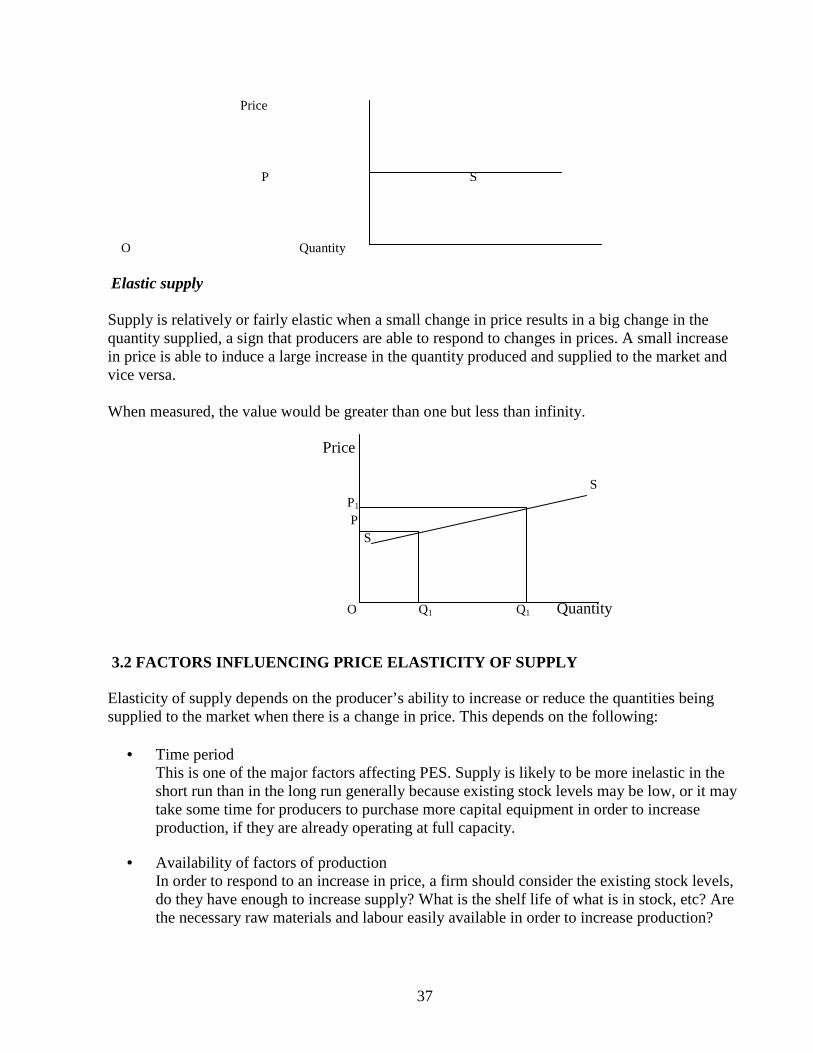
Price P S O Quantity Elastic supply Supply is relatively or fairly elastic when a small change in price results in a big change in the quantity supplied, a sign that producers are able to respond to changes in prices. A small increase in price is able to induce a large increase in the quantity produced and supplied to the market and vice versa. When measured, the value would be greater than one but less than infinity. Price S P1 P S O Q1 Q1 Quantity 3.2 FACTORS INFLUENCING PRICE ELASTICITY OF SUPPLY Elasticity of supply depends on the producer’s ability to increase or reduce the quantities being supplied to the market when there is a change in price. This depends on the following:
• Time period This is one of the major factors affecting PES. Supply is likely to be more inelastic in the short run than in the long run generally because existing stock levels may be low, or it may take some time for producers to purchase more capital equipment in order to increase production, if they are already operating at full capacity.
• Availability of factors of production In order to respond to an increase in price, a firm should consider the existing stock levels, do they have enough to increase supply? What is the shelf life of what is in stock, etc? Are the necessary raw materials and labour easily available in order to increase production?

38
What about the existence of other factors of production like fixed capital equipment if the firm is already operating at full capacity?
• Number of firms and entry barriers can also affect the price elasticity of supply.
4.0.0 THE SIGNIFICANCE OF PRICE ELASTICITY 4.0.1. WHEN DEMAND OR SUPPLY CHANGES In the previous chapter, the explanation on why prices change is given as due to a change in either supply or demand conditions. In practice, while any change in demand or supply alters the equilibrium price and output, the effects will vary due to the differences in the elasticities involved! If demand is inelastic, a shift in supply will cause a large change in the price but only a small change in the quantity traded , and vice versa. a) INELASTIC DEMAND S Price S1 P D P1 D1 0 Q Q1 Quantity b) ELASTIC DEMAND S Price S1 P D P1 D1 0 Q Q1 Quantity

39
In the same general way, the effects of a shift in demand depend on the elasticities of the supply involved. Where supply is inelastic, a shift in demand causes a large change in the equilibrium price but only a small change in the equilibrium output, and vice versa. a) INELASTIC SUPPLY b) ELASTIC SUPPLY Price D1 Price D1 D D P1 P1 P P 0 Q Q1 Quantity 0 Q Q1 Quantity In extreme cases, where demand or supply is perfectly inelastic or elastic, a change in supply or demand does not change the equilibrium position at all. a) PERFECTLY INELASTIC DEMAND b) PERFECTLY ELASTIC SUPPLY Price S1 Price D1 D P1 S P 0 Q Quantity 0 Q Q1 Quantity Under a), a change in supply causes the equilibrium price to change but the equilibrium output does not change. Under b) a change in demand causes the equilibrium output to change but the price does not change. Note that an understanding of this first section is very crucial as sections 2, 3 and 4 below are more or less a repetition and an extension of this concept. 4.0.2. WHEN THERE IS A CHANGE IN TOTAL REVENUE The calculation of PED is very useful to the business community, as well as the amount being spent by consumers. If the demand for a good is elastic, then a reduction in price increases total revenue, and the total amount being spent by consumers. A business selling products that are very

40
competitive on the market, those with close substitutes, luxuries etc., can advertise small reductions in prices and discounts in order to woo customers and increase the company’s total revenue. Price P D P1 D1
0 Q Q1 Quantity Total revenue is price x quantity, the price reduction results in a more than proportionate increase in the quantity demanded, this offsets the price reduction. Area 0PDQ is ‘given up’, while area 0P1D1Q1 is what is ‘gained’ when the price is reduced, total revenue increases. Alternatively, if total revenue falls after a price rise then demand is elastic. If the demand for a good is inelastic, then an increase in price increases total revenue. A business selling products that are necessities and addictive products like beer and cigarettes, can afford to increase prices, and the reduction in the quantity demanded is negligible, as shown below. Area 0P1D1Q1 is ‘given up’, while area 0PDQ is what is ‘gained’ when the price is increased, therefore, total revenue increases. Price P D P1 D1 0 Q Q1 Quantity Alternatively, if total revenue falls after a price cut then demand is inelastic.

41
If total revenue or total expenditure by households remains unchanged whether there is an increase or reduction in price, then the elasticity of demand is unitary. The areas are equal! Price P D P1 D1 0 Q Q1 Quantity 4.0..3 WHEN AN INDIRECT TAX IS IMPOSED ON A PRODUCT Imposing an indirect tax on a product is a form of government intervention, like the setting of maximum and minimum prices. An indirect tax is a tax on expenditure. Such taxes reduce output, maybe harmful to the domestic industry if it is in a competitive environment and some foreign firms are not subject to the same tax. Taxes however, can assist in the allocation of resources when there is a lot of pollution and only polluters are pay through heavy taxes. The significance of elasticity is in determining how the burden of the tax is to be shared between the producer and the consumer. Suppose, a product has unitary elasticities of demand and supply, the market forces determine the equilibrium price and output. Following the imposition of a tax, some producers transfer their resources to another product, as this one would be deemed unattractive. Supply reduces, and the supply curve shifts to the left, to S1. The price paid by consumer’s increases to P1, but the net amount received by the producer is lower than previously, since he must pay to the government part of the earning and there is a reduction in output to Q1, due to the tax. Price D S1 S P1 P P2 0 Q1 Q Quantity

42
In the diagram above, the burden of the tax is shared equally between the producer and the consumer. In practice, such an equal distribution of the tax burden is unlikely. The burden of the tax depends on the elasticities of demand and supply involved! If the demand for a good is inelastic, a firm producing necessities and addictive products like beer and cigarettes can afford to pass the major burden of the tax on to consumers, price increases to P1 from P. Producers bear a small portion of the burden, return falls toP2. a) INELASTIC DEMAND S Price S1 P1 P P2 0 Q Q1 Quantity b) ELASTIC DEMAND S Price S1 P1 P P2 0 Q Q1 Quantity If the demand for a good is elastic, then a firm dealing in products that are competitive on the market by having close substitutes, luxuries etc., the burden of the tax is borne mainly by producers. The price paid by consumers rises slightly to P1, the return received by suppliers falls by a big margin, to P2.

43
c) INELASTIC SUPPLY S1 Price S P1 P P2 0 Q Q1 Quantity The conclusion as to how the burden is shared is self explanatory from the diagram, the price paid by consumers rises slightly to P1, the return received by suppliers falls by a big margin, to P2. 4.0.4 WHEN A SUBSIDY IS GIVEN A subsidy is the exact opposite of an indirect tax. It is another form of government intervention, it is when the government makes a payment to producers, and it can bring about artificially low prices. Suppose, a product has unitary elasticities of demand and supply, the market forces determine the equilibrium price and output. When a subsidy is given, production is encouraged. Supply increases, and the supply curve shifts to the right, to S1. The price paid by consumers reduces to P2, and this is a benefit to them. There is an increase in output to Q1, and the amount received by the producer increases. Price D S S1 P1 P P2 0 Q Q1 Quantity The significance of elasticity is in determining how the benefit of the subsidy is to shared between the producer and the consumer, the benefit will fall more on the consumers if the product has an inelastic demand and vice versa.

44
5.0 OTHER ELASTICITY MEASURES
5.1 INCOME ELASTICITY OF DEMAND (YED) The elasticity measures are alike, the definition of income elasticity of demand is similar to that of price elasticity of demand, but price is replaced by income. Income elasticity of demand measures the degree of responsiveness or sensitivity of demand to changes in income. The formula = percentage change in quantity demanded percentage change in income
5.2 Categories of income elasticity of demand Positive Income Elasticity This is when an increase in income leads to an increase in demand, YED > 0. It applies to ‘normal’ goods such as colour television sets, motor vehicles etc. Most goods have a positive income elasticity of demand. Quantity Income Negative Income Elasticity For some goods, an increase in income causes a reduction in demand, YED < 0. Inferior goods, such as black and white television set, have a negative income elasticity of demand. Quantity Income Zero income Elasticity A change in income may have no effect on the quantity demanded, demand remains the same, YED = 0. Consumers purchase only what they require, this applies to Giffen goods, ‘necessities’

45
like mealie meal, potatoes etc. Note that with Giffen goods, less is demanded when price falls because the negative income effect overcomes the positive substitution effect. Quantity Income
5.3 Factors affecting income elasticity of demand The size of income elasticity of demand depends on the current standard of living. For example, the developed countries have a high standard of living, so that when income expands, sales of consumer durables such as washing machines and cars will rise; sales of basic commodities (Food, etc) are unlikely to respond significantly to the rise in income (zero income elasticity). In contrast, developing economies such as Zambia, when income rises, the income elasticity of demand for basic goods will be higher as a large percentage of the population is unable to afford basic commodities at its current level of income.
5.4 Practical uses of income elasticity of demand Producers may wish to know the income elasticity of demand for their product, it has an effect on their businesses. The planned future production may depend on whether incomes are rising or falling. Income increases during Economic prosperity (Economic boom), businesses sell normal goods. While during a recession, basic inferior goods are more profitable.
6.0 CROSS ELASTICITY OF DEMAND Cross elasticity of demand measures the sensitivity of demand for one good to changes in the price of another good. The formula for cross elasticity of demand (XED) is given below. The formula for cross elasticity of demand XED = percentage change in quantity demanded of Good A percentage change in price of Good B

46
6.1 Categories of cross elasticity of demand Positive cross elasticity of demand The XED between butter and margarine is positive, this is because butter and margarine are substitutes. When the price of butter goes up, demand for margarine rises and demand for butter falls. In other words, the price of margarine and demand for butter move in the same direction, therefore XED is positive. Negative cross elasticity of demand The XED between complements (goods that are jointly demanded) is negative. Consider cars and fuel, if the price of cars increases, demand for fuel would fall. Cars and fuel are complementary goods, so demand for cars is also likely to fall. The price of cars and demand for fuel move in opposite directions, so the XED of complements is negative. Zero cross elasticity of demand This applies to unrelated goods. A change in the price of one good has no effect on the quantity demanded of the other good.

47
7.0 CHAPTER SUMMARY Price elasticity of demand and supply measure how much the quantity demanded and supplied responds to changes in price. PED/PES are calculated as the percentage change in quantity demanded/supplied divided by the percentage change in price. PED/PES are very important in determining the effects of changes in demand and supply, increases and reductions in total revenue given changes in the prices of goods and services. In addition, PED/PES are important in determining the effects of changes in government policy such as taxation and subsidies. If total revenue increases following a price cut, then demand is elastic. If total revenue falls after a price cut, then demand is inelastic, and vice versa. If total revenue remains unchanged, then demand is unitary . There are a number of factors, which determine the ability of consumers and producers to respond to changes in price, such as the availability of substitutes, whether a product is a necessity or it is addictive, as well as the income of consumers. In most markets, supply is more elastic in the long run than in the short run, it takes time to transfer resources following a price rise, it also depends on the availability of factors of production especially raw materials and labour, as well as the ease of entry of new firms into the market. Income elasticity of demand measures how much the quantity demanded responds to changes in income. Cross-elasticity of demand measures how the quantity demanded of one good responds to changes in the price of another good. REVIEW QUESTIONS 1. What is the price elasticity of demand? 2. The price of a good falls by K10, 000, but the quantity demanded increases from 100 to 120
units. Calculate the price elasticity of demand? 3. List any four factors, which influence price elasticity of demand. 4. What is an inferior good? 5. Demand is said to be……, when the price of a good rises, the quantity demanded falls and the
total expenditure on the good decreases. 6. How would you classify a good with a positive income elasticity of demand? 7. How would you classify goods with a negative cross-elasticity of demand? 8. List the commodities that has a positive price elasticity of demand 9. Draw a perfectly or completely elastic supply curve. 10. Show how the burden of a tax will be shared between the producer and the consumer when
demand for a product is perfectly elastic.

48
EXAMINATION TYPE QUESTIONS 3.1 a) The following table is a demand schedule for a particular commodity, between which price
range is demand elastic? Explain your answer. Hint: At least three calculations, a reduction from K8, 000 to K7, 000, K5, 000 to K4, 000 and from K4, 000 to K3, 000.
Price (K’000s) Quantity Demanded
10 0 9 10
8 20 7 30 6 40 5 50 4 60 3 70 2 80 1 90 0 100
(10 Marks)
b)
i) What do you understand by the term “income elasticity of demand” (6 Marks) ii) Why should a firm pursuing long term growth be interested in the income elasticity of
demand of its products? (4 Marks) (Total: 20 Marks)

49
CHAPTER 4
PRODUCTION AND COSTS ______________________________________________________________________________________________ After studying this chapter, the students should be able to: � Differentiate legal forms of business units, the advantages and disadvantages of each � Name the three classes of production � Explain how production costs are determined � Discuss Division of labour, its merits and demerits � Explain the differences between fixed, variable and marginal costs � Explain on the rewards of factors of production _______________________________________________________________________________ 1.0 Introduction Production takes place in firms. A firm is an independently administered business unit. In practice, there are different types of firms, known as sole traders, partnerships etc. 1.1 Sole traders Individuals who set up businesses of their own are sole traders. It can be someone with a good business idea, an own invention or finding something to do after restructuring or simply being his or her own boss after several years as someone else’s employee. An example of a sole trader is a corner shop, a fish trader, a marketeer etc. Advantages
- It requires little capital to set up. - Self-interest acts as an incentive to work. - Regular customers and suppliers are known. - Owner can make quick business decisions.
Disadvantages
- It does not have a separate legal personality, if a person mortgages the house to raise capital. If the business fails, then the house is lost.
- Thus, there is unlimited liability. - Difficult to raise capital. - Holidays or illnesses cause problems. - Lack of continuity after the death of the owner.

50
1.2 Partnership Business company owned by partners: a company set up by two or more people who put money into the business and share the financial risks and profits. An example of a partnership is a firm of doctors, lawyers etc. The activities of partnerships are regulated by a legal document, a partnership deed. Most of the advantages and disadvantages of sole traders are transferred to partnerships, as it is only slightly better than a sole trader. Partners contribute the capital, and as owners, share the profits, they can specialize and they have regular known customers. However, partnerships also have unlimited liability, and one partner’s mistake affects all partners. Lack of continuity if partners disagree, or if one partner dies. 1.3 Private limited Company This is a company with limited stockholder liability, a registered company in which the stockholders' liability for any debts or losses is restricted, regulated by the Companies Act. Two or more shareholders own the company. An example is a small family firm. Shareholders contribute capital of the company. Shares are not sold to the general public. Like sole traders and partnerships, there is limited capital for expansion, and therefore limited economies of scale. The advantage of private limited companies is that if the company goes bankrupt, owners have limited liability for the company’s debt. They only lose the capital they have invested in the company, nothing more. 1.4 Public limited Company Public limited companies identify themselves by putting the word ‘PLC’ after their name. These are companies whose share can be bought and sold on the stock market, unlike private limited companies, they are allowed to sell shares to the general public. Shareholders are subject to restricted liability for any debts or losses. An example is Chilanga Cement PLC Large amounts of capital can be raised, as such they are usually very large, enjoying economies of scale. Professional managers normally run the companies, and the company can be remote from customers and there are potential diseconomies of scale. 1.5 Co-operatives These are formed when people join together to carry on an Economic activity for mutual benefit. It is owned or managed jointly by those who use its facilities. An example is a consumer cooperative, which is for the wholesale or retail distribution usually of agricultural goods. Membership is open, and goods are sold to the general public as well as to its members.

51
The major disadvantage of cooperatives is lack of business or management experience by members to carry out an Economic activity. 2.0 Industry- the three classes of production Production is divided into three categories a) Primary production
The producers of natural goods such as farmers, oil drillers, copper miners etc, are all engaged in primary production.
b) Secondary production
The producers of sophisticated goods, manufactured goods such as carpenters, tailors, car manufacturers, are in secondary production.
c) Tertiary
These are providers of services like bankers, retailers, stockbrokers, accountants, teachers, doctors and entertainers.
3.0 Specialisation Specialization happens when one individual, region or country concentrates in making one good. Division of Labour The division of labour is a particular type of specialization where the production of a good is broken up into many separate tasks each performed by one person. An early economist, Adam Smith, suggested that without any division of labour and specialization, one worker could produce only ten pins in one day. However, in a pin factory where each worker performs only one task, ten workers using the division of labour principle, could produce a daily total of 48 000 pins. Output per person (productivity) can rise from 10 to 4800 when the division of labour principle was used. 3.1 Advantages of the division of labour The division of labour raises output, thereby reducing costs per unit, for the following reasons:
- Workers become more practiced at the task - Workers can be trained more precisely for the task - Specialization enables more efficient organization of production with a series of distinct
tasks 3.2 Disadvantages of the Division of Labour Eventually the division of labour may reduce productivity and increase unit costs of the following reasons:
52
- Continually repeating a task may become monotonous and boring - Workers begin to take less pride in their work - If one machine breaks down then the entire factory stops. - Some workers receive a very narrow training and may not be able to find alternative
jobs. - Mass produced goods lack variety.
3.3 Limits to the Division of labour
- Mass production requires mass demand. - The transport system must be good enough to reach a large number of consumers (mass market) - Barter is the direct exchange of goods for other goods. Each worker creates only part of the
finished goods; -therefore the division of labour cannot be used in a barter society. 4.0 COSTS OF PRODUCTION It is important to first divide the costs of production into time period of short run and long run costs, depending on variable or fixed factors of production. The short run is defined as a period when at least one factor of production is in fixed supply, a combination of both variable and fixed factors. The short run is the time period that is too brief for a firm to alter its plant capacity. The plant size is fixed in the short run. Short run costs, then, are the wages, raw materials, etc., used for production in a fixed plant. A firm will undertake production in the short run, if the price at which their product is sold is at least equal to the average variable cost of production. Therefore, a firm will continue in business in the short run as long as it is able to cover the variable costs of production. The long run is a period when all factors of production can be varied. All the factors of production are considered to be variable. The long run is a time period long enough for a firm to change the quantities of all resources employed, including the plant size. Long run costs are all costs, including the cost of varying the size of the production plant. 4.1 Total Costs The amount spent of producing a given amount of a good by a firm is called total cost, TC, and is found by adding together variable and fixed costs. 4.2 Variable Costs Variable costs, VC, depend on how many (the output) goods are being made. If just one more unit is made then total variable costs rise. Variables costs are costs that vary with output. Examples include the following:-

53
- Wages paid to casual workers - The cost of buying raw materials and components. - The cost of electricity and charcoal.
4.3 Fixed Costs Fixed costs, FC, are independent of output. Fixed costs have to be paid out even if the factory stops production. Fixed costs are costs that do not vary with output. Examples include the following:
- Monthly salaries paid to managers - Rent paid for the use of premises - Rates paid to the council - Any interest paid on loans - Depreciation, that is money put aside to replace worn-out machines and vehicles sometime
in the future The short run cost schedule of an individual firm shows the behaviour of costs when output is varied. Table 1 below presents the cost structure of a hypothetical firm, to illustrate the general principles covered under 4.1, 4.2 and 4.3, total costs remain the same at different levels of output. The total costs are made up of fixed and variable costs. The output and the costs are in thousand units and thousands of kwacha respectively. Output Total fixed Total variable Total Costs units costs costs 0 50 0 50 1 50 50 100 2 50 90 140 3 50 120 170 4 50 160 210 5 50 210 260 6 50 270 320 7 50 340 390 8 50 420 470 9 50 510 560 10 50 610 660 After plotting the above information, the following diagrams are obtained:
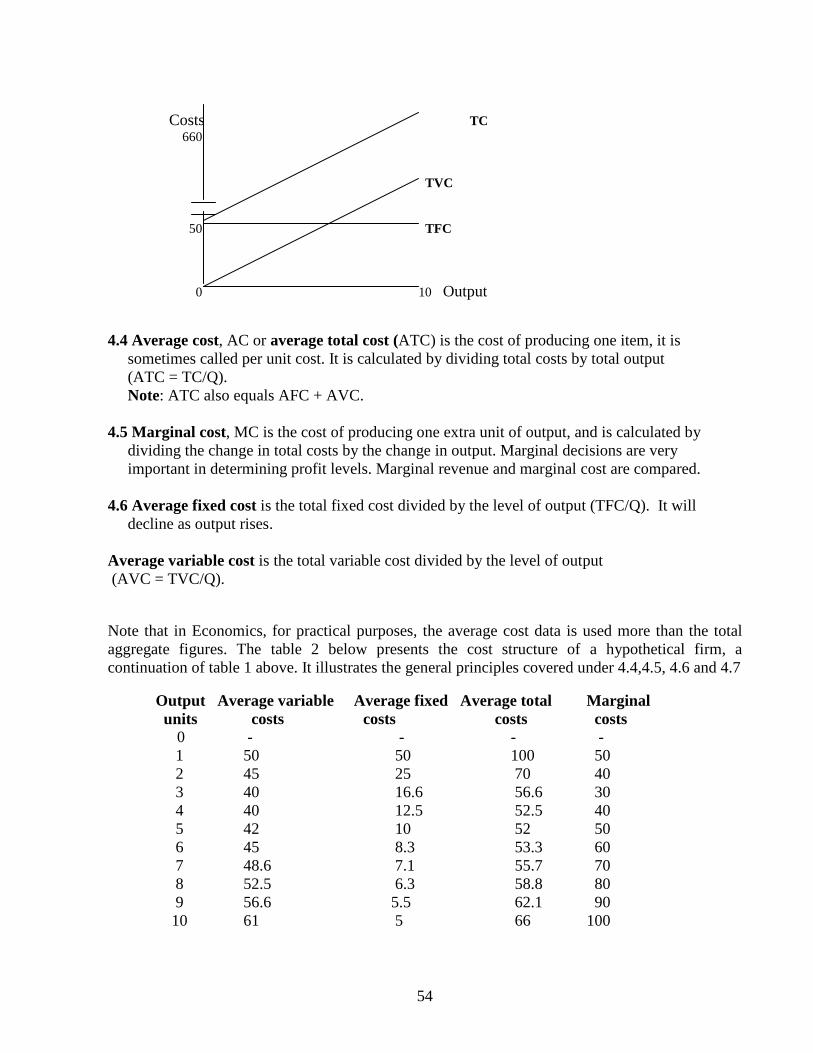
54
Costs TC 660 TVC 50 TFC 0 10 Output 4.4 Average cost, AC or average total cost (ATC) is the cost of producing one item, it is sometimes called per unit cost. It is calculated by dividing total costs by total output (ATC = TC/Q). Note: ATC also equals AFC + AVC. 4.5 Marginal cost, MC is the cost of producing one extra unit of output, and is calculated by dividing the change in total costs by the change in output. Marginal decisions are very important in determining profit levels. Marginal revenue and marginal cost are compared. 4.6 Average fixed cost is the total fixed cost divided by the level of output (TFC/Q). It will decline as output rises. Average variable cost is the total variable cost divided by the level of output (AVC = TVC/Q). Note that in Economics, for practical purposes, the average cost data is used more than the total aggregate figures. The table 2 below presents the cost structure of a hypothetical firm, a continuation of table 1 above. It illustrates the general principles covered under 4.4,4.5, 4.6 and 4.7 Output Average variable Average fixed Average total Marginal units costs costs costs costs 0 - - - - 1 50 50 100 50 2 45 25 70 40 3 40 16.6 56.6 30 4 40 12.5 52.5 40 5 42 10 52 50 6 45 8.3 53.3 60 7 48.6 7.1 55.7 70 8 52.5 6.3 58.8 80 9 56.6 5.5 62.1 90 10 61 5 66 100

55
After plotting the above information, the following diagrams are obtained, where 1 is the marginal cost curve, 2 is the average total cost curve, 3 is the average variable cost curve and 4 is the average fixed cost curve respectively.
4.8 Explicit costs are those costs that are clearly stated and recorded. 4.9 Implicit costs are those costs that are implied, unstated but understood as a necessary component in the economist’s view. These are opportunity costs, benefits forgone by not using the factor of production in the next most profitable way. This is important because it explains the difference in the calculation of profit between the Accountant and the Economist. Accounting profits are sales revenue minus explicit costs of a business. Economic profits consist of sales revenue minus explicit and implicit costs! For example, assuming that Mabvuto runs a business and sells goods worth K10 million, the cost of sales is K4.5 million. If the premises used for the business could be put to alternative use, it can earn a rent of K1million. The capital invested in the business could have earned K1.5 million in interest if deposited in a bank. Suppose Mabvuto was employed elsewhere, he would have been earning an income of K2.5 million. The accounting gross profit and the Economic profit or loss earned is as follows: Accounting profit K’M K’M Sales 10 Less cost of sales 4.5 ___ Gross Profit 5.5
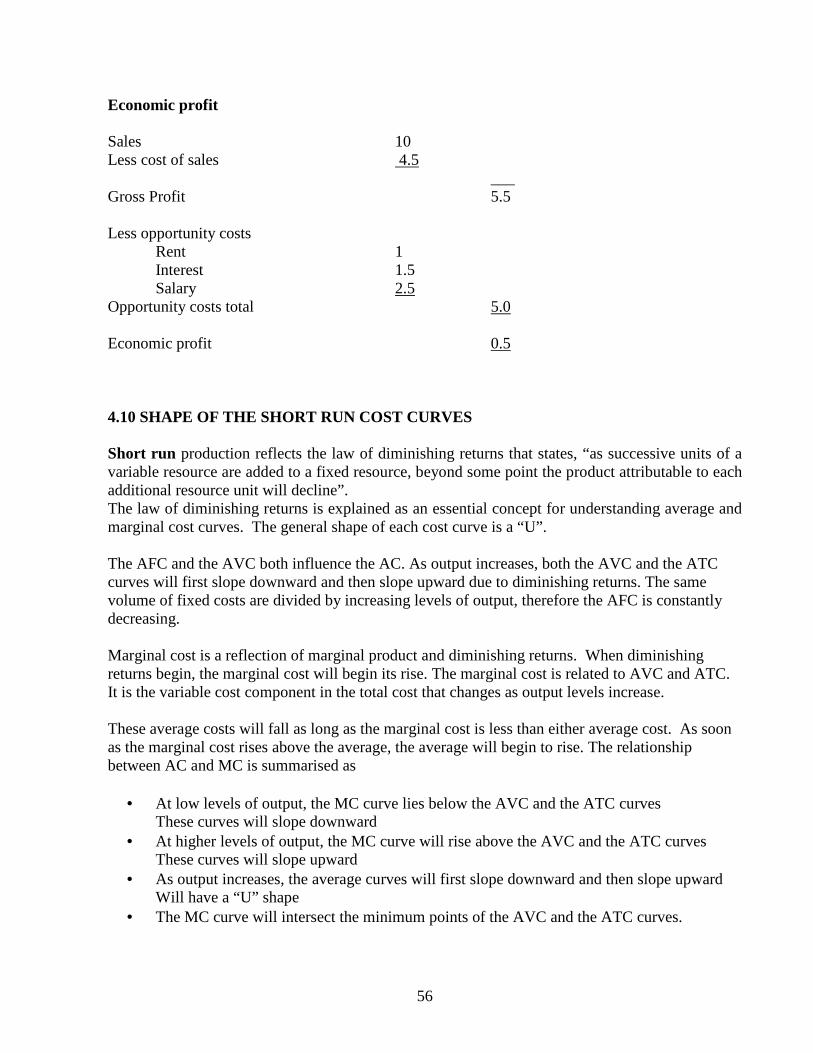
56
Economic profit Sales 10 Less cost of sales 4.5 ___ Gross Profit 5.5 Less opportunity costs Rent 1 Interest 1.5 Salary 2.5 Opportunity costs total 5.0 Economic profit 0.5 4.10 SHAPE OF THE SHORT RUN COST CURVES Short run production reflects the law of diminishing returns that states, “as successive units of a variable resource are added to a fixed resource, beyond some point the product attributable to each additional resource unit will decline”. The law of diminishing returns is explained as an essential concept for understanding average and marginal cost curves. The general shape of each cost curve is a “U”. The AFC and the AVC both influence the AC. As output increases, both the AVC and the ATC curves will first slope downward and then slope upward due to diminishing returns. The same volume of fixed costs are divided by increasing levels of output, therefore the AFC is constantly decreasing. Marginal cost is a reflection of marginal product and diminishing returns. When diminishing returns begin, the marginal cost will begin its rise. The marginal cost is related to AVC and ATC. It is the variable cost component in the total cost that changes as output levels increase. These average costs will fall as long as the marginal cost is less than either average cost. As soon as the marginal cost rises above the average, the average will begin to rise. The relationship between AC and MC is summarised as
• At low levels of output, the MC curve lies below the AVC and the ATC curves These curves will slope downward
• At higher levels of output, the MC curve will rise above the AVC and the ATC curves These curves will slope upward
• As output increases, the average curves will first slope downward and then slope upward Will have a “U” shape
• The MC curve will intersect the minimum points of the AVC and the ATC curves.
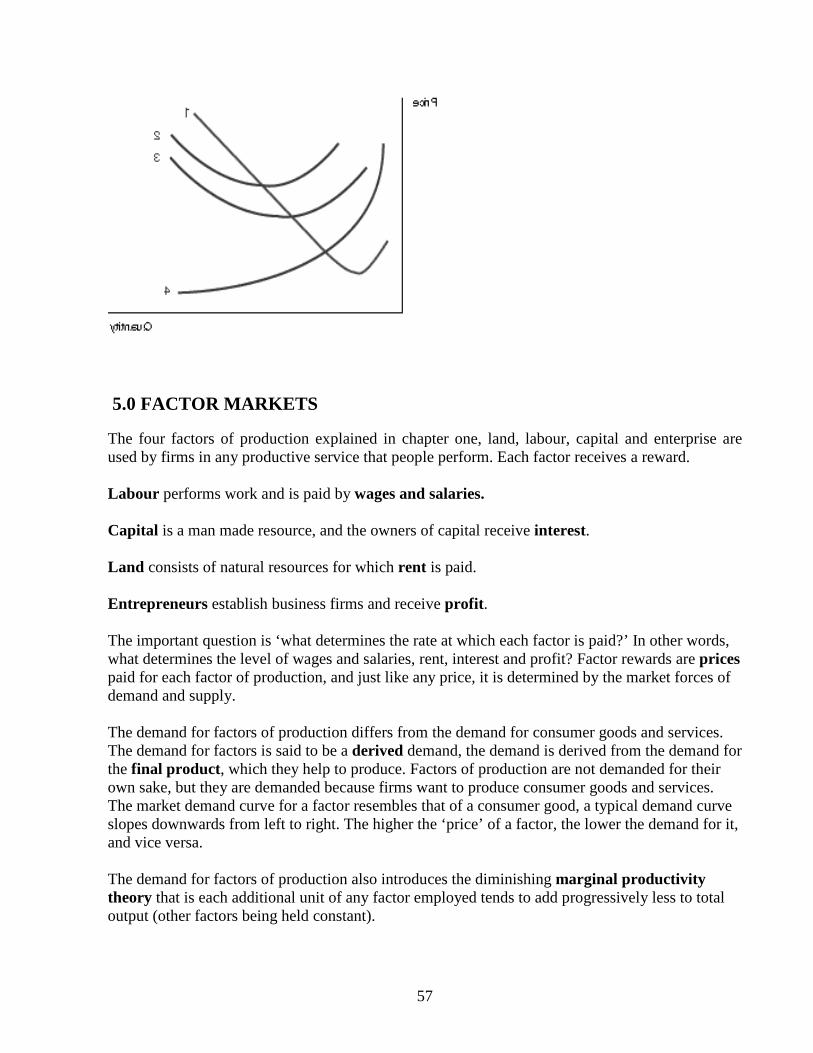
57
5.0 FACTOR MARKETS The four factors of production explained in chapter one, land, labour, capital and enterprise are used by firms in any productive service that people perform. Each factor receives a reward. Labour performs work and is paid by wages and salaries. Capital is a man made resource, and the owners of capital receive interest. Land consists of natural resources for which rent is paid. Entrepreneurs establish business firms and receive profit . The important question is ‘what determines the rate at which each factor is paid?’ In other words, what determines the level of wages and salaries, rent, interest and profit? Factor rewards are prices paid for each factor of production, and just like any price, it is determined by the market forces of demand and supply. The demand for factors of production differs from the demand for consumer goods and services. The demand for factors is said to be a derived demand, the demand is derived from the demand for the final product , which they help to produce. Factors of production are not demanded for their own sake, but they are demanded because firms want to produce consumer goods and services. The market demand curve for a factor resembles that of a consumer good, a typical demand curve slopes downwards from left to right. The higher the ‘price’ of a factor, the lower the demand for it, and vice versa. The demand for factors of production also introduces the diminishing marginal productivity theory that is each additional unit of any factor employed tends to add progressively less to total output (other factors being held constant).

58
An individual firm will increase its employment of any factor as long as the value of the extra output achieved exceeds the additional cost involved. The supply of a factor represents the different quantities that are offered at various possible ‘prices’. For example the higher the wage rate, the higher the supply of labour, and vice versa. Therefore, a typical supply curve for a factor resembles that of a consumer good, it slopes upward from left to right. A change in factor ‘prices’, such as wage rates, maybe due to changes in the demand and supply conditions of labour, just like in the product market. Note that the above is generalized, in practice, there are other factors that should be considered in the factor market, including elasticity. 6.0 CHAPTER SUMMARY There are various types of organizations in mixed Economic systems. Business organizations are categorized as sole traders, partnerships, limited companies and cooperatives. The economy can be divided into primary, secondary and tertiary sectors. A firm’s output decisions can be examined both in the short run, when at least one factor of production is in fixed supply, or in the long run, when all factors of production are considered to be variable. A firm’s total cost of production is made up of fixed and variable costs. Average fixed cost declines as output increases, average variable costs initially falls as output increases, then after a certain point, when diminishing returns set, the average variable costs begin to rise. When average fixed cost and average variable cost are added, the resulting average total costs fall, and then rises as output increases. The marginal costs also falls briefly, then rises, cutting the average costs at their minimum points. Economic costs are different from accounting costs. Economic costs include the opportunity costs of factors of production that are used. The factor market is similar to the market for goods and services. The demand for factors of production is derived from the demand for the final goods and services, which that factor helps to produce.
59
REVIEW QUESTIONS 1. What is the distinction between long run and short run in Economics? 2. Distinguish between fixed costs and variable costs. 3. What costs should be covered in the long run? 4. What is meant by the term marginal costs? 5. What is derived demand? 6. From the following cost schedule of a hypothetical firm: Output Fixed costs Variable costs (units) K’000 K’000 100 100 700 101 100 706 102 100 709 103 100 710 You are required to calculate
a) The total cost of production b) The average total cost c) The marginal cost
7. From the following cost schedule of a hypothetical firm: Output Total costs (units) K’000 20 270 30 330 40 400 50 500 60 630 70 840 You are required to calculate
a) The average total cost b) The marginal cost and to construct c) The average total cost curve
-----------------------------------------------------------------------------------------------

60
EXAMINATION TYPE QUESTION 4.1 (a) The table below is given as follows:- Variable factor (in units) 1 2 3 4 Marginal physical product 6 10 15 12 You are required to calculate the: (i) Total physical product (4 Marks) (ii) Average physical product (4 Marks) (b) Distinguish between fixed and variable costs, and give two examples of each. (4 Marks) c) Construct the following curves on one graph:
i) The marginal cost curve (2 Marks) ii) The average total cost curve (2 Marks) iii) The average variable cost curve (2 Marks) iv) The average fixed cost curve (2 Marks)
(TOTAL: 20 MARKS)

61
CHAPTER 5 LONG RUN COSTS ______________________________________________________________________________________________ After studying this chapter, the students should be able to: � Explain how the shapes of the long run cost curves are determined � Draw long run and short run cost curves � Discuss internal and the external economies and diseconomies of scale � Appreciate small firms and their survival despite the advantages of large-scale production � Explain how the location of industries is determined � Explain the integration of firms to form large undertakings � Describe the revenue structure of firms and the profit maximizing position _______________________________________________________________________________ 1.0 Introduction The long run is when all factors of production are variable, and as such all the costs must be covered. The firm is assumed to be a profit maximiser. It can plan ahead on long run improvements, which involve changing factors of production that are currently fixed. Therefore if a firm is to continue in business in the long run, the price must at least equal average total cost of production. In the long run, firms have combinations of factors of production that result in low average costs. The factors that cause average costs to decline in the long run as output increases are known as economies of large-scale production, commonly known as economies of scale. The shape of the long run average cost (LRAC) curve however, depends on whether
- Output increases more in proportion to inputs, when there are economies of scale and the LRAC decline to show increasing returns to scale.
- Output increase in the same proportion as inputs indicating constant returns to scale.
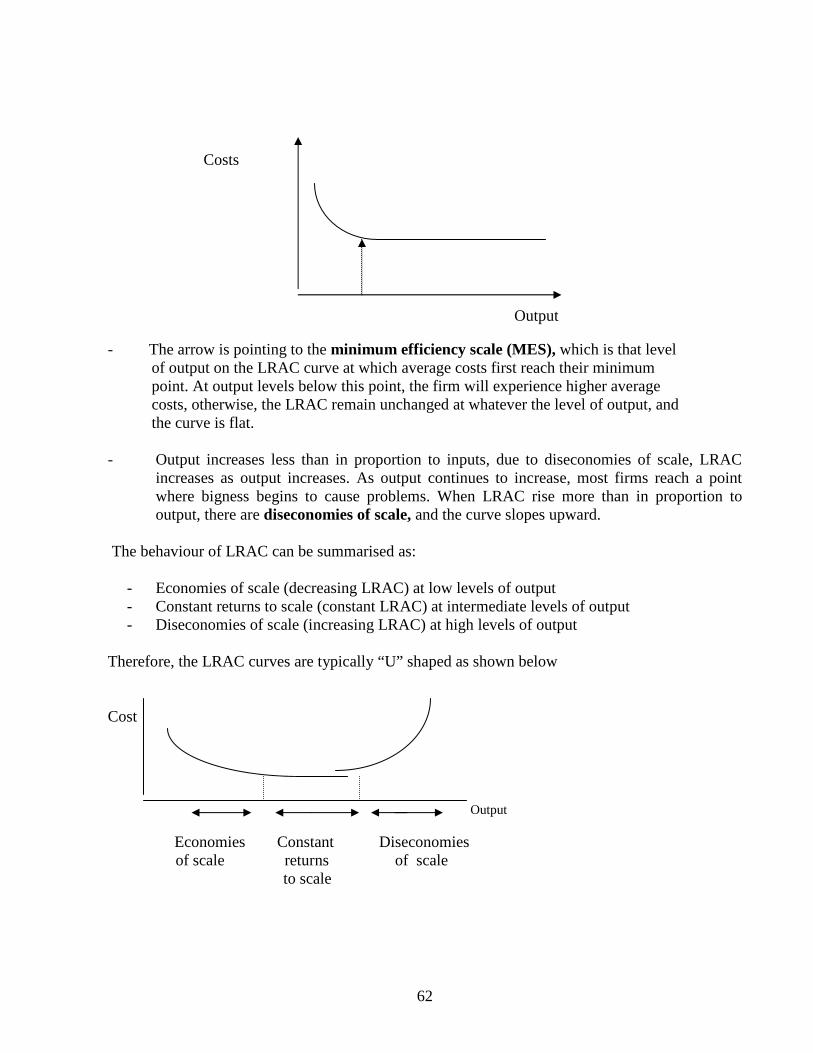
62
Costs Output - The arrow is pointing to the minimum efficiency scale (MES), which is that level of output on the LRAC curve at which average costs first reach their minimum point. At output levels below this point, the firm will experience higher average costs, otherwise, the LRAC remain unchanged at whatever the level of output, and the curve is flat. - Output increases less than in proportion to inputs, due to diseconomies of scale, LRAC
increases as output increases. As output continues to increase, most firms reach a point where bigness begins to cause problems. When LRAC rise more than in proportion to output, there are diseconomies of scale, and the curve slopes upward.
The behaviour of LRAC can be summarised as:
- Economies of scale (decreasing LRAC) at low levels of output - Constant returns to scale (constant LRAC) at intermediate levels of output - Diseconomies of scale (increasing LRAC) at high levels of output
Therefore, the LRAC curves are typically “U” shaped as shown below Cost Output Economies Constant Diseconomies of scale returns of scale to scale

63
2.0 ECONOMIES OF SCALE These indicate that as the output or plant size increases, the average costs per unit decreases or falls, they are reductions in long run average total costs achieved when the whole scale of production is expanded. Not all the factors are expanded proportionately with output. Average costs fall as output is expanded, but not all fixed factors of production need to be increased in line with output. This reduction in the long run average costs is due to economies of scale. Economies of scale only occur in the long run, as they are associated with the alteration of some or all of the firm’s fixed factors. The economies of scale are either internal (within the firm) or external (originating outside the firm). 2.1 INTERNAL ECONOMIES These are advantage that accrue within an organization because of large-scale production which a firm a can plan to achieve directly by increasing the size of its output. The benefits accrue to the individual firm, some of them include the following: • Financial Economies When raising finance large firms, since they are household names, can easily borrow money from commercial banks and negotiate for lower interest rates. In addition, they have more advantages because they offer better security to bankers than a briefcase businessperson. Large firms can also raise new capital at a lower cost through the issue of shares, company bonds or commercial paper. Therefore, it is generally accepted that larger firms can raise funds more easily and cheaply than small firms. • Technical Economies The advantages of division of labour and specialization can be achieved, as the plant grows in size and output increases, it becomes more possible for labour to undertake more specialized activities. This increases efficiency and reduces costs per unit. The firm can also buy specialized sophisticated machinery, this is utilized more efficiently if operation is on a large scale. There is greater use of advanced machinery. Some machines are worth using beyond a minimum level of output, which maybe beyond the capacity of a small firm. For example the use of combine harvesters by commercial farmers, compared to its use by small subsistence farmers with less than an acre of land. More resources are devoted to research and development because resources are borne over more units of output in large firms, this leads to further technical improvements, more cost reductions.

64
• Managerial Economies The division of labour can be introduced into the task of management. The function of management is divided into production, sales, finance etc. A large firm can afford to hire specialists in different fields, which is an efficient use of labour resources. • Commercial or Trading Economies The large firm achieves economies both in buying raw materials and other inputs, as well as in selling finished products. Favourable terms are granted to a large firm since it buys in bulk and may get discounts. It can afford to employ specialist buyers. The cost per unit of advertising on television may be expensive for a small firm, but far lower for a firm with a high output. Therefore, there are reduced costs per unit in advertising, sales promotion and distribution. • Welfare Large firms are in a position to increase production by improving the condition of service of their employees through the provision of facilities such as transport, clinics, sport and other recreation facilities.
2.2 EXTERNAL ECONOMIES External economies are advantages of an increased scale possible to all firms in an industry. They are influenced by the growth of the industry as a whole. External economies occur when an industry is concentrated in one area, and the local economy evolves around the industry. The industry is supplied with skilled labour force, specialist suppliers etc. It is also associated with knowledge, new inventions and the discovery of new markets. External economies are made outside the firm as a result of its location and occur when:
• A local skilled labour force is available • Specialist local back up firms can supply raw materials, component parts or services.
They supply to a large market and achieve their own economies of scale, which are passed on through lower input prices.
• An area has a good transport network • An area has an excellent reputation for producing a particular good • Firms in the industry may find a joint enterprise and share their research and development
facilities, to lower the overhead costs.

65
• As the industry grows in size, different firms within it specialize in different processes. A good example of external economies of scale in Zambian is copper mining in the copper belt province. A number of firms provide information, labour, machinery or component parts that are required by the copper mining companies.
2.3 DISECONOMIES OF SCALE These are problems of growth, unlimited expansion of scale of output may not necessarily result in ever-decreasing costs per unit. There may be a point beyond which average costs begin to rise again. Cost Output Diseconomies of scale can be categorized in the same way as economies of scale.
2.4 INTERNAL DISECONOMIES OF SCALE
• Managerial diseconomies occur, as large firms are difficult to manage in relation to effective control and coordination. The disadvantages of the division of labour, increasing bureaucracy as the firm becomes too large and loss of control as management becomes distanced from the shop floor.
• Labour relations affected, workers cease to feel that they belong: moral and motivation fall.
• As the firm increases in size management may become complacent since it is less vulnerable to competition from other firms. These complacency leads to inefficiency termed “X” inefficiency.
• Decisions are not taken quickly • Technical diseconomies occur, as the technical size of the plant may create large
administrative overheads. • Trading diseconomies, which is mass standardized production verses individualism.

66
2.5 EXTERNAL DISECONOMIES OF SCALE As the firm and industry grows it may be hampered by shortage of various types, for example,
- Local labour and raw materials become scarce and firms have to offer higher wages to attract new workers or buy raw materials at high costs.
- Land, factories become scarce, and rents begin to rise. Roads become congested and so
transport costs begin to rise.
- Lack of markets for the firms’ out put. 3.0 SMALL FIRMS It is difficult to classify firms as small or large. This generally depends on whether one is residing in a developed or in a developing country. Generally, small firms are classified by size relative to other firms, for example 25 employees or less is a small firm A turnover of K1 000 000 or less Assets like 3 vehicles or less A relatively small market share, and so on. Small firms are largely found in retailing, financial and services like consultancies. The number of small firms is high because the number of people being self-employed is growing due to retrenchments. In addition, there is no formal sector growth to absorb the unemployed. As the result, most governments have come up with a policy of advising and training people to start small businesses. Governments, mostly in developed countries, provide loans, loan guarantee schemes and working capital as well as tax rebates. Small firms compete with large firms and they owe their survival to the following:-
- They can adapt to customer needs quickly. - They offer individualized service as opposed to mass production and standardized
products. - There is personal involvement in the business by the owner. - Flexible approach and personal relationship with customers and employees in addition, - In addition, some products cannot be mass-produced, like spectacles, others have only a
limited demand for example custom made items, and some require little capital, like window cleaning.
67
4.0 THE LOCATION OF INDUSTRY A company will locate its factory and offices where it can achieve minimum costs and maximum profits. Principle influences on the location of industries are:-
- Nearness to raw materials especially where the raw materials are heavy and bulky.
- Accessibility to the markets - Nearness to the power supply - Government policy
5.0 INTEGRATION OR AMALGAMATION OF FIRMS This may be horizontal, vertical or lateral.
5.1 Horizontal Integration Horizontal integration occurs when firms that are producing the same type of product, and are at the same stage of the production process, join together. An example is if Kafue Textiles acquires or combines with Mulungushi Textiles. The reasons for horizontal integration would be for firms to:
- Obtain economies of scale - Increase market share - Fight off imports - Pool technology
5.2 Vertical Integration This is the amalgamation of firms engaged in different stages of production, it may be towards a source of raw materials, known as backward vertical integration, an example is if Zambeef acquires a cattle ranch. Alternatively, it may be near to the market known as forward vertical integration. An example is when an oil exploration company takes over an oil marketing company like Total or British Petroleum. Reasons for vertical integration: - To eliminate transaction cost of middlemen - To increase entry barriers for new competitors - To secure raw material supplies - To improve distribution network
68
5.3 Lateral Integration This occurs when firms increase the size of their products. Concentration on one product may make a firm vulnerable, hence the need to diversify. A firm may be vulnerable to a change in fashion, a ‘recession’ or a change in government policy. Reasons for diversification: - To minimize risks - To make use of expertise by seeking challenging situation - To achieve economies of scale
6.0 DISTRIBUTION OF GOODS An individual firm in most cases is only a single link in a larger supply chain and distribution channel. A firm’s success depends on how well it performs as well as how well its entire distribution channel competes with competitors’ channels. Distribution of goods refer to the methods by which producers transfer goods and services to consumers. A variety of functions are involved in distribution, including stock management to ensure continuous production, transporting of goods to consumers, proximity to the local market and knowledge of that market in order to pursuer economies of scale, as well as major promotional campaigns and the display of goods for sale. In setting up a channel of distribution, a producer has to take into account the following:- � The number of potential customers, their buying habits and their geographical location. � Product characteristics such as whether the product is perishable, and therefore speed of
delivery is essential, or whether the product is customized and has to be distributed directly etc. � The location, performance promotion, pricing policies and other characteristics of the
distributor. � The channel choice of competitors, which maybe exclusive. � The supplier’s own characteristics, for example, is the supplier a market leader, more
importantly, does the supplier have a strong financial base to operate own distribution channel?

69
6.1 WHOLESALING AND RETAILING This consists of many organizations bringing goods and services from point of production to point of use. Wholesaling includes all the activities involved in selling goods or services to those who are buying for the purpose of resale or for business use. Wholesalers stock in a range of products from competing producers to sell to retailers. Many wholesalers specialize in particular products and perform many functions such as selling, promoting, warehousing, transporting, financing, supplying market information, providing management services etc. Retailing includes all the activities involved in selling goods or services directly to households or final consumers for their personal non-business use. Retailers are traders operating outlets. In practice, there are different types of retailers, the majority are classified as store retailers, while others are non-store retailers, and this number is growing at a fast rate. A good example in Zambia is street vending. Store retailers are further classified as:- - Self-service, limited service or full service, depending on the amount of service they provide. - Speciality stores, department stores, supermarket stores, convenience stores etc, depending on the product line sold. - Discount stores or price retailers, this depends on the relative prices. - Corporate chains, retail cooperatives, merchandising conglomerates etc., depending on whether retailers have banded together in corporate and contractual retail organizations. 6.2 DISTRIBUTION CHANNELS Producers sometimes distribute goods directly to consumers, but in most cases, the distribution is done indirectly through a wide range of intermediaries between the original producer and the ultimate consumer. Each layer of intermediary that performs some work in bringing the product and its ownership closer to the final consumer is a channel level. Both the producer and the consumer perform some work and therefore, they are part of every channel as shown below.

70
NUMBER OF INTERMEDIARIES/CHANNEL LEVELS Zero One Two Three Producers Producer Producers Producers Agent Wholesaler Wholesaler Retailer Retailer Retailer Consumer Consumer Consumer Consumer Direct distribution channel Indirect distribution channels Note that in practice, there are other intermediaries, such as-
- Distributors and dealers who contract to buy a producer’s goods and sell them to customers. Distributors often promote the products and offer after sales service.
- Agents sell goods on behalf of suppliers and earn a commission on their sales. - Franchisees are independent organizations, who trade under the name of a parent
organization in exchange for an initial fee and a share of the sales revenue. However, the two major channels of distribution are the retailers and the wholesalers. 7.0 TOTAL REVENUE (TR) This is the money the firm gets back from selling goods and is found by multiplying the number sold, Q, by the selling price, P. TR = (Q x P) Average revenue AR, is the amount received from selling one item and equals the selling price of the good, the price per unit.

71
AR = TR Q Marginal Revenue MR is the change in total revenue from the sale of one more unit of output. MR = ∆TR ∆Q Profit Firms are profit maximisers. Profit is calculated as the difference between total revenue and total costs. P = TR - TC It is private costs not social costs that are taken into account. The private cost to a motorist of driving from Chipata to Lusaka is the cost of petrol and oil and the wear and tear on the car. However, other people have to put up with the externalities of the journey, for instance the noise, smell, pollution and traffic congestion the motorist helps to cause along the way. Total revenue and total cost both vary with output. Total revenue starts from zero and increases gradually, then flattens out as output and sales increase. Total costs do not start from zero due to the element of fixed costs, they accelerate and become steep as output increases. Profits are at a maximum where the vertical distance is greatest, as shown in the diagram below. Revenue TC and Costs TR Quantity
7.1 Profit maximising position If MC is lower than MR, then profit increases by making and selling one more unit of output.
However, if MC is higher than MR, profits fall if one more unit is made or sold.

72
If MC is equal to MR, then the profit maximizing position has been reached, as shown below. Profits are maximized where MC = MR. AN IMPERFECT MARKET A PERFECT MARKET MC Revenue MC Revenue MR and and Costs Costs MR Quantity Quantity
8.0 CHAPTER SUMMARY As some firms expand, whether by mergers, diversification or take-overs, the firms enjoy economies of scale, whereby there is a reduction in average total costs as output expands. Economies of scale are of two types, internal and external. Unfortunately, the growth is sometimes accompanied by problems of diseconomies of scale, which are also of two types, internal and external diseconomies of scale. This causes the average total cost to rise as output increases. Small-scale production is equally important and continues to grow partly due to some limitations on large-scale production. Producers have to deliver goods and services to customers, this maybe done directly or indirectly using a wide range of intermediaries such as agents, franchisees, dealers etc. However, the two major channels of distribution are the wholesalers and the retailers. Firms expand because of the desire to make more profits, enjoy the economies of scale etc. One form of expansion is through amalgamation of firms, and this maybe vertical, horizontal or lateral integration. In Economics, the stated objective of firms is profit maximization, and it is attained where MR = MC.

73
8.1 Summary of equations TC = VC + FC VC = TC – FC FC = TC – VC AC = TC/Q TR = P x Q AR = TR/Q MC = ∆TC/∆Q MR = ∆TR/∆Q Social Cost = Private costs + Externalities = Social Cost (Cost to individual) + (Cost to other people) = (Cost to everyone) REVIEW QUESTIONS
1. What is the difference between internal and external economies of scale? 2. Give a brief description of four categories of internal economies of scale 3. Why might there be internal diseconomies of scale? 4. Give a brief description of two external economies of scale 5. What is the importance of the minimum efficiency scale? 6. Suggest three reasons for vertical integration. 7. How do small firms benefit an economy? 8. At what point is a firms’ profit maximized? 9. Why should the long run average cost curve for a business eventually rise?
------------------------------------------------------------------------------------------------

74
EXAMINATION TYPE QUESTION 5.1 From the following data of a firm: Output Total cost Price 0 40 9 10 70 8 20 100 7 30 140 6 40 180 5 50 200 4 i) You are required to calculate at each level of output
a) The firm’s total revenue (3 marks) b) The firm’s marginal revenue and average revenue (3 marks) c) The firm’s fixed costs (1 mark) d) The firm’s marginal cost (3 marks) e) The firm’s average cost (3 marks) f) The firm’s profit levels (3 marks)
ii) State the type of market the firm is operating in
(1 mark) iii) At what level of output will the firm aim to produce, state the reason. (2 marks) iv) State the relationship between average revenue and price (1 mark) (Total: 20 marks)

75
CHAPTER 6 MARKET STUCTURES: PERFECT COMPETITION AND MONOPOLY ______________________________________________________________________________________________ After studying this chapter, the students should be able to: � Explain what economists consider as perfectly competitive markets � Draw and explain a perfectly competitive market � Discuss the existence of one firm industries, a monopoly, the merits and demerits � Draw a monopoly market structure � Explain how pricing and output policies are determined under perfect competition and monopoly � Discuss the Economic assessment of normal and supernormal profits earned by firms � Describe price discrimination _______________________________________________________________________________________________
1.0 Markets A “market” is not necessarily a geographical or physical location where people buy and sell like at the city center market in Lusaka. The modern usage of the word “market” is an exchange mechanism, an interpersonal institution that brings together buyers and seller (both actual and potential) of particular products or services. Markets are classified according to number and size of buyers and sellers, the type of product bought and sold, the degree of mobility of resources, and the extent to which information is accessible. 1.1 Market Structures Markets are categorized into either perfect or imperfect based primarily on the degree of competition, the number of firms supplying or selling the product, whether the product bought is homogeneous (identical) or differentiated and whether firms can easily enter or exit the market. The perfect market structure is composed of perfect competition, while the imperfect market structure is made up of monopoly, monopolistic competition and oligopoly. The continuum of market structures can be summarized as follows:
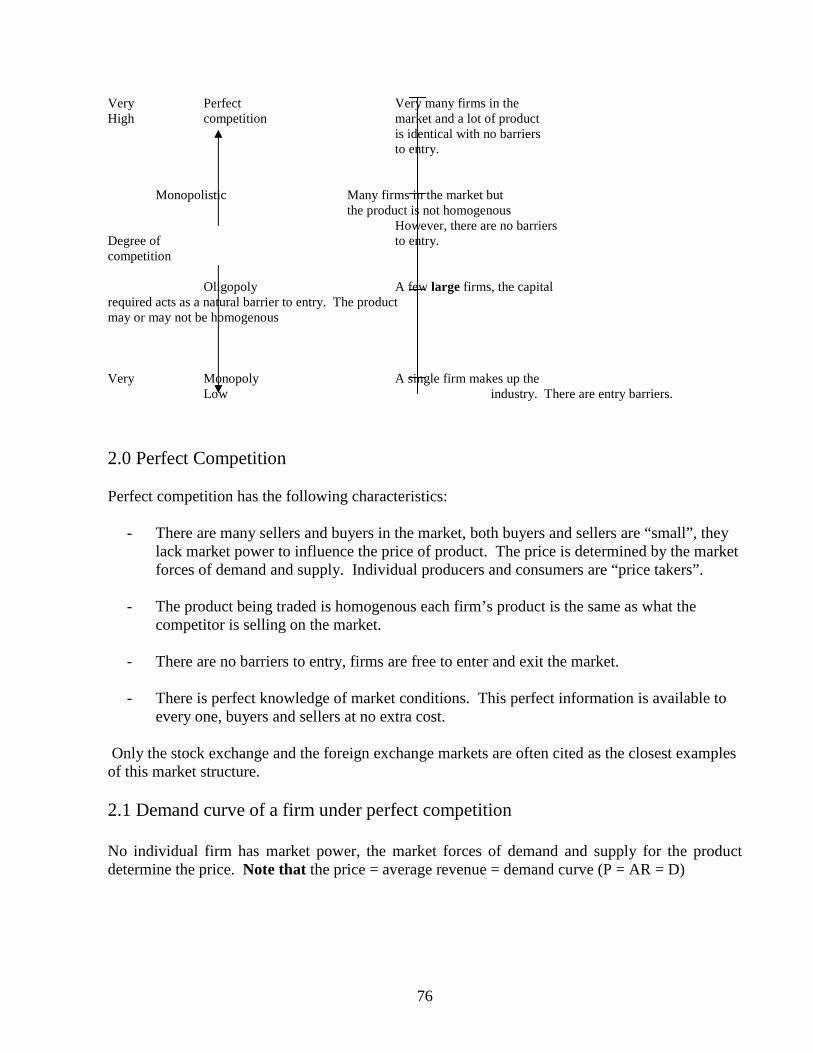
76
Very Perfect Very many firms in the High competition market and a lot of product is identical with no barriers to entry. Monopolistic Many firms in the market but the product is not homogenous However, there are no barriers Degree of to entry. competition Oligopoly A few large firms, the capital required acts as a natural barrier to entry. The product may or may not be homogenous Very Monopoly A single firm makes up the Low industry. There are entry barriers.
2.0 Perfect Competition Perfect competition has the following characteristics:
- There are many sellers and buyers in the market, both buyers and sellers are “small”, they lack market power to influence the price of product. The price is determined by the market forces of demand and supply. Individual producers and consumers are “price takers”.
- The product being traded is homogenous each firm’s product is the same as what the
competitor is selling on the market.
- There are no barriers to entry, firms are free to enter and exit the market.
- There is perfect knowledge of market conditions. This perfect information is available to every one, buyers and sellers at no extra cost.
Only the stock exchange and the foreign exchange markets are often cited as the closest examples of this market structure. 2.1 Demand curve of a firm under perfect competition No individual firm has market power, the market forces of demand and supply for the product determine the price. Note that the price = average revenue = demand curve (P = AR = D)

77
D S Price P P = AR = D Quantity Quantity The demand curve for the individual firm operating under a perfect market is a horizontal line. At a given price of OP, the firm can sell as much as it can, whatever is taken to the market is bought, and demand is infinite. However, if an individual firm increases in price, even by a very small margin, demand reduces to zero, since there is perfect market information, the product is homogenous and there are many sellers. 2.2 Short run equilibrium position The short run is defined as a period when at least one of the factors of production is fixed, therefore it is possible in the short run for individual firms to make supernormal profits or losses. Suppose the price determined by the market forces of demand and supply is high due to high demand relative to supply. Price Costs D S and MC Revenue P MR AC
0 Quantity 0 Q Quantity The firm maximizes its profits when the price and output combination is such that the marginal revenue of an additional unit of output is equal to the marginal cost of producing it. This is at output OQ were MC = MR. At this level of output, the AR (representing TR) is much higher than AC (representing TC). In short, the price charged is greater than the long run average costs

78
MC
AC
P= AR= MR
Q
0 QUANTITY
incurred, the difference are the supernormal profits made by the firm (represented by the shaded area). Alternatively, the firm can make losses if the price determined by the market forces of demand and supply is low. This can happen when market demand is low while market supply is high. Costs Price and Revenue MC AC D S 0 Quantity 0 Q Quantity The firm maximizes profits at output OQ where MC = MR, at this level of output, AC is much higher than AR and the firm makes losses. 2.3 Long run equilibrium position There are no barriers to entry, firms are free to enter and to exit. Profits and losses can only occur in the short run. Where profits are made, they are competed away through the entry of new firms and where losses are made, firms will leave. REVENUE AND COSTS
79
The firm maximizes its profits at OQ where MC = MR. At this output level, AR is also equal to AC. Individual firms earn normal profits only, in the long run. In addition, at this level of output, AC is also equal to MC, the firm is operating at its most cost effective point, where costs are at their lowest level, an indication that the firm is technically efficient. The firm is also allocatively (or economically) efficient since the price charged to the consumer equals the marginal cost of its supply. The price is equal to the demand curve and the marginal cost curve is in effect the individual firm’s supply curve. Economic efficiency occurs where demand equals supply. The unique feature of the long run equilibrium position is that all firms in the industry have MR = MC = AC = AR = P = D. Perfect competition is a theoretical model, but it sets a benchmark for efficiency and firms should strive to attain the desired benchmarks. 3.0 MONOPOLY In this market structure, one firm is the sole supplier of a product or service that has no close substitutes. The firm makes up the industry. 3.1 Characteristics The following characteristics features must be met for a monopoly to exist.
- There is only one supplier of the product or services - The product or service has no close substitutes - There are barriers to entry
3.2 Demand curve A monopolist being the sole supplier has market power and therefore the firm is a “price maker”. However, the firm can only determine either the price or the quantity, but not both at the same time. At high prices, few quantities are bought, while at low prices, demand is high. Therefore, the monopolist is faced with a downward sloping “normal” demand curve.

80
MC
Q*
P
0
PRICE
OUTPUT
CO
LMR
Economic Profit
Price
P = D = AR Output
3.3 Equilibrium position The firm maximizes its profit at OQ where MC = MR. The price charged, the average revenue is greater than the average cost. This difference is the supernormal or Economic profits earned by the monopolist, represented by the shaded area of the rectangle. The monopolist is likely to earn supernormal profits in both the short run and the long run because of the barriers to entry, the supernormal profits are not ‘competed away’ by other firms. The equilibrium position is illustrated in the diagram below. AC AR
3.4 Barriers to entry Barriers limit competition in the market. Firms are prevented from increasing the supply, pushing the supply curve to the right or pushing the demand curve to the left, which reduces the price, and eliminates the supernormal profits.
81
Barriers to entry explain why monopolies continue to exist. Some of the entry barriers are as follows:-
- Government legislation. Governments may play a major role in the creation of monopolies. A good example is the Zambia Electricity Supply Corporation (ZESCO), which is the sole supplier of electricity. The government may also be more comfortable when one organization is marketing an essential product like maize. Such as the former grain marketing boards (NAMBOARD) or the Food Reserve Agency (FRA).
- Control of the source of supply for raw materials. This gives the firm an advantage, as the other firms do not have access to the necessary raw materials to produce a product.
- Legal barriers in terms of patent and copyrights These grant a creative and innovative person or firm that has invented a product, written a book, composed a song, the exclusive right to enjoy the benefits or profits from that work, preventing others from exploiting that work.
- Immobility of factors of production. Resources are not mobile, including labour. This is worsened by the formation of trade unions and professional associations. In addition, a single firm may control a natural resource such as copper, which is found in the copper belt, no close substitute, and no other firm can set up a competing firm.
- Indivisibilities, the amount of fixed costs that a new firm would have to sustain would act as a natural barrier to entry.
- The minimum efficiency scale, which is the level of output at which the average costs first reach their minimum point, may be at a very high level. A new entrant might need to spend a lot on advertising, and sales promotion in order to compete effectively with existing companies and to increase the market share. The cost involved might again, act as a natural barrier to entry.
3.5.0 Price discrimination Price discrimination means charging different prices to different groups of consumers for the same product or service. Price discrimination is the same product or service being sold at different prices in different markets. A firm may increase its revenue by charging high prices in some markets while lowering the price in other markets but the sales volume increases, given the fact that TR = Quantity X Price. Either an increase in the quantity sold or an increase in the price leads to an increase in the total revenue. A monopolist cannot control both the price and quantity even if the firm is in an advantageous position and has market power.
3.5.1 Examples of price discrimination
- A car manufacturer who sells cars cheaply in export markets than on the local market.
- Telephone charges during public holidays, weekends and at night are lower. - Electricity and water charges are lower for domestic use than for commercial
use. - The same electricity and water charges are lower in the high-density areas than

82
in the low-density areas. - Rail fares and airfares practice price discrimination. - A doctor or lawyer who varies fees depending on the wealth of the customer.
Generally, discrimination is by income, time, place or customer.
3.5.2 Basic conditions to practice price discrimination For price discrimination to be possible, practicable and profitable, certain conditions must be fulfilled.
- Control supply of product, which means imperfections in the market. Discrimination is not possible under conditions of perfect competition.
- Consumers should be members of separate markets to prevent resale of the product.
- Elasticities of demand must be different so that different prices may be charged. - High prices are charged for inelastic markets and low prices for elastic markets,
and profits are maximized.
3.6 Regulations of monopolies The barriers to entry explain the existence of monopolies, the question is whether monopolies are harmful or beneficial. Monopolies operate against consumer interest and public policy. To this end, governments regulate monopolies by forming monopoly regulation commissions to correct the many inefficiencies resulting from lack of competition.
3.7 Arguments for monopolies
- To achieve economies of scale as a single firm supplies to the whole market. Large scale production results in a reduction in average costs. The consumer is likely to benefit from efficiencies through lower prices.
- The supernormal profits that monopolists make, enable the firm to be innovative and spend on research and development. Society gains by having new products on the market.
- It is easier for a large firm to raise capital, again this enables the firm to be innovative and spend on research and development.
- Through practicing price discrimination, monopolists ensure that the rich as well as the poor benefit by enjoying the same or a similar product.
- Some monopolies are natural due to high ratio of fixed costs to variable costs there is less contribution, which is less attractive, and as such, there are few competitors.
- Some governments feel that in some cases, production or distribution of, for example, gas, electricity and water can be carried out more efficiently if it is in the hands of a monopolist.
Where there is competition, it would be wasteful and result in higher prices to consumers.

83
3.8 Arguments against monopolies
- At the profit maximizing level of output, prices are likely to be higher while output is less than in a more competitive firm.
- The supernormal profits, which monopolies make, are naturally at the expense of customers.
- Monopolies are not technically efficient. At the profit maximizing level, the costs are not at their lowest level since the marginal cost is not equal to the average cost. This also implies that monopolies are not allocatively or Economically efficient.
- Price discrimination is a restrictive practice carried out by monopolists. - Monopolies are not threatened by competition, they tend to adopt a complacent Attitude
known as ‘x’ inefficiency, and they may not be inclined to be innovative. - The lower prices that monopolies charge once in a while because of lower costs are just
used to stifle competition. - There may be diseconomies of large-scale production due to the size of the Monopoly firm.
The firm might become difficult to coordinate and control. Communication also becomes difficult, the morale of workers is low etc.
4.0 CHAPTER SUMMARY
The market is an interpersonal institution that brings buyers and sellers together. A perfect market consists of perfect competition, while the rest are considered to be imperfect. Many sellers and buyers characterize a perfect market, the product is homogeneous, the information is perfect, and there are no entry barriers in the market. Firms operating in a perfect environment are price takers, in such an industry, market demand and supply determine the price. Individual firms earn normal profits in the long run. Monopoly is where there is only one firm in the market selling a product, which has no close substitute. A monopolist creates barriers to entry, which maybe legal barriers to entry, or otherwise, in order to enjoy supernormal profits. Monopolists generally charge higher prices and produce lower output than firms operating under a perfect market. Monopolies have a number of merits and demerits, one of which is price discrimination. Price discrimination is the charging of different prices to different customers for the same product or service.
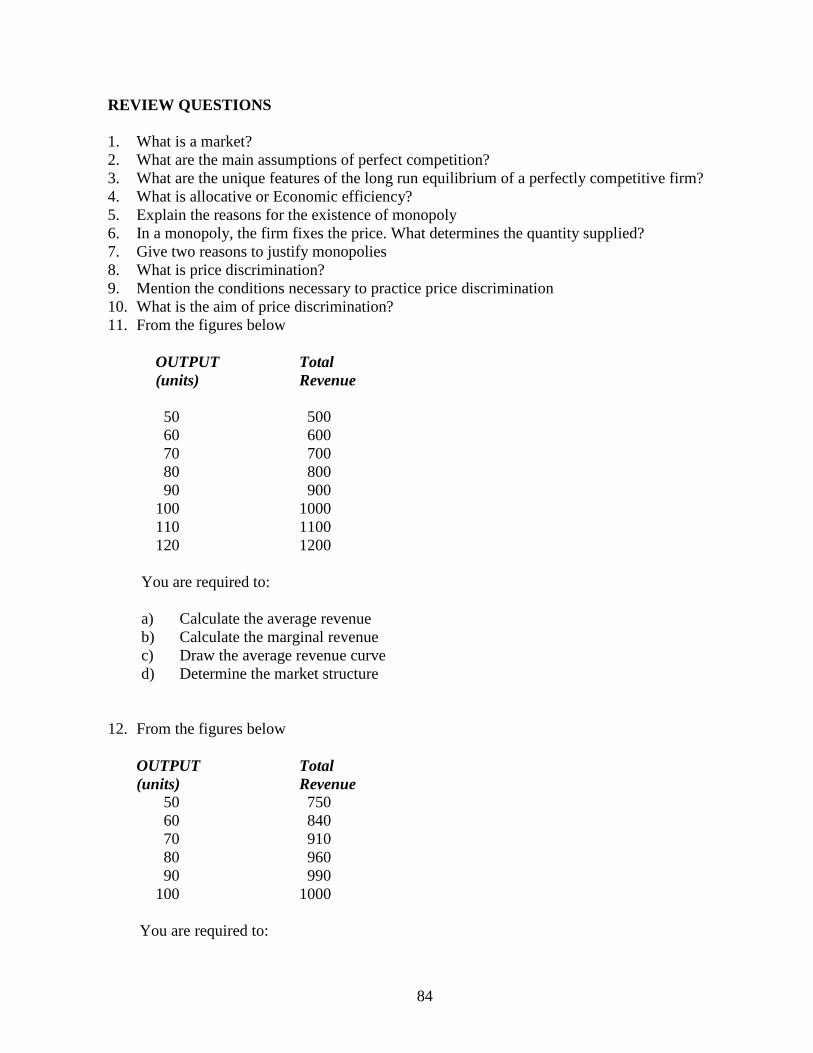
84
REVIEW QUESTIONS 1. What is a market? 2. What are the main assumptions of perfect competition? 3. What are the unique features of the long run equilibrium of a perfectly competitive firm? 4. What is allocative or Economic efficiency? 5. Explain the reasons for the existence of monopoly 6. In a monopoly, the firm fixes the price. What determines the quantity supplied? 7. Give two reasons to justify monopolies 8. What is price discrimination? 9. Mention the conditions necessary to practice price discrimination 10. What is the aim of price discrimination? 11. From the figures below
OUTPUT Total (units) Revenue
50 500 60 600 70 700 80 800 90 900 100 1000 110 1100 120 1200
You are required to:
a) Calculate the average revenue b) Calculate the marginal revenue c) Draw the average revenue curve d) Determine the market structure
12. From the figures below
OUTPUT Total (units) Revenue
50 750 60 840 70 910 80 960 90 990 100 1000
You are required to:
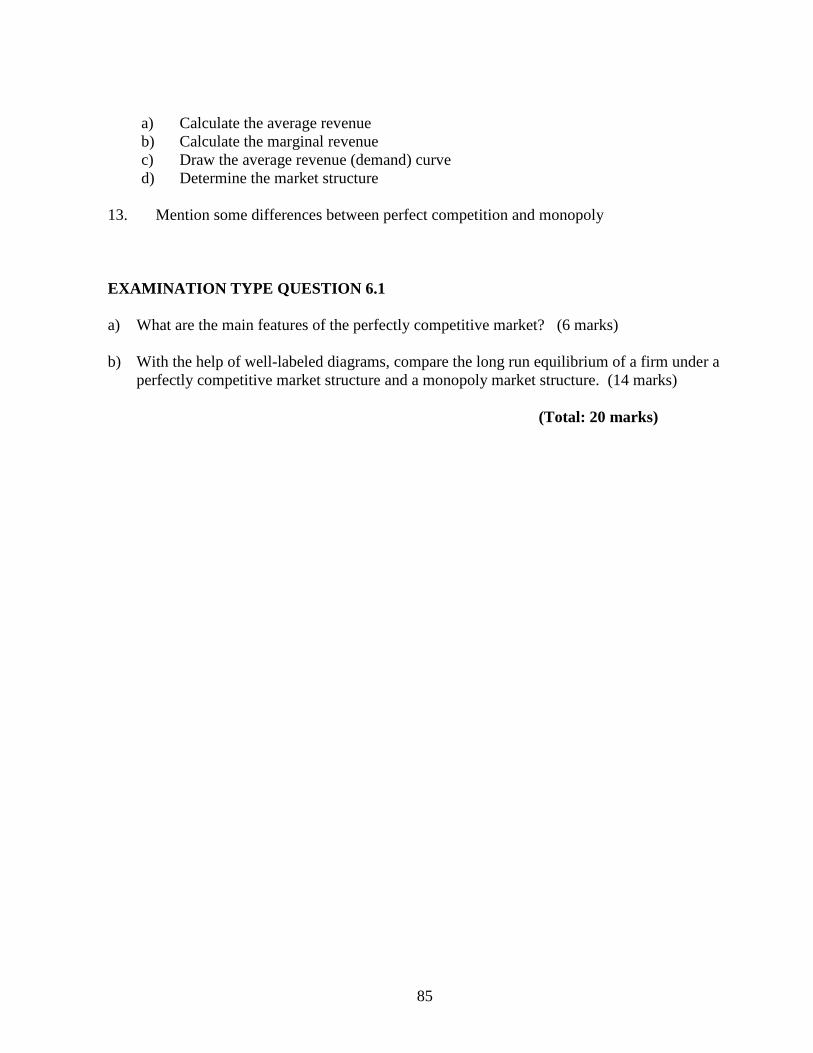
85
a) Calculate the average revenue b) Calculate the marginal revenue c) Draw the average revenue (demand) curve d) Determine the market structure
13. Mention some differences between perfect competition and monopoly EXAMINATION TYPE QUESTION 6.1 a) What are the main features of the perfectly competitive market? (6 marks) b) With the help of well-labeled diagrams, compare the long run equilibrium of a firm under a
perfectly competitive market structure and a monopoly market structure. (14 marks)
(Total: 20 marks)

86
CHAPTER 7 MONOPOLISTIC COMPETITION AND OLIGOPOLY ______________________________________________________________________________________________ After studying this chapter, the students should be able to: � Explain imperfect market structures – monopolistic competition and oligopoly � Describe the main characteristics, pricing and output policies of monopolistic competition � Explain the significance of product differentiation � Draw and understand the standard graph relating to monopolistic competition � Explain the implications of monopolistic competition � Describe the main characteristics, pricing and output policies of oligopoly � Draw and understand the standard graph relating to oligopoly markets � Explain why some firms sometimes enter into agreements not to compete against each other _______________________________________________________________________________
1.0 MONOPOLISTIC COMPETITION Monopolistic Competition combines features of perfect competition and monopoly. 1.1 Characteristics of monopolistic competition
- A large number of sellers or firms in the market - A large number of buyers - There are no barriers to entry, firms are free to enter and leave the market. - The products are not homogeneous but are differentiated through product differentiation
and non-price competition, such as the use of brand names, attractive packaging, extensive advertising, offering guarantees, good after sales services etc.
1.2 Demand curve Firms under monopolistic competition attempt to monopolise the industry through product differentiation, this gives firms some influence on price charged, as a sign that they are ‘price makers’. An individual firm is faced with a normal downward sloping demand curve, even if the demand curve is more elastic due to competition from close substitutes. Price P = D = AR Output

87
MC
Q*
P
0
OUTPUT
CO
MR
Economic Profit
1.3 Short run equilibrium position The pricing and output determination in the short run is similar to that of a monopolist since firms have some market power because of product differentiation. Individual firms under monopolistic competition maximise profits where MC = MR. At this level of output, the AR is greater than the AC, therefore the firm makes supernormal profits just like monopolies. AC REVENUE AND COSTS
AR
The supernormal profits attract new entrants into the market, since there are no entry barriers. Rival firms produce products that are similar, but somewhat differentiated. This causes the short run demand curve for an individual firm to be pushed to the left, as the supernormal profits are competed away. 1.4 Long run equilibrium position Individual firms as usual, maximize profits where MC = MR, in the long run the AR is also equal to the AC and therefore the firm only makes normal profits, as shown below.

88
Revenue and costs MC AC AR MR
0 Q Quantity
IMPLICATIONS OF MONOPOLISTIC COMPETITION
- The long run equilibrium position is not at a point where AC is minimized, therefore, there is no technical efficiency.
- A waste of resources like in a monopoly because prices are high while output is low compared to a firm under perfect competition. Firms unable to expand output to the level where AC is at a minimum, an indication that there is excess capacity.
- There is no allocative or Economic efficiency. - It is considered wasteful to produce a wide variety of differentiated versions of the same
product. - The extensive advertising is also considered wasteful.
It is also argued that monopolistic competition is not wasteful as it provides consumers with choices, the differentiated versions of the same product is for the benefit of consumers, besides, rational buyers should opt for the least cost good. 2.0 OLIGOPOLY This is a market structure with a few large firms. The number of firms is few, but the capital involved is large. The huge amounts of capital act as natural barriers to entry.

89
2.1 Introduction The oligopoly market structure is based on a number of assumptions, which makes it rather different from the market structures studied earlier. It maybe a perfect oligopoly, which means the product is homogeneous, such as the oil marketing companies in Zambia, British Petroleum, Caltex, Mobil, Agip, Total, Engen, etc. Alternatively, the product maybe differentiated, this is known as imperfect oligopoly. An example is the Japanese motor vehicle manufacturers like Nissan, Toyota, Honda, Mitsubishi, Isuzu. 2.2 Characteristics
- Interdependence between firms, this is because an individual firm is uncertain of the behaviour of rival firms.
- Price stability - Non-price competition between firms
2.3 Demand curve The shape of the demand curve depends on the assumption of the pricing policy of an individual firm. A firm operating under conditions of oligopoly might adopt a number of pricing strategies such as
- Firms collude on pricing and or output policies, they may form cartels or price rings, known as collusive oligopoly.
- A firm may become a price leader, initiating a price change, then the rival firms follow suit. - A firm may decide simply to be a price follower, awaiting the pricing decisions of other
firms. - The firm’s demand curve is based on the assumption that an oligopoly firm, which is
competing, with rival oligopoly firms decide on its own price and output levels. Even then, the firm’s decisions are influenced by what the rival firms can do, hence the kinked demand curve model.
Firms are few, and each firm has some market power, therefore the action of one firm affects the market share of the rival firms. Suppose the firm increases the price above OP, and then if the rival firms do not increase their prices, the result would be a reduction in sales and a fall in the market share. This means that demand is elastic above OP, the price of the rival firms will be relatively lower. Price D Elastic demand curve P D O Quantity

90
Note that there is no explanation as to how the price is actually determined to be at OP. If the firm lowers the price in an attempt to increase the sales and the market share, then the rival firms are likely to follow suit, as they would not like to lose their market share. This implies that the whole industry would suffer, the same quantities would be sold, but at reduced prices! Demand is therefore inelastic below OP Price Inelastic demand curve P 0 Q Quantity An oligopolist’s demand curve is a combination of the elastic and the inelastic demand curves, where the two curves intersect, a kink is formed, hence the name kinked demand curve. Price D Kink D = AR = P Quantity
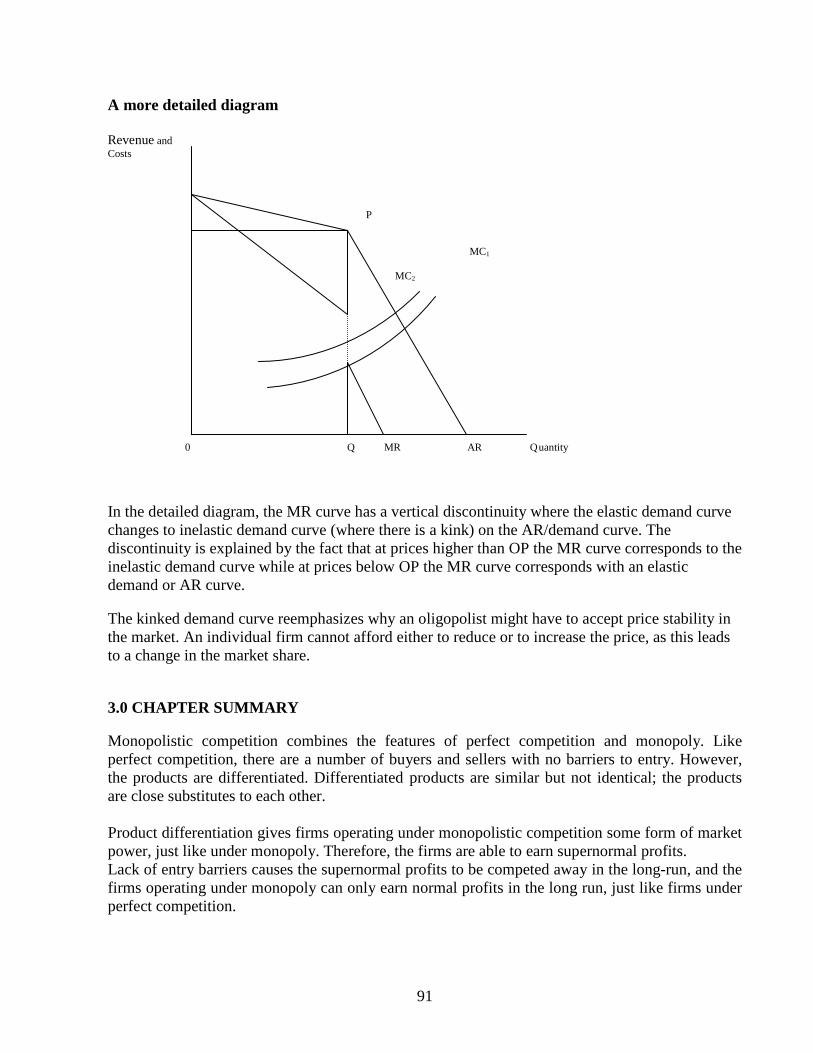
91
A more detailed diagram Revenue and Costs P MC1 MC2 0 Q MR AR Q uantity
In the detailed diagram, the MR curve has a vertical discontinuity where the elastic demand curve changes to inelastic demand curve (where there is a kink) on the AR/demand curve. The discontinuity is explained by the fact that at prices higher than OP the MR curve corresponds to the inelastic demand curve while at prices below OP the MR curve corresponds with an elastic demand or AR curve. The kinked demand curve reemphasizes why an oligopolist might have to accept price stability in the market. An individual firm cannot afford either to reduce or to increase the price, as this leads to a change in the market share. 3.0 CHAPTER SUMMARY Monopolistic competition combines the features of perfect competition and monopoly. Like perfect competition, there are a number of buyers and sellers with no barriers to entry. However, the products are differentiated. Differentiated products are similar but not identical; the products are close substitutes to each other. Product differentiation gives firms operating under monopolistic competition some form of market power, just like under monopoly. Therefore, the firms are able to earn supernormal profits. Lack of entry barriers causes the supernormal profits to be competed away in the long-run, and the firms operating under monopoly can only earn normal profits in the long run, just like firms under perfect competition.
92
However, there are some implications of firms operating under monopolistic competition compared to firms under perfect competition, in the long-run, where there are normal profits for both firms. Prices are high, output is lower, and resources are wasted under monopolistic competition. Oligopoly is defined as where there are a few large firms in the market. Oligopolistic markets do not have a standard analysis. The main characteristic feature is that an individual firm’s production decisions in such markets are interdependent, as they affect rival firms. This major feature of oligopoly markets is what leads to the kinked demand curve model. When groups of oligopoly firms agree on the price, and or output policies, then a cartel has been formed.
REVIEW QUESTIONS 1. Write two ways in which a firm operating under monopolistic competition can practice
product differentiation 2. What is the importance of product differentiation in monopolistic competition? 3. What is a cartel? 4. How is the oligopoly market structure different from other market structures? 5. What is meant by non-price competition? 6. Mention the implication of the kinked demand curve model for price and output by an
oligopoly firm? 7. Draw a kinked demand curve
---------------------------------------------------------------------------
EXAMINATION TYPE QUESTION 7.1
a) In what ways does monopolistic competition differ from perfect competition? (12 Marks) b) Is it correct to describe monopolistic competition as wasteful? (4 Marks) c) What is product differentiation? (4 Marks) (TOTAL: 20 MARKS)

93
SSEECCTTIIOONN BB
MMAACCRROOEECCOONNOOMMIICCSS
94
CHAPTER 8
NATIONAL INCOME ______________________________________________________________________________________________ After studying this chapter, the students should be able to: � Describe the national income of a country � Explain the relationship between output, income and expenditure using the circular flow of income � Explain the measurement of the national income � Discuss the problems associated with the measurement of national income � Appreciate the uses of national income figures � Explain the factors that determine a country’s national income _______________________________________________________________________________ 1.0 Introduction
Measures of national income and output are used in Economics to estimate the value of goods and services produced in an economy. They use a system of national accounts or national accounting first developed during the 1940s. Some of the more common measures are Gross National Product (GNP), Gross Domestic Product (GDP), Gross National Income (GNI), Net National Product (NNP), and Net National Income (NNI).
There are at least three different ways of calculating these numbers. The expenditure approach determines aggregate demand, or Gross National Expenditure, by summing consumption, investment, government expenditure and net exports. On the other hand, the income approach and the closely related output approach can be seen as the summation of consumption, savings and taxation. The three methods must yield the same results because the total expenditures on goods and services (GNE) must by definition be equal to the value of the goods and services produced (GNP) which must be equal to the total income paid to the factors that produced these goods and services (GNI).
In practice, there are minor differences in the results obtained from the various methods due to changes in inventory levels. This is because goods in inventory have been produced (and therefore included in GDP), but not yet sold (and therefore not yet included in GNE). Similar timing issues can also cause a slight discrepancy between the value of goods produced (GDP) and the payments to the factors that produced the goods, particularly if inputs are purchased on credit.
Gross National Product
Gross National Product (GNP) is the total value of final goods and services produced in a year by a country's nationals (including profits from capital held abroad).

95
Gross Domestic Product
Gross Domestic Product (GDP) is the total value of final goods and services produced within a country's borders in a year.
To convert from GNP to GDP you must subtract factor income receipts from foreigners that correspond to goods and services produced abroad using factor inputs supplied by domestic sources. To convert from GDP to GNP you must add factor input payments to foreigners that correspond to goods and services produced in the domestic country using the factor inputs supplied by foreigners.
GDP is a better measure of the state of production in the short term. GNP is better when analysing sources and uses of income
Real and nominal values
Nominal GNP measures the value of output during a given year using the prices prevailing during that year. Over time, the general level of prices rises due to inflation, leading to an increase in nominal GNP even if the volume of goods and services produced is unchanged.
The national income of any country is important because it helps to assess the performance of a country over a period of time, usually in a year. National income accounting is much like the accounting carried out by the individual firms to detect growth or decline in the profitability of a company. The national income figure that is calculated is used to compare the performance of the country in the previous years as well as the performance of that country with other countries. In theory, the three methods of measuring the national income should provide the same figure as illustrated by the circular flow of income. 1.1 The circular flow of income The circular flow of income describes how money moves between the different sectors in the economy. The expenditure of one sector is the income of another sector. For a closed simple economy where there are only two sectors, firms and households, firms employ labour to produce goods and services. Firms spend on labour since households receive income for providing labour. Household income is spent on goods and services from firms.
HOUSEHOLDS
FIRMS
Income
Consumption Goods Market
Factor Markets

96
1.2 THE NATIONAL OUTPUT OR THE VALUE ADDED METHOD This is the total of consumer goods and services investment goods (including additions to stocks) produced by the country during the year. The production of goods and services in different sectors of the economy is added together. For example what is produced in the agriculture and fisheries, forestry, manufacturing, hotels, banking, national defence, education, health sectors etc, is all added together to arrive at the national income using the output method. It can be measured by
- Totaling the value of the final goods and services and produced or - Totaling the value added to the goods and services by each firm, including the government.
This is done to avoid double counting and in order to use this method, a detailed knowledge of pricing is required. This explains why the output method is also known as the value added method.
The usefulness of this method is that it shows the changing shares of the industrial sectors in an economy, that is a sector which is expanding or falling it its contributions to the national income. 1.3 NATIONAL INCOME Using this approach, the total factor incomes received by persons and firms for the provision of factors of production, is added. Income from employment, trading profits, rent and interest are all added together to arrive at the national income using the income method. When using this method:
- Transfer payments or transfer incomes are excluded because the people receiving them do not produce anything. It includes private money gifts, sale of second hand goods such as a house, a car etc.
- Stock appreciation is deducted from the total because when inflation makes existing unsold stocks more valuable, production has not increased.
- Residual error (statistical discrepancy) is added to make statistics from each method balance.
1.4 NATIONAL EXPENDITURE This involves adding together all total amounts spent on final goods and services by households, central and local government, including what is spent by firms on the net additions to capital goods and stocks in the course of the year. The calculation of the national income using the expenditure method is what is known as the aggregate demand. This total spending is made up of consumption expenditure, plus investment expenditure, plus government expenditure, plus net exports (that is exports minus imports).
Adjustments have to be made for taxes and subsidies as they distort market prices, the idea is to measure the national expenditure, which corresponds to the cost of the factors of

97
production used in producing the national product, which is known as national expenditure at factor cost. The usefulness of this method is in detecting changing trends in consumption and investment, although this is the most widely used method, it trends to over estimate national output. GROSS DOMESTIC PRODUCT (GDP) The GDP is the first value arrived at in the national income calculations, before any adjustments are made. This is often referred to as the value of the output produced in the country during one year and if it increases in real terms, then it is a sign that the economy has grown. The GDP is calculated at market prices, but after taxes are deducted and subsidies are added, the GDP is at factor cost. GROSS NATIONAL PRODUCT (GNP) This refers to the value of the output produced by residents of a country in a year. It is arrived at after including the output produced by companies and individuals of a country but they are based abroad. In addition, output produced by foreigners and overseas companies in that country is deducted. This is summarized as net property income from abroad, which maybe positive or negative. CAPITAL CONSUMPTION Capital assets suffer wear and tear as such depreciation, termed capital consumption is deducted from GNP to arrive at the Net National Product or the National Income is short. In summary GDP at market Prices - indirect taxes + Subsidies = GDP at Factor cost + Net property income from abroad = GNP - Depreciation = N I

98
1.5 ZAMBIA’S GROSS DOMESTIC PRODUCT BY KIND OF ECON OMIC ACTIVITY AT CURRENT PRICES (K'BILLION), 2003 – 2005 USING THE VALUE ADDED (OUTPUT) METHOD
KIND OF ECONOMIC ACTIVITY 2003 2004 2005*
Agriculture, Forestry and Fishing 4,244.6 5,568.2 6,856.6
Agriculture 1,008.2 1,249.5 1,526.0
Forestry 2,960.3 3,998.5 4,953.6
Fishing 276.1 320.2 377.0
Mining and Quarrying 564.8 809.6 980.5
Metal Mining 558.2 798.3 960.4
Other Mining and Quarrying 6.6 11.3 20.0
PRIMARY SECTOR 4,809.4 6,377.7 7,837.0
Manufacturing 2,241.0 2,827.7 3,458.1
Food, Beverages and Tobacco 1,397.2 1,726.6 2,145.5
Textile, and Leather Industries 352.9 450.7 491.2
Wood and Wood Products 164.7 222.2 283.7
Paper and Paper products 93.1 123.6 161.0
Chemicals, rubber and plastic products 178.9 231.7 286.3
Non-metallic mineral products 30.0 41.0 51.6
Basic metal products 3.1 4.0 4.6
Fabricated metal products 21.0 27.7 34.2
Electricity, Gas and Water 595.1 694.7 922.7
Construction 1,590.0 2,402.1 3,689.8
SECONDARY SECTOR 4,426.1 5,924.5 8,070.6
Wholesale and Retail trade 3,873.8 4,843.7 6,079.7
Restaurants, Bars and Hotels 527.7 670.9 895.9
Transport, Storage and Communications 1,058.2 1,252.3 1,408.3
Rail Transport 89.5 100.8 99.9
Road Transport 393.9 464.0 546.7
Air Transport 152.7 203.0 246.7
Communications 422.1 484.6 515.0
Financial Intermediaries and Insurance 1,847.7 2,282.7 2,776.9
Real Estate and Business services 1,341.2 1,691.8 2,105.8
Community, Social and Personal Services 1,757.0 2,046.5 2,529.1
Public Administration and Defence 683.0 723.9 869.4
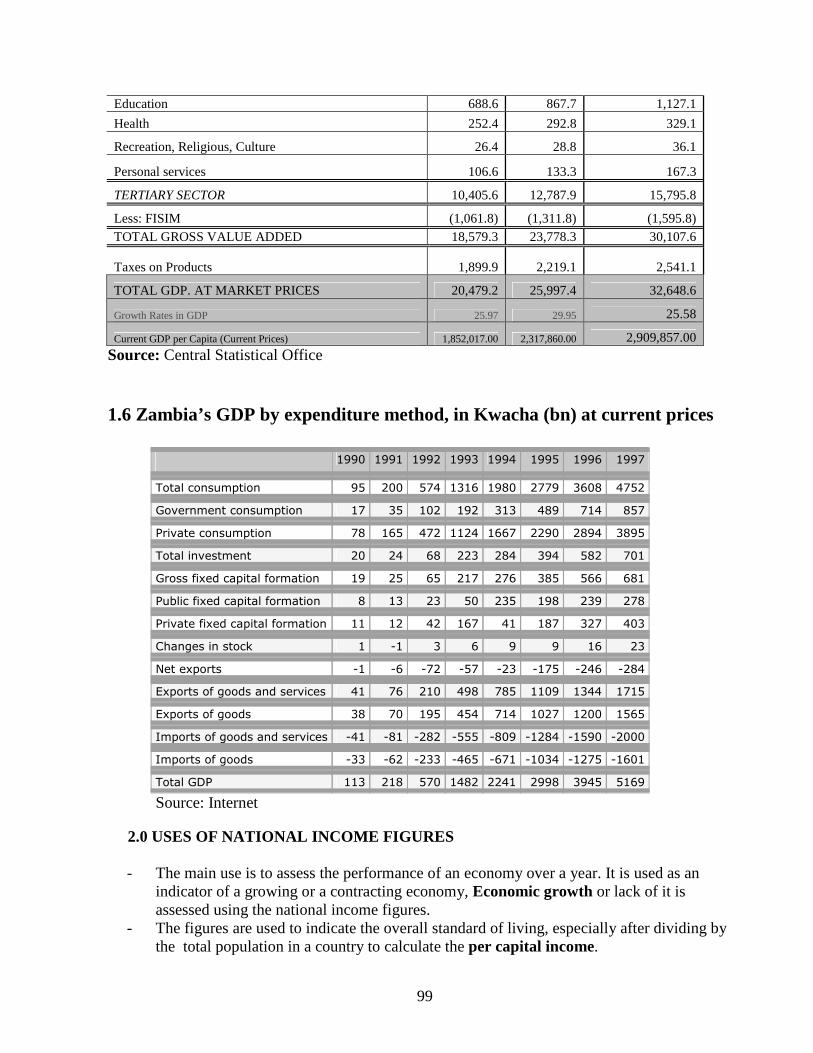
99
Education 688.6 867.7 1,127.1
Health 252.4 292.8 329.1
Recreation, Religious, Culture 26.4 28.8 36.1
Personal services 106.6 133.3 167.3
TERTIARY SECTOR 10,405.6 12,787.9 15,795.8
Less: FISIM (1,061.8) (1,311.8) (1,595.8) TOTAL GROSS VALUE ADDED 18,579.3 23,778.3 30,107.6
Taxes on Products 1,899.9 2,219.1 2,541.1
TOTAL GDP. AT MARKET PRICES 20,479.2 25,997.4 32,648.6
Growth Rates in GDP 25.97 29.95 25.58
Current GDP per Capita (Current Prices) 1,852,017.00 2,317,860.00 2,909,857.00 Source: Central Statistical Office
1.6 Zambia’s GDP by expenditure method, in Kwacha (bn) at current prices
1990 1991 1992 1993 1994 1995 1996 1997
Total consumption 95 200 574 1316 1980 2779 3608 4752
Government consumption 17 35 102 192 313 489 714 857
Private consumption 78 165 472 1124 1667 2290 2894 3895
Total investment 20 24 68 223 284 394 582 701
Gross fixed capital formation 19 25 65 217 276 385 566 681
Public fixed capital formation 8 13 23 50 235 198 239 278
Private fixed capital formation 11 12 42 167 41 187 327 403
Changes in stock 1 -1 3 6 9 9 16 23
Net exports -1 -6 -72 -57 -23 -175 -246 -284
Exports of goods and services 41 76 210 498 785 1109 1344 1715
Exports of goods 38 70 195 454 714 1027 1200 1565
Imports of goods and services -41 -81 -282 -555 -809 -1284 -1590 -2000
Imports of goods -33 -62 -233 -465 -671 -1034 -1275 -1601
Total GDP 113 218 570 1482 2241 2998 3945 5169
Source: Internet 2.0 USES OF NATIONAL INCOME FIGURES
- The main use is to assess the performance of an economy over a year. It is used as an indicator of a growing or a contracting economy, Economic growth or lack of it is assessed using the national income figures.
- The figures are used to indicate the overall standard of living, especially after dividing by the total population in a country to calculate the per capital income.
100
- This enables comparisons to be made between different countries. To ascertain which are rich and which ones are poor countries.
- To assist the government in managing the economy, using Keynesian demand management.
- The trade or Economic cycles depend on the national income figures. The figures are also used to estimate future movements.
2.1 LIMITATIONS IN NATIONAL INCOME CALCULATIONS 1. There are differences in the accuracy of the figures. Different countries collect and invest in
data collection differently. 2. Economic welfare affected by medical and educational facilities per head. There is need to
know what proportion of the national income is spent on the provision of better social sector facilities and not on defence! As with all mathematical averages, per capita income data does not take into account how the GDP is distributed amongst the population. If the income is unevenly distributed, then increases in the GDP per capita may disproportionately benefit a small group of high income earners and have little impact on reducing poverty. If GDP per capita data is to be used then its distribution must also be taken into account.
3. Arbitrary definitions, for example when calculating the national income, only those goods and
services that are paid for, are normally included. Do it yourself jobs, such as gardening, repairing one’s own car, housework etc, are excluded, and their exclusion distort the national income figure. These unpaid services, which are normally provided by housewives, are included in the calculation of the national income when done by someone else. If an individual lives a in a house for which he pays rent to the landlord, this will be treated differently from owning a house for which he no longer pays rent
4. Incomplete information, which can be attributed to, the high levels of subsistence sector,
barter and black economies that are more pronounced in developing countries. 5. Danger of double counting, for example, the cost of raw materials and that of finished goods
should not both be counted, this difficult to avoid when using the output method of calculating the national income.
6. Using any monetary data, such as GDP per capita over time, must recognise that output and
incomes measures can increase for many reasons other than the country producing more goods.
It is an increase in goods and services that is necessary if poverty is to be alleviated or peoples’ livings standards rose. Output and incomes measures may increase because the rate of inflation has simply increased the money value of goods and service produced rather than their real value. Real GDP per capital would be a better indicator, as this is a measure of the physical value of goods and services produced. Real GDP is equal to the nominal GDP adjusted for price changes, (minus inflation).
The different rates of inflation and the constant variations in the exchange rate within and in
101
different countries make comparisons difficult. 7. The national income measures the standard of living. This has to relate to the size of the
population. Some countries have a high-income figure and a correspondingly high population. 8. Some countries have high national income figure but are paying a high penalty for living
beyond their means and borrowing heavily. 9. It should be remembered that GDP only includes output that involves a financial transaction
i.e. is marketable. A considerable amount of Zambia's agricultural output is produced on small-scale communal farms for subsistence purposes. It is currently estimated that only 25% of production on communally owned land involves monetary transactions. The rest is not included in any national income calculations. Likewise the output of the informal sector will not be included.
10. Increasing national income and growth may occur at the expense of the environment rapidly
growing economies may result in negative externalities. An agricultural sector that increases productivity by intensive use of pesticides and fertilisers or deforestation. may reduce future land fertility and worsen the level of poverty for future generations
2.2 FACTORS DETERMINING A COUNTRY’S NATIONAL INCOME Income is not evenly distributed, and the factors determining a country’s national income can be classified as internal and external, the latter resulting from a country’s relationships with the rest of the world. The most important internal factors are Original Natural Resources Natural resources are nature-given, such as mineral deposits, sources of fuel and power, climate soil fertility, fisheries, navigable rivers, lakes that help communications etc. New techniques allow national resources to be exploited while the exhaustion of minerals resources reduces national income. Some countries are well endowed by nature, and if the resources were well managed, then the national income would be high. Where a country’s economy is predominantly agricultural, variations in weather may cause national income or output to fluctuate from year to year, this happens to be the problem with most developing countries. The nature of the people, particularly of the labour force This includes the quantity of the labour force, the higher the proportion of workers to the total population and the longer their working hours, the greater s the national income figure.

102
Another factor is the quality of the labour force, their health, nutrition, energy, inventiveness, judgment and ability to organize them to cooperate in production, the climate, working conditions, peace of mind as well as education and training. Capital Equipment Productivity or labour will be increased if the quality of the other factors is high, for example, the more fertile the land, the greater is the output per man. In addition, the quality of the capital equipment employed is the most important factor, the output of workers varies almost in direct proportion to the capital equipment, and the single most important material progress is investment in capital. Consider the output per man where the majority of the farmers are using a hoe and an axe, while in advanced countries, farmers use tractors and combine harvesters! Knowledge of techniques This is acquired through the development of Research and inventions. The government can encourage this by financing research schemes. Alternatively the government can go into partnership with the private sector or offer incentives such as tax rebates to companies that are spending a lot on research and development. New inventions can bring in more income into the economy. The organization of resources One of the known factors that can improve production and therefore national income in most of the developing countries is the organization and the management of resources. The leaders of any economy should have a vision for their countries. They have to be focused, set goals and objectives, have the right people and the right resources in order to achieve those objectives. Political stability A country has to be politically stable in order to produce. If the resources are being used on warfare, very little production of goods and services takes place. This again is a common problem in developing countries. Even if some are well endowed, they are not politically stable and the organization of resources is poor. The external factors are Foreign loans and investments These are an injection of funds that lead to an addition of stock, adding to the national income.

103
Related to the above, gifts or handouts from abroad for the purposes of Economic development and defence improve the national income of the receiving countries. Terms of trade This is the rate at which one country’s exports exchange with another country’s imports. The terms of trade is not constant, it changes as export and import prices change. Developing countries generally deal in the primary sectors and not in the secondary sectors in production. They export goods at low prices in their raw form, but import goods at relatively high prices as these are finished goods. 3.0 CHAPTER SUMMARY The national income of any country is simply the total value of goods and services its people produce during the year. The national income can be measured in three different ways, the value added (output) method, the income method and the expenditure method. In theory, all the three methods should provide the same national income figure, based on the circular flow of income. A simple model of the circular flow of income assumes a two-sector economy of firms and households. Factors of production move from households to firms, for the production of goods and services. Firms pay factor incomes, such as wages and salaries to households in exchange for the factors. The income earned by households is spent on goods and services produced by firms. Calculation of the national income is very important in every economy as the figure has a number of uses. It is used to assess the performance of the economy over the years, to indicate the overall standard of living, and to enable comparisons to be made, from one year to the next, as well as comparisons between countries. Unfortunately, there are a number of difficulties that are encountered in measuring national income, which provides unreliable testimony as to how the real welfare of the people has changed, and when making comparisons. The national income, and therefore Economic growth depends on the natural resources of a country, the quality of the labour force and its participation rate, the capital equipment being used etc.

104
REVIEW QUESTIONS 1. Outline the three approaches used in calculating national income 2. Distinguish between GDP and GNP 3. What is the difference between nominal and real GDP? 4. What are transfer payments? Give examples. 5. Explain why the transfer payments must not be included in the national income figure 6. What is net national income at factor cost + capital consumption + indirect taxes on
expenditure – subsidies equal to? 7. From the hypothetical data below relating to the economy of a country over a one year period
K’m Subsidies 2 000 Exports 25 000 Government expenditure 40 000 Net property income from abroad 1 000 Imports 53 000 Capital consumption 8 000 Capital formation 38 000 Taxes on expenditure 30 000 Consumers’ expenditure 97 000 Value of physical increase in stocks 5 000 You are required to calculate:
a) The GDP at market prices b) The GDP at factor cost c) The GNP at factor cost
8. Why are the figures above considered as “gross” ------------------------------------------------------------------------------------------ EXAMINATION TYPE QUESTION 8.1 a) Explain the three ways of measuring the national income figure. (9 Marks) b) Give a brief explanation why theoretically the national income figure should be the same
whichever method is used in its measurement. (2 Marks) c) Give three reasons why national income accounts are not very useful in making comparisons
of living standards between countries. (9 Marks)
(TOTAL: 20 MARKS)
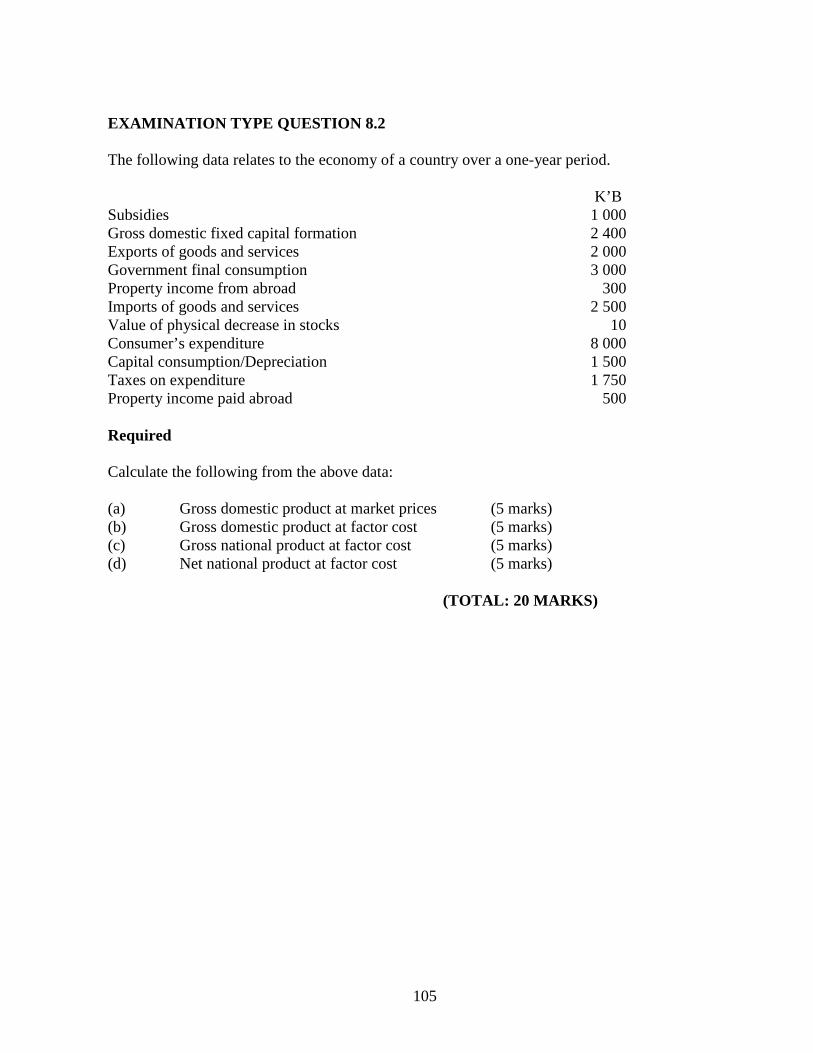
105
EXAMINATION TYPE QUESTION 8.2 The following data relates to the economy of a country over a one-year period. K’B Subsidies 1 000 Gross domestic fixed capital formation 2 400 Exports of goods and services 2 000 Government final consumption 3 000 Property income from abroad 300 Imports of goods and services 2 500 Value of physical decrease in stocks 10 Consumer’s expenditure 8 000 Capital consumption/Depreciation 1 500 Taxes on expenditure 1 750 Property income paid abroad 500 Required Calculate the following from the above data: (a) Gross domestic product at market prices (5 marks) (b) Gross domestic product at factor cost (5 marks) (c) Gross national product at factor cost (5 marks) (d) Net national product at factor cost (5 marks)
(TOTAL: 20 MARKS)

106
CHAPTER 9 NATIONAL INCOME DETERMINATION ______________________________________________________________________________________________ After studying this chapter, the students should be able to: � Explain the relationship between national income, consumption expenditure, savings and
investment � Discuss the factors that determine consumption, savings and investment � Explain how the multiplier and the accelerator works � Explain what the circular flow of income for an open (complex) economy is � Discuss Economic or business cycles and their characteristic features _______________________________________________________________________________
1.0 Introduction In macroeconomics, there are mainly theories of two schools of thought. The monetarists, the famous one being Milton Friedman, their arguments are mostly on the money supply and the effects of changes in the money supply. The Keynesians, advocates of Sir John Maynard Keynes. Keynes wrote a book entitled General Theory of Employment, Interest and Money, published in 1936. His work was at the time of the great depression. 1.1 CONSUMPTION EXPENDITURE From the circular flow of income, spending by households is termed consumption expenditure. It is an endogenous part of the circular flow of income. Consumption expenditure depends on an individual’s income, it is therefore a function of income. C = F (Y). As Y increases the level of consumption also increases but Lord Keynes maintained that each successive increment to real income is marched by a smaller increment to consumption expenditure, the rest is saved.

107
Consumption and Savings AS (Y) Savings S Dissavings a 450 Disposable income The extent to which consumption changes with income is termed the marginal propensity to consume (MPC). The marginal propensity to consume is the proportion of each extra kwacha of disposable income spent by households. That proportion of each extra kwacha of disposable income not spent by households is known as the marginal propensity to save (MPS). If out of the extra kwacha increase, eighty ngwee is consumed, then the marginal propensity to consume is 80% or 0.8, and the marginal propensity to save is 20% or 0.2. Therefore the MPC is the ratio at which the extra income earned is consumed, and it is denoted by the formula: MPC = ∆C, and it depends on the slope of C. ∆Y the steeper the slope, the larger is MPC MPC depends on the slope of the consumption function, the steeper the slope, and the larger the MPC, which implies a small MPS. The nature of the relationship between consumption and income is given by the straight-line equation: C = a + by Where C = consumption a = C when an individual is not working and income from employment is zero, it is also known as autonomous consumption. b = MPC y = income,

108
For example, assume K650 000 is required for a family of three people to survive, whether the head of the family is working or not. The K650 000 has to be found for the family to stay alive; it can come from social security, dissavings, begging, borrowing etc. When in employment, for every extra kwacha earned, 80 ngwee is consumed. The equation becomes C = 650,000 + 0.8Y. Factors influencing consumption are income, interest rates, government policy such as taxation, which reduces the disposable income, hire purchase and other credit facilities, and invention of new consumer goods, which are later, introduced on the market. Note that in any economy households, firms and government undertake consumption of goods and services 2.0 SAVINGS Savings is defined as the part of income not spent, it is a withdrawal or a leakage from the circulation flow of income. Y = C + S ∴ S = Y – C Therefore consumption and savings are two sides of the same coin and the consumption function tells us not only how much households consume, but also how they save. The factors that influence consumption naturally affect savings. MPS is denoted by the formula = ∆S ∆Y where ∆ is change. Since any increment in income must be either spent or saved, MPC + MPS = 1 3.0 INVESTMENT EXPENDITURE Investment is spent on the production of capital goods (houses, factories, machinery, etc) or on net additions to stocks such as raw materials, consumer goods in shops, etc. In national income analysis, investment takes place only when there is an actual net addition to capital goods or stocks. Investment is a major injection into the circular flow of income and affects national income and aggregate demand. Investment through the multiplier is needed to achieve Economic recovery. Investment is very dynamic, it determines future shape and pattern of Economic recovery.
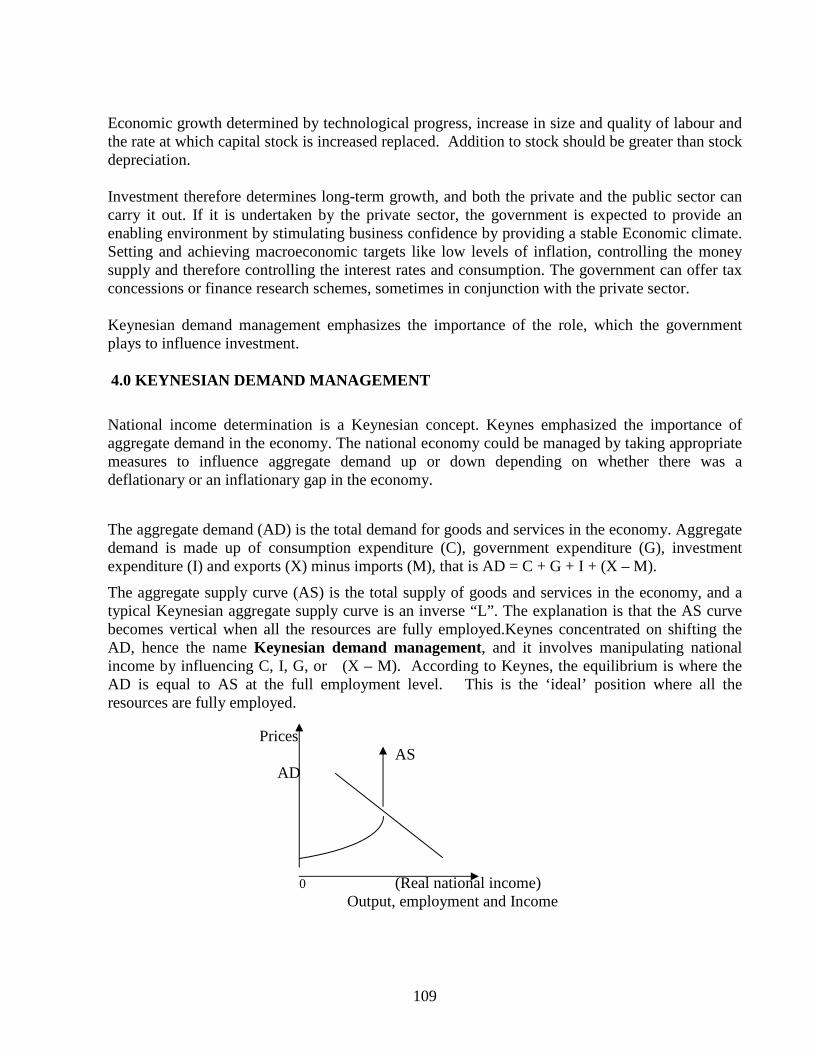
109
Economic growth determined by technological progress, increase in size and quality of labour and the rate at which capital stock is increased replaced. Addition to stock should be greater than stock depreciation. Investment therefore determines long-term growth, and both the private and the public sector can carry it out. If it is undertaken by the private sector, the government is expected to provide an enabling environment by stimulating business confidence by providing a stable Economic climate. Setting and achieving macroeconomic targets like low levels of inflation, controlling the money supply and therefore controlling the interest rates and consumption. The government can offer tax concessions or finance research schemes, sometimes in conjunction with the private sector. Keynesian demand management emphasizes the importance of the role, which the government plays to influence investment. 4.0 KEYNESIAN DEMAND MANAGEMENT
National income determination is a Keynesian concept. Keynes emphasized the importance of aggregate demand in the economy. The national economy could be managed by taking appropriate measures to influence aggregate demand up or down depending on whether there was a deflationary or an inflationary gap in the economy.
The aggregate demand (AD) is the total demand for goods and services in the economy. Aggregate demand is made up of consumption expenditure (C), government expenditure (G), investment expenditure (I) and exports (X) minus imports (M), that is AD = C + G + I + (X – M).
The aggregate supply curve (AS) is the total supply of goods and services in the economy, and a typical Keynesian aggregate supply curve is an inverse “L”. The explanation is that the AS curve becomes vertical when all the resources are fully employed.Keynes concentrated on shifting the AD, hence the name Keynesian demand management, and it involves manipulating national income by influencing C, I, G, or (X – M). According to Keynes, the equilibrium is where the AD is equal to AS at the full employment level. This is the ‘ideal’ position where all the resources are fully employed. Prices AS AD 0 (Real national income) Output, employment and Income

110
Suppose the economy is in a recessionary stage, and there is underemployment of resources, it means there is a deflationary gap. Prices AD AS P D P1 O Y YFE (Real national income) Output, employment and Income Where D is the deflationary gap, this is the extent to which the government needs to increase AD to shift it to the right or upward to reach the ‘ideal’ full employment level in the economy. Alternatively, the economy maybe experiencing inflationary pressures if AD is above the ‘ideal’ full employment position. The resources cannot be increased any further and this puts pressure on the prices of goods and services. Prices AD AS AD1 P I P1 (Real national income) Output, employment and Income Where I is the inflationary gap, the extent to which the government needs to reduce AD to shift the curve from AD to AD1, back to the equilibrium level.

111
4.1 THE MULTIPLIER PRINCIPLE Keynesian demand management involves manipulating national income by influencing C, I, G, or X – M, while C is an endogenous part of circular flow of income, the others are injections into the circular flow. Any injection into the circular flow of income of a country starts a snowball effect. If the government decides to build a big hospital in Zambezi district costing K10 billion, the increase in government expenditure through the construction of the hospital provides incomes to the factors of production employed in the construction of the hospital. Part of the K10 billion goes to the contractor as profits, part of it goes to the workers as wages and part of it is used for the purchase of building materials. The three groups who will earn the income will spend it. Any expenditure becomes someone else’s income, which is then in turn spent, generating a whole series of rounds of additional spending and income generation, the snowball effect. However, not all the income earned is consumed, some of it is saved. Savings is a leakage from the circular flow, other leakages from the circular flow of income are imports and taxes. The total amount leaked out is known as the marginal rate of leakages. The effect on total national income of a unit change any of the injections into the circular flow income can be measured, it is called the multiplier. The investment, government or export multiplier = Eventual change in NI Initial change in I, G spending or X The multiplier is denoted by the symbol K, and can be re-written as K = Total increase in NI Initial increase in NI The shortcut method is to take into account the leakages, therefore K = 1 Marginal rate of leakages Numerical example in a simple closed economy starts with the assumption that income is either consumed or saved. Suppose the MPC in the example above where there is an injection of K10 billion is 80% (0.8). & income increases by £200

112
HOUSEHOLDS
FIRMS
Income
ConsumptGoods Market
Factor Market
SAVINGS
TAXATION
IMPORTS
INVESTMENT
GOVERNMENT
EXPORTS
Increase in Increase in Expenditure Savings (K’billion) (K’billion) Stage
1 Income increase 10 - 2 80% consumed 8 2 3 A further 80% is consumed 6.4 1.6 4 A further 80% is consumed, etc 5.12 1.28 It works out to be K = 1 = 1 = 1 = 5 times 1 – MPC MPS 0.2 This translates to 5 times the initial investment of K10 billion, meaning that the eventual change in national income is K50 billion! If the marginal propensity to consume were much higher than 80%, then the multiplier effects would be much higher and vice versa. Multiplier in a complex, open economy would be lower because all the leakages or withdrawals from the circular flow of income would be taken into account. THE CIRCULAR FLOW OF INCOME FOR AN OPEN (COMPLEX) ECONOMY WITHDRAWALS /
LEAKAGES INJECTIONS 4.2 Accelerator theory The accelerator relates to a small change in the output of consumer goods, which is said to result in a greater change in the output of capital equipment. This change in the production of capital equipment depends on the capital-output ratio.

113
Boom
Recessions
Depression
Recovery
TIME
GROWTH (%)
The accelerator theory suggests that the level of net investment will be determined by the rate of change of national income. If national income is growing at an increasing rate then net investment will also grow, but when the rate of growth slows net investment will fall. There will then be an interaction between the multiplier and the accelerator that may cause larger fluctuations in the trade cycle. In the multiplier principle, an increase in investment affects income and consumption, while under the accelerator, consumption affects investment. When the economy is expanding, and income as well as consumption is high, then the business sector is encouraged to produce more goods. Thus investment increases. The increase in investment leads to an increase in income and consumption, and so on. The combined effect of both the multiplier and the accelerator results in the sequence of rapid growth in the national income followed by a slow growth, the business or trade cycles. These are made up of four phases namely, the recession, depression, recovery and boom. When aggregate demand falls, businesses are discouraged, and both employment and production fall this is the recession stage. If this continues, then a full depression sets in.While a recession is quicker, recovery is slower because of lack of business confidence. Once recovery starts it is likely to quicken as business confidence returns. As output, employment and income increase, there is even more investment because of business expectations until a ‘business boom’ is reached. 4.3 THE PARADOX OF THRIFT In theory, investment depends on savings. In order to increase savings, consumption must reduce because income is either consumed or saved. Unfortunately, a reduction in consumption reduces business expectations, and the business sector reduces investment. A reduction in investment causes greater reductions in income. When income reduces, savings also reduces. The paradox of thrift explains the working of the ‘demultiplier’.

114
5.0 CHAPTER SUMMARY
The level of national income of any country is determined by the relationship between decisions by households to spend and save and decisions by the business community to invest. The consumption function is C = a + bY. Where b is the marginal propensity to consume, this is the proportion of an increase in income, which is spent (consumed). Therefore, the most important determinant of the level of consumption is income. Savings is that amount of income not spent, and therefore, it also depends on income. However, there are other factors that influence consumption and savings, such as interest rates, inflation, levels of taxation, existence of financial institutions etc. In theory, the national income remains the same from one period to the next if people decide to save an equal amount as the one, which business houses decide to invest. Investment is the actual increase in stocks, the creating or buying capital equipment, not goods which are for immediate consumption. Investment depends mostly on the expected returns. When national income is at its full employment level, and the total spending, commonly known as aggregate demand, is less than this figure, the deficiency is known as a deflationary gap. If, on the other hand, at full employment, aggregate demand is in excess of the full employment national income, then an inflationary gap occurs. An increase in aggregate demand gives rise to additional income due to the workings of the ‘multiplier’, but a reduction in aggregate demand gives rise to multiple reductions in income, called the de-multiplier. The ‘accelerator’ theory links consumption expenditure to investment decisions. An increase in consumption expenditure results in more investments in capital goods in order to increase output to satisfy customers. The combined effect of both the multiplier and the accelerator results in the business or trade cycles. A business cycle consists of simultaneous expansion in many fields of business activity, followed by widespread contraction. The ‘paradox of thrift’ reflects the fact that a decision to increase the rate of savings may result in a decline in income. Note the fact that the theory of income determination is developed on simplified models whose application in practice may be limited. However, Keynesian demand management is important because governments intervene in order to stabilize their national economies, and even if their interventions may not be fully successful, they do influence the level of Economic activity.

115
REVIEW QUESTIONS 1. What does the equation ‘C = a + bY’ mean? 2. When, in theory, is an economy in equilibrium? 3. Mention why in practice, the above is not possible 4. Name two injections into the circular flow of income 5. How does the aggregate demand ‘differ’ with the injections into the circular flow of income 6. According to Keynes, why does investment grow faster than consumption? 7. Explain the ‘multiplier’ principle, and indicate the formula for both a closed and an open
economy. 8. What is a trade or a business cycle? Indicate its correct sequence. 9. Why does the ‘paradox of thrift’ arise? 10. When can a ‘deflationary gap’ occur? ------------------------------------------------------------------------------------------------- EXAMINATION TYPE QUESTION 9.1 a) Explain why the level of investment is considered to be important in any economy? (4 marks) b) How might governments encourage a high level of business investment? (6 marks) c) Explain what is meant by the multiplier in the context of national income. (5 marks) d) Explain the paradox of thrift. (5 marks) (TOTAL: 20 MARKS)

116
CHAPTER 10 MONEY AND INTEREST RATES ______________________________________________________________________________________________ After studying this chapter, the students should be able to: � Define and differentiate forms of money � Describe the basic characteristics of money � Appreciate the functions of money in the economy � Explain the demand for money � Explain how the money supply is defined � Explain how Interest rate is determined � Discuss the Economic effects of interest rate changes ______________________________________________________________________________ 1.0 INTRODUCTION Money is defined as anything that is generally acceptable in repayment of a debt. It is a medium of exchange, a legal tender. The early forms of money where items that were in common use and generally acceptable, such as cattle, hides, furs, tea, salt, shells, cigarettes, etc. These early forms of money had a lot of limitations, some items like cigarettes are not generally acceptable to be used by all to settle debts. Other early forms of money like cattle were not easy to carry around, and therefore not convenient. Some were perishable products like hides and as they were deteriorating with frequent handling. In addition, there was no homogeneity in terms of size, colour and weight. The money that is used now such as the one, ten or fifty kwacha bank notes are similar and they are easily recognizable., Therefore, a good monetary medium must be:-
- Generally acceptable - Fairly durable - Capable of being divided into small units - Easy to carry (portable) - Should be relatively scarce - Should be uniform in quality
117
1.1 The Origin of Money Money came into use due to the abundance of some things, after producing in greater quantities than what is required for immediate consumption. There was need to exchange the surplus with another person for some other commodity. Initially, it was mostly the exchange of goods for goods, the barter system. This method had a lot of limitations and inconveniences such as the ‘double coincidence of wants’. Finding a person who had an item or service you wanted and in return you also have an item, which is wanted by that person, before any, exchange can take place. There was also the problem of the rate of exchange. That is, how much of item X has to be given for item Y. Related to this was issue of one party to a transaction having only a large commodity to offer, but requires a small item in exchange. The barter system is still being practiced among some people but to a very small extent. Given the shortcomings of the barter system it is easy to appreciate and understand the functions that money performs in modern economies. 1.2 Functions of money Money performs four main functions:
• A Medium of Exchange This is its earliest function and the most important one. Money facilitates the exchange of goods, buyers and sellers meet and trade easily without the inconveniences of the barter system. This in turn promotes specialization, productivity, efficiency and wealth creation. Money is considered to be the ‘oil, which allows the machinery of modern buying and selling to run smoothly’. • A Unit of Account and a Measure of Value Another drawback of the barter system is the difficulty of determining a rate of exchange between different kinds of goods especially large indivisible articles. Money acts as a common measure or standard value of the unit account of goods and services. The value of goods and services is reduced to a single unit of account, and therefore the process of exchange is greatly simplified. Money makes possible the operation of a price system and automatically providing the basis of keeping accounting records, calculating the profit and loss accounts the balance sheet etc. • A Store of Value Money is the most convenient way of keeping any income, which is surplus to immediate requirement. It makes possible a build up of stores of many things for future use, a store of wealth.

118
Money can also be stored in the form of other assets such as houses, but money is a preferred because it is a liquid store of wealth. This means that money can be converted almost immediately into a medium of exchange without ‘loss of face value’. Assuming that money is stable in value! • A standard for Deferred Payments Use of money makes it possible for payments to be deferred from the present to some future date. Borrowing and lending are greatly simplified, loans are taken and repaid in the form of money. Credit transactions cannot easily be carried out unless money is used. Given the assumed stability in its value, future contracts are fixed. Credit transactions cannot easily be carried out unless money is used. 1.3 The Demand For Money Demand for money means the desire to hold money, as distinct from investing it. This desire to hold liquid reserves is known as liquidity preference. According to Lord Keynes there are three motives for holding money. • The transactions motive Both consumers and businessmen hold money to facilitate current transactions. A certain amount of money is needed for every day requirements, the purchase of food, clothing, to pay casual workers etc. • The Precautionary Motive Most people like to keep money in reserve, in case an unexpected payment has to be made, e.g. illness, funeral, accident, car defects, household appliance defects, etc. ‘Active’ balances, depends any, fairly inelastic, less inelastic in the 2nd and elastic in the 3rd known as ‘idle’ balances. • The Speculative Motive This is for the purpose of accumulating more, since holding money in active balances does not yield any interest. Speculation depends on the expectation of the future tend in securities e.g. attractive shares and govt. stock, this generally moves in the opposite direction with interest rates if interest rates go up i.e. people think the price of stocks will go down in the future they will hold money …

119
2.0 THE SUPPLY OF MONEY Money supply in any economy is a very important part of government policy. Money supply has to be monitored as a guide to Economic policy.
The argument of the monetarists is based mostly on the money supply. However both the Keynesians and monetarists accept the importance of money supply. The money supply is the stock of money existing at any particular point in time. It is basically made up of coins and notes in circulation as well as bank deposits. Coins and notes make up approximately only one fifth of the total money supply while bank deposits make up four fifth. This is because commercial banks ‘create’ money through the creation of credit and the creation of deposits. 2.1 MONETARY AGGREGATES The definition of the money supply is carried out in order to measure monetary aggregates. In practice, money is measured either narrowly or broadly, with a very thin dividing line between the two. • Narrow Money This is money that is available to finance current spending, money that is held for transaction purposes, it highlights the function of money as a medium of exchange. Narrow money is designed in different ways, the narrow measure of money starts from MO (Pronounced as ‘m nought’), is the narrowest definition of narrow money. It comprises mostly notes and coins in circulation, plus commercial banks operational deposits held by the bank of Zambia. • Broad Money This is narrow money plus balances held as savings, that is the function of money as a medium of exchange and as a store of value. Therefore, broad money is money held for transactions purposes and money held as a form of saving. Broad money includes assets, which are liquid but not as liquid as assets under narrow money. Broad money is also defined in different ways. The first broad definition of money is M4, and when foreign currency deposits are included, the definition is M3. 3.0 INTEREST RATE DETERMINATION Interest is the price of money, and in the credit market, it is determined by the market conditions of demand for and supply of money. According to the Keynesians, the demand for money, liquidity preference is partly depend on the rate of interest. The supply of money is perfectly inelastic, the supply might increase or decrease depending on the government policy.

120
The equilibrium market rate of interest is determined at the point where the supply of money equals the demand for money Interest Rate MS r LP = d O m Quantity of money As in other markets, changes in either demand or supply conditions lead to a change in interest rates. In the Keynesian model, an increase in the money supply is associated with a fall in interest rates and vice versa. Interest Rate MS MS1 r r1 LP = d O m m1 Quantity of money If the money supply increases from MS to MS1, the equilibrium rate of interest reduces from or to Or1.

121
3.1 THE MONETARISTS VIEW Monetarists ensure that there are no three motives for holding money. Monetarists hold the view that money is held mostly for transactions purposes and enjoyment, and that demand for money is interest rate inelastic. As a result, any slight change in money supply leads to a big change in the rate of interest. This explains the need to maintain stability in the money supply in order to maintain stable interest rates. Interest D MS Interest MS MS1 Rate rates D r r D r1 O m Quantity of money O m m1 Quantity of money Another argument by the monetarist is the microEconomic view known as the loanable funds theory (explained under factor markets). 3.2 EFFECTS OF INTEREST RATE CHANGES Stable interest rates are important in any economy, if there is a large increase in the rate of interest, then the economy is affected in a number of ways. - The cost of credit increases borrowing reduces and investment expenditure reduces. - Spending by households also reduces savings is encouraged, since income is either consumed
or saved, an increase in savings reduces consumption expenditure. - Investment and consumption expenditure are components of aggregate demand, if spending by
both households and firms reduces, then inflation is likely to be lowered. Low prices and less borrowing is a sign of less Economic activity.
- The foreign flow of funds increase financial speculators with ‘hot money’ are likely to be
attracted to the high rates of interest. - An increased flow of foreign funds puts pressure on the exchange rate. The high demand for
the kwacha causes the kwacha to appreciate in value. - A strong kwacha makes exports less attractive on the international market, reducing the
demand for exports. Some workers are likely to be laid off, this reduces the level of Economic activity furthers.

122
- The business sector is also affected by the likely impact on profitability and investment projects that are appraised. High costs of borrowing compared to reduced cash flows due to a reduction in consumption expenditure.
3.3 VARIATIONS IN THE INTEREST RATES Interest rates are determined by the market forces supply of and demand for money. In practice, there are several variations of interest rates that financial intermediaries apply, financial institutions do not give or charge exactly the same interest rates. Finance bank, Indo-Zambia bank, Zambia National Commercial Bank etc all have their own rates that they offer to customers. ‘Lending rates’ given to surplus units (the depositors/savers who supply funds) and ‘borrowing rates’ charged to deficit units are different. An individual bank can give or charge different rates to customers depending on estimated compensation for trying up the money, perceived ‘risk’ of the customer, amount and period of the loan etc. In addition, there is the real rate of interest, which is the nominal rate of interest adjusted for inflation . The nominal rates of interest are the expressed rates, in monetary terms, hence they are also known as the money rate of interest. The relationship between the inflation rates, the real rate of interest and the money rate of interest are: (1 + real rate of interest) x (1 + inflation rate) = 1 + money rate of interest. This is usually approximated as real rate of interest + inflation rate = money rate of interest (nominal interest rate). 5.0 CHAPTER SUMMARY Money is a medium of exchange, anything that is generally acceptable in the settlement of a debt. Early forms of money were items in common use, but had a number of limitations, hence a good monetary medium has a number of characteristics. Money performs a number of functions in the economy, it is a medium of exchange, unit of account and measure of value, and it is a store of value and a standard for deferred payments. The demand for money, according to Keynes, is the desire to hold money, and it is held as active balances, for the transactions and precautions motive, this depends on an individual’s income and it is interest rate inelastic. Money is also held as idle balances for speculative reasons, and this depend on the rate of interest.

123
The money supply in any economy is simply made up of notes coins and bank deposits; however, money supply is a very important part of government policy, and it can be measured both narrowly and broadly. Generally, the market forces of supply and demand determine interest rates. Interest rates should have some degree of stability, as they are very important in Economics and in the business environment. In practice, there are variations in the rate of interest, which affect savings and loan repayments.
REVIEW QUESTIONS 1. What is money? 2. Give a brief explanation of the characteristics of money 3. What are the four functions of money in an economy? 4. Distinguish between narrow money and broad money 5. What do broad measures of money include? 6. Why do people demand money? 7. If interest rates rise, will bond prices rise or fall? 8. What is the real rate of interest? 9. What effect has an increase in the rates of interest have on the exchange rate? 10. Sketch a liquidity preference schedule --------------------------------------------------------------------------------------------------------- EXAMINATION TYPE QUESTION 10.1 a) In what ways might a business be affected by a large change in interest rates? (8 Marks) b) Sketch and explain a liquidity preference schedule. (6 Marks) c) Explain the loan able funds theory of interest rate determination. (6 Marks) (Total: 20 Marks)

124
CHAPTER 11 FINANCIAL SYSTEMS AND MONETARY POLICY _____________________________________________________________________________________________ After studying this chapter, the students should be able to: � Appreciate the flow of funds and financial intermediation � Identify the main elements of the monetary and financial system � Explain the importance of the monetary environment to the business sector � Explain the functions performed by commercial banks and the central bank. � Understand how commercial banks ‘create’ money � Explain the Economic role of government through monetary policy and its basic instruments � Understand commercial bank’s conflicting objectives of liquidity, profitability and security _______________________________________________________________________________
1.0 INTRODUCTION A financial system is made up of financial markets and financial institutions, it may also include formal and unregulated systems of finance, such as moneylenders, trade credit, micro finance and co-operative credit. Financial markets are the capital market, the money market and the foreign exchange market. Financial institutions are commercial banks, building societies, insurance companies, national savings and credit bank etc. A financial system brings in many benefits in the economy, it facilitates payments, raise the level of savings and investment. Capital is accumulated and allocated to uses where there are highest returns. The system helps to provide a means of transferring and distributing risk across the economy. Risk is diversified or pooled among a large number of savers and investors, by offering assets with different degrees of risk, financial institutions assess and manage risks and assign to individuals having different attitudes and perceptions towards flow of funds. 1.1 THE FLOW OF FUNDS Funds flow between three sectors in the economy. Individuals give and lend money to each other. Organizations lend money and purchase goods from each other. The central government provides funds to the local government and loss making nationalized industries. In addition, there is also a flow of funds between the different sectors of the economy.

125
A go-between, known as a financial intermediary, such as a commercial bank or building society, facilitates the flow of funds. Banks provide a means by which funds can be transferred from surplus units in the economy to deficit units. Linking lenders to borrowers. An individual deposits saving with a bank, the bank provides a loan to a company, as explained under credit creation. If no financial intermediation takes place, lending and borrowing is direct. Lends To Direct lending is also known as financial disintermediation. Savers wishing to lend have to find a trust worthy borrower. The lender bears the risk of default. The borrower has to locate savers with money to lend. This results in high information cost and high default risk. In practice, financial intermediaries also lend abroad, as well as borrow from abroad. Therefore, a detailed diagram of the flow of funds showing the role of financial intermediation in an open economy is as shown below:
Business Sector
Personal Sector
Government sector
Surplus Unit Financial Intermediary Deficit Unit
Surplus Unit Deficit Unit

126
1.2 BENEFITS OF FINANCIAL INTERMEDIATION - A convenient way in which lenders save money - They can package the amounts lent by savers and lend on to borrowers in bigger amounts
(aggregation) - They provide a ready source of funds for borrowers. - The lenders, capital is secure, bad debts are borne by the financial intermediary. - They bridge the gap between the wish of most lenders for liquidity and the desire of most
borrowers for loans over longer periods. This is known as maturity transformation . - They provide tangible returns to savings i.e. Interest rates. - They act as an important medium for the implementation of financial (monetary) policies. 1.3 FINANCIAL INTERMEDIARIES The banking system is made up of commercial banks and the central bank, and the non-banking financial intermediaries e.g. • Building societies • National credit and savings bank • Insurance companies invest premiums paid on insurance policies by policyholders. • Pension funds are mobilized through forced contributions from employees, and these are
invested in financial markets and real estate. • Investment trust companies invest in the stocks and shares of other companies and the
government. Investment trusts simply trade in investment. • Unit trusts are similar to investment trusts in that they invest in stocks and shares of other
companies, but they enable small investors to invest with minimum risk. Unit trusts comprise of portfolios (stocks or shares in a range of companies or for example shares in mining companies), the trust creates a large number of small units, which are then sold to individual investors.
• Development banks are specialized financial institutions that provide long term and medium term funds.
Personal sector
Business sector
Financial Intermediaries
Overseas sector
Government sector

127
• Venture capital is investment in long-term, risky equity finance, where the reward is an eventual capital gain, a takeover, a trade sale or a stock market flotation, rather than dividend income or interest. The main providers are investors in industry.
• Hire-purchase companies, facilitate the acquisition of physical assets through extension of credit.
2.0 FINANCIAL MARKET The market for finance is basically divided into the following - Money markets - Discount market Short term and commonly known as the money market. - Capital market - Stock market Long term capital market Money markets deal with short-term finance i.e. lending and borrowing for less than one year. Active participants in the market are commercial banks, the central bank, big organization and brokers. Financial instruments traded are: - Certificate of deposits - Commercial paper, I Owe You ( I O U ) - The discount market, which performs the following functions:
• Help finance short-term trade debts by purchasing commercial bills at a discount. • Create a market in bills of exchange
The money markets also includes
• Inter-bank markets for unsecured loans between banks; this facilitates smoothing out
fluctuations in receipts and payments of banks, and determines likely future trends in interest. • Eurocurrency markets, which are short-term deposits and borrowing mainly for the purposes
of working capital. It is in other currencies either than that of the denomination of a particular country. With the growth in mergers largely involving multinational companies, there is need to shop around for favourable terms and avoid domestic government credit restraints.
2.1.0 Capital Markets This market is divided into primary market for the new issue of shares, and the secondary market, which deals with reselling of existing securities. Instruments traded on the capital market are equity shares, mortgages, corporate and government bonds etc. Note that the international capital market for medium term and long term are known as the eurocredit (for working capital and investment purposes) and the Eurobonds respectively.

128
The Eurodollar or the Eurobond market deals with long-term finance. Bonds are issued by very large companies, banks, governments and institutions such as the European Union. The bonds are denominated in a currency other than that of the borrower. The bonds are bought and traded by investment institutions, banks etc. 2.1.1 The Stock Exchange The Lusaka stock exchange is an organized capital market, which plays an important role in the functioning of the economy. • It makes it easy for large firms and the government to raise long term capital, by providing a
market for borrowers and investors to come together • It publishes the prices of quoted (or listed) securities, which are then reported in the media. • It tries to enforce certain rules of conduct for its listed firms and for operators in the market to
provide investor confidence, and make them more willing to put their money into stocks and shares.
• It is a primary market for newly issued shares. Note that a firm’s new shares are issued by an issuing house with the help and advice of a stockbroker.
• A secondary market exists for the buying and selling of existing shares, the buyers of new issues know that they can sell them in future.
The capital instruments traded are equities/securities such as ordinary shares, preference shares and debentures, as well as government bonds/gilds. It also acts as an Alternative Investment Market (AIM), where small companies gain access to capital, under less stringent, less costly procedures. A stock market is usually given as an example of a perfectly competitive market, even if it is affected by political factors such as wars, elections or any other form of uncertainty, including the general mood of the business. 3.0 COMMERCIAL BANKS AND CREATION OF MONEY Commercial banks are financial intermediaries, with the same roles and benefits as other financial institutions. A Commercial bank’s activities can be one or more of the following:
• Clearing – settling payments • Retail – traditional banking, offers small deposits and small loans to customers. • Wholesale – bank dealing with large quantities • Investment-also known as merchant banks, are specialized and deal with corporate
customers.

129
3.1 Functions of commercial banks Banks provide a payment mechanism and a place to store surplus money; they also provide means of obtaining and selling foreign exchange. Commercial banks advise and assist companies in the issue of shares, and give investment unit trust advice and business. They also engage in financial leasing, debt factoring or collection management, including executorships (trustee) services. Banks finance import and export operations and investments. The most profitable business of commercial banks is lending money in the form of overdrafts, discounting bills of exchange and loan facilities. This particular function is always expanding because banks create credit, create deposit and therefore create money.
3.2 Credit creation Commercial banks are financial intermediaries, who accept deposits and extend loans. They operate on the assumption that they know from experience that customers only withdraw a fraction of what they have deposited and that not all depositors withdraw all their cash at the same time. Therefore, banks only keep a small fraction of their assets as actual cash, known as fractional reserve system. To simplify the explanation on credit creation, assume that there is only one commercial bank, which is already in business with lenders and borrowers. Assume also that the bank knows from experience that the reserve ratio, that is, funds that a commercial bank must keep, as actual cash is 10% of a customer’s deposit. If a customer deposits K100 million in the bank, then the bank’s balance sheet on day one with appear as follows:- DAY ONE Liabilities Assets Km Km Share Capital 10 Fixed assets 10 Customer deposit 100 Cash 100 110 110

130
Note that the share capital is used to finance fixed assets, and therefore, can be ignored; it is not part of the credit creation process. If the bank loans 90% of the deposit, then the bank’s balance sheet will appear as follows: DAY TWO
Liabilities Assets Km Km Share Capital 10 Fixed Assets 10 Customer deposit 100 Cash 10 Loan 90 110 110 An individual, firm or a government borrows money for a purpose. Suppose the loan of K90m is used to purchase a motor vehicle, the person receiving the money deposits it in the bank, and the bank’s balance sheet will appear as follows:
DAY THREE
Liabilities Assets Km Km Share Capital 10 Fixed Assets 10 Deposit - original 100 Cash 10 New deposit 90 Cash from new deposit 90
Loan 90 200 200
The bank will again maintain only 10% of the new deposit as actual cash and lend the rest to customers. This process continues, however, the credits and deposits being created reduce until it becomes too small to generate a fresh loan. It is possible to calculate the total deposits created from any initial deposit and to come up with the final balance sheet by using the formula. D = C where D = final deposits created R C = initial cash deposit R = cash reserve ratio D = 100 = 100 x 100 = 1 000 10% 10

131
From the initial deposit of K100m, the bank’s final balance sheet appears as: Liabilities Assets Km Km Share Capital 10 Fixed Assets 10 Total deposit 1000 Cash 100 Loans 900
1010 1010 Note that the bank has created credit worth K900m from the initial deposit of K100m, this has resulted in additional deposits of K900 which is in circulation as part of the money supply. In practice there are several banks in any economy and billions of money is ‘created’, but the process remains basically the same. This process is very important to know because it is closely linked with the money supply in the economy and as such the level of Economic activity. 3.3 LIMITS TO CREDIT CREATION A deposit of K100m with a cash credit multiplier of 10% may not result in K1 billion total deposits. Some of the restrictions on credit creation may be summarized as: • Since there are several banks, an individual bank cannot adopt an expansionist policy, unless
other banks are willing to do the same. The clearing bank may have an overcautious credit policy, and restrict lending.
• A bank’s ability to lend depends on its ability to acquire deposits, this may sometimes be limited by the lack of public confidence in the banking sector, and their inability to make abnormal demands for cash.
• Lack of collateral security may also hinder the process of lending and borrowing. • The government, through the central bank, may decide to restrict lending and borrowing, in
order to control the money supply in the economy. • There is an inverse relationship between the cash reserve ratio and the money that is ‘created’
by banks. In developing countries, the cash ratios are relatively high, this means less Economic activity
• If the loans are spent on imported goods, then the foreign banking system benefits instead of domestic banks.
4.0 CONFLICTING OBJECTIVES OF PROFITABILITY, LIQUID ITY AND SECURITY A commercial bank’s assets and liabilities reflect a balance between conflicting demands of liquidity, profitability and security. A commercial bank has to serve the interests of its shareholders, which is maximising profits, and to attain this, the bank has to lend as much as possible. However, the bank has to ensure that it has adequate liquidity to meet the cash demand from depositors. As far as depositors are concerned, their money is secure at the bank.

132
- Liquidity Used to settle daily cash withdrawals from customers and to settle accounts with other commercial banks in the clearing system, but balances for these purposes earn no interest and are unprofitable. Banks have to make sound investment policy, by investing in assets that can be easily converted into cash. - Profitability A commercial bank’s profit is normally obtained from interest charged on assets minus interest paid on liabilities. Commercial banks have an objective of trading profitably like other commercial organizations. To pursue this objective they need to earn high interest rates. Therefore, they have to lend for a long term and to high-risk customers. This reduces the choice of liquidity and security. - Security Commercial banks are expected to act prudently to safeguard the interests of depositors and shareholders; this however reduces opportunities for profitable lending. 5.0 THE CENTRAL BANK This is the principal financial institution in a country, and it acts as a regulator of the banking system. Zambia’s central bank is known as the Bank of Zambia (BOZ), it was established to take over from the Bank of Northern Rhodesia on the 7th of August 1964 although its Act was only passed in June 1965. The central bank does not deal directly with the general public, but provides services to the commercial banks and the government and manages the money supply on behalf of the government and the people of Zambia for the good of the economy and not for profit maximization. The Bank of Zambia’s stated functions are: • To ensure appropriate monetary policy formulation and implementation • To act as the fiscal agent of the Government • To license, regulate and supervise banks and financial service institutions registered under the
Act to ensure a safe and sound financial system • To manage the banking and currency operations of the Bank of Zambia ensuring the provision
of an effective service to commercial banks, Government and other users. 5.1 Other functions of a central bank - Issuing notes and coins. Bank of Zambia has the sole right to issue coins and notes in the
economy. - It acts as banker to the government. The government is the most important customer of the

133
central bank. In addition, the central bank performs many tasks for and on behalf of the government such as:
� Keeping the central government accounts and the accounts of the many other government departments. � Giving assistance by means of “ways and means” advances if the account is in “red” or overdrawn � Conducting government borrowing through the issue of Treasury Bills and government
stock. � Advising the government on financial matters
- It acts as banker to the commercial banks, use the central banks use the central bank in the same way as private customers use the commercial banks. Commercial banks:
• Draw coins and notes from their balances at the central bank as required. • Set off the net payments which has to be made to other banks as a result of the days
clearing by drawing on the balance held at the central bank • Take advice on financial matters from the central bank
- Acting as lender of the last resort - Holding the gold and foreign currency reserves in the exchange equalization account, which the central bank uses to stabilize or manage the kwacha. - The central bank maintains close contact with other central banks and monetary authorities of other countries with the aim of achieving greater international monetary stability. - It works in conjunction with international monetary organization like the international monetary fund and the world bank - The central bank manages the national debt. It is responsible for floating new loans and the repayment of maturing loans plus interest as well as payment of interest to holders of government securities. 5.2 BANKING SUPERVISION - Capital Adequacy Rules Commercial banks make profits by charging interest on amounts borrowed, some amounts are not repaid, bad debts arise; hence the need to set capital adequacy ratios. The central bank imposes certain rules and requirements. - Liquidity Commercials banks need to hold money to meet customer demand, the central bank discusses with each individual commercial bank the adequacy of its stock of liquidity and can advise on changes. - Provision. The central bank encourages commercial banks to make adequate provision for bad and doubtful debts. In addition a bank is not allowed to lend more than 10% of its capital base to one single borrower.

134
- Systems Each commercial bank reports periodically on its procedures and controls. The central Bank examines methods for monitoring credits risks, its systems for recoverability, its arrears patterns etc. - Personnel The directors, managers and large shareholders of banks have to satisfy the central bank that they are “fit and proper” people for such positions that is in terms of honesty, competency, diligence and are of sound judgment. 5.3 MONETARY POLICY Monetary policy is becoming increasingly important in Economic management. Fiscal (budgetary) policy is once a year, in between, the government has to rely on monetary policy. The central bank controls the money supply in order to help the government achieve its macroeconomic objectives. Monetary policy is decisions and actions of the government regarding the supply of money and its price (the rate of interest). An increase in the money supply, which is loose monetary policy leads to a lot of borrowing and spending. With too much money in circulation, inflation as well as an external trade deficit is the likely result. To reduce the money supply, the central bank has to curtail the borrowing and spending by limiting the commercial bank’s capacity to create credit, create deposits and therefore ‘create money’. The instruments that the central bank uses to control the money supply are: � Open Marketing Operations By intervening in the open market to buy or sell securities, the central bank can directly influence the size of bankers’ deposits. If the central bank wants to reduce the rate of inflation, it has to control (reduce) the money supply, and if it sold securities, e.g. treasury bills if it is a short term measure or government bonds if it is a long-term measure, the central bank receives payment by cheques drawn on commercial banks. This brings about a reduction in commercial banks deposits as well as the amount of money circulating in the economy. � Bank Rate (interest rate changes) The importance of central bank rate is that other rates of interest used, depend on it, the rate charged to discount houses, the rates charged on advances to customers and the rate offered on deposit accounts. These rates move up or down with central bank rate. To check inflation, i.e. to reduce the money supply, the interest rate is raised to make credit expensive and as such discourage people from borrowing. � Special Deposits To reduce the cash basis for credit creation and to contract credit, the central bank can request commercial banks to place specified amount or to increase the percentage of these specified amounts, which are supposed to be kept in frozen accounts with the central bank. The government
135
pays interest on the ‘special deposits’. When following an expansionary policy, to encourage lending, the special deposits are returned. � Assets Ratios The central bank dictates or compels commercial banks to keep certain proportions of specified assets. To control inflation the ratio is raised. � Directives (moral suasion) This is a direct instruction from the central bank to the commercial banks to restrict their lending. The directive can be in two forms: - Qualitative, this is when commercial banks are requested to restrict lending only to purposes regarded as being in the national interest. Commercial banks would be encouraged to lend only to important sectors in the economy such as agriculture, mining and manufacturing. - Quantitative, this is when banks are instructed to reduce their lending by a required amount. Note that directives are easy to enforce in a command, planned Economic system. In a liberalized market Economic system, firms including banks have the freedom to meet new market demands without much government intervention. 5.4 Limits to Monetary Policy In practice, monetary policy is not easy to achieve, not only because of a liberalized market Economic system, but because it also depends on commercial banks curtailing credit, given the fact that lending is the most profitable business of commercial banks, the banks find ways of circumventing the policies. In addition, central banks face problems in applying monetary policy, for example - A central bank may lack adequate, detailed, up to date information on the economy and the
money supply. - The central bank has to closely supervise the commercial banks to ensure that they have
reduced their lending to customers, in order to reduce the money supply in the economy. - Conflicting objectives of reducing the money supply, which results in an increase in the rate of
interest, lower investments, less Economic activity and increased unemployment. The government has to trade inflation for unemployment or vice versa.
- The reluctance of the central bank to undermine initiative and commercial banks’ ability to make profits, as mentioned earlier, lending is the most profitable business of commercial banks.

136
6.0 CHAPTER SUMMARY Financial systems are made up of financial institutions and financial markets. Financial institutions enable the three sectors of the economy, the households, firms and government to borrow and lend to each other as financial intermediaries. Some of the functions of financial intermediaries are to provide savings facilities and tangible returns to savers, maturity transformation, ready source of funds for borrowers, and as a medium for the implementation of monetary policy. The financial market is composed of the money and the capital market, dealing in short and long-term finance respectively. Both markets are divided into primary and secondary markets, meaning issuance of new securities and trading in second hand securities respectively. One of the significant groups of financial intermediaries is the banking sector. Commercial banks perform a number of functions, such as providing a payment mechanism, offering financial advice, financing import and export operations etc. More importantly, the operation of the banking system increases the money supply, as commercial banks ‘create’ money. This depends on the cash deposited in the banking system and the cash reserve ratio. When pursuing the most profitable business of commercial banks, which is lending to customers, a bank has to try and balance liquidity, profitability and security. The central bank is the primary financial institution in any country, and it performs a number of functions. The most important of which is banking supervision and controlling the money supply in the economy, known as monetary policy.
137
REVIEW QUESTIONS 1. State the role of financial intermediaries in the economy 2. Give everyday examples of disintermediation 3. What is a cash ratio? 4. Which assets are most profitable to commercial banks? 5. What are capital adequacy rules? 6. What are open market operations (OMOS)? 7. Suggest limitations/problems with monetary policy 8. What do capital markets provide? 9. Distinguish between primary and secondary capital markets 10. What is a money market? 11. Which instruments are traded on the money market? ------------------------------------------------------------------------------------
EXAMINATION TYPE QUESTION 11.1 a) Define the term financial intermediaries and give four examples of major financial
intermediaries (6 marks) b) Explain any four functions of financial intermediaries. (8 marks) c) Describe the role of financial intermediaries to government, and business organizations
(6 marks)
(Total: 20 marks)
EXAMINATION TYPE QUESTION 11.2 a) Explain briefly, the importance of each of the following for the structure of bank assets:
i) Profitability (4 marks) ii) Liquidity (4 marks) iii) Security (4 marks)
b) State briefly four important functions of the Bank of Zambia. (8 marks) (Total: 20 marks)

138
CHAPTER 12 INFLATION AND UNEMPLOYMENT ______________________________________________________________________________________________ After studying this chapter, the students should be able to: � Define and explain causes of inflation � Understand how to measure changes in the value of money � Identify the negative effects of inflation � Explain the measures used to control inflation � Define and explain types of unemployment � Understand how to measure changes in unemployment levels � Identify the negative effects of unemployment � Explain the relationship between inflation and unemployment � Appreciate the supply-side policies _______________________________________________________________________________ 1.0 INTRODUCTION In any economy, the government can follow expansionary or contractionary monetary or fiscal policies by either increasing the money supply and increasing aggregate demand or reducing the money supply and reducing the aggregate demand respectively. Unless the ‘supply side policies’ are put into effect, a government cannot easily control both inflation and unemployment at the same time. One Economic ‘evil’ has to be ‘traded off’ for the other. 2.0 INFLATION Inflation is a sustained rise in the general price level of goods and services. It is measured using price indices. Inflation can be classified between two extremes depending on the speed at which prices are changing. Creeping inflation is when there are small price increases while hyperinflation is the worst case of inflation. The prices of goods and services change very rapidly. 2.1 CAUSES OF INFLATION There are three main causes of inflation, one view from the Monetarists, and two views from the Keynesians. Demand-pull and cost-push are essentially Keynesian explanations of inflation. Monetarists reject these and believe that inflation is caused by an increase in the money supply. Keynesians on their part do not accept that an increase in the money Supply actually causes inflation. They believe that an increase in the money supply is an indication that there is inflation in an Economy. It is not a cause of inflation.

139
2.2 MONETARISTS VIEW AND THE QUANTITY THEORY OF MONEY Monetarists consider the increase in the money supply as the only cause of inflation. The argument of the monetarists is based on the quantity theory of money. The theory is summarized as the fisher equation, Irving Fisher developed the Fisher equation of exchange. It appears in various guises, the most common is: MV = PT where: M is the amount of money in circulation V is the velocity of circulation of that money P is the average price level and T is the number of transactions taking place MV = PT states that money supply multiplied by the velocity of circulation equals the price level multiplied by total transactions. This equation is true by definition since receipts are equal to expenditure. PT can therefore be thought of as equivalent to National Expenditure. Assuming that V is constant in the short run as it is determined by the money supply, and T is also fixed in the short run. Then, an increase in the money supply would lead to an increase in the general price level. 2.3 COST-PUSH INFLATION This inflation is caused by an autonomous increase in the costs of production, considered as cost-push factors. These may then cause cost-push inflation. Cost-push factors may be changes in wages, changes in the exchange rate, which change the price of, imported raw materials or perhaps changes in indirect taxation. Cost-push inflation occurs when a company's costs rise and to compensate, a firm has to put prices up. Cost increases may happen because wages have gone up or because raw material prices have increased. The increase in the costs, with aggregated demand remaining uncharged, causes the aggregate supply curve to shift to the left from AS to AS1, and price increases from OP to OP1.
Prices AS AD P1 AS
1
P AS
0 Y National output, employment and income

140
Cost-push factors that can contribute to the increase in the cost of production include: - Strong, powerful trade viewers who force employers to concede high wage increases, costs
then rise and these are later passed on to consumers in the form of price increases. This situation is worse during periods of low unemployment.
- Import cost inflation, especially for a country which depends on one or more of the - Imported raw materials or other imported inputs - Imported finished products, capital equipment and more especially the ever - Increasing price of imported fuel. - High indirect taxes such as when there is an increase in value added tax or excise duties,
consumers simply notice an increase in prices. 2.4 DEMAND-PULL INFLATION If there is an excess level of demand in the economy, this will tend to cause prices to rise. This type of inflation is called demand-pull inflation and is argued by Keynesians to be one of the main causes of inflation. Inflation occurs when increases in aggregate demand pull up prices, with aggregate supply remaining constant. The aggregate demand is the total demand in an economy, made up of government expenditure, consumption expenditure, investment expenditure and exports minus imports. Any increase in one or more of these components of aggregate demand can put pressure on prices. As demand increases from AD to AD1 there is increasing inflationary pressure on prices. This is demand-pull inflation - "too much money chasing too few goods." Price level AS AD1 AD P P1 O Y YFE (Real national income) Output, employment and Income Increase in demand can be caused by either expansionary monetary or fiscal policies. If there is a high public sector net cash requirement, then total demand in the economy is stimulated. The Keynesian original aggregate supply curve is an inverse “L”. According to them, the pressure on prices is when aggregate demand expands after the full employment of resources, before that point, an increase in aggregate demand acts as an incentive for firms to increase output.

141
When the resources are fully employed, the aggregate supply curve becomes vertical, and if aggregate demand increases beyond this point, an inflationary gap is created. Price AD AS Inflationary gap Output/employment/income 2.5 ANTI INFLATIONARY MEASURES To control inflation, first, it is necessary to know the cause. Unfortunately, this is difficult to do because inflation tends to feed on itself and there is the price wage spiral. Suppose the prevailing inflation is demand driven, then, measures to reduce aggregate demand should be put in place; such as tight fiscal and monetary policies like increasing direct taxes and interest rates to reduce consumption expenditure and investment expenditure respectively. Government expenditure should also be reduced. This means that the government must aim for a budget surplus, by increasing its income through increased taxes, but reduce government spending, the excess money should be kept frozen at the central bank. If the inflation is due to an increase in the money supply then the government should attempt to reduce the money supply by reducing commercial bank lending using the instruments mentioned under the control of the money supply. These are open market operations, increasing interest rates and asset ratios to discourage lending. Directing commercial banks to reduce their lending and requesting them to make special deposits at the central bank. If the source of inflation is an autonomous increase in the cost of production, then measures should be taken to stop the wage-price spiral, reducing the power of trade unions or match the increased costs with increased productivity. A country’s currency can be allowed to depreciate in order to discourage imports, while encouraging exports, this means increased production. An increase in supply lowers the price. Prices and incomes policy that is wage and price controls can also be instituted to control inflation. This means freezing prices and incomes. This may not work well in a liberalized market economy. It also means controlling the consequence and not the cause of inflation!

142
2.6 ECONOMIC CONSEQUENCES OF INFLATION A little inflation is considered to be good for any economy as it provides an impetus for firms to increase output. High prices are a sign that there is a high demand for goods and services and there is a prospect of higher profits. Generally, the negative effects of inflation are as follows: - Inflation redistributes income - Retired people who are on fixed incomes suffer a lot from inflation. Some people earn K20,
000 per month as pension. At the time of retirement, they were able to purchase a lot of goods and services from that amount, but due to inflation their purchasing power and standards of living falls.
- Inflation distorts consumer bahaviour. Consumers purchase a lot of goods because of expected future price increases. They hoard goods hoping to ‘beat’ inflation and in the process create shortages.
- Inflation undermines business confidence. Businesses are unable to make concrete future plans because of uncertainty in price fluctuation in addition, they have to change the price tags on products on a regular basis and this can be so costly and time consuming.
- Inflation and interest rate and savings. The real rate of interest, which is the money rate of interest after making an allowance for inflation, is reduced. Lenders demand for high money rates to compensate for lower real values.
- Lower real interest rates discourage savings and encourage spending. This may have a long-term effect on long-term finance for investment.
- Inflation reduces a country’s international competitiveness. - High prices make products (exports) unattractive on the international market, consumers are
likely to prefer cheaper imports to locally produced products. This affects the balance of payments. A country has an adverse balance of payments when exports are lower than imports.
- Inflation causes the currency to depreciate when there is a low demand for exports, therefore, the demand for the currency is low compared to its supply, and the currency depreciates in value.
- Inflation redistributes wealth, it causes borrowers to gain at the expense of lenders as it reduces the value of the debt. The lenders receive less relative to what they had lent. This is related to the time value of money.
- Inflation leads to uncertainty in price forecasting, both at central government level and at corporate business level.
- Money is unable to perform its functions properly. • Inflation has little impact on money’s function as a medium of exchange. Money is still
used to purchase goods and services. • The use of money as a means of deferred payment is rendered less effective by inflation.
Credit is granted but payment is deferred. This leads to redistribution of wealth where borrowers or those who purchase goods on credit gain but lenders lose.
• The greatest effect of inflation on the functions of money is the function of money as a store of value. The value of money is measured indirectly through prices when prices rise, it is a sign that the value of money has fallen since few items can be brought from the

143
same amount of money. Money becomes an ineffective store of value. Interest rates paid are supposed to compensate, and this is one of the explanations why interest rates rise during periods of inflation.
• Money is used as a unit of account and as a measure of value. This function is also hampered by inflation as the relative values of things being compared keep on changing in monetary terms.
3.0 UNEMPLOYMENT Unemployment simply means people do not have jobs. It occurs when people capable of and willing to work are unable to find suitable paid employment. Unemployment is measured as # of unemployed x 100 Total workforce Full employment is when there are more jobs than people. The number of unfilled vacancies is equal to the number of people out of work. It is the level of national income at which everyone who wants to work is able to do so, in other words, there is sufficient demand to employ everyone.
Classical economists argued that the economy would automatically tend to this equilibrium, due to the market forces of supply and demand. Keynesians maintain that it is the role of government, using policy instruments at their disposal, to ensure that there s full employment in an economy.
3.1 CAUSES OF UNEMPLOYMENT In some books the words ‘causes’ and ‘types’ are used interchangeably. However there is a distinction. Type is the label given to describe the main common characteristic of some unemployment, while Cause is more analytical, an attempt is made to explain how some unemployment has arisen. Causes of unemployment can be broadly divided into demand and supply factors: - Demand deficiency unemployment is caused by lack of demand for goods and services, and as
a result, firms lay off workers. This is usually when the economy is in the recession stage of the economic or trade cycle and there is little economic activity. Keynesians argue that a shortage of aggregate demand is one of the key causes of unemployment.
- Monetarists view Supply side factors such as strong trade unions demanding for high wages as
causes of unemployment as firms employ less labour while the supply of labour increases, as shown below:

144
Price D S W1 W S D O Q1 Q Q2 Number of workers
At a high wage rate of OW1, the demands for labour by firms reduces to OQ1, supply naturally increases to OQ2, because individuals who were unwilling to work at wage rate OW are now encouraged by the high wage rate. The difference between OQ1 and OQ2 is unemployment caused by the activities of trade unions. - Firms lay off workers if import prices are too high, like the high price of oil, which reduces a
firms’ competitiveness, and loss of customers. - State benefits tend to encourage ‘voluntary unemployment’. When the benefits are higher than
the market wage, as in the diagram above, a person feels ‘better off’ being unemployed earning OW1 than earning a low wage (OW) while in employment.
3.2 TYPES OF UNEMPLOYMENT - Seasonal unemployment is considered to be temporal and occurs in certain industries where
Economic activity is in specific periods or seasons, examples are tourism, agriculture and construction industries. There is a high demand for labour during certain periods of the year, and then most of the workers are laid off during off peak periods.
- Frictional unemployment is of a short-term duration. It refers to secondary school or college
graduates who are searching for jobs, as well as individuals who are in between jobs, the transitional period between workers leaving one job and starting another. Frictional unemployment is also an indication of imperfections in the market such as lack of knowledge, the geographical immobility of labour or a mismatch between the requirements of the employers and the available skills of the unemployed.
The more efficiently the job market is matching people to jobs, the lower this form of unemployment will be. However, as long as there is imperfect information and people don't get to hear of jobs available that may suit them then frictional unemployment is likely to be high.

145
- Structural unemployment refers to long-term changes in the pattern of demand and supply in an economy. On the demand side, a firm may fail to compete with rival firms, demand for the company’s product declines and the firm is likely to lay off workers and close the business.
Changes in the supply of a product, for a example if the product like copper ore is getting depleted, there is no need to employ miners and this can also lead to unemployment in the Copperbelt. It may also result from changes in the production methods labour is replaced by machines or capital equipment, termed technological unemployment. Structural unemployment also includes regional unemployment, some regions in a country may have higher unemployment levels compared to other regions because of different regional economic performances.
Unemployment results because individuals do not respond quickly to the new job opportunities, they find themselves with no readily marketable talents. Their skills and experiences are unwanted, as they have become obsolete.
- Cyclical unemployment is the same as deficiency in demand unemployment. It is
characterized by fluctuations in economic growth, characterized by booms and recessions, the trade cycles. During the recession phase, there are high levels of unemployment.
- Voluntary unemployment is a relatively new concept, defined by the monetarists as being due
mostly to high state benefits, either unemployment benefits or being on welfare. This causes people to be unwilling to work at existing low wage rates. They realize that they are “better off” not working and receiving state benefits.
Voluntary unemployment also includes individuals who simply do not want to work!
3.3 NEGATIVE EFFECTS OF UNEMPLOYMENT The Economic consequences of unemployment are classified as Economic, financial, social or political costs: • Labour is a factor of production, and due to unemployment, the Economic resource is not being
utilized, this is at a cost, the opportunity cost of goods and services not produced, quality of workforce diminishes as idleness causes labour to be less efficient, this in turn increases the cost of retraining it.
• Government revenue is mostly from taxes, unemployment results in a loss of government
revenue, as the unemployed do not pay any tax, in some rich countries they receive state benefits, which means that unemployment is a financial cost to the government.
• Unemployment may lead to social undesirable behaviour like theft, vandalism, riots or general
discontent. The mental and physical health of the unemployed tends to deteriorate, the unemployed are more prone to commit suicide. This is considered to be a social cost.

146
• Whenever there are high levels of unemployment in the country, the political party that forms the government, is likely to lose popularity, this is a political cost to the government.
4.0 THE PHILLIPS CURVE It shows the relationship between inflation and unemployment. In 1958, Professor A. W. Phillips found a statistical relationship between unemployment and money wage inflation. Inflation and unemployment are two sides of the same coin. If the rate of inflation falls, unemployment rises and vice versa. Zambia under the United National Independence party (UNIP), was experiencing high levels of inflation, up to three digit figures, but the levels of unemployment were relatively low. Under the Movement for Multiparty Democracy (MMD), the country has experienced low levels of inflation but very high levels of unemployment. The Phillips Curve explains the “trade off” between inflation and unemployment; it is a graphical illustration of the inverse relationship between inflation and unemployment. It shows that the lower the rate of inflation the higher the rate of unemployment. Inflation rate 0 Unemployment rate High inflation is associated with low unemployment. Note that the curve crosses the horizontal axis at a positive value for the unemployment. It is not possible to have both zero inflation and zero unemployment, zero inflation is associated with some unemployment. The above means that the government cannot achieve two of its macroEconomic objectives of low rates of inflation or stableness and low rates of unemployment at the same time. The two are mutually exclusive. The government can only achieve one objective at the expense of the other.

147
4.1 STAGFLATION Once in a while, in any country the “trade off” does not apply, as both inflation and unemployment
move in the same direction. This situation is known as stagflation.
Stagflation is a term coined by economists in the 1970s to describe the unprecedented combination of slow Economic growth and rising prices. The Phillips curve does not apply, there is no “trade off”, and instead, there are unacceptably high levels of both inflation and unemployment. This means a country can be experiencing stagnation, the recession phase of the trade cycle and very high levels of price increases. The a above maybe as a result of high costs of production, especially the price of crude oil, which may cause the supply curve to shift to the left. This causes the price to increase from 0P to 0P1 and output, employment and income reduces from 0Q to 0Q1
Price D S1
P1 S
P
S1 D
0 Y1 Y Output, Employment, Income
5.0 SUPPLY-SIDE POLICIES
Monetarists believe that stagflation is as a result of ignoring the aggregate supply side of the equation on supply and demand analysis. Keynesians believe in manipulating aggregate demand in order to manage the national economy, and monetarists argue that Keynesian demand management is inflationary, the solution is to put in place measures to improve the supply of goods and services, known as supply side policies.
Supply-side policies can be used to reduce market imperfections. This should have the effect of increasing the capacity of the economy to produce, that is increase output, employment and income and reducing prices at the same time. It is without doubt the only non-inflationary way to get increases in output.

148
Price D S
P S1
P1 S
D
0 Y Y1 Output, Employment, Income
The idea is to increase aggregate supply from SS to S1S1 in order to increase output to Y1 and at the same time reduce prices from 0P to 0P1.
The above is an indication of the need to shift both Economic and government policy towards supply side policies. The long run Economic growth and standard of living are both functions of both production and supply. The low prices from increased supply imply that a country can compete with the low cost producing countries of South East Asia. In general, supply side policies aim to remove market imperfections and encourage individualism in order to increase efficiency and raise competitiveness. They are micro orientation, unlike Keynesian policies that are macro. Some of the best-known supply side policies are: • Lower income taxes. High direct taxes are a disincentive to enterprise and hard work, more
especially overtime. There is need to encourage individuals and firms to be more enterprising, and to increase production.
• Privatization and deregulation, since government intervention and regulation weakens a country’s ability to make the economy dynamic and self regulating, Adam Smith’s ‘invisible hand’ in the market. Public provision of services, government grants and subsidies encourage inefficiencies, and state owned industries are not competitive.
• Strong trade unions and employment legislation lead to unemployment and encourage over manning. There is need to have weak trade unions and workers who will accept ‘flexible’ wages.
D S
W1 W 0 Q1 Q2 Q3 Number of workers

149
Strong trade unions can successfully bargain for high wage rates (0W1), which results in few workers (0Q1) being employed, while the supply is high at 0Q3. By accepting lower wages (0W), more workers would be in employment (0Q2). The inflexibility in the labour market creates unemployment. • Related to the above, are wage controls, wage regulations and employment legislation which
all contribute to inflexibility, workers ‘pricing themselves’ out of the market and ultimately unemployment. According to the supply side policies, these should be abolished.
• Better information on job opportunities and adequate training is what is required for the aggregate supply curve to shift to the right.
6.0 CHAPTER SUMMARY Inflation to a layman is simply a sustained increase in the price of goods and services. Inflation is measured as a percentage change, and the two extremes are creeping inflation to hyperinflation. Inflation can be caused by demand factors, supply factors, or according to the monetarists, any change in the money supply is inflationary. There are several reasons why inflation is considered to be economically undesirable, it affects planning both at central government and at corporate business level and it also undermines business confidence. Inflation reduces a country’s international competitiveness and causes the currency to depreciate given a low demand for exports. Inflation discourages savings, and ultimately, investment. It also distorts consumer behaviour, consumers purchase a lot of goods in the hope of ‘beating’ inflation. More importantly, inflation has a big impact on people who are on fixed incomes, their purchasing power and standard of living falls, and money is unable to perform its functions properly. Unemployment simply means people do not have jobs. The words ‘types’ and ‘causes’ of unemployment are usually interchanged, but generally, unemployment is categorized as cyclical, structural, seasonal, frictional and voluntary. Unemployment also has a number of negative consequences, classified as Economic, financial, social or political. A government can control both inflation and unemployment using either fiscal or monetary policies, or both. Unfortunately, there is a negative relationship between inflation and unemployment, which is illustrated by the Phillip’s curve. The government has to ‘trade off’ inflation for unemployment or vice versa. Sometimes, there is an increase in inflation and unemployment, a situation known as stagflation. An effort to ‘cure’ both inflation and unemployment is explained by the monetarists using the supply-side policies. These policy measures are intended to free up the supply of goods and services in all markets, eliminating market distortions, increasing production, the ‘supply’ side of the equation, through deregulation. The government has to reduce taxes, privatize, allow the labour supply to move freely, weaken trade unions, etc.

150
REVIEW QUESTIONS 1. What is the quantity theory of money? 2. Define inflation, and state how it is measured 3. What are the two main types of inflation? 4. What could be the underlying causes of demand-pull inflation? 5. What are the economic consequences of inflation? 6. List three important types of inflation 7. Specify three costs of unemployment 8. How do Keynesians explain unemployment? 9. What does the Phillips curve show? 10. What is ‘supply side’ economics concerned with? -------------------------------------------------------------------------------------------------- EXAMINATION TYPE QUESTION 12.1
(a) Describe five economic effects of a continuous, moderate inflation. (15 marks) (b) How might governments use monetary policy to reduce the rate of inflation? (5 marks) (Total: 20 marks) EXAMINATION TYPE QUESTION 12.2 (a) Distinguish between “Structural unemployment” and “cyclical (demand deficiency) unemployment” (8 Marks) (b) Explain any four “supply -side” policies, which might be used to reduce the level of unemployment. (12 Marks) (Total: 20 marks)
151
CHAPTER 13 PUBLIC SECTOR ECONOMICS ______________________________________________________________________________________________ After studying this chapter, the students should be able to: � Appreciate the role of government in the economy. � Identify the main items of government expenditure � Explain of the different sources of government revenue and � Understand the advantages and disadvantages of the main sources of government revenue � Understand fiscal policy � Identify the fiscal stance through the public sector net cash requirements � Explain of the nature and composition of national debt _______________________________________________________________________________ 1.0 Introduction There are many aims to public finance, but the priority on how the government deals with its finances in the course of performing its functions varies with political complexities. However, generally, the bulk of government revenue is spent on socially desirable expenditures such as education, health and social services. Therefore, public finance is concerned with government expenditure and government revenue, and the difference between them, which is the public sector net cash requirements. 2.0 Government expenditure Government capital expenditure refers to government spending on investment goods. This means spending on things that last for a period of time. This may include investment in hospitals, schools, equipment and roads. Government current expenditure refers to government day to day spending. This means spending on recurring items. This includes salaries and wages that keep recurring, spending on consumables and everyday items that get used up as the good or service is provided In general, the main items of government expenditure in most countries can be can be classified under the following headings; - Defence - Internal security that is, the police, fire brigade etc. - The merit goods under the social sector like education, health and housing. - Economic policy covering subsidies to agriculture and industry, the provision of capital to the
nationalised industries (government investments).

152
- Social security and other transfers make up a big chunk of government expenditure in developed countries
- Debt interest payments on the national debt are a big burden for the poor countries. - Miscellaneous expenditure such as diplomatic services. 2.1 Government revenue This is mostly from taxation. However, taxation has other functions besides covering central and local government expenditure. The other reasons for taxation are: - To check the consumption of demerit goods like beer and cigarettes and to cause the pricing of
the products to reflect the social costs to society of smoke related illnesses. - To reduce inequality of incomes and wealth through a progressive system of
taxation. - To put into effect the ‘automatic stabilisers’, that is increase the levels of direct taxes to
dampen the upswings and reduce on the inflationary pressures when the economy is at the ‘boom’ phase of the trade cycle.
- To protect infant, strategic and declining industries by introducing indirect taxes like import duties to discourage imports by making them more expensive and therefore less competitive.
2.2 Principles of taxation Adam Smith outlined the basic characteristics of a good tax system as the four canons of taxation, namely: - Equity, which means that taxes should be fair and therefore should depend on - an individual’s ability to pay. Taxes must be proportional to one’s income. - Certainty, with regard to the amount to be paid, how, where and when it should be paid. - Convenience of payment and collection by the taxpayer. - Economy, that is, the cost of collection should not be excessive especially in relation to yield. The additional principles of taxes considered by governments are summarised as efficiency and flexibility . Taxes must as far as possible achieve its objective efficiently and not undermine other aims and taxes. It should also be adjustable to changes in policy. 2.3 Classification of taxes Taxes can be classified in several ways depending on: � Who is levying the tax? This can either be the Central or the Local government. � What proportion of a person’s income is taxed? There are three categories:

153
a) A progressive tax A progressive tax is a tax that takes an increasing proportion of income as income rises. The rate of tax keeps on increasing with every subsequent increase in income. Most direct taxes are progressive, a good example is income tax, and the rate increases as a person earns more. b) A regressive tax This takes a higher proportion of a poorer person’s income. Most indirect taxes are regressive. A regressive tax is a tax that takes a smaller proportion of income as income rises, this means it takes a higher proportion of a poorer person’s income. In other words it is a tax that hits less well-off people harder than the better off. Most indirect taxes are regressive. An example of a regressive tax is the television licence. It is exactly the same amount for everyone, which makes it a much smaller proportion of a large income than a small one. c) A proportional tax This is when the tax is the same proportion on all incomes, whether large or small. It simply taxes a given proportion of one’s income for example 10% of K500,000.00, 10% of K5,000,000.00 and 10% of K50,000,000.00. Tax burdens that are proportion to income are considered to be fair, however, they do not contribute towards equal distribution of wealth. � Who is paying the tax? Is it a direct or an indirect tax? A direct tax is a tax on income, profit or wealth. It is paid directly to the revenue authorities by the taxpayer. Examples of direct taxes are
� Income Tax � Corporation Tax � Capital Tax � Inheritance tax � Other taxes to the local government like personal levy, motor vehicle duties
Advantages of direct taxes:
1. Are equitable, that is they conform to the principle of ‘ability to pay’, through the progressive system of taxation.
2. Have an elastic and high yield; the rate of taxation can be increased and therefore increasing government revenue.
3. Are certain, both the taxpayer and the government know the amount to be paid, how, where and when it should be paid.
4. Lead to equal distribution of income and wealth, this again is through the progressive system of taxation.

154
5. Are automatic stabilizers through their progressive nature, taking more money out of the economy (withdrawals) when the economy is in its ‘boom’ phase, while taking less money and increasing welfare payments when the economy is faced with a depression.
6. Are not inflationary like indirect taxes. Disadvantages of direct taxes
1. High rates acts as a disincentive to efficiency, effort and enterprise. Tax reduces the return on the investment and reduces a firm’s ability to invest and expand as this depends on the retained profits. Workers are less inclined to put in extra hours. Individuals and firms want to make money for themselves and not to contribute to government revenue.
2. High rate might also encourage migration of skilled manpower to ‘tax havens’ 3. High rates encourage tax avoidance. People find loopholes so as to avoid paying tax. It also
encourages tax evasion, which is illegal non-payment of tax especially in the informal sector.
An indirect tax is a tax on expenditure. Tax is paid indirectly to the revenue authorities as part of the payment for a commodity or service, whenever particular purchases are made. Examples of Indirect taxes are: � Customs or import duties � Excise duties, this is a tax on some locally produced commodities � Value added tax. The advantages of indirect taxes: 1. Revenue yield from indirect taxes help to avoid high direct taxes. 2. Payment is certain since they are difficult to avoid and to evade. 3. Convenient to the taxpayer since they are paid in small amounts and at intervals instead of
one big lump sum of money which is deducted and paid every month like pay as you earn. In addition, they are convenient in that they are paid when an individual is in a position to buy the commodity and therefore can afford to pay the tax.
4. Economical in collection as companies and traders collect on behalf of the government and reduce the administrative burden that should fall on the revenue authorities.
5. It is not harmful to effort and initiative like direct taxes. Instead, it is less painful since it is hidden in the price of a commodity or service.
6. Most importantly, indirect taxes are flexible instruments of policy as they can be adjusted to specific objectives of Economic policy such as:-
- Protecting infant industry or vital (strategic) defence industries - Strengthening political links e.g. Southern African Development Cooperation
(SADC) and Common Market for East and Southern Africa (COMESA). - Citizen’s health may be safeguarded as indirect taxes can be used to encourage or
discourage the production and consumption of particular goods and services. - The balance of payments may be strengthened or improved by taxing certain
imports.

155
The disadvantages of indirect taxes: 1. There are regressive, a flat rate like a poll tax, a specific tax charged as a fixed sum per unit
sold or an ad valorem tax which is charged as a fixed percentage of the price of the good with no concessions for people in the low income bracket, take a higher proportion of the income of low income earners than high income earners.
2. They do not depend on a person’s ability to pay both the rich and the poor pay the same amount as tax as long as they both buy the same product or service. Therefore they are not equitable.
3. Some people who use unauthorized border entry points, the ‘black economy’, may evade indirect taxes like customs duties.
4. May encourage inflation, whenever value added tax, customs duties or excise duties increase, the prices of taxed goods and services also increase.
5. Possibly harmful to industry especially for goods with elastic demand 3.0 LAFFER CURVE Government revenue is mostly from taxes. A Laffer curve shows how tax revenue and tax rate are related. The Laffer curve is named after Professor Art Laffer who suggested that if the tax rate is 0%, then government revenue would be zero. If the tax rate is 100%, again there would not be any government revenue as individuals and firms would not be willing to contribute 100% of their income to the government. No one would be willing to work. The Laffer curve also shows the rate at which the government can achieve a maximum revenue Tr, the tax rate should be Tx. In addition, it also shows that the government can achieve very high tax revenue at two rates, 25% and 75%. Given the fact that a high tax rate discourages hard work and enterprise, the best option is a tax rate of 25%. According to the advocates of supply side policies, lowering tax rates increases production and supply. This in turn increases the national income.

156
Tx represents the optimum tax rate where the maximum amount of tax revenue can be collected. 4.0 PRIVATISATION VS NATIONALISATION Privatisation implies - The transfer of the nationalized industries to private ownership. - Selling state assets, either completely or partially - Opening up state monopolies to outside competition - ‘Contracting out’ to the private sector services paid for out of public funds, such as, refuse
collection, which was previously done by the local government. - Charging beneficiaries ‘Economic fees’ for publicly provided goods and services like
hospitals and schools. Therefore, privatization implies more than the movement of assets from the public to the private sector. It embraces all the different means by which the disciplines of the free market in the provision of goods and services can be applied to the public sector. The case for privatisation is the argument that is put forward for deregulation of industries, which is, the removal or weakening of any form of state interference with the operation of free market activity The main aim of deregulation/privatisation is to improve competition and efficiency. Once the statutory barriers are removed, the economy is said to have liberalized industries or it is following a liberalized market economic system, compared to the command economic system. 4.1 Arguments for privatisation a) Reduced burden on the public purse as the government no longer supports loss- making
nationalized companies. Privatisation allows a reduction in the public sector borrowing requirement and tax cutting, as it provides funds for the treasury when companies are sold.
b) There is greater economic freedom from detailed economic control as privatized companies
are not subject to state control.

157
c) Improved efficiency through competition in the market, this encourages producers to cut their costs in order to be more competitive, and firms have to be innovative in the search for profits.
d) In addition to the above, there is also improved quality since firms have to compete to survive
and have to be responsive to customer complaints. e) If companies are not in state control, there is greater resistance to the power of trade unions,
industries are more fragmented and difficult to organise. f) Privatisation leads to a creation of a property-owning class, more people are able to buy
shares, this gives buyers market power, they work harder and strike less, a better understanding of private profit motive and business problems.
g) Costs and inefficiency decrease as bureaucracy from nationalized companies is reduced. 4.2 Arguments against privatisation a) Privatisation does not mean that competition is automatically enhanced. Instead, private
monopolies have been created. An example is if the Zambia Electricity Corporation (ZESCO), became privatized, it means a previously government controlled monopoly becomes an uncontrolled one in private hands, with no public responsibility. Consumers may suffer. However, this is what leads to most governments to regulate or attempt to regulate the newly privatized companies in much the same way as the nationalized industries.
b) Just as privatization does not mean competition, it also does not guarantee efficiency.
Customers have ended up with fewer services, and at higher prices. A good example is rural transport. The government owned United Bus Company of Zambia (UBZ), used to go to all the rural areas, everything was timetabled (date and time).
c) The quality of service has reduced, with costs being saved by reducing the number of workers
‘right sizing’, paying lower wages and reducing the services that were being provided, as mentioned above, some routes were termed ‘unprofitable’ or the roads ‘impassable’.
d) Privatisation may allow people in rural areas without Economic power to suffer, since loss-
making services are not provided by the private sector, most of which are important to the poorest members of the society.
e) In theory, it is the loss-making companies that are supposed to be privatized, but in practice,
the privatization exercise is rarely properly done in most countries in the world, for example asset sales are under priced to attract buyers and in the process, create big capital gains for private investors.
f) Companies that are in private hands often pay their top executives very large salaries and offer
them very good conditions of service, while reducing the powers of trade unions and paying

158
union members low wages. This lowers the morale of the workers and lowers productivity while encouraging pilfering, strikes etc.
g) If competition is enhanced through privatisation, it sometimes leads to waste of resources and
the duplication of goods and services, an example is monopolistically competitive market structures.
4.3 Nationalised industries The public sector includes some businesses run by the government, such as Zambia Electricity Company (ZESCO), Zambia Telecommunications Company (ZAMTEL), Lusaka Water and Sewerage Company etc. Managers of such companies are accountable to the elected politicians (ministers) in charge of that sector, and government-sponsored boards such as the Zambia Energy Regulation Board, which regulates ZESCO, regulate them. The case for nationalization can be considered alternatively as the disadvantages of liberalisation. a) Nationalisation can lead to reduced costs through economies of scale, since with increased
competition, each firm produces less output on a small scale, and unit costs increase. b) There is provision of un economic services for consumers. Nationalisation, just like the
socialism or planned economic system, social benefits are placed above private profits. It considers the net gain to society, to the point of keeping industries that are clearly technologically inefficient, as in the case of Maamba coalmines. Another argument in favour of providing uneconomic services is that it helps to protect employment.
c) It is sometimes in the national interest that some basic industries are brought under public control, especially, strategic industries which would be dangerous under private ownership such as atomic or nuclear energy.
d) It may also be necessary to carry out government policy, like controlling the money supply, as in the case of the Bank of Zambia.
e) Nationalised industries have sufficient capital available for investment, because of government support. Where competition is wasteful, it maybe better to create a large state-owned monopoly, to avoid waste and duplication.
f) A fairer distribution of wealth, the huge profits do not go to the capitalist owners, surpluses are used for the benefit of society. A case in point is ZESCO, the supernormal profits are used for rural electrification. The supernormal profit also justifies the high salaries enjoyed by ZESCO employees.
5.0 FISCAL POLICY Fiscal policy is the use of government expenditure and taxation to try to influence the level of economic activity. It is the decisions and actions of the government regarding its expenditure and its revenue taxes, that is, since government revenue is mostly from taxation. The government as an instrument of economic policy uses fiscal policy, also known as budgetary policy, through the balance between government expenditure and revenue. In order to reduce high levels of

159
unemployment, or to stimulate recovery from a recession, the government aims for a budget deficit or an expansionary fiscal policy. An expansionary (or reflationary ) fiscal policy could mean: • Cutting levels of direct or indirect tax • Increasing government expenditure Reducing taxes causes government revenue to be lower than government expenditure, which results in a budget deficit, government borrowing covers the difference. The government needs to borrow money to finance its activities. This borrowing is referred to as the public sector net cash requirement (PSNCR). It used to be called the public sector borrowing requirements (PSBR). The PSBR is the amount of money the government needs to borrow to meet their spending plans. In other words it is the amount that their spending exceeds their tax revenue. Therefore, an increase in the PSNCR or PSBR is a sign that the government is following an expansionary fiscal policy. The effect of expansionary policies would be to encourage more spending and boost the economy. Budgetary policy can also be used to check inflation or an adverse balance of payment by aiming for a budget surplus, or a contractionary fiscal policy. This is the exact opposite of an expansionary policy. A contractionary (or deflationary) fiscal policy could mean: • Increasing taxation, either direct or indirect • Cutting government expenditure. Reducing government expenditure while increasing taxes is what leads to a government surplus. The difference is the public sector net cash surplus. This used to be called the public sector debt repayment (PSDR) the government is in a position to service the debts plus interest. It is a sign that the PSNCR are low. A reduction in both government and consumption expenditure reduces the level of demand in the economy and help to reduce inflation. 5.1 The Public Sector Net Cash Requirements (PSNCR) The balance between government expenditure and government revenue shows the fiscal stance being followed by the government. Government expenditure is an injection into the circular flow of income, a component part of aggregate demand, therefore an increase in government expenditure is an indication of the expansionary stance being followed by the government. Whereas taxation is a withdrawal or leakage from the circular flow of income, and as such, increasing taxes is an indication of a contractionary stance. In practice it maybe difficult to reduce the growth rate of public expenditure due to for example political factors such as by-elections and defence if a country is at war. Existing capital projects, which can only be, completed over a period of years, as well an economic depression, which results in high welfare and unemployment benefits to act as automatic stabilisers. If the size of the

160
PSNCR increases from one year to the next, then it is a sign that the government wants to boost the economy. In general, for most rich nations, the increase in the PSNCR can stem from the increased life expectancy and an ageing population, which implies more spending on social security. High unemployment levels which may lead to more unemployment benefits being paid. For most poor countries, an increase in the PSNCR can stem from debt interest, political commitments like the numerous by-elections in Zambia or high inflation levels which raises the cost of public provision of goods and services. Both the developed and the developing countries can be affected by tax rate changes, tax reductions for example, reduce government revenue, so the government has to depend on borrowing. 5.2 Parliament control procedures The legal framework that governs the management and control of the public finances in Zambia is made up in the constitution. Parliament is supposed to provide the necessary checks and balances in the budget process. During the fiscal year the scrutiny of the spending reports, if any, is done by the Committee of Supplies, while hearings on expenditures is conducted by the sessional committees of Parliament. The Minister of Finance and Economic Planning must prepare supplementary estimates for expenditure, for approval by the National Assembly within a period of four months and if the National Assembly is in recess at the first sitting of the Assembly. The Minister of Finance is required to prepare a Supplementary Appropriation Bill confirming the approval by Parliament of such expenditure or the excess of expenditure within 15 months after the end of the financial year. If the National Assembly is not sitting then, the bill must be tabled within a month of the first sitting, a Bill to be known as the Excess Expenditure Appropriation Bill. Thus, the roles and responsibilities of the legislature is moderately well assigned in principle but the budget disbursement of resources to spending units is appropriated on the basis of ad-hoc criteria which can later be legitimised by both supplementary and excess expenditure acts, and there is inadequate time for parliamentarians to scrutinise budget documents. 5.3 GOVERNMENT REFORM PROCESS (from Public Expenditure Management and Financial Accountability, PEMFA Evaluation Report) 5.3.1 General description of recent and on-going reforms In the early 1990s, Government began a political and socio-Economic reform process, which entailed democratising the political system and liberalizing the economy. The political reforms gave special impetus to public demand for good governance, transparency and accountability in the conduct and management of public affairs. The Economic reforms focused on privatization of parastatal entities and the redefinition of the role of the Public Service from that of controlling the overall economy to that of providing a conducive environment for market based and private sector driven economy.

161
5.3.2 Public Service Reform Programme (PSRP) In 1993, Government initiated the PSRP to restructure the Public Service in order to improve the quality of service delivery. Therefore, Government designed the Public Service Capacity Building Project (PSCAP) as a comprehensive strategy to build institutional and human capacity for quality public service delivery, it became operational in October 2000 and was designed to be implemented over a thirteen-year period (2000-2013). The focus of the first phase was on the following five major outputs:
• right-sizing and pay reform of the Public Service, • improved policy and Public Service management, • improved financial management, accountability and transparency, • improved capacity of the judicial and legal systems and • decentralisation and participatory governance.
5.3.3 Poverty Reduction Strategy Paper (PRSP) The PRSP was developed as the Nations’ medium term overall policy framework for national planning and interventions for development and poverty reduction for the period 2002-2004. The strategy for poverty reduction was rapid economic growth and employment creation. This would result in improvements in national resources management, a conducive macroeconomic framework, sectoral performance improvements especially in key sectors such as agriculture and social sectors, infrastructure developments, overall improvements in governance and public service delivery capacity. 6.0 AUTOMATIC STABILISERS During a recession ‘phase’, income does not fall to zero because the benefit (welfare and unemployment benefits) system provides some income. The effect of automatic stabilizers when an economy is recovering from a recession is known as ‘fiscal drag’. Fiscal drag refers to the effect inflation has on average tax rates. If tax allowances are not increased in line with inflation, and people's incomes increase with inflation then they will be moved up into higher tax bands and so their tax bill will go up. However, they are actually worse off because inflation has cancelled out their pay rise and their tax bill is higher, this is to the benefit of the revenue authorities. It is getting more tax without increasing tax rates, a subtle means of raising more tax revenue. To maintain average tax rates, allowances should be increased by the amount of inflation each year. 7.0 THE PUBLIC DEBT This is the total amount of accumulated borrowing by the local and central governments including public corporations, to its various creditors both local and foreign, the International Monetary Fund (IMF), the World Bank etc. Note that debt increases, interest rate payments form a large portion of government expenditure.

162
The debt instruments are of two types: Debt management in terms of contracting, servicing and repayment is a major element of the overall fiscal policy. The financial report of the Minister of Finance and Economic Development must include a statement showing the particulars of debt charges paid in that financial year in respect of loans raised under the Act. A loan may be raised as a debt instrument of two types, marketable debt, this is either short-term debt that consists of treasury bills or long-term debt that consists of Government bonds or by agreement in writing. Non-marketable debt consists of any other debt raised by the Government either internally or externally. In addition, the debt can be reproductive, that is, used to purchase a real asset or it can be a deadweight debt, meaning that no assets are covering the debt. The Act empowers the minister to raise any loan in accordance with such conditions and upon such terms, as s/he shall direct. If the loan is raised through the issue of a bond, stock or Treasury bill, the Bank of Zambia is the Minister’s agent. The Zambian National Debt problem is being addressed with the implementation of the HIPC Initiative (from multilateral and Paris Club bilateral creditors), voluntary additional relief on part of some of the Paris Club bilateral creditors and the G8 debt cancellation initiative. Prudent fiscal policy/discipline needed to reduce the budget deficit to manageable levels. 8.0.0 FIFTH NATIONAL DEVELOPMENT PLAN (FNDP) Governments accept the Keynesian Theory that active Government involvement in the economy is necessary for macroEconomic stabilisation. In a mixed Economic system, the party in power can change the shape of the economy. The Government, it may decide to trim down the public sector and fatten the private sector, or vice versa. The Zambian government has a major Economic role and responsibility, it has articulated its long -term development objectives in the National Vision 2030, and the FNDP is an important step towards the realisation of this vision. The development goals are: (a) Reaching middle-income status (b) Significantly reducing hunger and poverty (c) Fostering a competitive and outward oriented economy. The theme of the FNDP is ‘broad based wealth and job creation through citizenry participation and technological advancement’. The broad MacroEconomic objectives for the FNDP are as follows:
• To accelerate pro-poor Economic growth, this is the main goal of the FNDP, to realise this goal, the aim is to have an annual growth rate of at least seven percent, and ensure that growth is broad based and rapid in the sectors where the poor are mostly engaged.
• To achieve and sustain single digit inflation • To achieve financial and exchange rate stability

163
• To sustain a viable current account position, and • To reduce the domestic debt to sustainable levels.
The above are the overall characteristics of the economy, which any government discern as desirable. An additional objective, which is included in the FNDP theme of job creation, is attainment of full employment. The MacroEconomic objectives of Governments are interdependent, at the same time, simultaneous success is impossible (Phillips curve!). The FNDP contains the policy instruments that the Government intends to use to achieve the MacroEconomic objectives listed above, are outlined as follows: 8.0.1 FISCAL POLICIES To focus on avoiding excessive fiscal deficits and debt by reducing government borrowing which in turn, contributes to a decline in interest rates, besides the reduced external debt servicing through the highly indebted poor countries (HIPC) initiative. This will also allow for an expansion of credit to the private sector, no crowding out effect! However, budget execution need to be improved, financial accountability and expenditure monitoring systems need strengthening, as well as strengthening the revenue base, whose weak systems have created potential avenues for fraud. 8.0.2 MONETARY AND FINANCIAL POLICIES To focus on achieving and maintaining single-digit inflation as a pre-requisite for reducing high interest rates which have contributed to poor access to financial services within the economy. The Zambian financial sector is characterised by high cost of borrowing, thin capital markets and absence of financial services in rural and peri-urban areas. The focus in the FNDP is to develop the capital markets, developing and implementing a rural financing policy and strategy and the strengthening of banking and non-banking financial institutions. 8.0.3 SUPPLY-SIDE POLICIES To reduce inflation, there is need to address supply side factors such as the poor infrastructure and marketing systems, the vulnerability of the agricultural sector to weather fluctuations, and weak policy implementation. 8.0.4 EXTERNAL SECTOR POLICIES The objectives of the external sector are to achieve the following: - Sustain a viable Current Account balance by promoting export growth and maintaining a
competitive exchange rate. The mining sector will continue to play an important role, however, the development strategy focus is diversification away from copper.
- Improve the external competitiveness of the economy.

164
- Maintain a sustainable external debt position. 8.1 POLICY CONSTRAINTS In practice, Governments have limitations in their ability to achieve MacroEconomic objectives generally, because of various reasons. Some of the constraints are: a) Previous policy decisions taken by the previous government, especially the fiscal and
regional policies. b) The Government may lack perfect knowledge/information of the economy. The statistics
may be outdated or based on estimates. c) Policy changes take time to implement and time to be effective, a time lag. d) There is no ceteris paribus, this means that there is no technique that to hold other variables
constant. Zambia has extremely free trading with borders very wide open compared to countries like Zimbabwe and South Africa.
e) Political factors often supersede prudent policy Economic judgement, especially in a developing country like Zambia with not enough checks and balances and unplanned by-elections!
f) In addition to the constraints of information and time, the methods may be inefficient in that they do not achieve their targets, or the pursuit of one policy instrument may limit the effectiveness of the other.
g) The fluctuating patterns of booms and recessions, the trade cycle, can affect the achievement of macroEconomic objectives. For example, when there is international recession, there is no Economic growth.
9.0 CHAPTER SUMMARY Public finance deals with finances of the Government, which is reflected in terms of expenditure and revenue. Governments spend their income on the provision of a variety of services that the private sector does not provide. Examples are defence, internal security, education, health etc. The large sums of money, which governments require, are obtained primarily through taxation levied on incomes (direct, progressive taxes), and on goods and services sold (indirect, regressive taxes). Taxes may be apportioned among people on the basis of ability to pay or on the basis of benefits received. Each type of tax has its advantages and drawbacks. Another source of government revenue is through privatization. This is the transfer of assets from public to private ownership. However, it has some advantages and disadvantages, hence there are some arguments in favour of nationalized industries. When it is inexpedient or impossible to raise needed funds, governments may borrow money, either on a long or a short-term basis. In addition, governments manipulate their tax impositions, their expenditures and their borrowing so as not to merely to finance desirable projects and services but also to maintain the national economy in a stable condition, known as fiscal policy.
165
The objective of fiscal policy can be either a deflationary gap, operate a budget deficit (reduce taxes and increase government expenditure) in order to reduce the high levels of unemployment. Alternatively, a government can aim for an inflationary gap, that is, operating a budget surplus (increase taxes and reduce government expenditure) in order to check inflation. The total amount of government borrowing is known as the national debt. The FNDP is an important step towards the realisation of national vision 2030, and the development goals are: a) reaching middle-income status b) significantly reducing hunger and poverty c) fostering a competitive and outward oriented economy. The government came up with five discernable macroeconomic objectives, these will achieved using various instruments such as fiscal and monetary policies. In practice, governments face a number of policy constraints which hinder them from achieving the macroeconomic objectives.

166
REVIEW QUESTIONS 1. What is the difference between fiscal policy and monetary policy? 2. What are the objectives of fiscal policy? 3. Distinguish between direct taxes and indirect taxes. 4. What is:
a) A regressive tax? b) A progressive tax? c) A proportional tax?
5. What are Adam Smith’s four canons of taxation? 6. If the government decides to introduce a poll tax, which would 7. involve a flat levy of K20, 000 on every adult member of the population, how would you
describe this tax? Would it be a progressive, proportional, regressive or an ad valorem tax? 8. What is the public sector net cash requirement (PSNCR)? 9. What is the fiscal stance? 10. State four arguments in favour of privatisation ------------------------------------------------------------------------------------------ EXAMINATION TYPE QUESTION 13.1 Explain briefly what is meant by the term ‘public sector net cash requirements’ and describe how it might be financed? (10 marks) Describe the problems governments face when attempting to reduce the public sector net cash requirement and explain briefly how the business sector might be affected by these attempts. (10 marks)
TOTAL: 20 MARKS
EXAMINATION TYPE QUESTION 13.2 a) The revenue of the Zambian Government is mostly from taxation. Distinguish between direct
and indirect taxes giving two examples of each. (8 marks) b) Explain what is meant by fiscal policy. (4 marks) c) Outline the principles of a good tax system (8 marks) TOTAL: 20 MARKS

167
CHAPTER FOURTEEN
INTERNATIONAL TRADE ______________________________________________________________________________________________ After studying this chapter, the students should be able to: � Appreciate the growing impact of globalisation and the multinational companies � Explain why countries undertake international trade and the benefits they get from international trade � Understand the law of absolute and the law of comparative advantages � Distinguish free trade from protectionism � Identify the reasons for trade restrictions, and the different forms of trade restrictions � Understand terms of trade and its importance � Appreciate of international organizations that facilitate free trade _______________________________________________________________________________ 1.0 INTRODUCTION International trade involves the exchange of goods and services between countries. It involves trades among nations. A nation trades because it lacks the raw materials, climate, specialist labour, capital, or technology needed to manufacture a particular good. Thus, international trade arises because countries have different production capacities and different demands for goods and services. 1.1 GLOBALISATION Economic activity has been internationalized. This is reflected in the growth of trade and other capital flows, currency bought and sold in the foreign exchange market, has lead to the term global economy. The global economy refers to an open economy where the ratio of exports to output forms a significant proportion of economic activity. World trade has been expanding to the extent that neighbouring countries that have always traded with each other are making such arrangements more formal. Trade agreements like the free trade areas where countries agree to reduce or abolish trade restrictions between member countries, while allowing members to impose their own separate trade restrictions against non-member states. Alternatively, it may be extended into a customs union, where free trade is encouraged among members but erect a common external tariff on imports from non-member states. In addition, there are common markets, which are similar to customs unions but include the free movement of factors of production as well as trade.
168
1.2 MULTINATIONAL COMPANIES (MNCs) The growth of multinational companies has taken place in an environment of increasing globalisation of markets. A multinational company is one, which owns or controls production or service facilities in more than one country. Note that a company does not become a multinational simply by trading internationally! The growth of globalisation is unstoppable, and with it is their power to influence international trade. However, the extent to which the Zambian economy benefits from MNCs is difficult to assess. The assessment of the impact of MNCs on national economies is considered under various costs and benefits. Direct foreign investment by an MNC should improve economic welfare as capital is transferred, capital inflow into a relatively poor country, and it should also promote technology transfer. New technologies being transferred without the research and development costs. In addition, local companies can copy superior processes and organizational patterns. Employment can also be provided. In practice, MNCs only transfer technologies at low levels, and once the profits from the investment are remitted back, it becomes an outflow of foreign currency. Most MNCs may decide to employ their own nationals in top management positions. The worst part is that MNCs are offered grants, subsidies, tax relief etc., in order to attract them into poor economies like the Zambian one, while MNCs can gain a cost advantage, integrating vertically by establishing assembly plants in countries where there is abundant cheap, high-quality labour. Some MNCs pursue a policy of horizontal integration in order to gain new markets and expand sales. The advances in communication, cheap air travel, development of satellite systems has made it cheaper for MNCs to develop new markets in overseas countries. 2.0 REASONS FOR INTERNATIONAL TRADE - Products that are not produced in a certain country are available in other countries, thanks to
international trade. For instance, computers are not produced in Zambia, but are produced in the United States.
- Unequal distribution of skills and technology. In addition, some countries have a good
reputation in the production of some commodities than other countries. An example is a country like Japan which is more skilled in the production of goods like cars.
- Excess demand for locally produced goods may force countries to import to offset the
shortage.
169
- Unequal distribution of resources. For example, oil is found in Angola but not in Zambia, the climate in South Africa is suitable for growing apples, but not the Zambian climate, etc.
2.1 THEORY OF COMPARATIVE ADVANTAGE Comparative advantage is a country’s ability to produce a product at a lower opportunity cost in terms of another country. The principle of comparative advantage states that countries will benefit by concentrating on the production of those goods in which they have a relative advantage. A country is said to enjoy a comparative advantage over another if, with the same input of resources, it can produce more of a good than another. A nation’s comparative advantage is measured in relation to all goods and services it produces. A country has a comparative advantage in those products that it can produce cheaply. Any product can be produced in any country but what matters most is the cost of production. It is therefore more beneficial for each country to use its resource in the production of those goods in which it has a cost advantage, and to trade with other countries to obtain, those goods, which cannot be produced locally or efficiently. The law of comparative advantage, therefore, states that a country should concentrate on producing those goods in which it has the greatest relative cost advantage and imports from other countries those goods in which it has the greatest relative cost disadvantage. 2.3 THEORY OF ABSOLUTE ADVANTAGE Absolute advantage means that a country is more efficient in the production of both goods under consideration than the other country being considered. A country’s absolute advantage is measured in relation to other nations. If two countries are producing the same product, the country that produces the product cheaply has an absolute advantage over the other. Even if a country has absolute advantage over the other in all products, there is still a possibility for the two nations to trade as illustrated in the example below.
For example, if two nations produce computers and cars as follows: Computers Ratio (calculate opportunity cost) Country X 10, 000, 000 10:1 in favour of country X Country Y 1,000,000 Cars Country X 1,000,000 2: 1 In favour of country X again Country Y 500,000 Given the scenario above, it is still possible for the two countries to engage in trade. Absolute advantage cannot hamper international trade.

170
Country X has absolute advantage in both cases but the size of its advantage is greater in computer production than in car production. Country Y’s disadvantage is smaller in car production than in the computer production. So it would be more beneficial to both countries if country X specializes in computer production and imports cars, while country Y specializes in cars production and imports computers. 3.0 FREE TRADE AND ITS EFFECTS Free trade is a situation whereby the flow of goods, services and capital are not hindered by any artificial barriers. In theory, trade on an international level, should be free from any restrictions, and those who advocate for free trade maintain that this, would lead to numerous advantages, such as - Enabling countries to specialise and increase production bearing in mind that the surplus can
be exported. - Countries export surpluses and import what they lack. - Access to the world market, therefore enabling countries to benefit from economies of scale. - Allowing countries to develop their industries as a result of free movement of capital. - Promoting beneficial political links and closer cooperation between countries. - Increasing efficiency due to competition from imports and limiting the creation of
monopolies. - The efficient use of resources also leads to lower costs of production which in turn leads to the
reduction in the prices of goods and services. - Provision of goods that were previously unavailable, a wider choice of goods to consumers. 3.1 DISADVANTAGES OF FREE TRADE - It leads to unemployment especially in cases where imported goods are subsidised by the
countries of their origin. - It has negative effects on new industries. - Dumping of imports on the local market leads to unfair competition. - It may lead to the importation of undesirable products. - The government will lose revenue because it can longer impose taxes on imports. 4.0 BARRIERS TO INTERNATIONAL TRADE In spite of the numerous advantages of international trading, countries the world over engage in some form of protectionism. There are different forms of protectionism, and some of them are: • Quotas. These are limits imposed on specified goods to be brought in the country. Import
quotas restrict the quantity of certain products, which can be imported into the country. If the product is homogeneous then a simple quota is imposed. If they are heterogeneous, then the quota can take the form of a value of imports allowed in any given currency.
171
The effect of quotas is to reduce the volume of imports, raise the price of imports and encourage the demand for locally produced commodities. Note that sometimes one country persuades another country to voluntarily reduce its exports
of a product to a certain acceptable level, this is known as voluntary export restraints (VERs). VERs is also known as orderly market arrangements emphasizing their negotiated manner. VERs often apply to key industries, an example is VERs negotiated by the United States of America on Japanese exports of motor vehicles.
• Tariffs or custom (import) duties. These are taxes that are levied on imports. It can be a fixed amount per unit (specific) or a percentage of the price (ad valorem).
The effect of tariffs is to raise prices of imports, and therefore reduce their demand, encourage the demand for locally produced commodities, as well as raise revenue for the government.
• Trade embargoes. This is a complete ban of imports from a particular country. Sometimes it is a total ban imposed on particular products like drugs, from any country! During the Iraq war of the early 1990s, the United Nations imposed a ban on Iraq’s exports. • Hidden export subsidies and import restrictions (Direct controls). This is a range of government subsidies and assistance for exports and deterrents against imports as follows: - Subsidies. The government gives subsidies to local firms to allow them to compete favourably
in terms of pricing of goods, with foreign firms. - Export credit guarantees or insurance against bad debts for overseas sales. - Grants or any form of financial help is provided to firms in the export sector - Zero rating or reducing taxes on exported goods - State assistance provided for firms in the export sector via the foreign office. In addition, imports are discouraged through - Health and Safety regulations. Countries sometimes put in place health and safety
regulations that limit the importation of certain goods. For example, the Zambian government has put in place a regulation that stipulates that sugar sold in Zambian market must be fortified with vitamin A regardless of whether this sugar is locally produced or imported.
- Administrative procedures (bureaucracy). These are long, complex and costly procedures that importers have to go through at border posts.
- Exchange controls. These are aimed at restricting the amount of foreign exchange that is available to importers.

172
4.1 ARGUMENTS IN FAVOUR OF PROTECTIONISM a) To protect new and declining industries. New industries need to be protected from foreign competition before they become strong to be on their own, while declining industries might quickly collapse and lead to mass unemployment if not protected. b) To reduce unemployment. Unfair competition from foreign products may lead to the closure
of home industries. Therefore, the government protects its industries in order to prevent the closure of industries and unemployment.
c) To reduce or eliminate balance of payments deficits. Restricting imports will help to reduce
or eliminate balance of payments deficits. d) To raise revenue. The government raises revenue from import tariffs that are imposed on
imported products. e) To protect strategic industries. Industries such as ship building, defence and aerospace are
of strategic importance to many countries. Therefore many countries protect these industries from foreign competition
f) To protect against dumping of imported products on local market. Dumping is a situation
where goods are sold at lower prices in a foreign market than in the home market. g) Retaliation against measures taken by another country that are unfair. h) To prevent unfair competition. Governments may justify protectionism with reference to the
trading policies of its competitor nation, such as selling imitations at artificially low prices.
4.2 ARGUMENTS AGAINST PROTECTIONISM a) The fear of retaliation. If a country imposes restrictions against other countries’ exports, the
affected countries can retaliate by imposing restrictions on its exports. b) Reduction in industrial efficiency. Protecting industries from international competition
reduces their efficiency. c) Cost to consumers. Protectionism is costly to consumers because they are forced to pay high
prices for goods of poor quality. d) Restricted choice of products Protectionism leads to the reduction in the range of products
available to customers.

173
5.0 TERMS OF TRADE The terms of trade are the ratio of an index of (visible) exports prices to an index (visible) import prices. They measure the relative change of the price of exports and the price of imports. A base year is chosen, at which point the average price of exports is assigned an index value of 100, as is the average price of imports. Suppose that in 2000, the base year, the average price of a basket of visible Zambian exports was K450, 000, while the average price of a basket of imports was K500, 000. Each of these prices would be assigned an index of 100, and the terms would be (100/100) = 1. In fact, 100 multiply this ratio when the terms of trade are calculated. So the terms of trade for the year 2000 are 100. Now suppose that in the following year (2001) the average price of exports rose by 10%, to K495, 000, while the average price of imports rose by 6%. The index for exports would rise to 100x 1.1 = 110, and the index for imports would rise to 106 (100x1.06). The terms of trade for 2001 would be (110/106) x 100 =104. The rise in the terms of trade reflects the fact that export prices have risen more than import prices. An increase in the terms of trade is called an improvement in the terms of trade, though it may not always be desirable. One reason for wanting an increase in the terms of trade is that a given quantity of exports will now pay for more imports. In the example above, the foreign currency earned by exporting one basket of exports in the year 2000 (K450, 000 worth) would buy 450/500 =0.9 or 90% of a basket of imports. When the terms of trade improved in 2001, so that the average price of exports was K495, 000, while that of imports was K500, 000 x1.06 = K530, 000, one basket of exports would earn enough foreign currency to pay for 495/530 = 0.9339 or 93.34 % of a basket of imports. This means that, ceteris paribus, fewer exports are required to pay for imports. An improvement in the terms of trade will be advantageous if it results in an increase in funds coming in and/ or a decrease in funds leaving the country. This happens if the PED for imports and exports is less than 1.

174
6.0 REGIONAL AND INTERNATIONAL ORGANISATIONS 6.1 THE SOUTHERN AFRICAN DEVELOPMENT COMMUNITY (SADC) � HISTORICAL BACKGROUND The Southern African Development Community (SADC) came into existence in 1980, as an alliance of independent Southern African States. The Southern African Development Community (SADC) was formerly known as the Southern African Coordination Conference (SADCC) and formed with the goal of helping countries in the Southern African region to lessen dependence on South Africa. The SADC headquarters are in Gaborone, Botswana. � MEMBER STATES The member states are Angola, Botswana, the Democratic Republic of Congo, Lesotho, Madagascar, Malawi, Mozambique, South Africa, Swaziland, Tanzania, Zambia and Zimbabwe. � OBJECTIVES OF SADC - The achievement of economic growth and development in member countries. - Promotion of peace and security - Promotion of common political beliefs and values - Promotion of self-sustaining development - Achievement of self- sustaining utilisation of natural resources and protection of the
environment. - The strengthening of long standing cultural links among the peoples of the SADC region. � ACHIEVEMENTS - Increase of trade among member sates. - Member countries have strengthened their bargaining power. � CHALLENGES - Each member state uses a different currency and this hampers free trade. - Over dependence on donor funding. - Lack of participation in decision-making and other SADC activities by ordinary citizens. � FUTURE OUTLOOK SADC faces a bright future due to the following reasons: - Donor confidence has been increasing. - The SADC market is big with a population of 60 million people and rich in mineral resources. - The region is likely to attract more investment with attainment of peace in Angola and the
Democratic Republic of Congo (DRC).

175
6.2 COMMON MARKET FOR EASTERN AND SOUTHERN AFRICA ( COMESA) � HISTORICAL BACKGROUND OF COMESA COMESA was established in 1993 in Uganda replacing the Preferential Trade Area (PTA) that was founded in 1981. Its headquarters are in Lusaka, Zambia. � MEMBER STATES These are Angola, Burundi, Comoros, Egypt, Eritrea, Ethiopia, Kenya, Lesotho, Madagascar, Malawi, Mauritius, Mozambique, Namibia, Rwanda, Sudan, Swaziland, Tanzania, Uganda, Democratic Republic of Congo (Zaire) Zambia and Zimbabwe. � OBJECTIVES OF COMESA - To achieve sustainable economic and social progress in all member countries. - To promote economic cooperation among member states. - To establish and maintain a Free Trade Area. - To remove all tariff and non- tariff barriers. - To create a Customs Union - To promote free movement of capital and investment. � ACHIEVEMENTS - Creation of the COMESA Free Trade Area (FTA). - Creation of an enabling environment for trade. - A wider, harmonised and more competitive market. - Greater industrial productivity and competitiveness. - Increased agricultural production and food security - More harmonised monetary, banking and financial resources. � CHALLENGES - Inability to participate effectively in the World Trade Organisation (WTO) negotiations. - Resistance to elimination of trade barriers - Lack of political stability in some member states like the Democratic Republic of Congo
(DRC). - Difficult to co-ordinate countries of vastly different economic, social and political
backgrounds. - Undeveloped infrastructure such as roads and telecommunication networks in some member
states. � FUTURE OUTLOOK COMESA faces a bright future for the following reasons:
176
- COMESA’s population of over 300 million people constitutes a potentially large market and a huge reservoir of both skilled and unskilled labour.
- The COMESA region covering an area of about 12.89 million square kilometres is rich is minerals, lakes and rivers that can be exploited for irrigation, hydroelectric power and fisheries.
- Increased regional integration in trade and investment will lead to an expansion of the industrial and services sectors of member states.
6.3 THE EUROPEAN UNION (EU) � HISTORICAL BACKGROUND OF THE EU The European union (EU) formed in 1992 is an intergovernmental union of 25 countries of the European continent. Its headquarters are in Brussels, Belgium. � MEMBER STATES The EU is made up of 25 countries namely Italy, United Kingdom, France, Germany, Greece, Luxembourg, Netherlands, Ireland, Portugal, Spain, Belgium, Sweden, Finland, Denmark, Austria, Cyprus (Greek Part), Czech, Estonia, Hungary, Latvia, Lithuania, Malta, Poland, Slovakia and Slovenia. � OBJECTIVES OF THE EU - Abolition of remaining controls on capital flows. - Removal of all non- tariff barriers to trade. - Progress in harmonising tax rates. - Removal of frontier controls and bias in public sector purchasing to favour domestic
producers. � ACHIEVEMENTS - Creation of a single market consisting of customs union, a single currency managed by the
European Central bank. - Establishment of a common policies in agriculture, trade, fisheries and foreign and security. - Abolition of passport control and custom checks at many of EU’s borders. - Creation of single space of mobility for EU citizens to live, travel, work and invest. � CHALLENGES - Adoption, abandonment or adjustment of the new constitutional treaty. - The EU’s enlargement to the south and east. - Resolving of the EU’s fiscal and democratic accountability. - Economic viability with the United States, China and India.

177
6.4 THE WORLD TRADE ORGANISATION (WTO) � HISTORICAL BACKGROUND OF WTO The World Trade Organisation (WTO) was formed in 1995. It replaced the General Agreement on Trade and Tariffs (GATT) that was established in 1948. Its secretariat is based in Geneva, Switzerland. The main purpose of WTO is to promote free trade by persuading countries to abolish import tariffs and other barriers. � MEMBER STATES In November 2005, membership of the WTO stood at 149 countries. � OBJECTIVES OF THE WTO - To promote free trade by persuading nations to abolish import duties and other barriers. - To oversee the rules of international trade. - To police free trade agreements. - To settle trade disputes between member countries. - To organise trade negotiations. 6.5 THE WORLD BANK (THE INTERNATIONAL BANK FOR REC ONSTRUCTION AND DEVELOPMENT) The World Bank came into existence in 1945 but commenced its operations in 1946. It is a non-profit organisation owned by member governments and has its headquarters in Washington, D.C in the United States of America.
OBJECTIVES OF THE WORLD BANK • To fight poverty and improve the living standards of people in developing countries. • To provide long-term loans and grants to developing countries. • To provide technical assistance to help developing nations in their quest to reduce poverty. • To provide assistance to developing countries on issues of economic development. 6.6 THE INTERNATIONAL MONETARY FUND (IMF) The IMF was formed in 1944 by the Bretton Woods Agreement and started operating in 1947. The principal function of the IMF is to help countries with balance of payment problems. Its headquarters are in Washington, D.C in the United States of America.

178
OBJECTIVES OF THE IMF
• To promote international monetary cooperation and international payments. • To encourage international trade among member states. • To promote exchange rate stability in member states. • To eliminate or remove of foreign exchange restriction • To provide advisory services to member states • To ensure that there is adequate supply of international liquidity. 7.0 CHAPTER SUMMARY International trade is important because it allows countries to specialize according to the law of comparative advantage. The law of comparative advantage states that international trade is most efficient and advantageous if each country sells the goods of which the country has the most advantage in production relative to other goods received in exchange. There are a number of advantages of international trading such as giving consumers in each country more choice, encouraging efficiency in production, which is likely to result in lower prices. In spite of the numerous advantages of free trade, countries engage in protectionist policies for various reasons. These include protecting employment, helping infant industries, preventing unfair competition, protecting the balance of payments, and raising revenue. There are some arguments against protectionism. It is argued that they encourage inefficiency, lead to misallocation of resources, raise the cost of living, and retaliation may occur. The methods or forms which protectionism takes include tariffs, quotas, hidden import restrictions and export subsidies. The terms of trade refer to the rate at which exports can be exchanged for imports. An improvement in the terms of trade may not necessarily be beneficial as it reflects an increase in export prices arising from domestic inflation. However, an improvement in the terms of trade does reflect that fewer exports need to be sold to pay for each import because export prices are rising faster than import prices. There are a number of international institutions, which facilitate international trading. Some of the international institutions are regional groupings that can take different forms, such as free trade areas, customs union and/or common markets.

179
REVIEW QUESTIONS 1. International trade is based on which principle? 2. State the law of comparative advantage 3. State what you think is the comparative advantage of your country, and what you think are
Zambia’s non-traditional exports. 4. What are the terms of trade? 5. Give three arguments for protectionism 6. What does the world trade organization (WTO) attempt to do? 7. What is a multinational company? 8. Why have some companies become multinational in structure? 9. How can multinational companies benefit economies? 10. Differentiate tariffs from quotas as barriers to free trade 11. What do a free trade area, a customs union and a common market mean? 12. The following data relates to the export and import prices of a country for three years.
N.B. Where 2004 = 100
Year Unit value of Unit value of imports exports 2004 100 100 2005 112 106 2006 116 114
You are required to calculate the terms of trade in the years 2005 and 2006, and comment on your results. ---------------------------------------------------------------------------------- EXAMINATION TYPE QUESTION 14.1 (a) Malawi and Zambia each produce both tobacco and maize in thousand of tons, as shown below:
Tobacco Maize Malawi 20 200 Zambia 10 150
Malawi appears to have an absolute advantage in the production of both commodities. Would you advice that trade should still take place between the two countries? Justify your answer. (6 marks)
(b) Despite the numerous advantages of free trade, countries engage in protectionism. mention briefly four arguments for protectionism. (8 marks)

180
(c) Explain three forms of protectionism. (6 marks) TOTAL: 20 MARKS EXAMINATION TYPE QUESTION 14.2 a) Discuss five benefits of international trade. (10 marks) b) Explain briefly i) The comparative cost (comparative advantage) theory of trade. (5 marks) ii) The terms of trade (5 marks) TOTAL: 20 MARKS

181
CHAPTER 15
BALANCE OF PAYMENTS AND EXCHANGE RATES ______________________________________________________________________________________________ After studying this chapter, the students should be able to: � Explain the monetary aspects of international trade transactions � Understand the composition of the balance of payments account � Explain how to correct a deficit balance of payments � Appreciate of different types of foreign exchange systems � Discuss the merits and demerits of each exchange rate system. � Explain the difference between foreign exchange depreciation and appreciation � Understand factors influencing foreign exchange rates _______________________________________________________________________________ 1.0 INTRODUCTION Balance of payments (BOP) is a measure of the payments that flow into and out from a particular country from other countries for a specific period usually a year. It is a statistical ‘accounting’ record of the international trading and capital transactions that have taken place during that year. This is determined by a country’s exports and imports of goods, services, financial capital and financial transfers, and since buying goods and services from foreign countries is complicated by the fact that countries use different national currencies, this last chapter also deals with the foreign exchange market. 1.1 COMPOSITION OF BALANCE OF PAYMENTS The Balance of payments consists of two parts namely (a) The current account. This shows a record of net flow of money from transactions
involving the purchase of goods and services, and transfer payments. The current account itself is divided into basically two parts namely
i) Trade in goods (known as visible or trade account)
The exports and imports of physical commodities such as copper and maize are recorded on this account. The account may show a surplus or a deficit. Exports are money coming into a country and if the exports are higher than the imports, then there is a surplus on thevisible trade account and vice versa.
ii) Trade in services (known as invisible trade account) This is usually recorded as a net figure, implying the difference exports and imports of services such as tourism, insurance, civil aviation, patents, foreign aid, grants, gifts etc. It also includes the difference between factor incomes payable and receivable such as wages to foreign workers, interest on foreign debt, dividend payments on shares held by

182
foreigners or income on any foreign investments. It is recorded as net transfer income from abroad or paid abroad depending on whether there is a higher net inflow or a higher net outflow of money respectively. This account can either be in surplus or deficit.
The current account, being a combination of the two accounts above, can either be positive or negative, that is either a surplus or a deficit. When exports or money received from trade in goods, services and factor incomes exceed imports or money paid for trade in goods, services and factor incomes, it means there a surplus or a favourable current account balance. When imports exceed exports, it means there is a deficit or an unfavourable current account balance. Note that this is what is referred to as the surplus or deficit balance of payments account!
(b) The capital account. This account records all international financial transactions in
the country,the external assets and liabilities. In general it records medium and long- term capital inflows and outflows, including official reserves. The inflows into the capital account:
• Foreign loans • Investment by foreigners into Zambia • Aid from donor countries • A reduction in external reserves • Trade in shares in Zambian investments by people based outside Zambia. • Selling of assets that are based in other countries.
The outflows from the capital account:
• Zambians investing in other countries. • Zambia giving aid or loans to other countries. • Trade in shares by Zambians in investments abroad • An increase in external reserves. • Selling of assets based in Zambia to people based outside Zambia.
In summary, if foreign ownership of domestic assets has increased more quickly than domestic ownership of foreign assets in a given year, then the domestic country has a capital account surplus. On the other hand, if domestic ownership of foreign assets has increased more quickly than foreign ownership of domestic assets, then the domestic country has a capital account deficit. The capital account ‘finances’ or ‘covers’ the current account, since a surplus or deficit on the current account must be ‘balanced’ by a deficit or surplus on the capital account respectively. If for example there is a negative or a deficit current account balance, then it must be ‘financed’ by inflows into the capital account and vice versa.

183
The above means the sum of the balance of payments account must always be zero. In practice, an additional account is included to achieve the zero balance. This is known as net errors and omissions or a balancing item.
1.2 Official Reserve Account
The official reserve account records the government's current stock of reserves. Reserves include official gold reserves, foreign exchange reserves, and strategic defense reserves (SDRs), such as the Strategic Petroleum Reserve.The Balance of Payments is the sum of the Current Account and the Capital Account. Therefore, Balance of Payments = Current Account + Capital Account = Change in Official Reserve Account! The balancing item is a change in the official reserves. A negative sign is an increase in official reserves while a positive sign is a decrease in official reserves.
1.3 Zambia’s balance of payments (extracts from the B.O.Z annual report) The improvement in the terms of trade, on account of the increase in the international price of copper, as well as the attainment of the enhanced HIPC Completion Point contributed to the improvement in the performance of the external sector during the year. Consequently, the deficit in the overall balance of payments declined. Preliminary information indicates that the deficit in the overall balance of payments narrowed by 21.3% to US $274 million in 2005 from US $348 million in 2004. This improvement in the overall balance was largely due to the favourable performance in the capital and financial accounts despite the deterioration in the current account. Project loans and grants, foreign direct investment as well as portfolio inflows registered significant increases, and enhanced the capacity to build-up Gross Official International Reserves (GIR) of the Bank of Zambia. This development reinforced the positive effects of the improvement in the terms of trade. Current Account
The combination of continued strong economic activity and the appreciation of the Kwacha led to an increase in the current account deficit through increased imports. There was a decrease in the merchandise trade balance as well as the deterioration in net services and income accounts. The merchandise trade balance declined by 28.0% to US $59 million in 2005 from US $82 million in 2004 while the net services and income accounts deteriorated by 17.2% and 42.7% to US $252.0 million and US $605.0 million, respectively. The decline in the trade balance resulted from a higher increase in the value of merchandise imports than that of merchandise exports. The value of imports increased by 19.7% to US $2,068 million from US $1,727 million recorded in 2004. The increase in the import bill was in part explained by the continued high investment activity in the mining sector and the rise in the price of oil on the world market. The strengthening of the Kwacha against major trading currencies also reinforced increased domestic demand for imports.
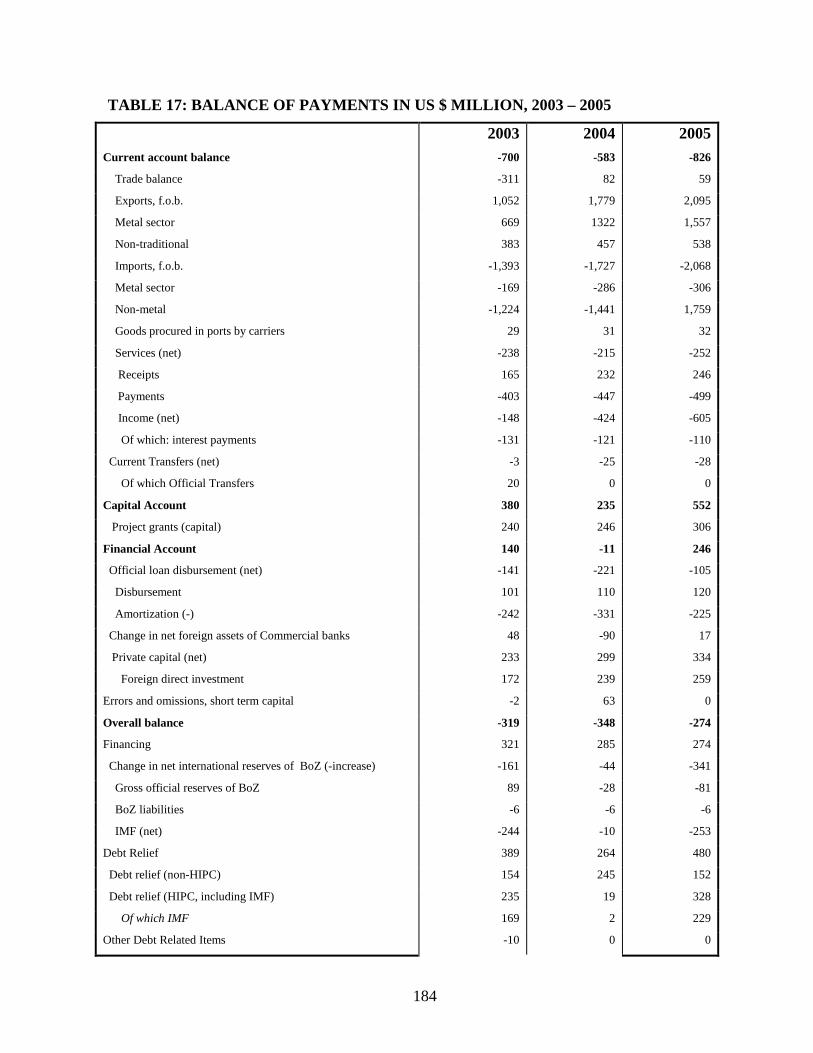
184
TABLE 17: BALANCE OF PAYMENTS IN US $ MILLION, 2003 – 2005
2003 2004 2005 Current account balance -700 -583 -826
Trade balance -311 82 59
Exports, f.o.b. 1,052 1,779 2,095
Metal sector 669 1322 1,557
Non-traditional 383 457 538
Imports, f.o.b. -1,393 -1,727 -2,068
Metal sector -169 -286 -306
Non-metal -1,224 -1,441 1,759
Goods procured in ports by carriers 29 31 32
Services (net) -238 -215 -252
Receipts 165 232 246
Payments -403 -447 -499
Income (net) -148 -424 -605
Of which: interest payments -131 -121 -110
Current Transfers (net) -3 -25 -28
Of which Official Transfers 20 0 0
Capital Account 380 235 552
Project grants (capital) 240 246 306
Financial Account 140 -11 246
Official loan disbursement (net) -141 -221 -105
Disbursement 101 110 120
Amortization (-) -242 -331 -225
Change in net foreign assets of Commercial banks 48 -90 17
Private capital (net) 233 299 334
Foreign direct investment 172 239 259
Errors and omissions, short term capital -2 63 0
Overall balance -319 -348 -274
Financing 321 285 274
Change in net international reserves of BoZ (-increase) -161 -44 -341
Gross official reserves of BoZ 89 -28 -81
BoZ liabilities -6 -6 -6
IMF (net) -244 -10 -253
Debt Relief 389 264 480
Debt relief (non-HIPC) 154 245 152
Debt relief (HIPC, including IMF) 235 19 328
Of which IMF 169 2 229
Other Debt Related Items -10 0 0

185
Net change in arrears (+ increase) 48 0 0
BOP support grants 45 44 105
BOP support loans 10 21 29
Multilateral 10 21 29
Bilateral 0 0 0
Financing gap (+) 0 0 0
Memorandum items:
Nominal GDP (millions of US $) 4,326 5,422 6,968
Current account balance (% of GDP) -16.2 -10.7 -11.9
Terms of trade (percentage change) 4.2 21.9 2.1
Copper volume (MT.'000) 353 393 417
Copper price (US$/lb) 0.78 1.20 1.52
Gross official Reserves 194 222 303
(In months of imports) 1.3 1.2 1.4
Debt service cash payments (US $m) 192 371 162
(In % of exports) 15.4 18.2 6.8
Of which; official debt service 108 114 129
Source: Bank of Zambia and Fund Staff Estimates Notes: The figures reported in the Balance of Payments table are as estimated in October 2005
Total export earnings in 2005 increased by 17.8%, to US $2,095 million from US $1,779 million in 2004, with earnings of metal and non-traditional exports (NTEs) both rising by 17.8% to US $1,557 million and US $538 million, respectively. The increase in copper prices was mainly due to sustained international demand particularly from China and India while export volumes edged upwards as a result of continued recapitalisation of the existing mines and commencement of full production at Kansanshi mine. In contrast, cobalt exports declined. The 17.7% increase in Non-Traditional Export was explained by growth in the exports of copper wire, sugar, burley tobacco, cotton lint and electrical cables.
The deficit in the services account deteriorated to US $252 million in the past year, reflecting large amounts of net payments made on trade-related services. With respect to the income account, the deficit widened by 42.7% to US $605 million. This increase was in spite of a 9.0% decline in official interest payments on external debts to US $110 million from US $121 million over this period. Capital and Financial Account
The surplus on capital and financial account rose to US $552 million in 2005 from US $235 million in 2004. This was largely due to increased donor inflows, foreign direct and portfolio investments as well as a reduction in debt amortization. Increased external capital inflows partly resulted from the rise in investor and donor confidence following the attainment of the enhanced HIPC Initiative Completion Point in April 2005.

186
Financing
The deficit in the overall balance of payments was financed mainly by debt relief of US $480 million, inflows of BoP support grants amounting to US $105 million and BoP support loans of US $29.0 million.
The Balance of Payments Support came from cooperating partners. Specifically, Zambia received from the European Union (EU), from the British Government under the Poverty Reduction Budgetary Support (PRBS) to finance priority poverty reduction programmes, from Finland, from Sweden, from the World Bank and from Norway.
2.0 THE PROBLEM OF BALANCE When a country has an adverse or a deficit (negative) balance of payments, this is regarded with serious concern. When a country has a favourable or credit (positive) balance, then there is satisfaction. Yet for all countries of the world, total payments must be equal to total receipts, since every payment is at the same time a receipt. Since all countries cannot achieve favourable balances in the same year, the aim should be an equilibrium balance of payments over a period of time. Each individual country’s balance of payments must balance each year. When all items have been taken into account, a balance is achieved by showing how the deficit or amount of credit (favourable) balance has been ‘covered’ or ‘financed’. If a country has a deficit in its balance, it must be ‘covered’ by inflows into the capital account. If it has a credit or positive balance, then it is ‘covered’ by outflows from the capital account. 2.1 CORRECTING A BALANCE OF PAYMENTS DEFICIT - Devaluation/depreciation Devaluation of a currency is a reduction in the exchange rate of the currency relative to other currencies. The objective of devaluing a country’s currency to make exports cheaper and imports expensive, by reducing the price of exports to foreign buyers (i.e. in foreign currency terms) and increasing the price of imports in terms of the domestic currency.
If for example the Zambian Kwacha to the US dollar is devalued form $1 = K3200 to $1 = to K4000, then foreign consumers and firms will be encouraged to switch to Zambian goods because with the same $1, they are able to purchase more Zambian goods. They are able to purchase K4000 worth of goods instead of K3200 worth of goods. In addition, local consumers and firms will be discouraged from imports. They will need to have K4000 to purchase a $1 worth of goods, before devaluation, they needed to have K3200 to purchase a $1 worth of goods.

187
Therefore, depreciation in the kwacha exchange rate should help to boost the overseas demand for Zambian exports because Zambian firms will be able to supply more cheaply in international markets.
The extent to which export sales rise following a fall in the exchange rate depends on the price elasticity of demand for Zambian products from foreign consumers.
A lower exchange rate should also cause imports into Zambia to become relatively more expensive, thus leading to a slowdown in import volumes and "expenditure-switching" towards local goods. The significance of elasticity of demand is again important.
In the short run, even if elasticities are favourable, a depreciation/devaluation does not immediately benefit a balance of payments in practice. It takes time for movements in the exchange rate to affect trade flows. In the short run, demand for imports is likely to be fairly inelastic, while exporters would be unlikely to increase the output to meet the increase in demand due to the depreciation of the currency. Therefore, there is likely to be an initial worsening of the current account because volumes are fixed.
In the long run, demand and supply become more elastic, production and volume of exports rise, imports can be substituted and the volume of imports falls. This improves the current account balance.
The effect of devaluation/depreciation of a currency on the current account is called the j-curve effect. The exact shape of the curve depends on the assumptions made, and it is usually assumed that the improvements in the current account eventually levels off.
Balance
0 Time (years)
- Deflation/Fiscal policy This is contraction of the domestic economy. Deflationary measures are aimed at reducing aggregate demand and this can be achieved by either increasing interest rate to discourage borrowing or increasing tax rates in order to reduce consumption expenditure. The government can also reduce its own expenditure.

188
Some of the overall trade deficit is due to the strength of domestic demand for goods and services. If and when the economy enters a slowdown phase, the growth of imports will fall, and this should provide an element of correction for the trade deficit
The effect of the deflationary measures is to reduce the demand for goods and services, including the demand for imports. If imports are high, demand for them is reduced by reducing the demand in the economy in general, as long as the demand for imports is income inelastic. If the fall in demand is accompanied by a reduction in inflation in the home market, the competitiveness of exports improves (as long as demand for exports in price elastic). In addition, firms are encouraged to switch to export markets because of the fall in domestic demand. Some of the overall trade deficit is due to the strength of domestic demand for goods and services. If and when the economy enters a slowdown phase, the growth of imports will fall, and this should provide an element of correction for the trade deficit. The major problem associated with deflation is that a sharp fall in consumer spending might lead to a steep economic slowdown (slower growth of GDP) or a full-scale recession.
- Direct controls (discouraging imports whilst encouraging exports). These are the direct controls mentioned earlier under protectionism. A government can impose trade restrictions like quotas, import duty, exchange controls, health and safety regulations etc. Increase exporters’ competitiveness on the international market by subsidising exporters. A government may also adopt policies to promote exports e.g. zero-rating VAT on exports, export credit guarantees etc. Eventually the policies result in more exports. The problem with this policy instrument is that there is a danger of other countries retaliation, as well as if the demand for imports is inelastic. - Raising interest rates. High interest rates are likely to make Zambia attractive to foreign investors and encourage inward investment, an inflow of foreign currency. This short- term capital movement of currencies by international financiers/speculators is known as ‘hot money’. Higher interest rates act to slowdown the growth of consumer demand and therefore lead to cutbacks in the demand for imports. It is a short-term measure, which eventually leads to an appreciation of the exchange rate. Note that the key to long-term improvements in trade performance is to focus on supply side policies. Controlling or reducing a balance of payments deficit in the long term is to achieve relatively low inflation with sufficient productive capacity to meet the domestic demand from consumers.
This requires a period of low inflation, low interest rates and a competitive exchange rate matched with sufficient non-price competitiveness in overseas markets. Price is not always the only deciding factor in winning the demand from buyers, investment in research and development and effective marketing strategies can have long term effects in maintaining market share.

189
An outward shift of long run aggregate supply would provide the economy with an increased capacity - permitting a reallocation of resources towards exporting. Therefore, a sustained improvement in the balance of payments requires businesses exploiting opportunities in export markets overseas, increased investment in services (including business finance, tourism) as many services are exportable and have the potential to earn huge sums in foreign currency. Improve efficiency and productivity in the export sectors.
3.0 EXCHANGE RATES Exchange rates are the price of a currency expressed in terms of another currency. An exchange rate is the price for obtaining one unit of a foreign currency. The exchange rate refers to the value of one currency (e.g. the Kwacha) in terms of currency (e.g. the United States Dollar). 3.1 DETERMINATION OF EXCHANGE RATES The basic forces behind the determination of exchange rates are those of supply and demand. Taking exchange rate for the kwacha against other currencies as an example, the exchange rate set in the market will be affected by supply of and demand for Kwacha. 3.2 DEMAND People and firms want the Kwacha for various reasons: a) To pay for Zambian exports. b) Investors based abroad wanting to invest in Zambia. c) Speculation. Speculators will buy the Kwacha at the current exchange rate, if they think it
going to appreciate in the near future. They want to sell the Kwacha at a higher exchange rate in future.
d) The central bank may want to buy Kwacha to push up its value on the foreign exchange market.
3.3 SUPPLY Supplies of Kwacha arise when people buy foreign currency in exchange for Kwacha. The factors affecting supply are as follow: a) Zambian residents wishing to buy imports will require foreign currency, so they need the
Kwacha to acquire foreign currency. b) Zambian residents investing abroad will sell the Kwacha and buy foreign currency. c) If speculators think that the Kwacha is about to depreciate they sell it. d) The central bank may sell the Kwacha to manipulate its value. 3.4 FIXED EXCHANGE RATES This is where the government keeps the exchange rate at a fixed level, but if it cannot control inflation, the real value of the currency will not remain fixed.

190
3.4.1 ADVANTAGES OF FIXED EXCHANGE RATES a) They make international trade more stable because of the certainty to traders. b) They make it possible for importers and exporters to predict profits. c) They make investors more confident about investing in other countries. d) Importers and exports can agree prices for future delivery without having to worry about
potential losses through exchange rate movements. 3.4.2 DISADVANTAGES a) They require substantial official reserves. The Central Bank requires a large pool of foreign
currency to enable a prolonged period of intervention to support the exchange rate. b) They complicate Economic co-operation among countries with different Economic objectives
and policies c) Fixed exchange rates can lead to capital flight or outflows of capital if interest rates are
attractive in other countries. 3.5 FLOATING EXCHANGE RATES Floating exchange rates are exchange rates that are determined by the market forces of supply and demand. Under the Floating exchange rate system, the government does not intervene in the foreign exchange market. A system under which exchange rates are not fixed by government policy but are allowed to float up or down in accordance with supply and demand. 3.5.1 ADVANTAGES a) The nation’s exchange rate will adjust automatically in the foreign exchange market to correct
any balance of payments deficits or surplus. b) The central bank does not need to large reserves maintain a certain exchange rate. c) Monetary policy will be more effective. d) There is no need to work out the new exchange rate because market forces of supply and
demand will determine it. 3.5.2 DISADVANTAGES a) Floating exchange rates lead to uncertainty in international trade and this may hinder trade
with other countries.

191
b) Floating exchange rates encourages speculation, which in turn leads to increased volatility of the exchange rates.
c) Fiscal policy will be less effective. 3.6 Note the following in relation to exchange rates: In markets where exchange rates float, an increase in the external value of a currency is referred to as an appreciation and a decrease in the external value is referred to as a depreciation of the currency. In markets where exchange rates are fixed, when authorities raise the external value of the currency to a higher fixed parity, this is referred to as a revaluation and a change to a lower parity is referred to as a devaluation of the currency. 3.7 MANAGED FLEXIBILITY OR DIRTY FLOATING EXCHAN GE RATES The system that exists in practice is a compromise between fixed and floating rates. The market forces now play a more important role in the determination of exchange rates, but the authorities often intervene to neutralise short run pressure on exchange rates, to ensure that it remains fixed within a certain zone of flexibility. This system is known as a managed float. A central bank, on behalf of the government, buys and sells currency to stabilize the exchange rate. When one reads in the newspapers that the Bank of Zambia has offloaded foreign currency (from its reserves) to buy the Kwacha on the foreign exchange market, the bank wants to artificially stimulate demand, and make the Kwacha appreciate in value, and vice versa. However, because authorities do not always make it clear that they are using the reserves to support a currency’s external value, and maintain an exchange rate target, which is usually unofficial, the term dirty float is used. 4.0 CHAPTER SUMMARY The balance of payments is an account showing the financial transactions of one nation with the rest of the world, it records flows of funds between residents of a country and overseas residents, normally for a period of one year. The balance of payments consists of two parts, the current account and the transactions in external assets and liabilities, known as the capital account. The current account is made up of the visible and the invisibles account, while the capital account shows the inflows and the outflows of foreign currency. The overall balance shows how the difference between current and capital accounts is financed. In theory, the balance of payments always balances because of the double entry system used in recording transactions. However, in practice, there is need to include a balancing item, which is created by errors and omissions in measuring the figures.
192
A balance of payments deficit indicates that what was paid out is greater than what was received. The deficit can be adjusted by devaluation and deflationary measures as well as direct controls. A balance of payments surplus can be adjusted by revaluation, and other measures to encourage imports. Exchange rates are a ‘price’ of one unit of a currency expressed in terms of another currency. There are two basic exchange rate systems, the flexible or the floating and the fixed exchange rate systems, in practice, most exchange rates fall in between these two extremes. A ‘dirty’ or managed exchange rate is when the central bank intervenes in order to stabilize the exchange rate. The market forces of supply and demand for a currency determine the floating exchange rate, and the central authorities determine the fixed exchange rate system. Both systems have advantages and disadvantages. When there is a high demand for a currency due to an increase in exports or other factors, the currency appreciates in value and vice versa.
REVIEW QUESTIONS 1. What does the capital account show? 2. Name one invisible earning 3. What do you understand by the current account of a country’s balance of payments? 4. What can cause a country’s balance of payments on the current account to be in deficit? 5. How can deflation help a balance of payments deficit? 6. What does the ‘j’ curve show? 7. How can a fall in the exchange rate help an economy? 8. What is the difference between devaluation and depreciation of the exchange rate? 9. What is the main determinant of the value of floating exchange rates? 10. Explain the term ‘managed’ floating system of exchange rate determination. 11. What is the advantage of freely floating exchange rates? 12. Give two advantages of a fixed exchange rate system.
--------------------------------------------------------------------------------------------

193
EXAMINATION TYPE QUESTION 15.1 a) What is a Balance of Payments Account? Describe its composition. (8 marks) b) Explain:
i) Two ways of “financing” a balance of payments deficit and ii) Two ways of “correcting” a balance of payments deficit. (8 Marks)
c) The Zambian Kwacha rate of exchange to the United States Dollar was K8 to $1 in 1988, fourteen years later in mid November 2002, it was over K5, 000 to $1. Discuss two arguments in favour of a return to a system of fixed exchange rates.
(4marks) (Total: 20 Marks) QUESTION 15.2 a) What policies can a government pursue to remove a large balance of payment deficit? (12 marks) b) The following data refers to a hypothetical balance of payment values of a country K’m
Exports 65 500 Interest, profits and dividends (net) 1 080 Services (net) 2 400 Imports 63 200 Current transfers -1 810 Increase in external assets 30 830 Increase in external liabilities 28 570 Balancing item 1 710
You are required to calculate the balance of payments account, showing clearly - The visible trade balance - The invisible trade balance - The current account balance - The capital account balance – the movement in external assets and liabilities
(8 marks) TOTAL: 20 MARKS

194
APPENDIX 1 SOLUTIONS TO REVIEW QUESTIONSSOLUTIONS TO REVIEW QUESTIONSSOLUTIONS TO REVIEW QUESTIONSSOLUTIONS TO REVIEW QUESTIONS
CHAPTER ONE 1. The basic economic problem facing all economies is the scarcity of resources 2. Positive economics is objective economic descriptions while normative economics is
economic value judgments and opinions of what ought to happen in an ideal world. 3. The main production decisions are what, where, how and for whom to produce 4. Land, labour, capital and enterprise. 5. Opportunity cost is the sacrifice of the next best alternative 6. A production possibilities curve shows the maximum of all possible combinations of two
types of products that can be produced with existing resources. 7. The central government authorities make most of the decisions on behalf of society. 8. An externality is a consequence of an economic transaction that affects people not party to the
transaction. 9. It is measured as the ‘real’ increase in output, the actual value of goods and services produced
in a country in any given year. 10. Unbalanced economic growth is where some sectors or areas grow faster than others. CHAPTER TWO
1. It is downward sloping from left to right 2. A shift in demand occurs when the conditions of demand change (a change in demand), while
an extension or expansion in demand is due to price changes (a change in the quantity demanded)
3. Economically, it is not, because the price would go up if there were a very high demand for some products, relative to the supply
4. A consumer surplus arises when consumers of a good or service gain because the market price is less than what they were prepared to pay
5. Costs of production, government policy (i.e. taxation and subsidy), weather conditions (especially for agricultural products), technological changes, efficient use of existing resources
6. Substitutes are goods that are alternatives to each other, competing on the market like butter and margarine, celtel and zamtel, mosi and castle beer. Complementary goods are those goods which are jointly demanded, they have to be bought together, such as cars and fuel, cassettes and recorders, cell phone and sim card
7. A normal supply curve slopes upward from left to right. 8. When held above the equilibrium price, demand is less than supply, hence there is a surplus or
excess supply 9. i) Adverse weather is one of the factors that influence supply. Maize production can be influenced by either too much or too little rainfall (floods or droughts). The supply curve would shift to the left, and this would result in an increase in price, while the quantity of maize traded on the market would reduce, as shown below.

195
Price D S1 S P1 P O Q1 Q Quantity ii) Income changes greatly influence demand. When consumers have a lot of money to spend,
the demand of goods and services generally would increase. Therefore the demand curve would shift to the right. This upward shift in demand would cause the price and output of oranges to increase as shown below.
D1 Price D S P1 P O Q1 Q Quantity CHAPTER 3 1. Price elasticity of demand measures the responsiveness of demand to changes in price. 2. 20% ÷ 10% = 2, demand is elastic 3. Degree of necessity, habit forming, income, possibility of substitution, time period 4. A good for which demand falls as household income increases 5. Elastic 6. A normal or superior good such as a Mercedes Benz car. 7. Complementary goods or those goods, which are jointly demanded like cars and petrol 8. All the exceptional demand curves like ostentatious goods, Giffen goods and most
commodities during inflationary times when consumers expect further increases in prices.

196
9. Price S Quantity 10. Price D S1 P1 S P 0 Q Quantity
100% of the burden of the tax is borne by the consumer as price rises from P to P1 CHAPTER 4 1. The long run is the time period when all resources are considered to be variable, while the
short run is the time period when at least one factor of production is in fixed supply. 2. Fixed costs are those, which do not vary, in direct proportion as changes in output. Variable
costs change in direct relation to output. 3. In the long run all costs are considered to be variable, therefore all the costs must be covered
in the long run. 4. Marginal cost is the change in the total cost caused by producing one more unit of output. 5. The firms’ demand for factors of production is derived from households’ demand for the
Goods and services the firms produce. 6. Output (units) 100 101 102 103
a) Total costs 800 806 809 810 b) Average costs 8 7.98 7.93 7.86 c) Marginal costs - 6 3 1
7. Output (units) 20 30 40 50 60 70
i) Average costs 13.5 11 10 10 10.5 12 ii) Marginal costs - 6 7 10 13 21

197
Costs 25 20 MC 15 AC 10 5 0 10 20 30 40 50 60 70 Output 8. The primary sector of the economy is concerned with the production of raw materials such
as crops and minerals. The secondary sector manufactures these raw materials into finished producer and consumer goods. The tertiary sector is the provision of services.
CHAPTER 5 1. Internal economies of scale are achieved within an individual firm, from the organization of production. External economies are advantages to most firms in that industry because the firms are ‘concentrated’ together. 2. The four categories of internal economies of scale
• Financial, it is generally accepted that larger firms can raise funds more easily and cheaply than small firms
• Trading economies, reducing the cost of material purchases through bulk purchase discounts. Stockholding becomes more efficient, the most Economic quantities of inventory to hold increase with the scale of operations.
• Organisational economies, when the firm is large, generalization of functions such as administration, research and development and marketing may reduce the burden of overheads on individual operating locations.
• Managerial economies, management costs remain constant, as they are not related to output. In addition, large firms can afford to hire specialist managers to be in charge of different departments or fields.
3. Diseconomies of scale are problems of size and tend to arise when the firm grows so large it cannot be managed efficiently. Communication, coordination and control become difficult. There is low morale in the workplace, and managers find it difficult to identify the information they need because of large volumes available. Decisions are not made quickly. 4. External economies of scale are advantages, which accrue to most firms in an industry, as it grows in size. Not to an individual firm. For example, large skilled labour force is created, and educational services can be targeted at that industry. In addition, specialized and ancillary
198
industries develop in the area. 5. This is the level of output on the long run average total cost curve at which average costs first reach their minimum point. The increasing returns to scale are not achieved indefinitely as output rises, there will be increasing returns up to a certain minimum efficient scale, this tends to vary from industry to industry. 6. Vertical integration occurs to eliminate the transaction costs of middlemen, increase entry barriers, secure supplies of raw materials, improve distribution network, gain economies of scale and make better use of existing technology. 7. Small firms benefit an economy because they provide employment and new ideas, new products on the market, operate efficiently, provide employment etc. 8. At the level of output at which marginal cost is equal to marginal revenue 9. The long run average cost curve eventually rises because of diseconomies of scale. CHAPTER 6 1. A market is where goods and services are bought and sold 2. A perfect market assumes a homogeneous product (a completely identical product), many
buyers and many sellers, who all have perfect information and there are no entry barriers. 3. The long run equilibrium of a firm under perfect competition is where marginal cost is equal
to marginal revenue, just like any other firms. However, it is attained at the output level where the costs of production are at their minimum level, and the supply is equal to demand, which means technical and Economic efficiency respectively. In short, it is at a point where AC = AR = MC = MR = P = D.
4. Allocative efficiency refers to the best use of Economic resources, through the market forces of supply and demand. It occurs at an output level where prices charged (demand), equal the marginal cost of production (which is the supply curve) In theory, it occurs only in perfect competition in the long run.
5. Reasons for the existence of monopolies: - Existence of natural monopolies - Existence of patents, copyrights etc. - Government legislation - Ownership of essential raw materials, or other inputs
6. Demand for the product. 7. Justification of monopolies are several, such as, to achieve economies of scale and thereby
lower the prices, they are necessary in an industry which faces strong competition, some monopolies are natural, monopolies can afford to spend more on research and development since they earn supernormal profits, monopolies find it easier to raise new capital etc.
8. Price discrimination is a practice whereby producer charges different prices to different customers for the same product or service.
9. The conditions necessary to practice price discrimination are:- - Being able to separate the markets. - Having different elasticities of demand in the separate markets. - Imperfections in the market, it cannot be practiced in a perfect market.
10. The aim of price discrimination is to maximize profits.

199
11. (a) (b) OUTPUT TR AR MR (PRICE) 50 500 10 10 60 600 10 10 70 700 10 10 80 800 10 10 90 900 10 10 100 1000 10 10 110 1100 10 10 120 1200 10 10 c) Average revenue 10 AR =MR =P = D
0 120 Quantity d) It is perfect competition 12. (a) (b)
OUTPUT TR AR MR (PRICE)
50 750 15 -
60 840 14 9
70 910 13 7
80 960 12 5
90 990 11 3
100 1000 10 1

200
c) Average revenue 15
10 AR = D= P 0 100 Quantity
d) It is a monopoly structure 13. The AR = P = D, when drawn under perfect competition, it has a horizontal demand curve signifying that demand is perfectly elastic. The monopolist is faced with downward sloping normal demand curve.
The equilibrium position for a firm under perfect competition is where costs are at their lowest level, but not for a monopolist, unless the price is lowered.
The monopolist produces where output is low but prices are high, this means a welfare loss to customers.
Monopoly advertising not persuasive or wasteful but it is informative. The super normal profits earned are sometimes used for the development of new goods, as such society gains.
Monopolies are also beneficial in that organising for production in the most effective way can be done easily for public utilities especially where there is strong international competition. Monopolies enjoying economies of scale sell their products at a lower price than that charged under perfect competition and there is greater technical efficiency because of economies of scale.
In practice, monopolists have less incentive to be innovative. Supernormal profits are earned both in the short run and in the long run as long as the firm is able to create barriers to entry and undermine competition. Oligopolies are complacent (“X” inefficiency). Occasionally, the firm sells at how prices to fend off competition, knowing there are supernormal profits elsewhere.
CHAPTER 7 1. Products can be differentiated through extensive advertising, attractive packaging, use of
brand names, and good after sales service etc. 2. Product differentiation is important because it determines the survival of the firm, it creates
customer loyalty for the firm to have some market power. 3. A cartel is an agreement on output and or pricing policies of each member 4. Firms operating under this market are interdependent. 5. If a cartel is not formed, the pricing and output decisions of one firm will still affect the price
and output of the rival firms

201
6. Non-price competition occurs when firms attempt to increase their sales by other means other than changing prices. Sales can be increased through sales promotion or through other forms of product differentiation.
7. The kinked demand curve reemphasizes the stability of prices in oligopoly markets even when cartels are not formed. If an individual firm in an oligopoly market decides to reduce the price in order to increase the market share, rival firms would follow suit, while an increase in price is likely to lead to a reduction in the market share, as the competitors would not increase their prices.
8. The kinked demand curve Price D Kink D = AR = P
Quantity CHAPTER 8 1. The value added method is based on measuring the total goods and services produced by
different sectors of the economy. The income method totals the individual factor incomes. Wages and salaries, from both formal employment and self-employment, rent, interest, and profit. The expenditure method is based on measuring total expenditure on goods and services, that is, expenditure by households, firms and government, including exports minus imports.
2. GDP is the total market value of all final goods and services produced within a country.
While, GNP is GDP plus/minus net property income from abroad, which are goods and services produced by citizens of a particular country. Net property income is the difference between income earned by Zambian residents on overseas assets and income earned by foreign residents on Zambian assets.
3. The nominal GDP is the current market value of all goods and services, while the real GDP
takes into account price changes. Therefore, real GDP is equal to nominal GDP minus inflation rate.
4. These are payments made to a factor of production e.g. labour earning an income when an
individual has not been productive in a particular year, examples student grants, unemployment benefit, pension etc.
202
5. Transfer payments come from taxes paid out of the incomes of productive people or being paid to someone who was productive in the past or who will be productive in the future. Including it in the national income figure for a given year other than when labour was productive, would amount to double counting.
6. Net national income at factor cost + capital consumption + indirect taxes on expenditure –
subsidies equals is equal to gross national product at market prices 7. Government expenditure 40 000 Consumers’ expenditure 97 000 Capital formation 38 000 Value of physical increase in stocks 5 000 Total domestic expenditure at market prices 180 000 + Exports 25 000 - Imports (53 000) Gross Domestic Product at market prices 152 000 - Indirect taxes (30 000) + Subsidies 2 000 Gross Domestic Product at factor cost 124 000 + Net property income from abroad 2 000
Gross National Product at factor cost 126 000 8. The figures are “gross” because capital consumption or depreciation, which is the wearing out
of assets, has not been deducted. CHAPTER 9 1. This means that consumption is autonomous (a) it is independent of the level of income. In
addition, a proportion of consumption is dependent on income, as income changes, consumption also changes (bY).
2. An economy is in equilibrium when injections are equal to withdrawals 3. However, in practice, the same people do not make the injections into and the withdrawals
from the circular flow of income. 4. Injections into the circular flow are investment, exports and government expenditure 5. Aggregate demand is made up of C + G + I + (X-M). C, which is consumption expenditure, is
an endogenous part of the circular flow of income. 6. The accelerator theory shows that changes in consumption expenditure may induce much
larger proportional changes in investment expenditure 7. The multiplier shows that the increase in expenditure, the injections into the circular flow, will
produce a much larger increase in total income through successive rounds of spending. The formula for a simple economy is K = 1/(1 –MPC) or 1/MPS. For the open economy it is K = 1/Marginal rate of leakages, that is savings + imports + taxation.

203
8. A trade cycle is a sequence of varying rates of growth. The correct sequence is recession, depression, recovery and boom.
9. Income is either consumed or saved, an increase in savings means that money is withdrawn from the circular flow of income, national income reduces as investment is discouraged.
10. A deflationary gap occurs when aggregate demand is insufficient to buy all the goods and services in the economy, when AD is less than the full employment level.
CHAPTER 10 1. Money is a medium of exchange, it is defined as anything that is generally acceptable as a means of payment. 2 The characteristics of money can be remembered using the acronym ADDSUP. where A = generally Acceptable D = Durable D = Divisible S = Scarcity U = Uniformity P = Portability, meaning, easy to carry around. 3 Functions of money can be described as follows:
- Unit of account and measure of value - Medium of exchange - Store of value - Standard of deferred payments
4. Narrow money is currency in circulation plus demand deposits, it is money that is available to finance current spending, while broad money includes narrow money plus balances held as savings, liquid assets used as a liquid store of value. 5. Broad measures of money include notes, coins and bank deposits, both current and fixed deposits as savings. 6. Keynes argued that the demand for money is the desire to hold liquid money, and people want to hold money for three basic motives
- Transactions - Precautions - Speculative
7 . There is, an inverse or negative relationship between bond prices and interest rates, therefore if interest rates rise, bond prices will fall. 8 The real rate of interest is defined as the nominal interest rate adjusted for inflation. 9 High interest rates attract an inflow of foreign funds and investments, and therefore cause a currency to appreciate.

204
10 Liquidity preference is the demand curve for money, as shown below. Interest rate LP = D Quantity of money CHAPTER 11
1. Financial intermediaries - Facilitate payments - Provide a means of transferring and distributing risk - Raise the level of savings and investment - Provide maturity transformation - Act as mediums for implementing monetary policies
2. Financial disintermediation is when firms lend to and borrow from each other directly without using a financial intermediary, and/or when individuals lend to and borrow from each other directly without using a financial intermediary.
3. The amount of cash kept by commercial banks in readiness to pay withdrawals. 4. The most profitable assets to banks are loans. 5. Capital adequacy rules attempt to ensure that banks have sufficient capital to cover
potential bad debts on risk assets. 6. OMOS are purchases and sales by the Bank of Zambia of treasury bills in the money
market, as a way of influencing the money supply and the interest rates. 7. The problems with monetary policy are informational, supervisory, the effect on a bank’s
independence, and the conflicting objectives of either reducing or increasing the money supply.
8. Capital markets provide long term-finance for companies 9. A primary market is a market for the new issue of securities, while a secondary market is
where securities which are already issued, are traded. 10. Money markets provide short-term finance for companies, also a profitable way of lending
or investing surplus funds. 11. Instruments traded on the money market are treasury bills, certificate of deposits,
commercial paper, including IOUs, bills of exchange.

205
CHAPTER 12 1. The quantity theory of money claims that there is a stable link between the stock of money
in the economy and the level of prices, if the money stock increases, the price level will also increase.
2. Inflation is defined as a persistent increase in the general price level, and it is measured using the retail price index (RPI), consumer price index (CPI).
3. Demand-pull and cost push inflation. 4. The principal cause is aggregate demand exceeding the supply of goods and services. This
could result from injections into the circular flow of income when the economy is at or near the full employment level.
5. The Economic consequences of inflation are as follows:- - It affects planning both at central government and at corporate business level. - It also undermines business confidence. - Inflation reduces a country’s international competitiveness and causes the currency to
depreciate given a low demand for exports. - Inflation discourages savings, and ultimately, investment. - It also distorts consumer behaviour, consumers purchase a lot of goods in the hope of
‘beating’ inflation. - Inflation has a big impact on people who are on fixed incomes, their purchasing power
and standard of living falls. - Inflation results in money being unable to perform its functions properly.
6. The main types of unemployment are: structural, frictional, demand-deficient (cyclical) and seasonal unemployment
7. The Economic consequences of unemployment are classified as Economic, financial social
or political costs:
- Labour is a factor of production, and due to unemployment, the Economic resource is not being utilized, this is at a cost, the opportunity cost of goods and services not produced, quality of workforce diminishes as idleness causes labour to be less efficient, this in turn increases the cost of retraining it. - Government revenue is mostly from taxes, unemployment results in a loss of government revenue, as the unemployed do not pay any tax, in some rich countries they receive state benefits, which means that unemployment is a financial cost to the government. - Unemployment may lead to social undesirable behaviour like theft, vandalism, riots or general discontent. The mental and physical health of the unemployed tends to deteriorate, the unemployed are more prone to commit suicide. This is considered to be a social cost. - Whenever there are high levels of unemployment in the country, the political party that forms the government, is likely to lose popularity, this is a political cost to the government.
8. Keynesians believe unemployment is the result of demand deficiency, therefore the
government should increase aggregate demand (Keynesian demand management). 9. The Phillips curve shows the relationship between the level of unemployment and the rate
of inflation.
206
10. Monetarists prefer to concentrate on the ‘supply side’, which affect production, supply and therefore reduce prices, rather than Keynesian policies of boosting the economy through demand management, which tend to be inflationary.
CHAPTER 13
1. Fiscal policy is concerned with taxation, borrowing and spending, and their effects upon the 2. economy. Monetary policy is the government’s decisions and actions regarding money supply,
interest rates, inflation and exchange rates. 3. The objectives of fiscal policy can be either a deflationary gap, that is, to operate a budget
deficit (reduce taxes and increase government expenditure) in order to reduce the high levels of unemployment. Alternatively, a government can aim for an inflationary gap, that is, operate a budget surplus (increase taxes and reduce government expenditure) in order to check inflation.
4. Direct taxes are levied on income, and they are progressive, while indirect taxes are levied on expenditure, and they are regressive.
a) A regressive tax takes a higher proportion of a poor person’s income than the rich. b) A progressive tax takes a higher proportion of a rich person’s income, and a lower
proportion of a poor person’s income. c) A proportional tax takes the same proportion of all incomes
5. The four canons or the principles of a good tax are:
- Equity, which means that taxes should be fair and therefore should depend on an individual’s ability to pay. Taxes must be proportional to one’s income.
- Certainty, with regard to the amount to be paid, how, where and when it should be paid. - Convenience of payment and collection by the taxpayer. - Economy, that is, the cost of collection should not be excessive especially in relation to
yield. 6. It would be a regressive tax as it would take a higher proportion of a poor person’s income than the rich 7. The term PSNCR has been recently introduced as the measure of the level of government borrowing. It replaces the public sector borrowing requirement (PSBR). PSNCR is the difference between the income of the public sector and its expenditure . 8. Fiscal stance describes the balance of government expenditure and revenue, and whether this is likely to raise or reduce aggregate demand in the economy. 9. Arguments for privatisation a) Reduced burden on the public purse as the government no longer supports loss-making nationalized companies. Privatisation allows a reduction in the public sector borrowing requirement and tax cutting, as it provides funds for the treasury when companies are sold. b) There is greater Economic freedom from detailed Economic control as privatized companies are not subject to state control.

207
c) Improved efficiency through competition in the market, this encourages producers to cut their costs in order to be more competitive, and firms have to be innovative in the search for profits. d) In addition to the above, there is also improved quality since firms have to compete to survive and have to be responsive to customer complaints. e) If companies are not in state control, there is greater resistance to the power of trade unions, industries are more fragmented and difficult to organise. f) Privatisation leads to a creation of a property-owning class, more people are able to buy shares, this gives buyers market power, they work harder and strike less, a better understanding of private profit motive and business problems. g) Costs and inefficiency decrease as bureaucracy from nationalized companies is reduced.
CHAPTER 14
1. International trade is theoretically based on the principle of comparative advantage 2. The law of comparative advantage states that countries should produce those goods in whose
production they are relatively most efficient. 3. Zambia is most efficient in the production of copper, and the following are the country’s non-
traditional exports. TABLE 18: TEN MAJOR NON-TRADITIONAL EXPORTS (C.I.F. ) 2003–2005, US $’ MILLION
2003
2004
2005
2005 % Change
Copper wire 29.2 60.1 102.7 70.9 White Spoon Sugar 30.6 33.4 68.0 103.6
Burley Tobacco 19.0 39.4 69.9 77.4 Cotton Lint 28.6 51.4 66.8 30.0
Electrical Cables 16.2 32.7 46.2 41.3 Fresh Flowers 22.4 25.5 31.0 21.6
Cotton Yarn 22.1 23.9 23.4 -2.1 Fresh
Fruit/Vegetables 26.9 23.2 21.0 -9.5
Gemstones 23.4 16.2 19.8 22.2 Gas oil 16.6 24.3 10.3 -57.6
Electricity 8.4 4.4 4.8 9.1
Source: Bank of Zambia

208
4. Terms of trade refer to the average price of a country’s exports compared to the average price of imports
5. Governments protect infant industries, employment, prevent unfair competition, help the balance of payments etc.
6. The WTO attempts to reduce the tariff barriers and other protective measures. 7. A multinational company is a company, which has a physical presence or property in more
than one country 8. To reduce costs and expand markets and sales 9. Direct foreign investment can boost domestic capital fund, technological transfer,
Improvement in production processes and organizational structure, as well as employment gains.
10. Tariffs are duties imposed on imported goods. They impede free trade by increasing the prices of imported goods, thereby making them unattractive on the local market. While import quotas are the maximum limit on the quantity or total value of specific imported goods, once the quotas are met, the imports are completely cut off, and therefore, quotas can be more effective than tariffs as a barrier to trade.
11. A free trade area exists if there is no restriction on trade between countries. This can be extended to a customs union when common external tariffs are levied on imports from non-member countries. A common market adds free movement of the factors of production, especially labour, in addition, their maybe harmonization of Economic policy in a common market.
12. Formula:
Terms of trade = Export price index ÷ Import price index X 100 In 2005 106 ÷ 112 X 100 = 94.64 In 2006 114 ÷ 116 X 100 = 98.28 There is an improvement in the terms of trade from 2005 to 2006.
CHAPTER 15 1. The capital account shows changes in Zambia’s external assets and liabilities when
Zambian residents buy or sell capital items such as international trade in shares, foreign investments, issuance of loans abroad etc.
2. Invisibles include factor incomes like profit, dividend, interest and maintenance of embassies abroad etc
3. A current account is a record of income and expenses, much like a profit and loss account. A current account is divided into two parts, trade in goods (visibles), and trade in services (invisibles).
4. A deficit is caused mostly by a lack of competitiveness on the international market for a country’s exports, which results in more outflows from the current account than the inflows.
5. Deflation can help the balance of payments by suppressing domestic demand for imports and by releasing goods for export. If home sales are stagnant, that is not competitive on the international market, deflation causes the price to reduce due to the reduction in the aggregate demand.
209
6. The ‘j’ curve shows the likely effect of depreciation/devaluation on the current account. 7. A fall in the exchange rate could help an economy by reducing the price of exports (and
increasing the price of imports), and thereby increasing sales of exports, which might lead to more employment, more output and greater export earnings, that is, if demand is elastic.
8. Devaluation occurs when a fixed exchange rate is lowered, whereas depreciation refers to a floating exchange rate, which is moving downwards due to a decrease in demand for exports and other factors, or an increase in the supply of imports and other factors.
9. The exchange rate is determined by the demand for a nation’s currency. In theory this demand is by traders, but in practice it is by international financial institutions.
10. ‘Managed’ exchange rates are where small fluctuations are allowed within certain defined limits and governments (central banks) may intervene to smooth out fluctuations.
11. The main advantage of freely floating exchange rate is that they are self-adjusting in theory and therefore, automatically rectify balance of payments disequilibrium. In addition, there is Economic use of foreign currency reserves and the government has more time to concentrate on domestic policy.
12. The main advantage of a fixed exchange rate system is elimination of uncertainty, this uncertainty is a major disincentive to exporters. Another advantage is that they discourage speculative activity, hence the currency is not volatile.
------------------------------------------------------------------------------------

210
APPENDIX 2
SOLUTIONS TO EXAMINATION TYPE QUESTIONS
SOLUTION 1.1 (a) i) The central problem in Economics is that of scarcity and choice. Economic resources are scarce relative to people’s wants, so a choice has to be made to satisfy some wants and forgo or sacrifice other wants. Therefore the “opportunity cost”, is the cost of something in terms of alternatives forgone. In practice it is not always a complete rejection of one good in favour of another, but having to decide whether to have a little bit more of one and not quite so much of another. This is illustrated using a production possibility curve or frontier. ii) If a student spends her allowance on a pair of shoes then it is likely that she will have to go without a textbook that she also wanted. In deciding to work overtime on a Saturday afternoon, a worker forgoes leisure time and the football match he would otherwise have watched. A farmer, who sows maize on a piece of land, accepts that he has to go without groundnuts which could also be grown on the same piece of land. With the state, resource is required to build roads and hospitals, this means schools, and colleges etc have to be forgone. In all walks of life, having “this” means going without “that”. (b) (i) There is no opportunity cost for a free good, if the food is free, then nothing has to be
sacrificed in order to obtain it. (ii) -Hedge trimmings are non-Economic goods since they are not wanted. –A worn out suitcase is a non-Economic good since it is not wanted –A Natech Certificate is a non-Economic good since it is not transferable. –Sand in the Sahara is a non-Economic good since it is not scarce.

211
SOLUTION 1.2 (a) The law of diminishing marginal returns states that, if extra units of a variable factor are added to a fixed factor, output will rise. However, after a point, the rate of rise of output will decline. This is the point of diminishing marginal returns.
Number of workers Output per year Addition to Output
1 100 100 2 210 110 3 300 90 4 250 -50 The figures are summarised on the following diagram.
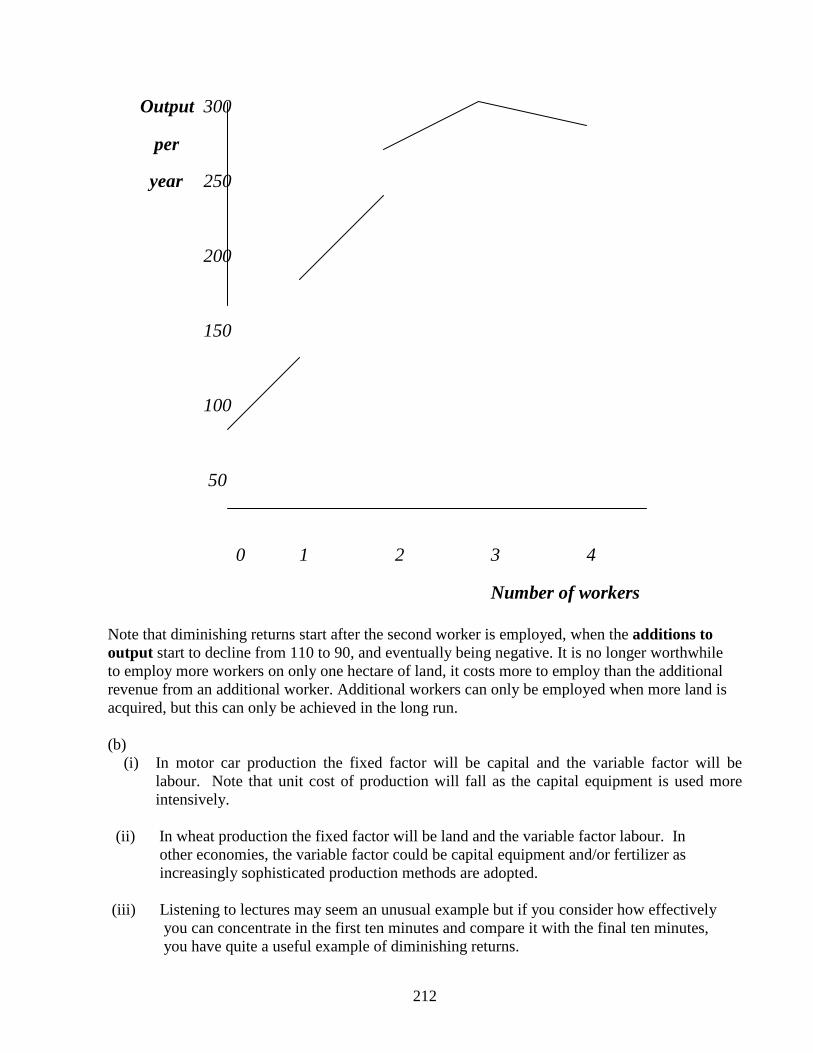
212
Output 300
per
year 250
200
150
100
50
0 1 2 3 4
Number of workers Note that diminishing returns start after the second worker is employed, when the additions to output start to decline from 110 to 90, and eventually being negative. It is no longer worthwhile to employ more workers on only one hectare of land, it costs more to employ than the additional revenue from an additional worker. Additional workers can only be employed when more land is acquired, but this can only be achieved in the long run. (b)
(i) In motor car production the fixed factor will be capital and the variable factor will be labour. Note that unit cost of production will fall as the capital equipment is used more intensively.
(ii) In wheat production the fixed factor will be land and the variable factor labour. In other economies, the variable factor could be capital equipment and/or fertilizer as increasingly sophisticated production methods are adopted. (iii) Listening to lectures may seem an unusual example but if you consider how effectively you can concentrate in the first ten minutes and compare it with the final ten minutes, you have quite a useful example of diminishing returns.
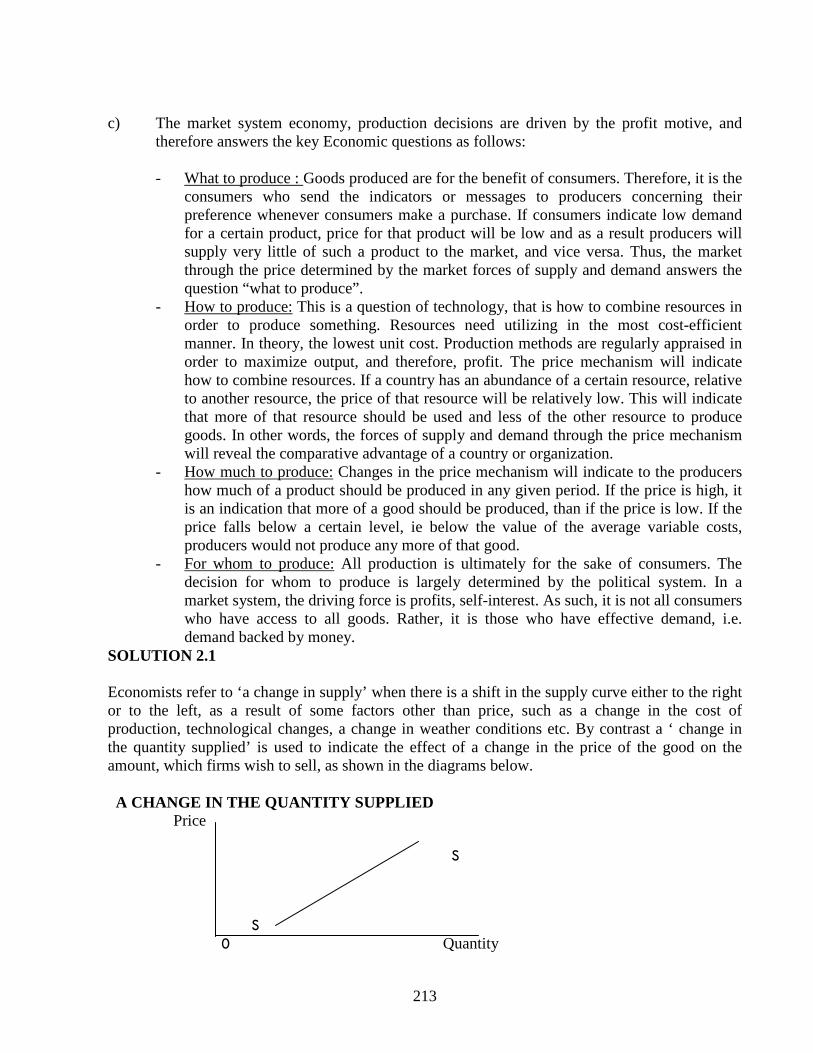
213
c) The market system economy, production decisions are driven by the profit motive, and
therefore answers the key Economic questions as follows:
- What to produce : Goods produced are for the benefit of consumers. Therefore, it is the consumers who send the indicators or messages to producers concerning their preference whenever consumers make a purchase. If consumers indicate low demand for a certain product, price for that product will be low and as a result producers will supply very little of such a product to the market, and vice versa. Thus, the market through the price determined by the market forces of supply and demand answers the question “what to produce”.
- How to produce: This is a question of technology, that is how to combine resources in order to produce something. Resources need utilizing in the most cost-efficient manner. In theory, the lowest unit cost. Production methods are regularly appraised in order to maximize output, and therefore, profit. The price mechanism will indicate how to combine resources. If a country has an abundance of a certain resource, relative to another resource, the price of that resource will be relatively low. This will indicate that more of that resource should be used and less of the other resource to produce goods. In other words, the forces of supply and demand through the price mechanism will reveal the comparative advantage of a country or organization.
- How much to produce: Changes in the price mechanism will indicate to the producers how much of a product should be produced in any given period. If the price is high, it is an indication that more of a good should be produced, than if the price is low. If the price falls below a certain level, ie below the value of the average variable costs, producers would not produce any more of that good.
- For whom to produce: All production is ultimately for the sake of consumers. The decision for whom to produce is largely determined by the political system. In a market system, the driving force is profits, self-interest. As such, it is not all consumers who have access to all goods. Rather, it is those who have effective demand, i.e. demand backed by money.
SOLUTION 2.1 Economists refer to ‘a change in supply’ when there is a shift in the supply curve either to the right or to the left, as a result of some factors other than price, such as a change in the cost of production, technological changes, a change in weather conditions etc. By contrast a ‘ change in the quantity supplied’ is used to indicate the effect of a change in the price of the good on the amount, which firms wish to sell, as shown in the diagrams below. A CHANGE IN THE QUANTITY SUPPLIED Price S S 0 Quantity

214
A CHANGE IN SUPPLY S1
Price S S2 S1 S S2
0 Quantity (b) The Zimbabwean government’s fixing of a maximum or ceiling price for mealie meal is aimed at holding the price below its free market level to the benefit of consumers, instead of allowing the market forces of supply and demand to determine the price of mealie meal. The government stipulated price of OP1 is below the equilibrium price of OP. At this low price, consumers would like to buy more, OQ1 quantities, while producers can only supply OQ2 quantities. The effect is an excess demand or a market shortage, as shown in the diagram below.
Price D S P P1 0 Q2 Q Q1 Quantity
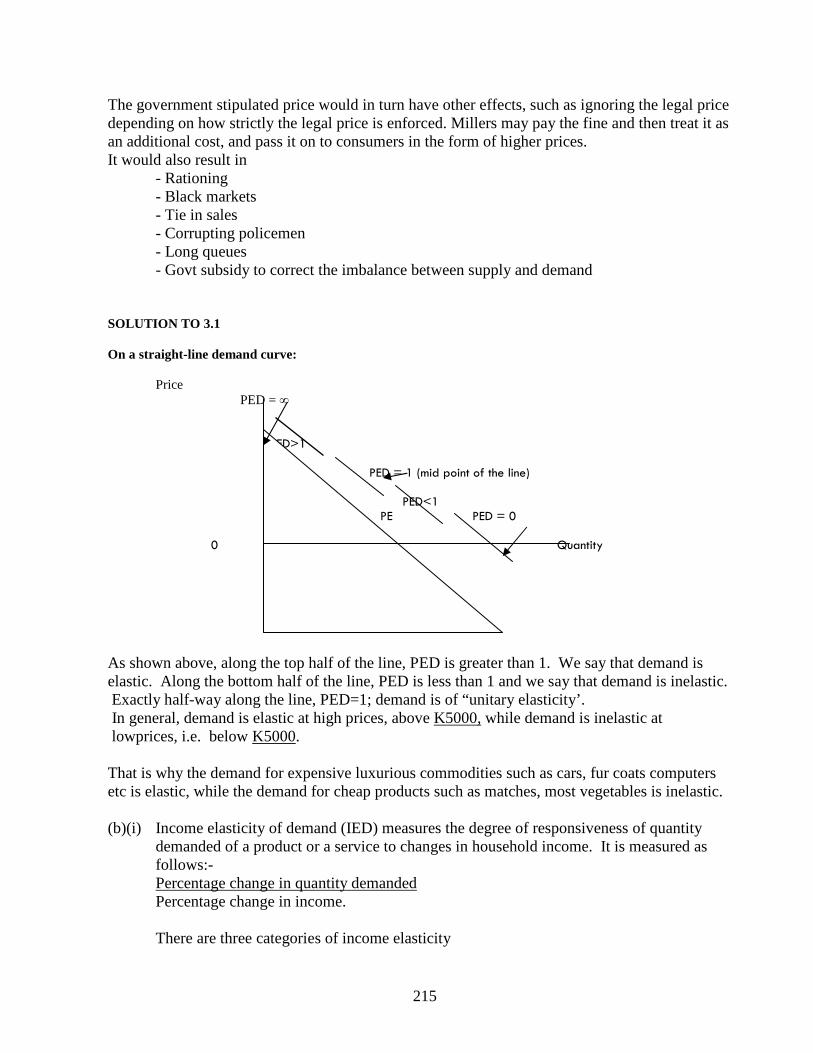
215
The government stipulated price would in turn have other effects, such as ignoring the legal price depending on how strictly the legal price is enforced. Millers may pay the fine and then treat it as an additional cost, and pass it on to consumers in the form of higher prices. It would also result in
- Rationing - Black markets - Tie in sales - Corrupting policemen - Long queues - Govt subsidy to correct the imbalance between supply and demand
SOLUTION TO 3.1 On a straight-line demand curve: Price PED = ∞ PED>1 PED = 1 (mid point of the line) PED<1 PE PED = 0 0 Quantity
As shown above, along the top half of the line, PED is greater than 1. We say that demand is elastic. Along the bottom half of the line, PED is less than 1 and we say that demand is inelastic. Exactly half-way along the line, PED=1; demand is of “unitary elasticity’. In general, demand is elastic at high prices, above K5000, while demand is inelastic at lowprices, i.e. below K5000. That is why the demand for expensive luxurious commodities such as cars, fur coats computers etc is elastic, while the demand for cheap products such as matches, most vegetables is inelastic. (b)(i) Income elasticity of demand (IED) measures the degree of responsiveness of quantity
demanded of a product or a service to changes in household income. It is measured as follows:-
Percentage change in quantity demanded Percentage change in income.
There are three categories of income elasticity
216
- Positive income elasticity, this applies to the demand for normal goods which
increases with income. - Negative income elasticity, this applies to the demand for inferior goods, this tends to
fall as income rises. - Zero income elasticity, for some goods, demand remains constant even if incomes change, e.g. mealie meal.
(ii) IED is largely determined by the type of product or service in question, basics or necessities such as mealie-meal, salt, milk etc usually have a low IED, with quantity demanded increasing marginally as income increases. The demand for “inferior” goods actually reduces as income increases. Expensive luxurious products or services have a high IED, with more being bought as income increases. In view of the above, a firm pursuing long-term growth can produce lower IED during periods of recession of depression and produce more high IED products during “boom” periods.
SOLUTION TO 4.1 (a)(i) Total physical product 6 16 31 43 (ii) Average physical product 6 8 10.33 10.75 (b) The distinction between fixed and variable costs arise only in the short-run period defined
as that in which at least one factor of production is in fixed supply to the firm. Fixed costs are those, which do not change as output changes. Productive capacity is therefore constrained by the fixed factor and the costs associated with it are the firm’s fixed costs. Typically, the fixed factor is the firm’s physical capital or assets – its premises, machinery, plant and equipment. Fixed costs thus tend to consist of rental payments, depreciation, salaries, rates, interest on loans etc.

217
Variable costs are those associated with variable inputs of factors such as labour and materials. Therefore variable costs are wages, purchases of raw materials, electricity and water bills etc. These costs will increase as the firm expands its output and they can be avoided completely, even in the short-run, by closing down.
(c) The diagram is a generalised illustration of a firm’s short-run costs. MC AC AVC
AFC
SOLUTION 5.1 i) (a) (b) (b) (c) (d) (e) (f) Output Total cost Price TR MR AR FC MC AC Profit 0 40 9 0 - - 40 - - -40 10 70 8 80 80 8 40 30 7 10 20 100 7 140 60 7 40 30 5 40 30 140 6 180 40 6 40 40 4.7 40 40 180 5 200 20 5 40 40 4.5 20 50 200 4 200 0 4 40 20 4 0 ii) The firm is operating in an imperfect market like monopoly or monopolistic competition,
the average revenue curve, which is equal to the demand curve, is downward sloping, AR ≠ MR.
iii) The firm will aim to produce 30 units of output, where MC = MR. iv) AR is equal to price, since TR = Quantity x Price AR = TR/Quantity, therefore, AR = Price.

218
MC
AC
Q
0 QUANTITY
SOLUTION 6.1 a) Features of perfectly competitive markets.
� There are many buyers and sellers of the commodity each of which is too small in the relation to the market to have perceptible effect on the price of the commodity.
� The commodity is homogeneous, identical or perfectly standardized so that the output of each procedure is distinguishable from others.
� Resources are perfectly mobile. � Consumers, firm and resources owners have perfect knowledge of all relevant prices
and costs in the market. � There is free entry and exit. � There is not transport cost.
b) Long run equilibrium under a perfectly competitive market REVENUE AND COSTS If firms earn abnormal profits in the short run, in the long run, new firms will be attracted into the industry. Conversely, if the typical firm is making losses in the short run, firms will leave the industry in the long run, until normal profits are restored. Therefore all firms are earning sufficient revenue to cover their full opportunity cost. There exits no incentive for firms to enter or to leave the industry. The firm produces output 0Q, where MC = MR = AR = P = AC and there exits no excess capacity. Long run equilibrium position under monopoly. Price Cost Revenue MC AC
C D(AR) MR
0 Q1 Quantity
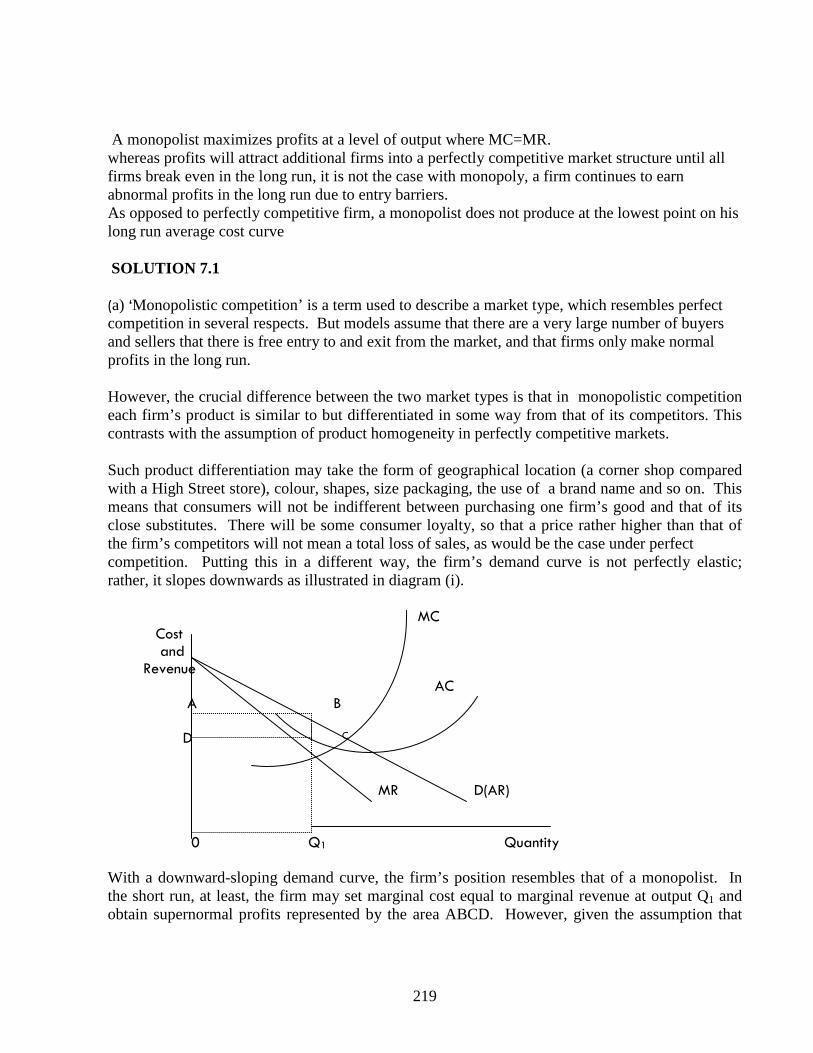
219
A monopolist maximizes profits at a level of output where MC=MR. whereas profits will attract additional firms into a perfectly competitive market structure until all firms break even in the long run, it is not the case with monopoly, a firm continues to earn abnormal profits in the long run due to entry barriers. As opposed to perfectly competitive firm, a monopolist does not produce at the lowest point on his long run average cost curve SOLUTION 7.1 (a) ‘Monopolistic competition’ is a term used to describe a market type, which resembles perfect competition in several respects. But models assume that there are a very large number of buyers and sellers that there is free entry to and exit from the market, and that firms only make normal profits in the long run. However, the crucial difference between the two market types is that in monopolistic competition each firm’s product is similar to but differentiated in some way from that of its competitors. This contrasts with the assumption of product homogeneity in perfectly competitive markets. Such product differentiation may take the form of geographical location (a corner shop compared with a High Street store), colour, shapes, size packaging, the use of a brand name and so on. This means that consumers will not be indifferent between purchasing one firm’s good and that of its close substitutes. There will be some consumer loyalty, so that a price rather higher than that of the firm’s competitors will not mean a total loss of sales, as would be the case under perfect competition. Putting this in a different way, the firm’s demand curve is not perfectly elastic; rather, it slopes downwards as illustrated in diagram (i). MC Cost and Revenue AC A B D C MR D(AR) 0 Q1 Quantity With a downward-sloping demand curve, the firm’s position resembles that of a monopolist. In the short run, at least, the firm may set marginal cost equal to marginal revenue at output Q1 and obtain supernormal profits represented by the area ABCD. However, given the assumption that
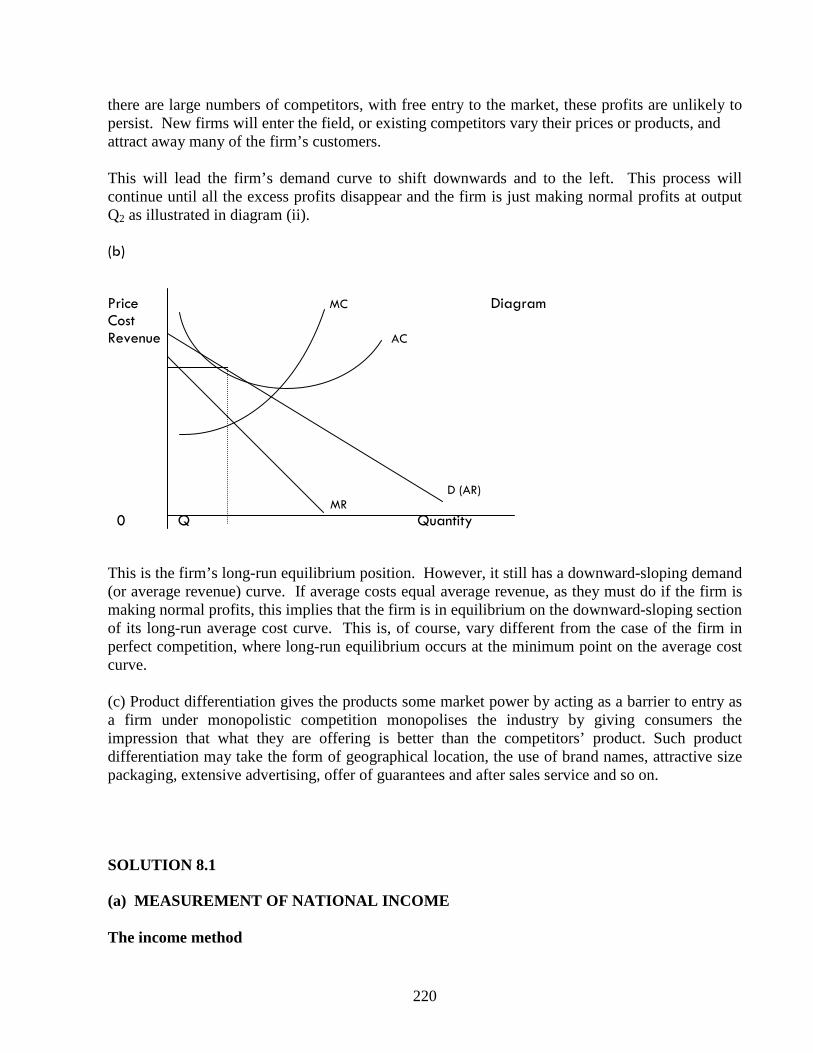
220
there are large numbers of competitors, with free entry to the market, these profits are unlikely to persist. New firms will enter the field, or existing competitors vary their prices or products, and attract away many of the firm’s customers. This will lead the firm’s demand curve to shift downwards and to the left. This process will continue until all the excess profits disappear and the firm is just making normal profits at output Q2 as illustrated in diagram (ii). (b) Price MC Diagram Cost Revenue AC
D (AR) MR 0 Q Quantity This is the firm’s long-run equilibrium position. However, it still has a downward-sloping demand (or average revenue) curve. If average costs equal average revenue, as they must do if the firm is making normal profits, this implies that the firm is in equilibrium on the downward-sloping section of its long-run average cost curve. This is, of course, vary different from the case of the firm in perfect competition, where long-run equilibrium occurs at the minimum point on the average cost curve. (c) Product differentiation gives the products some market power by acting as a barrier to entry as a firm under monopolistic competition monopolises the industry by giving consumers the impression that what they are offering is better than the competitors’ product. Such product differentiation may take the form of geographical location, the use of brand names, attractive size packaging, extensive advertising, offer of guarantees and after sales service and so on. SOLUTION 8.1 (a) MEASUREMENT OF NATIONAL INCOME The income method
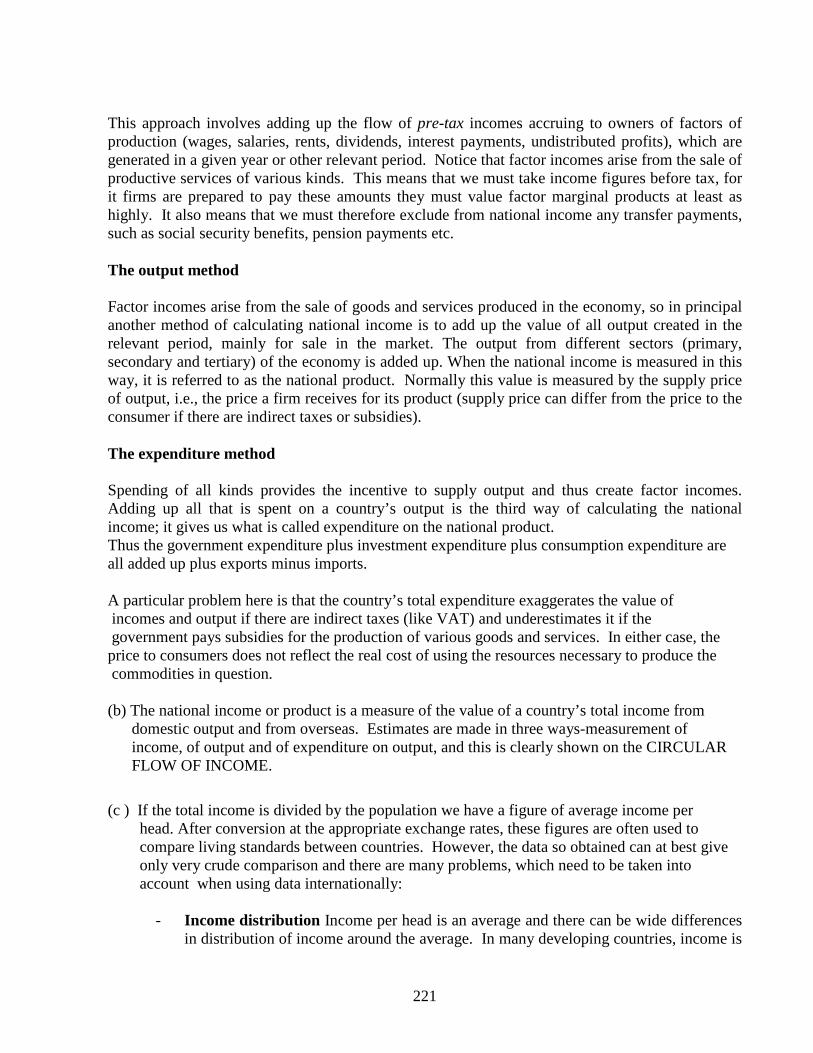
221
This approach involves adding up the flow of pre-tax incomes accruing to owners of factors of production (wages, salaries, rents, dividends, interest payments, undistributed profits), which are generated in a given year or other relevant period. Notice that factor incomes arise from the sale of productive services of various kinds. This means that we must take income figures before tax, for it firms are prepared to pay these amounts they must value factor marginal products at least as highly. It also means that we must therefore exclude from national income any transfer payments, such as social security benefits, pension payments etc. The output method Factor incomes arise from the sale of goods and services produced in the economy, so in principal another method of calculating national income is to add up the value of all output created in the relevant period, mainly for sale in the market. The output from different sectors (primary, secondary and tertiary) of the economy is added up. When the national income is measured in this way, it is referred to as the national product. Normally this value is measured by the supply price of output, i.e., the price a firm receives for its product (supply price can differ from the price to the consumer if there are indirect taxes or subsidies). The expenditure method Spending of all kinds provides the incentive to supply output and thus create factor incomes. Adding up all that is spent on a country’s output is the third way of calculating the national income; it gives us what is called expenditure on the national product. Thus the government expenditure plus investment expenditure plus consumption expenditure are all added up plus exports minus imports. A particular problem here is that the country’s total expenditure exaggerates the value of incomes and output if there are indirect taxes (like VAT) and underestimates it if the government pays subsidies for the production of various goods and services. In either case, the price to consumers does not reflect the real cost of using the resources necessary to produce the commodities in question. (b) The national income or product is a measure of the value of a country’s total income from domestic output and from overseas. Estimates are made in three ways-measurement of income, of output and of expenditure on output, and this is clearly shown on the CIRCULAR FLOW OF INCOME.
(c ) If the total income is divided by the population we have a figure of average income per head. After conversion at the appropriate exchange rates, these figures are often used to compare living standards between countries. However, the data so obtained can at best give only very crude comparison and there are many problems, which need to be taken into account when using data internationally:
- Income distribution Income per head is an average and there can be wide differences in distribution of income around the average. In many developing countries, income is

222
highly concentrated and to that extent may exaggerate incomes for the mass of the population.
- Non-consumption output Much output does not satisfy consumer needs and wants.
A proportion goes in investment in capital goods, which may arise income in the future but actually reduces current living standards if investment resources come from reducing consumption. Government spending, for example, on defence or building prestige office blocks again may reduce current household incomes without raising future income. The figures of national income therefore need to be adjusted to show the income available for household spending. The proportion of national product in the form of non-consumption output varies widely between countries.
- Non-marketed output Substantial non-marketed output is not counted in the official
income accounts. Production of goods and services in the household-housework, do-it-yourself activities, growing fruit and vegetable-is not usually recorded but may account for a substantial percentage of output. In poor agricultural economies much of a peasant’s real income is from food and other goods for direct consumption in the household and recorded income per head may thus be misleadingly low. There is a similar problem with government services, such as education and health, provided free at the point of consumption. Output is measured by the cost of provision, which is likely to underestimate the market value.
- Exchange rates these often fail to reflect the relative purchasing power of different
currencies in the domestic economy. Official fixed exchange rates are frequently badly under – or over-valued and floating rates are distorted by capital flows. Calculating ‘purchasing power’ exchange rates though there are still problems, for instance, which country’s relative prices should be used to value output, can make corrections.
- Inflation over a period of time national income figures in money terms must be
corrected for inflation to show the trends in real terms. Adjustments are necessarily very crude in countries with high rates of inflation.
- Errors and unrecorded income Much of the income, output and expenditure have to
be estimated. The inevitable inaccuracies may be magnified in developing countries with a large proportion of non-marketed income and poor data collection. Also, there is the problem of the ‘black economy’ consisting of unrecorded, usually illegal, transactions such as working for cash to avoid paying tax. This is though to be very large in some countries whose national income may therefore be badly understated.
SOLUTION 8.2 K’B

223
Consumers’ expenditure 8 000 Government final consumption 3 000
Gross domestic fixed capital formation 2 400 Value of physical decrease in stocks (10) Total domestic expenditure at market prices 13 390
+ Exports 2 000 - Imports (2 500) Gross Domestic Product at market prices 12 890
- Indirect taxes (1 750) + Subsidies 1 000 Gross Domestic Product at factor cost 12 140 + Property income from abroad 300 - Property income paid abroad (500) Net property income from abroad (200)
Gross National Product at factor cost 11 940 - Capital consumption/Depreciation (1 500) Net National Product at factor cost 10 440 SOLUTION 9.1 (a) Investment represents one of the main injections into the circular flow of income. Investment, whether undertaken by the government or by private businesses, is one of the key components of aggregate demand and any change in the level of investment will have a multiple effect on the level of national income In addition, investment is an important determinant of the long-term growth rate of an economy. Investment can be seen as current consumption forgone in order to achieve a higher rate of growth and hence a higher level of consumption in the future. capital goods
224
C A B O Consumption goods
An economy choosing to produce at a point such as B will have a higher current level of consumption but a lower growth rate that an economy choosing to produce at point A. The higher level of investment at A will enable the economy to achieve an outward movement of the entire curve and hence consume a higher level of both capital and consumer goods in future, such as at C.
(b) There are a number of ways in which the government might seek to encourage a higher
level of business investment. One of the first options it might consider is to controlling interest rates. The rate of interest is often a major factor is determining the level of business investment, which will only be undertaken if the expected return from the investment exceeds the anticipated cost of financing it.
Although the government may attempt to stimulate investment by reducing the rate of interest, it may be unsuccessful where the level of business confidence is low. If the Economic outlook is poor or uncertain, firms are unlikely to be willing to undertake new or additional investment, as they cannot be confident of a sufficient demand for the output the investment will generate.
The government can provide direct encouragement to businesses, for example by offering
investment grants or by providing tax incentives.
c) ‘Multiplier’ is the name given to the process of circulation of income, whereby an injection of a certain size leads to a much larger increase in national income. The firms or
households receiving the injection use at least part of the money to increase own consumption. This provides money for other firms and households to repeat the process and so on. The value of the multiplier may be calculated as 1/MPS or 1/1 - MPC Where MPC is the marginal propensity to consume. If MPC were equal to 0.9, the multiplier would be 10 and an injection of K1m would lead to a rise in national income of K10m as the money circulated. MPC is always less than one because of the effect of saving the original injection gradually diminishes.
d) In the circular flow of income, saving and investment are associated but not all money is
invested in the domestic economy; some is invested overseas and some held on as cash.
225
Since extra saving don’t necessarily result in additional investment (either because people don’t want to invest or because entrepreneurs’ are not prepared to invest), three conclusions follows
- The fall in consumption resulting from a rise in saving adversely affects entrepreneurs’ expectations, and therefore the decision to reduce investments. - A reduction in investment, through the multiplier, causes greater reductions in national income. - Since national income falls, household have smaller income and therefore save less.
Thus greater saving without greater investment ends with ends with smaller incomes and smaller saving. This is the paradox thrift.
SOLUTION 13.1
The public sector net cash requirements (PSNCR) are the total amount the public sector needs to borrow from the private sector and from overseas for the year. It consists of borrowing by the central government, by the local authorities and by the public corporations, the largest component being the central government borrowing requirements (CGBR). Part of the CGBR is on lent to other institutions within the sector, and to this extent reduces the amount that the rest of the public sector needs to borrow. In other words, only that part of borrowing by local authorities and public corporations that has not been lent on by the central govt adds to the
PSNCR.
There are several methods of financing the PSNCR. One of the main methods is by borrowing from the non-bank private sector through the sale of govt securities, treasury bills, local authority bonds and so on, to private companies and individuals. In addition, the banks may buy private sector debt. The most publicized aspect of the PSNCR is its effect on the supply. The money supply will not increase when private to the public sector finances the PSNCR, but it will increase in bank deposits. As a result, a government attempting to control the money supply will try to avoid financing the PSNCR from the banking sector.
It may also be financed through borrowing from overseas. Another method is issuing notes and coins in circulation. Lastly, through the privatization of public corporations.
The size of the PSNCR essentially reflects the extent to which the expenditure of the public sector exceeds its income. It follows that, to reduce the PSNCR, a govt will need to cut its expenditure or raise its revenue. The main component of public sector income is the govt receipt from taxation, and these may be changed over time in various ways. There have been a number of changes in tax system such as reduction in the rates of income and corporation tax, increase in the thresholds and allowances and replacement of some income tax bands, and these changes will have some impact on the amount of tax revenue generated. In addition, tax receipts will vary with the general level of Economic activity: In a recession, incomes and profits will fall and so too will the associated tax revenue while, in an upturn, tax revenues will tend to rise.

226
A policy of increase direct taxation on personal incomes or corporate profits in order to reduce the PSNCR faces the problem that incentives may be reduced and entrepreneurs may be less willing to take risks. A government could raise indirect taxes, but these tend to be regressive, and the government may not raise these for political reasons. The government can also reduce its own expenditure, but this would affect the level of Economic activity as government expenditure is a component of aggregate demand (Keynesian demand management). This will have a deflationary effect on the economy. Another source of finance is privatization, unfortunately, it is the profitable and successful organisations that can be easily sold off.
A reduction in aggregate demand would have a deflationary effect on the economy, and as a result, some firms may go out of business, while others would reduce in size. Investment by firms would be cut, and by the multiplier effects, the economy would move to a recession.
SOLUTION 13.2 (a) Direct taxes are levied on income and profits or on wealth. The impact or incidence and its burden are borne by the same person. Indirect taxes are levied indirectly once an expenditure is made. The impact or incidence and its burden can be transferred to the consumer depending on the elasticities of demand and supply on the product. Examples of direct taxes
- income tax - social security contributions - company tax - personal levy
Examples of indirect taxes - value added tax - excise duties - other expenditure taxes

227
(b) Fiscal policy is the management of the economy through public expenditure, taxation and
public borrowing. The key aspect is the relationship between spending and taxes. Government expenditure operates as an injection into the circular flow of national income; taxation as a withdrawal from it. It, in a given year, the government spends more money than it collects in taxes, this is termed a budget deficit. A deficit has an expansionary or inflationary effect upon the economy. This might be considered appropriate if there is much unemployment. If the government collects more in taxes than it spends this is referred to as a budget surplus. A surplus has a restraining or deflationary effect upon the economy. This would be considered an appropriate policy at a time of significant inflation.
For any given year, the application of fiscal policy may lead to a quite different outcome in respect of both expenditure and taxes than had been planned. The government might have become committed to unexpected areas of expenditure, while tax revenue might be more or less than was expected.
(c) A good tax system should be - Equitable
Taxes should be levied according to the ability to pay of the taxpayer. This can be extended to the argument that people in similar circumstances should pay similar amounts of money.
- Economical. The tax should be cheap to collect, otherwise much revenue collected will be wasted. - Certain The tax payer should know when the tax should be paid, how much should be paid and know which transactions give rise to a tax liability. The tax should be unavoidable. - Convenient The tax should be convenient to pay, not involving the tax payer in time consuming activities.
SOLUTION 14.1
a) Malawi has an absolute advantage in the production of tobacco and maize, she can produce both commodities more than Zambia. However, international trade should still take place between the two countries because of the theory of comparative advantage, the two countries can gain from trade when each specializes in the production of a commodity in which it has the lowest opportunity cost. The opportunity cost of 1 ton of tobacco is 10 tons of maize in Malawi, while in Zambia, the opportunity cost of 1ton of tobacco is 15 tons of maize. This means if Malawi forgo 1 ton of tobacco, she would acquire 10 tons of maize only, Zambia would get 15 tons of maize from forgoing 1ton of tobacco. The opportunity cost of 1 ton of maize is 0.1 ton of tobacco in Malawi, while in Zambia the opportunity cost of 1 ton of maize is 0.06 ton of tobacco. Therefore, Zambia has a comparative advantage in the production of maize, and should

228
import tobacco from Malawi, while Malawi should concentrate on the production of tobacco and import maize from Zambia. b) ARGUMENTS IN FAVOUR OF PROTECTIONISM - To protect new and declining industries. New industries need to be protected from foreign competition before they become strong to be on their own, while declining industries might quickly collapse and lead to mass unemployment if not protected. - To reduce unemployment. Unfair competition from foreign products may lead to the closure of home industries. Therefore, the government protects its industries in order to prevent the closure of industries and unemployment. - To reduce or eliminate balance of payments deficits. Restricting imports will help to reduce or eliminate balance of payments deficits. - To raise revenue. The government raises revenue from import tariffs that are imposed on imported products. - To protect strategic industries. Industries such as ship building, defence and aerospace are of strategic importance to many countries. Therefore many countries protect these Industries from foreign competition. - To protect against dumping of imported products on local market. Dumping is a situation where goods are sold at lower prices in a foreign market than in the home market. - Retaliation against measures taken by another country that is unfair. - To prevent unfair competition. Governments may justify protectionism with reference to the trading policies of its competitor nation, such as selling imitations at artificially low prices. c) There are different forms of protectionism, and some of them are: • Quotas. These are limits imposed on specified goods to be brought in the country. Import
quotas restrict the quantity of certain products, which can be imported into the country. If the product is homogeneous then a simple quota is imposed. If they are heterogeneous, then the quota can take the form of a value of imports allowed in any given currency.
The effect of quotas is to reduce the volume of imports, raise the price of imports and encourage the demand for locally produced commodities.
Note that sometimes one country persuades another country to voluntarily reduce its exports of a product to a certain acceptable level, this is known as voluntary export restraints

229
(VERs). VERs is also known as orderly market arrangements emphasizing their negotiated manner. VERs often apply to key industries, an example is VERs negotiated by the United States of America on Japanese exports of motor vehicles.
• Tariffs or custom (import) duties. These are taxes that are levied on imports. It can be a fixed amount per unit (specific) or a percentage of the price (ad valorem). The effect of tariffs is to raise prices of imports, and therefore reduce their demand, encourage the demand for locally produced commodities, as well as raise revenue for the government. • Trade embargoes. This is a complete ban of imports from a particular country. Sometimes it is a total ban imposed on particular products like drugs, from any country! During the Iraq war of the early 1990s, the United Nations imposed a ban on Iraq’s exports. • Hidden export subsidies and import restrictions (Direct controls). This is a range of government subsidies and assistance for exports and deterrents against imports as follows: - Subsidies. The government gives subsidies to local firms to allow them to compete favourably In terms of pricing of goods, with foreign firms. - Export credit guarantees or insurance against bad debts for overseas sales. - Grants or any form of financial help is provided to firms in the export sector - Zero rating or reducing taxes on exported goods - State assistance provided for firms in the export sector via the foreign office. In addition, imports are discouraged through - Health and Safety regulations. Countries sometimes put in place health and safety regulations that limit the importation of certain goods.
For example, the Zambian government has put in place a regulation that Stipulates that sugar sold in Zambian market must be fortified with vitamin A regardless of whether this sugar is locally produced or imported.
- Administrative procedures (bureaucracy). These are long, complex and costly procedures that importers have to go through at border posts.
- Exchange controls. These are aimed at restricting the amount of foreign exchange that is available to importers. SOLUTION 14.2 a) Benefits of international trade - It enables countries to specialise and increase production bearing in mind that the surplus can be exported.

230
- Countries can export surpluses and import what they lack.Access to the world market enables countries to benefit from economies of scale. - It allows countries to develop their industries as a result of free movement of capital. - It promotes closer cooperation between countries. - Competition from imports increases efficiency and limits the creation of monopolies. - Provision of goods that were previously unavailable. b) i) The theory of comparative advantage is based on the idea of opportunity cost. Within a country, opportunity cost for any category of product may be established in terms of the most advantageous use of national resources. If two countries produce different goods most efficiently and can exchange them at an advantageous rate in terms of the comparative opportunity cost of importing and home
production, then it will be beneficial for them to specialise and trade. This applies even if one country has an absolute advantage in both goods.
The theory of comparative advantage was devised by David Ricardo to demonstrate the
gains from specialisation and free trade, and it requires assumptions such as no barriers, no transport costs, mobile factors of production etc.
ii) International trade is influenced by changes in the relative prices. The terms of trade indicate a relationship between the average price of a nation’s exports and the average price of its imports. The rise in the terms of trade reflects the fact that export prices have risen more than import prices. An increase in the terms of trade is called an improvement in the terms of trade, though it may not always be desirable.
One reason for wanting an increase in the terms of trade is that a given quantity of exports will now pay for more imports. In the example above, the foreign currency earned by exporting one basket of exports in the year 2000 (K450, 000 worth) would buy 450/500 =0.9 or 90% of a basket of imports.
Formula: Terms of trade = Export price index ÷ Import price index X 100 Note that the terms of trade are only a guide to competitiveness because they only measure visible trade, that is, trade in goods. Trades in services are excluded. SOLUTION TO 15.1 (a) The balance of payment (BOP) is a statistical record, in the case of Zambia, of debits and credits covering all financial transactions between Zambia and the rest of the world recorded in a particular period. The BOP accounts are in two parts. There is the current account, through which the export and import of goods and services are posted, and the capital account through which capital flows.
231
By definition, the balance of payments account must always balance overall. Individual sections of the accounts may, however, be in deficit or surplus. In the case of Zambia, the current account deficit is usually partially offset by surpluses on the capital account (i.e. transactions in assets and liabilities). Usually, reference to a balance of payments deficit is intended to mean a deficit on the current account. The visible trade balance This is the net difference between the value of visible credits from exports and visible debits from imports at a particular period of time. By ‘visible’ here we mean goods that you can touch and see, examples being food, basic materials like iron, oil and manufactured goods like cars and washing machines. The invisible trade balance This is the net difference between the value of invisible credits from exports and invisible debits from imports at a particular period of time. By ‘invisible here we mean services like travel, civil aviation, shipping and financial and government services. Invisible also include interest, profits, dividends and ‘transfers’. The current account balance The current account balance is the visible trade balance and the invisible trade balance added together. In effect, it shows the country’s trading account with the rest of the world. Transactions in external assets and liabilities (the capital account) may involve governments, corporations and individuals, and may be either short or long term. Such transactions include direct and portfolio investments, bank lending, Zambia banks to residents overseas, other private lending and overseas deposits, changes in official reserve balances and other external transactions of the government. Exports of capital will increase a country’s external assets and will show us an outflow in the account (negative). Conversely, imports of capital increase liabilities for the country and will show as an inflow (positive). Overall, the balance of payments will sum to zero. It consists of a current account and an asset and liabilities (capital) account. A deficit on one account should match a corresponding surplus on the other. A deficit or surplus on current account implies an outflow or inflow of currency, which must be offset, ‘financed’ or covered by the sale of assets or by a reduction in liability. Changes in official borrowings and foreign currency reserves in the assets and liabilities accounts should be expected to achieve an overall balance with the current account. However, because of inadequacies in compiling statistics, the official record shows a balancing item.

232
(b) (i) The process of financing or covering is that by which any deficit or surplus on the current account, and this is the part through which trade in goods and services flows, are met or balanced by capital balances in the capital flows section.
- Borrowed from ‘official sources’ such as the International Monetary Fund; - Taken from a country’s gold and foreign currency reserves; or - Borrowed from overseas central banks. - Sale of overseas investments. - Buying on credit - Accepting gifts etc.
These borrowings might be obtained from overseas sources with repayments being made Over say 5, 10 or even 20 years. However, the borrowing powers and foreign currency reserves of a country are finite, and so over the longer term a current account deficit is not sustainable indefinitely.
(ii) Correcting a balance of payments deficit means reducing the potential deficit to a lower
level.
A deficit on current account might be rectified by one of more of the following measures: -
- A depreciation of the currency (called devaluation when deliberately instigated by the government, for example by changing the value of the currency within a controlled exchange rate system);
- Direct measures to restrict imports, including tariffs or import quotas or exchange control regulations;
- Domestic deflation to reduce aggregate demand in the domestic economy.
- Interest rate to attract foreign exchange.
Deflationary measures aim to reduce expenditure, while other policies are ching expenditure. For example, devaluation of the currency will make a country’s goods cheaper in export markets while imports will become more expensive in the home economy. Such a change in the relative prices of exports and imports should, it is hoped, encourage expenditure switching in favour of the country’s products.
As noted above, direct protectionist measures, for example in the form of tariff or non-tariff barriers to trade, might be used to correct a deficit.
(c) The proponents of a return to fixed exchange rates concentrate primarily on the experience since the early 1970s with floating rates. In particular, it is pointed out that flexible

233
exchange rates have been extremely unstable with frequent and often large fluctuations particularly against the US dollar and the pound sterling. There is some controversy about the causes of exchange rate instability. But what is clear is that since the 1970s there has been a vast growth in the volume of liquid funds held by governments, multinational corporations and other institutions which are prepared to shift them around between bank deposits and other financial assets denominated in different currencies in order to maximize the overall returns in the form of interest and capital gains. Thus, funds are shifted into, say, dollar deposits when, other things being equal, and there is a rise in US interest rates. A major factor in exchange instability, therefore, has been the divergence in the monetary policies of major countries. The instability, in turn, is often aggravated by speculation whereby treasurers and fund managers form expectations about exchange rate movements. Exchange instability, it is claimed, imposes costs on traders and investors. Exporters, importers and investors face additional risks from adverse exchange rate movements which may reduce the volume of trade and investment since the avoidance of exchange money movements and speculation may become out of line with the rates which would be more appropriate to the country’s fundamental Economic position. Particularly with regard to its trade and balance of payment. However, while the case for a return to fixed rates seems strong there are also good arguments against it. In particular, fixed parities inevitably become out of line with the rates necessary for balance payments equilibrium. Countries with higher inflation will find their goods becoming uncompetitive and their trade and payments deteriorating into deficit . Low-inflation counties will tend to run growing surpluses. Eventually, deficit countries may be forced to lower their parities (devalue) to restore competitiveness. Thus, those in favour of floating rates argue that they automatically keep payments in equilibrium and correct for divergent inflation rates. Also, it is said that they allow countries to pursue independent monetary policies and to isolate themselves from excessive inflation in other countries. There is also an Economic use of foreign currency reserves. The major advantage of fixed exchange rates is that they remove uncertainty and so encourage international trade and investment. SOLUTION 15.2 a) Policies required in restoring a balance of payments to equilibrium - Devaluation/depreciation Devaluation of a currency is a reduction in the exchange rate of the currency relative to other currencies. The objective of devaluing a country’s currency to make exports cheaper and imports expensive, by reducing the price of exports to foreign buyers (i.e. in foreign currency terms) and increasing the price of imports in terms of the domestic currency.
If for example the Zambian Kwacha to the US dollar is devalued form $1 = K3200 to $1 = to K4000, then foreign consumers and firms will be encouraged to switch to Zambian goods because
234
with the same $1, they are able to purchase more Zambian goods. They are able to purchase K4000 worth of goods instead of K3200 worth of goods. In addition, local consumers and firms will be discouraged from imports. They will need to have K4000 to purchase a $1 worth of goods, before devaluation, they needed to have K3200 to purchase a $1 worth of goods.
Therefore, depreciation in the kwacha exchange rate should help to boost the overseas demand for Zambian exports because Zambian firms will be able to supply more cheaply in international markets.
The extent to which export sales rise following a fall in the exchange rate depends on the price elasticity of demand for Zambian products from foreign consumers.
A lower exchange rate should also cause imports into Zambia to become relatively more expensive, thus leading to a slowdown in import volumes and "expenditure-switching" towards local goods. The significance of elasticity of demand should is again important.
In the short run the change in import demand is likely to be fairly small - it takes time for movements in the exchange rate to affect trade flows.
- Deflation/Fiscal policy This is contraction of the domestic economy. Deflationary measures are aimed at reducing aggregate demand and this can be achieved by either increasing interest rate to discourage borrowing or increasing tax rates in order to reduce consumption expenditure. The government can also reduce its own expenditure. Some of the overall trade deficit is due to the strength of domestic demand for goods and services. If and when the economy enters a slowdown phase, the growth of imports will fall, and this should provide an element of correction for the trade deficit
The effect of the deflationary measures is to reduce the demand for goods and services, including the demand for imports. If imports are high, demand for them is reduced by reducing the demand in the economy in general, as long as the demand for imports is income inelastic. If the fall in demand is accompanied by a reduction in inflation in the home market, the competitiveness of exports improves (as long as demand for exports in price elastic). In addition, firms are encouraged to switch to export markets because of the fall in domestic demand. Some of the overall trade deficit is due to the strength of domestic demand for goods and services. If and when the economy enters a slowdown phase, the growth of imports will fall, and this should provide an element of correction for the trade deficit. The major problem associated with deflation is that a sharp fall in consumer spending might lead to a steep Economic slowdown (slower growth of GDP) or a full-scale recession.
- Discouraging imports whilst encouraging exports.
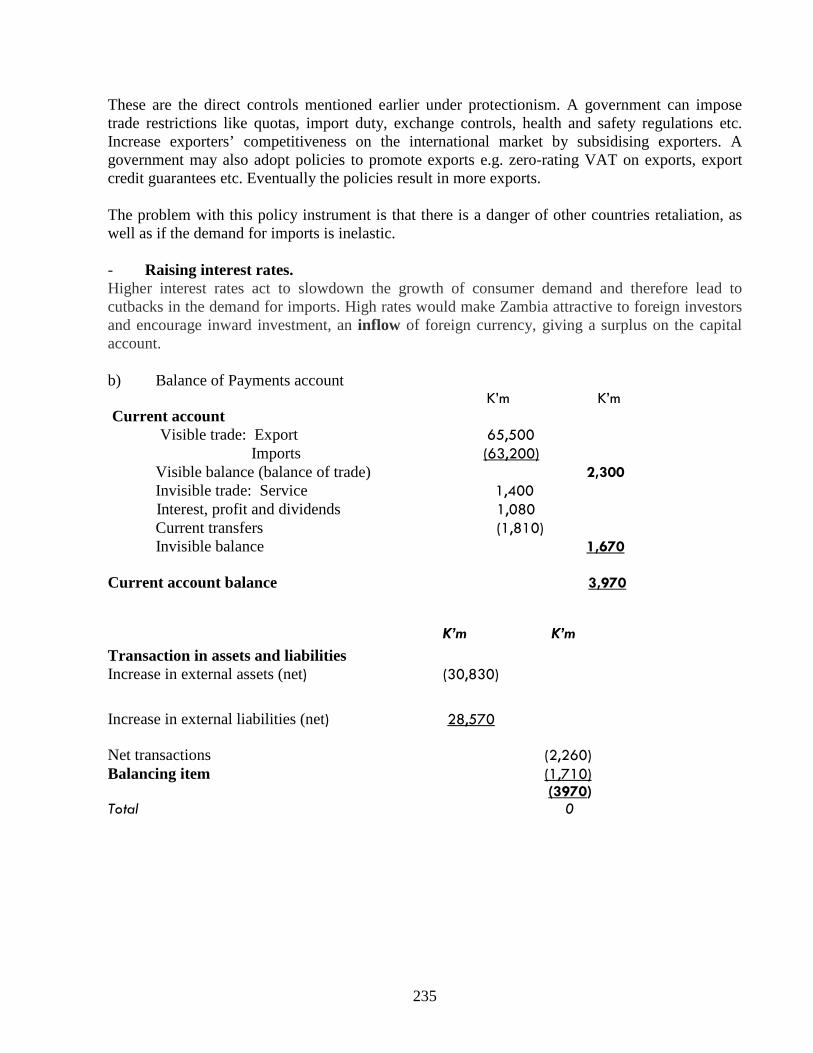
235
These are the direct controls mentioned earlier under protectionism. A government can impose trade restrictions like quotas, import duty, exchange controls, health and safety regulations etc. Increase exporters’ competitiveness on the international market by subsidising exporters. A government may also adopt policies to promote exports e.g. zero-rating VAT on exports, export credit guarantees etc. Eventually the policies result in more exports. The problem with this policy instrument is that there is a danger of other countries retaliation, as well as if the demand for imports is inelastic. - Raising interest rates. Higher interest rates act to slowdown the growth of consumer demand and therefore lead to cutbacks in the demand for imports. High rates would make Zambia attractive to foreign investors and encourage inward investment, an inflow of foreign currency, giving a surplus on the capital account.
b) Balance of Payments account K’m K’m Current account Visible trade: Export 65,500 Imports (63,200)
Visible balance (balance of trade) 2,300 Invisible trade: Service 1,400
Interest, profit and dividends 1,080 Current transfers (1,810) Invisible balance 1,670 Current account balance 3,970
K’m K’m
Transaction in assets and liabilities Increase in external assets (net) (30,830)
Increase in external liabilities (net) 28,570 Net transactions (2,260)
Balancing item (1,710) (3970) Total 0

236
APPENDIX III MOCK EXAMINATION
NATIONAL ACCOUNTING TECHNICIAN/ADVANCED CERTIFICATE IN ACCOUNTING JOINT EXAMINATIONS ___________________
FOUNDATION STAGE
___________________
T4: ECONOMICS ___________________
SERIES: MOCK EXAMINATION ___________________
TOTAL MARKS - 100 TIMES ALLOWED: THREE (3) HOURS
__________________
237
INSTRUCTIONS TO CANDIDATES
1. There are SEVEN questions in this paper. THREE in Section A and FOUR in Section B. You are required to attempt a total of FIVE questions – TWO from Section A, TWO from Section B and ONE from either Section.
2. Enter your student number and your National Registration Card Number on the front of the answer booklet. Your name must NOT appear anywhere on your answer booklet.
3. Do NOT write in pencil (except for graphs and diagrams). 4. The marks shown against the requirement(s) for each question should be taken as an
indication of the expected length and the required depth of the answer. 5. All workings must be done in the answer booklet. 6. Present legible and tidy work. 7. Graph paper (if required) is provided at the end of the answer booklet. SECTION A (MICRO-ECONOMICS) Answer at least TWO questions in this section. QUESTION ONE (a) Mention any six (6) advantages of the planned (command) Economic system. (6 marks) (b) (i) Explain with the aid of a diagram the meaning of the term change in supply. (2 marks) (ii) Mention any four (4) factors that can cause a change in supply. (8 marks) (c) The price and quantity of cars are in equilibrium. Suppose there is a large increase in the
price of fuel, explain with the aid of an appropriate diagram the new price and quantity traded in cars. (4 marks)

238
(Total: 20 marks) QUESTION TWO (a) (i) Explain the four (4) features of monopolistic competition. (4 marks) (ii) With the help of a diagram, explain the demand curve of a firm operating under conditions
of monopolistic competition. (2 marks) (iii) “In the long run, a firm under monopolistic competition rarely makes profits”. Discuss this statement and illustrate with an appropriate diagram. (6 marks) (b) Some countries have set up Monopolies Commissions in order to regulate
monopolies. Discuss: (i) In favour of monopolies. (4 marks) (ii) Against monopolies. (4 marks) (Total: 20 marks) QUESTION THREE (a) Distinguish between fixed costs and variable costs giving two (2) examples of each. (4 marks) (b) Explain what is meant in Economics by:
(i) Short run. (2 marks) (ii) Long run. (2 marks) (c) Explain what causes the cost curves to be ‘U’ shaped in the:
(i) Short run. (3 marks) (ii) Long run. (3 marks)
(d) The table below shows units and prices for ‘Z’ limited company. Quantity (units) 1 2 3 4 5 6

239
Average revenue 8 7 6 5 4 3 Total revenue - - - - - - Marginal revenue - - - - - - You are required to calculate:
(i) Total revenue. (3 marks)
(ii) Marginal revenue. (3 marks) (Total: 20 marks) SECTION B (MACRO-ECONOMICS) Answer at least TWO questions in this section. QUESTION FOUR (a) Explain the four (4) functions of money. (8 marks) (b) Sketch and explain a liquidity preference schedule. (6 marks) (c) Explain any four (4) Economic consequences of an increase in the rate of interest. (6 marks) (Total: 20 marks) QUESTION FIVE (a) Distinguish between direct and indirect taxes giving two (2) examples of each. (6 marks) (b) Mention three (3) advantages each, of
(i) Direct taxes. (3 marks) (ii) Indirect taxes. (3 marks)
(c) Explain how a government can control inflation using fiscal policy. (8 marks) (Total: 20 marks) QUESTION SIX (a) Explain any five (5) principal Economic benefits that a country obtains by engaging in
international trading. (10 marks)
240
(b) Explain the composition of a balance of payments account. (6 marks) (c) Give a brief explanation of four (4) ways of ‘financing’ or ‘covering’ a deficit balance of
payments account. (4 marks) (Total: 20 marks) QUESTION SEVEN The Zambian Kwacha rate of exchange to the United States Dollar was over K5 000 to $1 in mid November 2002. The Kwacha has appreciated to around K3 400 to $1. You are required to give a brief explanation on: (a) Any four (4) reasons that can lead to an appreciation of a floating exchange rate. (4 marks) (b) Three (3) advantages of a floating exchange rate system. (6 marks) (c) Three (3) disadvantages of a floating exchange rate system. (6 marks) (d) (i) Appreciation and depreciation of a currency. (2 marks)
(ii) Revaluation and devaluation of a currency. (2 marks) (Total: 20 marks)
END OF PAPER
T4: ECONOMICS
SUGGESTED SOLUTIONS SOLUTION ONE (a) The three advantages of the planned Economic system are as follows:-
- Adequate resources are devoted to community goods - No unemployment of resources - Introduce more certainty into production through the planning the allocation of
resources - Eliminates the inefficiencies resulting from competition - An attempt to distribute resources equally - Weaker members of the society are taken care of - Provision of basics such as food, clothing and shelter.

241
(b) Economists refer to ‘a change in supply’ when there is a shift in the supply curve either to the right or to the left, indicating a reduction or an increase in supply respectively. A CHANGE IN SUPPLY Price S1 S S2 Quantity ii) The four factors that can cause a change in supply are as follows:- - Changes in the cost of production - Weather conditions - Technological changes - Government policy such as taxation and subsidies (c) Petrol and cars are complementary goods, therefore, any change in the market for petrol would affect the market for second hand cars. The demand for petrol is likely to be price inelastic since there is no substitute for it. However, a large increase in the price of fuel is a rise in the cost of owning and running a car. There will, therefore be a fall in the demand for cars. The price and the quantity traded will reduce PRICE D S D1 P P1 0 Q Q1 Quantity

242
SOLUTION TWO (a) (i) ‘Monopolistic competition’ is a term used to describe a market type, which combines the features of perfect competition and monopoly in some respects. The models assume that there are a very large number of buyers and sellers that there is free entry to and exit from the market. In monopolistic competition each firm’s product is differentiated in some way from that of its competitors. (ii) When a firm monopolises the industry through product differentiation, it has some market power, and like a monopolist, it becomes a price maker. However, if the firm sets a high price the quantity is low, but at low price the quantity demanded is high. The firm’s demand curve slopes downwards as illustrated in the diagram below Price AR = D Quantity (iii) One of the features is that there are no barriers to entry. New firms will enter after being attracted by the supernormal profits that firms under monopolistic competition earn in the short run just like a monopoly.
This will lead the firm’s demand curve to shift downwards and to the left. This Process will continue until all the excess profits disappear and the firm is just making normal profits at output Q2 as illustrated in the diagram below.

243
This is the firm’s long-run equilibrium position. However, it still has a downward- sloping demand (or average revenue) curve. If average costs equal average revenue, as they must do if the firm is making normal profits, this implies that the firm is in equilibrium on the downward-sloping section of its long-run average cost curve. Price MC Diagram Cost AC Revenue MR D(AR) 0 Q2 Quantity (b) (i) Arguments FOR monopolies - To achieve economies of scale, and therefore lower the prices - Supernormal profits used on research and development - Research and development leads them to be innovative - Easier to raise new capital (ii) Arguments AGAINST monopolies - Output lower prices higher - Supernormal profits are at the expense of customers - Practice price discrimination which is a restrictive practice - ‘X’ inefficiency, complacency, not innovative - Lower costs just used to stifle competition - Diseconomies of scale
SOLUTION THREE (a) Fixed costs are those costs, which do not vary with output, examples rent, interest on loan,
depreciation, rate administration costs etc.
Variable costs are those costs, which vary with output, examples cost of raw materials, electricity, wages etc.

244
(b) (i) The short run in Economics is defined as that period when at least one factor of production is in fixed supply. (ii) The long run is a period when all the factors of production are considered to be variable. (c) (i) The diminishing returns cause the short run cost curves to be ‘U’ shaped. Average costs (AC), start from a high level because of high fixed costs (FC). As output increases, AFC decline, because same level of FC is divided by a higher output. The average variable costs are relatively constant. Therefore, ATC decline, they will continue to decline until diminishing returns set in. After that point, the fixed factor(s) of production need to be increased. Since this is not possible in the short run, the AC increase, hence the ‘U’ shape in the short run.
When AC are declining, MC decline faster, and when AC are increase, the MC increase faster because they only deal with the VC of production.
ii) The diseconomies of large scale production, i.e. their disadvantages cause the long run cost curves to be ‘U’ shaped.
When a firm grows in size, there are human and behavioural problems of managing a large organisation. Such as increasing bureaucracy, communication is hampered, morale and motivation fall, there is ‘X’ inefficiency etc.
(d)
i. TR 8 14 18 20 20 18 ii. MR - 6 4 2 0 -2
SECTION B SOLUTION FOUR (a) Money performs the following functions: - Medium of exchange This is the most important function it serves as a means of payment. Instead of the barter system and its serious drawbacks. Money allows purchases and sales to be conducted independent of each other. With no double coincidence of wants. Money facilitates the exchange of goods. - Unit of account Money can act as a common measure or standard of value of the unit of goods and services. The value of goods and services are measured in monetary terms. Money is the common denominator, and to perform this function effectively, the value of money should itself be stable……

245
- Store of value Money is a way of storing surplus wealth. While surpluses can be stored in the form of other assets, it is usually held in the form of money because it is the most liquid asset. Therefore money is the most convenient method of storing wealth for use whenever it is needed, again it has to be stable…… - Standard of deferred payments Money facilitates credit transactions. Borrowing and lending in the economy is simplified. Loans and debts are usually expressed in terms of money. Money is the link that connects the values of today with those of the future, implying again that it must be stable….. (b) Keynes argued that the demand for money, which he defined as liquidity preference – in that money is the most liquid of assets – was made up of three elements as follows: Transactions motive Individuals and firms need money to pay day-to-day purchases, so money is held because it performs a function of a medium of exchange. Precautionary motive Household and firms hold money in order to meet unforeseen contingencies. Money is the most liquid asset and for this reason it is held to deal with sudden misfortunes, for example an emergency repair to the motor, or to take advantage of an unexpected bargain or in case expenses or costs turn out to be higher than budgeted for. Speculative motive Keynes argued that money may be held over and above that required for transactions and precautionary purposes because people wish to hold money as an asset, ie people wish to hold money because it performs a function of a restore of value. There is an inverse relationship between bond prices and the rate of interest. If bond prices fall the rate of interest rises, while if bond prices rise the rate of interest falls. If the interest rate is expected to rise (ie bond prices are expected to fall), people will prefer to hold money balances rather than bonds. The liquidity preference schedule We bring the three motives together in a diagram form to give a total demand curve for

246
money; this is called the “liquidity preference schedule” (schedule’ is simply another name for “curve”, as in “demand schedule”). r Liquidity Preference schedule a b c
0 M The liquidity preference schedule The lines a, b and c represent the three motives for holding cash. The total cash held at each level of interest would be the sum of the amounts held to satisfy each motive. This is shown graphically by adding the three lines horizontally. Some shapes of the curves representing the transactions and the precautionary motives are only slightly affected by the interest rate, the shape of the liquidity preference schedule is influenced most by curve”c”, the speculative motive. (c) The rate of interest is the price of borrowing money, which must be paid by the borrower to the lender. Interest rates are prices, which will vary with the nature of the lending ‘product’ involved. A large rise in the rate of interest will affect the following: - It will raise the price of borrowing - It will therefore reduce the levels of investment. High cost of credit deters spending. - It will lead to a reduction in consumption. Savings increase because of the high interest rates. Income is either saved or consumed and once savings increases, consumption reduces. - Inflation falls. A reduction in investment expenditure and consumption expenditure, which are both components of aggregate demand, causes a reduction in Economic activity and therefore reduces inflation. - Asset values fall. There is an inverse relationship between bond prices and interest rates. - Foreign funds increase. High rates of interest cause an increase in the inflow of foreign funds, ‘hot money’. This in turn - Raises the exchange rate. The currency appreciates because of the high demand, which pulls up the ‘price’. SOLUTION FIVE

247
(a) Direct taxes are levied on income and profits or on wealth. They are paid directly to the revenue authorities. The impact or incidence and its burden are borne by the same person. Indirect taxes are levied indirectly once expenditure is made. The impact or incidence and its burden can be transferred to the consumer depending on the elasticities of demand and supply on the product. Examples of direct taxes - Income tax - Social security contributions - Company tax - Personal levy Examples of indirect taxes - Value added tax - Excise duties - Tariffs or import duties (b) (i) The advantages of direct taxes are - A high and elastic yield - Certainty - Convenient - Equity through the progressive system of taxation - Redistributes income and wealth more equally (ii) The advantages of indirect taxes are - Difficult to evade
- Not harmful to effort and initiative - Adjustable to specific objectives of policy e.g.
1. To protect infant industries 2. To strengthen political links 3. Safeguard citizen’s health 4. Improve balance of trade
(c) Fiscal policy is the management of the economy through public expenditure, taxation and public borrowing. The key aspect is the relationship between spending and taxes. Government expenditure operates as an injection into the circular flow of national income; taxation is a leakage. If the government collects more in taxes than it spends this is referred to as a budget surplus. A surplus has a restraining or deflationary effect upon the economy.This would be considered an appropriate policy at a time of significant inflation. Whenever the government aims for a budget surplus, it increases direct taxes, which increases government revenue while reducing its own expenditure. Government revenue is mostly from taxes. An increase in taxes lowers the disposable income of

248
both individuals and firms, their purchasing power is reduced. A reduction in both government expenditure and consumption expenditure reduces aggregate demand. The curve shifts to the left and inflation is lowered. PRICE AS AD AD1 P P1 0 Q Q1 Quantity SOLUTION SIX (a) The Economic benefits of international trade are:- - Some countries have minerals or some products can be grown in some countries but not
in others, thanks to IT all the products are available in all the countries - Society has a wider choice of products - IT opens up domestic markets to more competition - It also promotes beneficial political links between countries - Increased competition results in efficient use of resources, which lowers costs. Therefore
consumer prices are reduced which leads to a much higher standard of living. - The market is global, which leads to large scale production and therefore benefits of
economies of scale. - There is wider specialisation and international division of labour, which leads to an
increase in total world output. (b) The balance of payment (BOP) is a statistical record, of debits and credits covering all financial transactions between for example, Zambia and the rest of the world recorded in a particular period, usually a year.

249
The BOP accounts are in two parts. There is the current account, through which the export and import of goods and services are posted, and the capital account through which capital flows. By definition, the balance of payments account must always balance overall. Individual sections of the accounts may, however, be in deficit or surplus. In the case of Zambia, the current account deficit is usually partially offset by surpluses on the capital account (i.e. transactions in assets and liabilities). Usually, reference to a balance of payments deficit is intended to mean a deficit on the current account. The visible trade balance This is the net difference between the value of visible credits from exports and visible debits from imports at a particular period of time. By ‘visible’ here we mean goods that you can touch and see, examples being food, basic materials like iron, oil and manufactured goods like cars and washing machines. The invisible trade balance This is the net difference between the value of invisible credits from exports and invisible debits from imports at a particular period of time. By ‘invisible here we mean services like travel, civil aviation, shipping and financial and government services. Invisible also include interest, profits, dividends and ‘transfers’. The current account balance The current account balance is the visible trade balance and the invisible trade balance added together. In effect, it shows the country’s trading account with the rest of the world. Transactions in external assets and liabilities (the capital account) may involve governments, corporations and individuals, and may be either short or long term. Such transactions include direct and portfolio investments, bank lending, Zambia banks to residents overseas, other private lending and overseas deposits, changes in official reserve balances and other external transactions of the government. Exports of capital will increase a country’s external assets and will show us an outflow in the account (negative). Conversely, imports of capital increase liabilities for the country and will show as an inflow (positive). Overall, the balance of payments will sum to zero. It consists of a current account and an asset and liabilities (capital) account. A deficit on one account should match a corresponding surplus on the other. A deficit or surplus on current account implies an outflow or inflow of currency, which must be offset, ‘financed’ or covered by the sale of assets or by a reduction in liability.

250
Changes in official borrowings and foreign currency reserves in the assets and liabilities accounts should be expected to achieve an overall balance with the current account However, because of inadequacies in compiling statistics, the official record shows a balancing item.
Students should mention the account and examples of items found in
each account
(c) The process of financing or covering is that by which any deficit or surplus on the current account, met or balanced by capital balances in the capital flows section.
(i) Borrowed from ‘official sources’ such as the International Monetary Fund; (ii) Taken from a country’s gold and foreign currency reserves; or (iii) Borrowed from overseas central banks. (iv) Sale of overseas investments. (v) Buying on credit (vi) Accepting gifts etc. These borrowings might be obtained from overseas sources with repayments being made over say 5, 10 or even 20 years. However, the borrowing powers and foreign currency reserves of a country are finite, and so over the longer term a current account deficit is not sustainable indefinitely. SOLUTION SEVEN (a) The market forces of demand and supply of a currency determine a floating or a flexible exchange rate. A currency can appreciate if demand for a currency is high or the supply for that currency is low. This can be due to: - People demanding the Kwacha for example to pay for Zambian exports, i.e. Zambian goods
and services. - Overseas investors who want to invest in Zambia will need the Kwacha. - Speculators who think that the kwacha is about to become more valuabe in terms of other currencies - High interest rates will encourage people to put money in Zambian financial institutions, in Kwacha. - Central authorities such as the Bank of Zambia might want to offload the dollar, pound etc to push up the value of the Kwacha. - Any other inflow of foreign currency such as borrowing…… (b) The advantages of floating exchange rates are:- - Automatic adjustment to the balance of payments disequilibrium, without government intervention. - There is greater freedom to pursue domestic goals, since the government does
251
not need to intervene in the exchange rate. - There is Economic use of the foreign currency reserves.
Thus, arguments in favour of floating rates argue that they automatically keep payments in equilibrium and correct for divergent inflation rates. Also, it is said that they allow countries to pursue independent monetary policies and to isolate themselves from excessive inflation in other countries. There is also an Economic use of foreign currency reserves.
(c) The disadvantages of floating exchange rates are:- - The main disadvantage is uncertainty - There is increased speculative activity - The above leads to increased volatility. It is pointed out that flexible exchange rates have been extremely unstable with frequent and often large fluctuations particularly against the US dollar and the pound sterling. There is some controversy about the causes of exchange rate instability. But what is clear is that since the 1970s there has been a vast growth in the volume of liquid funds held by governments, multinational corporations and other institutions which are prepared to shift them around between bank deposits and other financial assets denominated in different currencies in order to maximise the overall returns in the form of interest and capital gains. Thus, funds are shifted into, say, dollar deposits when, other things being equal, and there is a rise in US interest rates. A major factor in exchange instability, therefore, has been the divergence in the monetary policies of major countries. The instability, in turn, is often aggravated by speculation whereby treasurers and fund managers form expectations about exchange rate movements. Exchange instability, it is claimed, imposes costs on traders and investors. Exporters, importers and investors face additional risks from adverse exchange rate movements, which may reduce the volume of trade and investment since the avoidance of exchange money movements, and speculation may become out of line with the rates, which would be more appropriate to the country’s fundamental Economic position. Particularly with regard to its trade and balance of payment. (d) (i) In markets where exchange rates are flexible or they float, an increase in the external value
of a currency is referred to as an appreciation, while a decrease in the external parity is referred to as a depreciation of the currency.
This means that an economy is following a floating exchange rate system, and the market forces of supply and demand are determining the rate of exchange.
(ii) When the currency is made cheaper with respect to another currency e.g dollar, the
adjustment is called devaluation. A revaluation results when a currency become more expensive with respect to another currency.
252
INDEX
A
Accelerator, 112, 113 Advertising, 64, 81, 86, 88 Arc elasticity of demand, 30 Average cost, 54 Average revenue, 70, 239
B
Balance of Payments, 181 Bank of Zambia, 132 Bank’s assets and liabilities, 131
C
Capital, 4, 57 Capital Account, 182,183,208 Capital Adequacy, 133,204 Capital Markets, 127,128 Capital Tax, 153 Cartels, 89, 201 Central Bank, 132 Closed economy, 111 COMESA, 175 Companies, 50, 58, 168, Comparative advantage, 169, 178, 179 Complements, 46 Complementary goods, 15 Consumption function, 108 Corporation Tax, 153 Cost-push inflation, 139 Co-operatives, 50 Creation of Money, 128 Cross Elasticity of Demand, 45 Current account, 181, 183
D Deflation, 187 Deflationary gap, 110, 114, 115, 165 Demand curve, 13 Demand for labour, 144 Demand for money, 118, 119 Demand management, 109, 111, 114, 147, Demand- pull inflation, 140
Determination of Exchange, 189 Devaluation, 186, 191 Diseconomies of scale, 62, 65 Distribution channels, 69 Direct controls, 171, 188 Diversification, 68, 72, 163 Division of labour, 51
E
Economics, 1, 2 Economic growth, 5, 6 Economies of scale, 63 Elasticity, 25, 28, 33, 35, 37, 44 Enterprise, 4 Equilibrium market price, 19 Equilibrium position, 80 European Union (EU), 176 Exchange controls, 171, 229 Exchange rates, 189 External economies, 64 Expectations, 16, 113, 225, 233, 251
F
Factors of production, , 2, 4, 6, 10 Fifth National Development Plan, 162 Financial Intermediaries, 126 Financial markets, 127 Fiscal policy, 158, 159, 162, Fixed costs, 53, 59 Fixed exchange rates, 189 Floating exchange rates, 190 Foreign exchange market, 189, 190, 191 Fractional reserve system, 129 Functions of money, 117
G Globalisation, 167 Giffen goods, 44, 195 Gross Domestic Product (GDP), 95, 97 Gross National Product, 94, 97
I Income effect, 14, 45 Income elasticity of Demand, 44 Income tax, 153, 225, 226

253
Inferior goods, 15 Inflation, 138 Inflationary gap, 109, 110, 114, Inheritance tax, 153 Integration, 61, 67, 72, 73, 168, 176, 198 Interest rates, 63, 108, 109, 114, 118, Internal Diseconomies, 65 Internal economies, 73, 197 International monetary fund IMF), 177 Investment, 94, 96, 97, 99, 102 Invisibles, 191, 208
K Keynesian Demand Management, 109 Kinked demand curve, 90, 201
L
Labour, 4, Land, 2, 3 Lafter curve, 155 Lateral Integration, 68 Law of diminishing returns, 2 Liquidity preference schedule, 123, 239, 246 Location of industry, 67 Long run, 52, 61 Long run costs, 52
M Macroeconomics, 1 Marginal cost, 54 Marginal utility, 14 Marginal productivity theory, 57 Marginal propensity to consume, 107, 112 Marginal revenue, 71 Market demand, 12 Market economy, 7 Merit goods, 8, 9, 151 Microeconomics, 1 Minimum efficient scale (MES), 62 Mixed economic system, 9 Monetarists, 121, 138, 139, 143, 147, 206 Monetary policy, 134, 190, 206 Money, 116 Monopolistic competition, 75, 86 Monopoly, 79, 82
Multiplier, 106, 108, 113
N
Narrow Money, 119 National income, 94, 95 Nationalised industries, 151 Natural resources, 2, 7, 57, 103, 174 Normal goods, 15, 216
O Official reserve account, 183 Oligopoly, 88 Open market operations, 134 Opportunity cost, 4, 145, 230
P
Paradox of Thrift, 113 Partnerships, 49, 50 Perfect competition, 76 Phillips curve, 146 Planned (command) economy, 8 Population, 4, 16, 45, 99, 100, 101 Precautionary motive, 245 Price discrimination, 81, 82, Price elasticity of demand, 25 Price elasticity of supply, 34, 37 Primary production, 51 Private limited company, 50 Privatisation, 156 Production Possibility curve, 5 Progressive tax, 153 Proportional tax, 153 Public goods, 8, 9 Public limited company, 50
Q
Quantity theory of money, 139 Quotas, 170, 171, 178
R
Rate of interest, 119, 120 Regression tax, 153 Research and development, 168, 197, 198 Revenue, 3, 25, 39, 40, 41, 47,
254
S SADC, 174 Savings, 108 Scarcity, 1, 203 Secondary production, 51 Short run, 52, 56 Social costs, 7, 71, 152 Sole traders, 49, 50 Specialisation, 51 Speculative Motive, 118 Stagflation, 147 Standard of living, 6, 22, 45, 99 Sock exchange, 128 Stock of money, 119, 205 Subsidies, 171 Substitute goods, 15, 18 Substitution effect, 14, 45 Supernormal profit, 158 Supply curve, 17
T
Tariffsor custom duties 171, 177 Taxation, 21, 23, 25
Technical efficiency, 88, 200 Terms of trade, 103, 173 Trade embargoes, 171 Transactions motive, 245 Transfer payments, 104, 181, 221 Treasury bills, 134, 162, 204, 225
U Unemployment, 143 Unitary elasticity, 26, 36 Utility, 14
V
Value added tax, 140, 155, 226 Variable costs, 52, 53 Velocity of circulation, 139 Venture capital, 127
W
Wealth, 117, 118 Welfare, 103, 145, 154, 159, 161 World bank, 177 World trade organisation (WTO), 177