Zhang, Bo Yu, Tsunekazu Kakuta and Ik-Kyung Jang Circ ... · Methods and Results—We identified...
12
Zhang, Bo Yu, Tsunekazu Kakuta and Ik-Kyung Jang Jinwei Tian, Sining Hu, Robert W. Yeh, Rahul Sakhuja, Iris McNulty, Hang Lee, Shaosong Seung-Jung Park, Stephen Lee, Soo-Joong Kim, Haibo Jia, Rocco Vergallo, Farhad Abtahian, Taishi Yonetsu, Koji Kato, Shiro Uemura, Byeong-Keuk Kim, Yangsoo Jang, Soo-Jin Kang, Assessed by 3-Vessel Optical Coherence Tomography Features of Coronary Plaque in Patients With Metabolic Syndrome and Diabetes Mellitus Print ISSN: 1941-9651. Online ISSN: 1942-0080 Copyright © 2013 American Heart Association, Inc. All rights reserved. Dallas, TX 75231 is published by the American Heart Association, 7272 Greenville Avenue, Circulation: Cardiovascular Imaging doi: 10.1161/CIRCIMAGING.113.000345 2013;6:665-673; originally published online August 6, 2013; Circ Cardiovasc Imaging. http://circimaging.ahajournals.org/content/6/5/665 World Wide Web at: The online version of this article, along with updated information and services, is located on the http://circimaging.ahajournals.org/content/suppl/2013/08/06/CIRCIMAGING.113.000345.DC1.html Data Supplement (unedited) at: http://circimaging.ahajournals.org//subscriptions/ is online at: Circulation: Cardiovascular Imaging Information about subscribing to Subscriptions: http://www.lww.com/reprints Information about reprints can be found online at: Reprints: document. Permissions and Rights Question and Answer information about this process is available in the requested is located, click Request Permissions in the middle column of the Web page under Services. Further Center, not the Editorial Office. Once the online version of the published article for which permission is being can be obtained via RightsLink, a service of the Copyright Clearance Circulation: Cardiovascular Imaging in Requests for permissions to reproduce figures, tables, or portions of articles originally published Permissions: at INSERM - DISC on October 24, 2013 http://circimaging.ahajournals.org/ Downloaded from at INSERM - DISC on October 24, 2013 http://circimaging.ahajournals.org/ Downloaded from at INSERM - DISC on October 24, 2013 http://circimaging.ahajournals.org/ Downloaded from at INSERM - DISC on October 24, 2013 http://circimaging.ahajournals.org/ Downloaded from at INSERM - DISC on October 24, 2013 http://circimaging.ahajournals.org/ Downloaded from at INSERM - DISC on October 24, 2013 http://circimaging.ahajournals.org/ Downloaded from at INSERM - DISC on October 24, 2013 http://circimaging.ahajournals.org/ Downloaded from at INSERM - DISC on October 24, 2013 http://circimaging.ahajournals.org/ Downloaded from at INSERM - DISC on October 24, 2013 http://circimaging.ahajournals.org/ Downloaded from at INSERM - DISC on October 24, 2013 http://circimaging.ahajournals.org/ Downloaded from at INSERM - DISC on October 24, 2013 http://circimaging.ahajournals.org/ Downloaded from at INSERM - DISC on October 24, 2013 http://circimaging.ahajournals.org/ Downloaded from
Transcript of Zhang, Bo Yu, Tsunekazu Kakuta and Ik-Kyung Jang Circ ... · Methods and Results—We identified...

Zhang, Bo Yu, Tsunekazu Kakuta and Ik-Kyung JangJinwei Tian, Sining Hu, Robert W. Yeh, Rahul Sakhuja, Iris McNulty, Hang Lee, Shaosong
Seung-Jung Park, Stephen Lee, Soo-Joong Kim, Haibo Jia, Rocco Vergallo, Farhad Abtahian, Taishi Yonetsu, Koji Kato, Shiro Uemura, Byeong-Keuk Kim, Yangsoo Jang, Soo-Jin Kang,
Assessed by 3-Vessel Optical Coherence TomographyFeatures of Coronary Plaque in Patients With Metabolic Syndrome and Diabetes Mellitus
Print ISSN: 1941-9651. Online ISSN: 1942-0080 Copyright © 2013 American Heart Association, Inc. All rights reserved.
Dallas, TX 75231is published by the American Heart Association, 7272 Greenville Avenue,Circulation: Cardiovascular Imaging
doi: 10.1161/CIRCIMAGING.113.0003452013;6:665-673; originally published online August 6, 2013;Circ Cardiovasc Imaging.
http://circimaging.ahajournals.org/content/6/5/665World Wide Web at:
The online version of this article, along with updated information and services, is located on the
http://circimaging.ahajournals.org/content/suppl/2013/08/06/CIRCIMAGING.113.000345.DC1.htmlData Supplement (unedited) at:
http://circimaging.ahajournals.org//subscriptions/
is online at: Circulation: Cardiovascular Imaging Information about subscribing to Subscriptions:
http://www.lww.com/reprints Information about reprints can be found online at: Reprints:
document. Permissions and Rights Question and Answer information about this process is available in the
requested is located, click Request Permissions in the middle column of the Web page under Services. FurtherCenter, not the Editorial Office. Once the online version of the published article for which permission is being
can be obtained via RightsLink, a service of the Copyright ClearanceCirculation: Cardiovascular Imagingin Requests for permissions to reproduce figures, tables, or portions of articles originally publishedPermissions:
at INSERM - DISC on October 24, 2013http://circimaging.ahajournals.org/Downloaded from at INSERM - DISC on October 24, 2013http://circimaging.ahajournals.org/Downloaded from at INSERM - DISC on October 24, 2013http://circimaging.ahajournals.org/Downloaded from at INSERM - DISC on October 24, 2013http://circimaging.ahajournals.org/Downloaded from at INSERM - DISC on October 24, 2013http://circimaging.ahajournals.org/Downloaded from at INSERM - DISC on October 24, 2013http://circimaging.ahajournals.org/Downloaded from at INSERM - DISC on October 24, 2013http://circimaging.ahajournals.org/Downloaded from at INSERM - DISC on October 24, 2013http://circimaging.ahajournals.org/Downloaded from at INSERM - DISC on October 24, 2013http://circimaging.ahajournals.org/Downloaded from at INSERM - DISC on October 24, 2013http://circimaging.ahajournals.org/Downloaded from at INSERM - DISC on October 24, 2013http://circimaging.ahajournals.org/Downloaded from at INSERM - DISC on October 24, 2013http://circimaging.ahajournals.org/Downloaded from

665
Metabolic syndrome (MetS) is defined by a set of inter-related clinical features that includes obe-
sity, hypertension, dyslipidemia, and hyperglycemia.1,2 The association and clustering of these factors have been extensively studied, and previous studies have revealed an association between MetS and a higher incidence of
cardiovascular events.3,4 Despite many clinical and epi-demiological studies that have reported an elevated risk for cardiovascular disease in patients with MetS, unique coronary plaque characteristics in patients with MetS have not been identified. A further understanding of the patho-physiology of coronary artery atherosclerosis in MetS may enable us to better understand and treat ischemic heart dis-ease in this population.
Background—The pathophysiological basis for the association between metabolic syndrome (MetS) and coronary artery disease is not well understood. We sought to characterize coronary plaques in patients with MetS by using optical coherence tomography.
Methods and Results—We identified 451 coronary plaques from 171 subjects who underwent optical coherence tomographic imaging in 3 coronary arteries. Subjects were divided into 3 groups: diabetes mellitus (DM, n=77), MetS (n=35), and a control group (C group, n=59) without DM or MetS. Optical coherence tomographic analysis included the presence of lipid-rich plaque, maximum lipid arc, lipid-core length, lipid index (LI), fibrous cap thickness, and thin-cap fibroatheroma. We defined LI as mean lipid arc multiplied by lipid-core length. Lipid-core length and LI were significantly greater in DM and MetS than in C group (lipid-core length: 7.7±4.0 and 7.0±3.8 versus 5.5±2.4 mm; P<0.001 and P=0.012, and LI: 1164±716 and 1086±693 versus 796±417 mm; P<0.001 and P=0.008). Maximum lipid arc was significantly greater in DM than in C group, whereas no significant difference was observed between MetS and C group (196±45°, 187±42° versus 176±52°; P=0.002 and P=0.182). Fibrous cap thickness and thin-cap fibroatheroma showed no significant difference among the 3 groups. In multivariate analysis, DM and MetS were independently associated with LI, whereas only acute coronary syndrome was the independent predictor for thin-cap fibroatheroma.
Conclusions—Compared with control subjects, coronary plaques in MetS contain larger lipid. However, the MetS criteria used in this study could not distinguish the vulnerable features such as thin-cap fibroatheroma, suggesting the necessity of complementary information to identify patients at high risk for cardiovascular events. (Circ Cardiovasc Imaging. 2013;6:665-673.)
Key Words: diabetes mellitus ◼ metabolic syndrome ◼ plaque ◼ tomography, optical coherence
© 2013 American Heart Association, Inc.
Circ Cardiovasc Imaging is available at http://circimaging.ahajournals.org DOI: 10.1161/CIRCIMAGING.113.000345
Received February 21, 2013; accepted July 18, 2013.From the Cardiology Division (T.Y., K.K., S.-J.K., H.J., R.V., F.A., J.T., S.H., R.W.Y., I.M., I.-K.J.) and Biostatistics Center (H.L.), Massachusetts General
Hospital, Harvard Medical School, Boston, MA; First Department of Medicine, Nara Medical University, Nara, Japan (S.U.); Severance Cardiovascular Hospital, Yonsei University, Seoul, Republic of Korea (B.-K.K., Y.J.); Asan Medical Center, Seoul, Republic of Korea (S.-J.K., S.-J.P.); Queen Mary Hospital, Hong Kong University, Hong Kong, China (S.L.); Division of Cardiology, College of Medicine, Kyung Hee University, Seoul, Republic of Korea (S.-J.K.); Department of Cardiology, the 2nd Affiliated Hospital of Harbin Medical University, Harbin, P.R. China (H.J., J.T., S.H., B.Y.); Key Laboratory of Myocardial Ischemia, Chinese Ministry of Education, Harbin, P.R. China (H.J., J.T., S.H., B.Y.); Cardiovascular Medicine/Intervention and Structural Heart Disease, Wellmont CVA Heart Institute, Kingsport, TN (R.S.); LightLab Imaging Inc, Westford, MA (S.Z.); Harbin Medical University, Harbin, P.R. China (S.Z.); and Tsuchiura Kyodo Hospital, Tsuchiura, Japan (T.K.).
The online-only Data Supplement is available at http://circimaging.ahajournals.org/lookup/suppl/doi:10.1161/CIRCIMAGING.113.000345/-/DC1.Correspondence to Bo Yu, MD, PhD, Department of Cardiology, The 2nd Affiliated Hospital of Harbin Medical University, Key Laboratory of Myocardial
Ischemia (Harbin Medical University), Chinese Ministry of Education, Harbin, P.R. China 150086. E-mail [email protected]
Features of Coronary Plaque in Patients With Metabolic Syndrome and Diabetes Mellitus Assessed by 3-Vessel
Optical Coherence TomographyTaishi Yonetsu, MD; Koji Kato, MD, PhD; Shiro Uemura, MD, PhD;
Byeong-Keuk Kim, MD, PhD; Yangsoo Jang, MD, PhD; Soo-Jin Kang, MD, PhD; Seung-Jung Park, MD, PhD; Stephen Lee, MD, FRCP; Soo-Joong Kim, MD, PhD;
Haibo Jia, MD, PhD; Rocco Vergallo, MD; Farhad Abtahian, MD, PhD; Jinwei Tian, MD, PhD; Sining Hu, MD, PhD; Robert W. Yeh, MD, MSc; Rahul Sakhuja, MD, MPP, MSc; Iris McNulty, RN; Hang Lee, PhD; Shaosong Zhang, MD, PhD; Bo Yu, MD, PhD;
Tsunekazu Kakuta, MD, PhD; Ik-Kyung Jang, MD, PhD
Original Article
Clinical Perspective on p 673

666 Circ Cardiovasc Imaging September 2013
Optical coherence tomography (OCT) is an intravascular imaging technique that allows for high resolution visualization of the coronary arteries.5,6 OCT can provide detailed structural information on intracoronary pathology, including atheroscle-rotic plaques in vivo. As such, it provides a unique platform to evaluate the association between MetS and coronary artery pathology. The purpose of this study was to determine the coronary plaque characteristics of subjects with MetS in com-parison with subjects who are diabetic and normoglycemic by using OCT.
MethodsStudy PopulationThe Massachusetts General Hospital OCT Registry is an ongoing multicenter registry of patients undergoing OCT of the coronary arteries and includes 20 sites across 6 countries. Patient selection for the present study is summarized in Figure 1. In a total of 1406 subjects who were enrolled in the registry between August 2010 and May 2012, a total of 255 subjects underwent OCT imaging of all 3 major epicardial coronary arteries during the same procedure. Only patients with complete information on clinical history, laboratory data, and physical status and those with sufficient image quality for all 3 vessels were selected. Therefore, 198 subjects with complete demographic data and sufficient 3-vessel OCT images were identi-fied. From this cohort, we selected the patients who had nonculprit or nontarget coronary plaques with area stenosis >50% as measured by OCT. Patients without any nonculprit plaques were also excluded. In-stent restenosis and lesions that required balloon angioplasty be-fore OCT imaging were excluded. The final data set comprised 451 plaques from 171 subjects. Subjects were divided into 3 groups: those with diabetes mellitus (DM group, 206 plaques in 77 subjects), non-DM subjects with MetS (MetS group, 102 plaques in 35 subjects), and subjects without DM or MetS (control group [C] group, 143 plaques in 59 subjects; Figure 2). The registry was approved by the institutional review board in each participating site, and all subjects provided informed consent.
MetS FactorsDM was diagnosed in the participating site based on the American Diabetes Association definition if the patient had ≥1 of the follow-ing criteria: fasting glucose ≥126 mg/dL, 2-hour plasma glucose level ≥200 mg/dL in the oral glucose tolerance test, classic symptom with casual plasma glucose level ≥200 mg/dL or A1c ≥6.5%.7 Patients who were taking hypoglycemic agents were also diagnosed as DM in the present study. MetS was based on the definition established in the Joint Scientific Statement as a subject with ≥3 of the follow-ing: waist circumference ≥102 cm for men or ≥88 cm for women;
triglycerides ≥150 mg/dL; high-density lipoprotein cholesterol ≤40 mg/dL; blood pressure ≥135/85 mm Hg; and fasting blood glucose level ≥100 mg/dL.1 In the present study, we used body mass index (BMI) as a substitute for waist circumference because data on waist circumference were not obtained in our registry. We used a BMI cut-off of 29.4 kg/m2 for men and 26.7 kg/m2 for women as previously reported.8,9 In addition, history of hypertension was used as an alterna-tive for the presence of documented blood pressure ≥135/85 mm Hg because the majority of subjects had been treated with antihyperten-sive agents. Therefore, MetS was defined by the presence of 3 or more MetS factors of the following: (1) BMI ≥29.4 kg/m2 for men and 26.7 kg/m2 for women; (2) triglycerides ≥150 mg/dL; (3) high-density lipoprotein cholesterol ≤40 mg/dL; (4) history of hypertension; and (5) fasting blood glucose level ≥100 mg/dL, as shown in Figure 2.
Coronary AngiographyCoronary angiograms were analyzed by offline quantitative coro-nary angiography (CAAS version 5.10.1, Pie Medical Imaging BV. Maastricht, The Netherlands). Reference diameter, minimum lumen diameter, diameter stenosis, and lesion length were measured.
OCT Image AcquisitionEither the time-domain (M2/M3 Cardiology Imaging System, LightLab Imaging, Inc, Westford, MA) or frequency-domain OCT system (C7-XR OCT Intravascular Imaging System, St. Jude Medical, St. Paul, MN) was used in the study. The intracoronary OCT imaging technique has been previously described.10 In brief, with the M2/M3 system, an occlusion balloon (Helios, LightLab Imaging Inc,
1406 SubjectsEnrolled between Aug 2010 to May 2012
2 vessel imagingN=332
1 vessel imagingN=819
3 vessel imagingN=255
Exclusion
198 Subjects with 3 vessels imaging
451 Non-culprit / Non-target plaques from 171 Subjects
Insufficient image quality (n=27)Incomplete demographic data (n=30)
Non-culprit / Non-target plaques >50% area stenosis
Figure 1. Study population. From the subjects who were enrolled in the Massachusetts General Hospital optical coherence tomography (OCT) registry, we selected those who underwent OCT investigations for 3 coronary vessels in the same procedure. After exclusion of the subjects who had insufficient image quality and incomplete demographic data, a total of 198 subjects were analyzed, and 451 plaques from 171 subjects were identified in the final data set.
DM group: 77 subjects
Non-DM patients: 94 subjects
206 plaques
MetS group: 35 subjects
MetS Factors• BMI ≥ 29.4 kg/m2 for men and 26.7 kg/m2 for women; • triglycerides ≥ 150 mg/dl; • HDL-C £ 40 mg/dl; • history of hypertension; • fasting blood glucose level ≥ 100 mg/dl
≥3 factors
<3 factors C group: 59 subjects
102 plaques
143 plaques
Figure 2. Categorization of subjects. Subjects were divided into 3 groups: subjects with diabetes mellitus (DM group), nondia-betic subjects with metabolic syndrome (MetS group), and sub-jects without DM or MetS (control group [C group]). Subjects with ≥3 MetS factors were diagnosed as MetS. BMI indicates body mass index; and HDL-C, high-density lipoprotein cholesterol.

Yonetsu et al Plaque Characteristics in Metabolic Syndrome 667
Westford, MA) is advanced proximal to the lesion and inflated ≤0.4 to 0.6 atm during image acquisition. The imaging wire is automatically pulled back from distal to proximal at 1.0 to 3.0 mm/s, and saline is continuously infused from the tip of occlusion balloon. With the C7 system, a 2.7 F OCT imaging catheter (Dragonfly, LightLab Imaging Inc, Westford, MA) is advanced distal to the lesion, and automatic pullback is started as soon as the blood is cleared. All images were digitally stored, deidentified, and submitted to the Massachusetts General Hospital (Boston, MA) for analysis.
OCT Image AnalysisEach plaque was classified as lipid-rich or fibrous plaque. We de-fined lipid as a diffusely bordered signal-poor region with signal at-tenuation by the overlying signal-rich layer, and lipid-rich plaque as a plaque with lipid >90°.5 For lipid-rich plaque, we determined lipid arc, lipid-core length, thinnest fibrous cap thickness (FCT), as well as the presence of thin-cap fibroatheroma (TCFA), macrophage ac-cumulation, cholesterol crystal, and microvessels (Figure 3). Lipid arc was measured every 1 mm within a lipid-rich plaque, and mean and maximum values were recorded (Figure 3A). Lipid-core length was defined as the length of plaque with >90° of lipid and measured on the longitudinal view (Figure 3B). We also calculated the lipid in-dex, which was defined as the mean lipid arc multiplied by lipid-core length.10 The thinnest FCT of a lipid-rich plaque was measured at the thinnest part 3×, and the values were then averaged (Figure 3C). TCFA was defined as a lipid-rich plaque with a maximum lipid arc >90° and FCT ≤65 µm.11 Macrophage accumulation on the OCT images was defined as increased signal intensity within the plaque, accompanied by heterogeneous backward shadows (Figure 3D).12,13 Cholesterol crystals were characterized as thin and linear regions of high intensity existing beside lipid core.14 Microvessels were defined as small vesicular or tubular structures with diameters 50 to 300 μm and differentiated from any other branch (Figure 3E).15 Plaque disrup-tion was defined as a discontinuity of the fibrous cap with communi-cation between the vessel lumen and the cavity. Calcification was also recorded when an area with low backscatter and a sharp border was identified inside a plaque.16 OCT images were analyzed by 2 investi-gators who were blinded to the subject’s information. When there was
discordance between the readers, a consensus reading was obtained from a third independent investigator.
Statistical AnalysisCategorical data were presented as counts and proportions and were compared using either a χ2 test or Fisher exact test, depending on the data. Continuous measurements were presented as mean±SD and analyzed with the ANOVA and Bonferroni correction for mul-tiple comparisons. For comparisons between groups, analysis was performed by means of the generalized estimating equations ap-proach to take into account the within-subject correlation attribut-able to multiple plaques analyzed within a single subject. Multiple linear regression and logistic regression analyses were performed to assess the independent predictors for lipid index and the pres-ence of TCFA. Multiple regression models included the parameters that showed statistical significance with the P<0.05 in the univariate analysis. The correlation between OCT parameters and the number of MetS factors was analyzed with Spearman rank correlation coef-ficients. Interobserver and intraobserver reliabilities were estimated by means of κ coefficient for binary outcomes and intraclass correla-tion coefficient for continuous measurements. All statistical analyses were performed with SPSS version 17.0. A P<0.05 was considered statistically significant.
ResultsClinical CharacteristicsPatient characteristics are summarized in Table 1. As expected, there were significant differences between the 3 groups. A his-tory of hypertension was significantly more frequent in the DM and MetS groups than in the C group. Body weight, BMI, and triglyceride level were significantly greater in the MetS group than in the C group. High-density lipoprotein choles-terol was significantly lower in MetS than in the C group. Fasting blood glucose level was significantly different among the 3 groups, and the highest in the DM group. The number
Figure 3. Representative images for optical coherence tomographic (OCT) analyses. A, Measurement of lipid arc for a lipid-rich plaque. Lipid arc was measured every 1 mm within a lipid-rich plaque (yellow lines). B, Lipid-core length, defined as the length of plaque with >90° of lipid, was measured in the longitudinal view (white arrow). C, Measurement of fibrous cap thickness. Fibrous cap thickness was measured at the thinnest part 3×, and the values were averaged (white arrows). D, Macrophage accumulation on the OCT images was defined as increased signal intensity within the fibrous cap, accompanied by heterogeneous backward shadows (arrow heads). E, Microvessels were defined as small vesicular or tubular structures with diameters 50 to 300 μm and differentiated from any other branch (green arrow).

668 Circ Cardiovasc Imaging September 2013
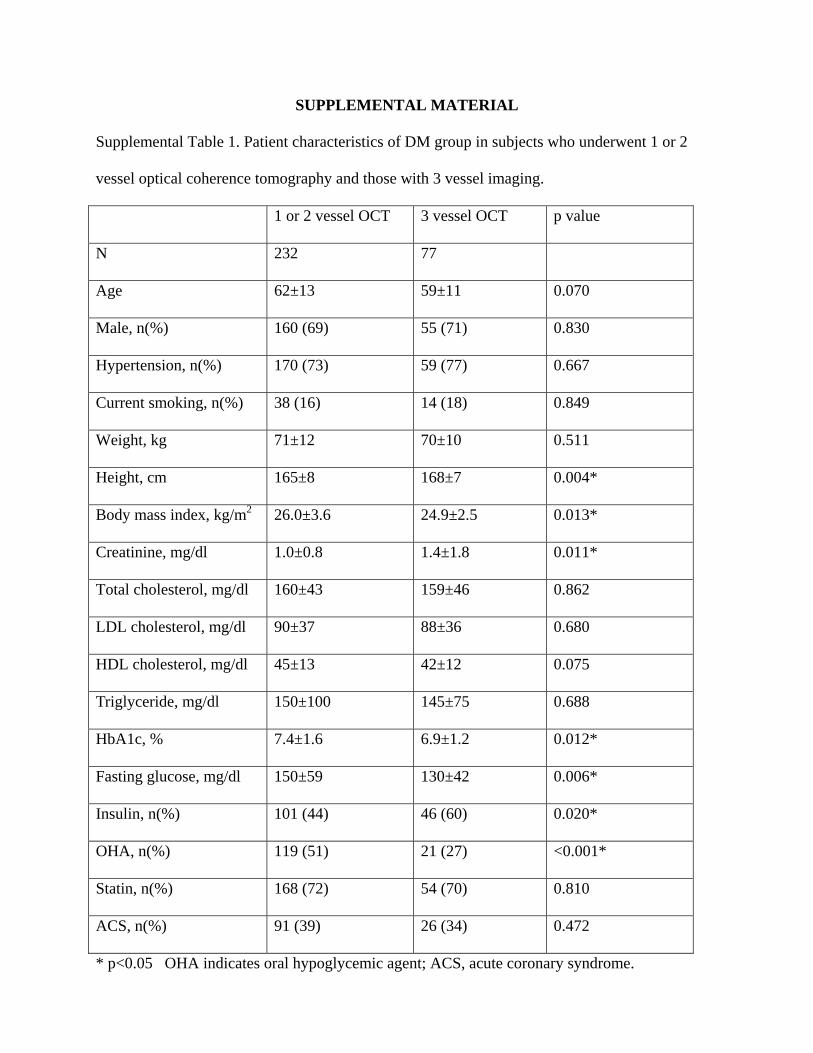
of factors for MetS was significantly higher in the MetS group (3.4±0.5) as compared with the DM (2.8±1.0) and C (1.5±0.6) groups (P=0.002 and P<0.001). Patient characteristics of DM group or MetS group in the study cohort (3-vessel imaging cohort) were compared with those in the subjects of the reg-istry who underwent OCT imaging for 1 or 2 coronary ves-sels in Tables I and II in the online-only Data Supplement. As compared with the 1- or 2-vessel OCT imaging cohort,
patients with DM in 3-vessel imaging cohort had lower hemo-globin A1c level possibly because of aggressive treatment including more frequent use of insulin.
Three-Vessel OCT Imaging and Angiographic FindingsThe mean total length of coronary arteries imaged by OCT was 221±45 mm; 94±25 mm in the right coronary artery, 72±23 mm in the left anterodescending coronary artery, and 55±18 mm in the circumflex. There was no significant dif-ference in total imaged length among the DM, MetS, and C groups (205±41, 215±42, and 215±43 mm; P=0.302). Plaque location and angiographic data are shown in Table 2. There was no significant difference in plaque location and angio-graphic data among the 3 groups.
OCT FindingsThe OCT findings from each group are summarized in Table 3. There were no significant differences in the number of plaques per subject and the prevalence of lipid-rich plaque among the 3 groups. Maximum lipid arc, lipid-core length, and lipid index were significantly greater in the DM group than those in the C group. Subjects with MetS showed a sig-nificantly longer lipid length and a greater lipid index as com-pared with those in C group. No significant difference was observed between DM and MetS in maximum lipid arc, lipid-core length, and lipid index. FCT only showed a trend toward smaller value in the DM and MetS groups as compared with C group. There were no significant differences in the preva-lence and number of TCFA across the 3 groups. Calcification was more frequent in plaques of subjects with DM than in those of subjects with MetS. The prevalence of other micro-structures, such as macrophage accumulation, microvessels, or cholesterol crystals, was not statistically different among the 3 groups.
Correlation Between the Number of MetS Factors and Lipid-Rich PlaqueMaximum lipid arc, lipid-core length, and lipid index increased linearly as the number of MetS factors increased. Although the linear trends with positive slopes were statisti-cally significant, their magnitudes of the explained variations by the number of MetS factors were not large (maximum lipid arc: ρ=0.182; P=0.005, lipid-core length: ρ=0.202; P=0.002,
Table 2. Angiographic Data
DM MetS C P Value
Plaque location
RCA, n (%) 82 (39.8) 35 (34.3) 58 (40.5)
LAD, n (%) 74 (35.9) 36 (35.3) 54 (37.8) 0.612
Cx, n (%) 50 (24.3) 31 (30.4) 31 (21.7)
Minimum lumen diameter, mm 1.87±0.55 1.88±0.47 1.92±0.54 0.797
Reference diameter, mm 2.87±0.66 2.87±0.55 2.96±0.64 0.474
Lesion length, mm 9.1±3.9 9.8±4.3 9.3±4.6 0.518
Diameter stenosis, % 34.5±13.4 33.3±11.9 35.1±12.1 0.687
C indicates control group; Cx, circumflex; DM, diabetes mellitus; LAD, left anterodescending artery; MetS, metabolic syndrome; and RCA, right coronary artery.
Table 1. Patient Characteristics
DM MetS C P Value
n 77 35 59
Age, y 59±11 60±11 60±11 0.948
Men, n (%) 55 (71) 28 (80) 48 (81) 0.347
Hypertension, n (%) 59 (77)* 29 (83)* 30 (51) <0.001
Smoking, n (%) 14 (18) 9 (26) 16 (27) 0.422
Weight, kg 70±10* 71±8* 66±9 0.012
Height, cm 168±7 168±6 166±8 0.505
Body mass index, kg/m2 24.9±2.5* 25.1±2.0* 23.8±2.8 0.016
Creatinine, mg/dL 1.4±1.8 1.0±0.2 1.2±1.4 0.274
Total cholesterol, mg/dL 159±46 159±37 168±39 0.428
LDL cholesterol, mg/dL 88±36 89±28 94±34 0.545
HDL cholesterol, mg/dL 42±12 38±3* 47±13 0.001
Triglyceride, mg/dL 145±75 217±145* 119±52 <0.001
HbA1c, % 6.9±1.2* 5.6±0.5 5.5±0.4 <0.001
Fasting glucose, mg/dL 130±42* 107±14 93±11 <0.001
Antidiabetic therapy
Exercise/diet 16 (21) 0 (0) 0 (0)
Oral hypoglycemic agents 21 (27) 0 (0) 0 (0)
Insulin use 46 (60) 0 (0) 0 (0)
Statin 54 (70) 21 (60) 37 (63) 0.496
ACE-I or ARB 32 (42) 17 (49) 28 (47) 0.707
Acute coronary syndrome 26 (34) 15 (43) 15 (24) 0.155
STEMI 7 (9) 4 (11) 7 (12) 0.856
NSTEMI/UAP 19 (25) 11 (31) 8 (14) 0.103
ACE-I indicates angiotensin-converting enzyme inhibitor; ARB, angiotensin-II receptor blocker; C, control group; DM, diabetes mellitus; HbA1c, hemoglobin A1c; HDL, high-density lipoprotein; LDL, low-density lipoprotein; MetS, metabolic syndrome; NSTEMI, non–ST-elevation myocardial infarction; STEMI, ST-elevation myocardial infarction; and UAP, unstable angina.
*P<0.05 vs C.

Yonetsu et al Plaque Characteristics in Metabolic Syndrome 669
and lipid index: ρ=0.225; P<0.001). No significant correlation was observed for FCT (ρ=−0.116; P=0.075; Figure 4).
Multiple Regression Analyses for Lipid Index and TCFAMultiple linear regression and logistic regression analyses were performed to assess the determinants of lipid index and the presence of TCFA. As shown in Table 4, DM and MetS were independently associated with greater lipid index. How-ever, only ACS presentation was independently associated with TCFA although DM and MetS did not show significant trend.
Observer VariabilitiesThe estimated interobserver and intraobserver κ coefficients were 0.90 and 0.93 for the presence of lipid-rich plaque and 0.84 and 0.84 for the presence of microvessels. Intraclass cor-relations were 0.87 and 0.97 for mean lipid arc and 0.86 and 0.90 for lipid-core length, respectively.
DiscussionTo our knowledge, this is the first OCT study investigating in detail the plaque characteristics of patients with MetS in comparison with patients with DM and those without DM or MetS. Our OCT data demonstrated that (1) subjects with MetS had larger lipid burden compared with those without MetS, (2) frequency of TCFA did not differ among subjects with DM, those with MetS, and those without DM or MetS, (3) the prevalence of microstructure, such as macrophage accumulation, microvessels, and cholesterol crystals, did not show any significant differences among the 3 groups.
Lipid-Rich PlaqueOne of the important components of rupture-prone plaque is a large necrotic core, which may physically increase the tension
of fibrous cap covering the lipid core and lead to disruption.17 Several pathological and virtual histology-intravascular ultra-sound studies have shown that coronary plaques in noncul-prit lesions of patients with DM had larger plaque burdens and a larger necrotic core than in those of the patients without DM,11,18,19 which is consistent with our data. However, a recent OCT study by Niccoli et al20 demonstrated smaller lipid arc, larger calcium, and comparable FCT in the culprit lesions of DM at the first ACS manifestations as compared with non-DM patients. Their results suggest that even small amount of lipid may be able to cause an acute coronary syndrome in patients with DM, which supports the importance of aggressive lipid-lowering therapy in patients with DM for primary or second-ary prevention. Although the pathophysiological features of atherosclerosis in DM have been substantially explored, those in MetS have not been elucidated. The present study dem-onstrates a greater amount of lipid in nonculprit/nontarget plaques in subjects with MetS as compared with plaques in subjects without MetS or DM. These results support the previ-ous virtual histology-intravascular ultrasound studies report-ing a greater percentage of necrotic core in patients with MetS than in those without MetS.19,21
TCFA and FCTAlthough the variability and heterogeneity of FCT at the time of plaque rupture have been reported in vivo,22,23 thin fibrous cap (<65 µm) defined by pathological study11 has been recog-nized as the most critical feature of vulnerable plaque. How-ever, there was no significant trend in the frequency of TCFA and FCT across the 3 groups in the present study, whereas the extent of lipid expressed by lipid index was greater in DM and MetS groups. A previous virtual histology-intravascular ultra-sound study showed a high prevalence of TCFA in patients with DM and MetS.19 However, a larger cohort of subanalysis
Table 3. OCT Analysis
DM MetS C
P Value
Overall DM vs C MetS vs C DM vs MetS
No. of subjects 77 35 59
No. of plaques 206 102 143
Plaques/subjects 2.7±1.5 2.9±1.4 2.4±1.4 0.275 … … …
Lipid-rich plaques 100 (52.1) 56 (54.9) 81 (56.6) 0.701 … … …
Maximum lipid arc 196±45* 187±42 176±52 0.016 0.002 0.184 0.173
Lipid length 7.7±4.0* 7.0±3.8* 5.5±2.4 0.001 <0.001 0.012 0.317
Lipid index 1164±716* 1086±693* 796±417 0.001 <0.001 0.018 0.475
FCT 105±46 117±62 123±60 0.088 … … …
TCFA 25 (12.1) 14 (13.7) 11 (7.7) 0.270 … … …
No. of TCFA/subject 0.32±0.68 0.40±0.70 0.19±0.51 0.236 … … …
Disruption 11 (5.3) 10 (9.8) 8 (5.6) 0.340 … … …
Calcification 90 (43.7) 30 (29.4) 59 (41.3) 0.048 0.462 0.123 0.028
Macrophage accumulation 64 (31.1) 32 (31.4) 40 (28.0) 0.788 … … …
Microvessels 74 (35.9) 46 (45.1) 45 (31.5) 0.089 … … …
Cholesterol crystal 40 (19.4) 18 (17.6) 20 (19.6) 0.416 … … …
C indicates control group; DM, diabetes mellitus; FCT, fibrous cap thickness; MetS, metabolic syndrome; OCT, optical coherence tomography; and TCFA, thin-cap fibroatheroma.
*<0.05 vs C.

670 Circ Cardiovasc Imaging September 2013
in PROSPECT trial showed insignificant association of MetS with the presence of virtual histology–derived TCFA.21 These inconsistent results may reflect the ambiguous effect of MetS on plaque instability. In a previous intravascular ultrasound and OCT study, Takarada et al24 reported that FCT was signifi-cantly correlated with high-sensitive C reactive protein rather than with lipid profiles, whereas atheroma volume showed a significant correlation only with cholesterol profiles. Their results suggested different mechanisms of regulation between lipid volume and FCT. Although several formal definitions of MetS have been proposed so far, the traditional definition that served as the basis for the present study does not include bio-markers of inflammation. These markers are likely to correlate more strongly with structural features of plaque vulnerability, including the development of thin fibrous cap. Indeed, only the independent predictor for TCFA in the present study was the clinical presentation of ACS, which is related to systemic inflammation. Previous studies demonstrated that stratifica-tion by inflammatory status indicated by high-sensitive C reactive protein adds prognostic information to the diagnosis of MetS.8,25 The lack of a significant association between MetS and FCT or TCFA in the present study likely results from the incompleteness of traditional MetS criteria. Additional infor-mation including inflammatory markers might be helpful for better differentiation of plaque vulnerability in addition to the diagnosis of MetS and DM.
Number of Factors and LipidAlthough each factor of MetS is known separately to be a cardiovascular risk factor, it is generally accepted that the combination of those components and their inter-relationship lead to the progression of atherosclerosis.26 However, some studies have cast doubt on the association between MetS and cardiovascular events.27,28 In the present study, multiple linear regression analysis demonstrated that MetS is an independent predictor for large amount of lipid. However, caution should be exercised when interpreting these data. As shown in Fig-ure 4, correlations between the number of MetS factors and OCT findings including lipid index and FCT were mild, and significant overlaps were found across the number of MetS factors (Figure 4). In other words, MetS does not provide additive predictive values beyond its individual components. Furthermore, these OCT parameters are just surrogates of the extent of lipid, which may not be necessarily associated with the risk of future cardiovascular events.
Microstructures Observed in OCTOCT is a unique in vivo intravascular imaging modality that allows for visualization of microstructures such as macrophage accumulation, microvessels, and cholesterol crystals.12,13,29,30 These microscopic changes are affected by multiple factors such as systemic inflammation, hypoxia, oxidative stress, and statin therapy.31,32 Although DM and MetS were expected to
Figure 4. Correlation between the number of metabolic syndrome (MetS) factors and plaque characteristics as represented by lipid index and fibrous cap thickness. A, Correlation between the number of MetS factors and maximum lipid arc (ρ=0.182; P=0.005). B, Correlation between the number of MetS factors and lipid-core length (ρ=0.202; P=0.002). C, Correlation between the number of MetS factors and lipid index (ρ=0.225; P<0.001). D, Correlation between the number of factors and thinnest fibrous cap thickness (FCT; ρ=−0.116; P=0.075).

Yonetsu et al Plaque Characteristics in Metabolic Syndrome 671
have impacts on these factors, our data showed only a weak trend toward more frequent microvessels in DM and MetS groups (P=0.091). The statin use and low-density lipoprotein cholesterol levels were not different among the groups at the time of OCT imaging (P=0.496 and P=0.545, respectively). Unfortunately, we do not have information on the previous low-density lipoprotein cholesterol levels and duration of statin therapy. A prospective systemic study may elucidate this relationship.
Calcification in DM and MetSThe present study showed higher prevalence of calcification in plaques of subjects with DM as compared with those of subjects with MetS in nonculprit or nontarget lesions. Our data are consistent with a previous computed tomographic study that revealed an intermediate association between MetS and Agatston score by multidetector computed tomography, whereas patients with DM showed remarkable association with greater calcium scores regardless of MetS.33 A recent OCT study also demonstrated more frequent superficial cal-cium and larger calcium amount in the culprit vessels of ACS in patients with DM as compared with non-DM patients,20 which is also consistent with our data. One of the advantages of OCT imaging for the evaluation of calcium is the potential
to detect a small calcification in the plaque and to determine the morphological characteristics of calcium such as nodular calcium. As of now, the nature and process of coronary calci-fication have not been well studied in vivo. Further study with use of serial OCT imaging would be warranted to understand the pathophysiology of coronary calcification.
LimitationsThe present study has several limitations. First, this study is a retrospective observational study from a registry database; therefore, selection bias may have influenced the results. In addition, we selected the patients who underwent 3-vessel OCT investigation to diminish the bias from the studied ves-sel. However, there still might have been a selection bias as shown in Tables I and II in the online-only Data Supplement. Second, our OCT registry data did not include information on waist circumference, so we used BMI as a substitute for the determination of obesity. Moreover, the presence of high blood pressure was substituted with the history of hypertension. Our modified definition of MetS may have affected the results. Third, we included only plaques with area stenosis >50% as indicated by OCT. Although this criterion is accepted in the consensus documents,34 it is the criteria for a stenosis rather than the definition of a plaque. Early stages of atherosclerosis
Table 4. Multiple Linear and Logistic Regression Models for Lipid Index and Fibrous Cap Thickness
Univariate Models
B SE
95% CI
VIF P ValueB SE
95% CI
P ValueLower Upper Lower Upper
Lipid index
Age −4.5 4.0 −12.3 3.4 0.266
Men 131.7 104.5 −73.1 336.5 0.208
Hypertension 75.6 103.7 −127.5 278.9 0.466
Hyperlipidemia 209.8 85.5 42.2 377.4 0.014 61.2 109.6 −154.9 277.3 1.164 0.577
Diabetes mellitus 239.0 90.4 61.8 416.2 0.008 179.6 85.1 11.9 347.4 1.084 0.036
Current smoker 127.5 113.5 −95.0 349.9 0.261
Metabolic syndrome 317.8 90.2 141.0 494.5 <0.001 211.1 93.1 27.6 394.6 1.332 0.024
Statin use −100.9 95.9 −288.8 87.0 0.293
ACE-I/ARB use −74.5 93.4 −257.6 108.5 0.425
Acute coronary syndrome
218.6 87.4 47.3 389.9 0.012 90.5 86.5 −80.0 261.0 1.133 0.297
TCFA
Age 0.00 0.02 −0.05 0.04 0.874
Men 0.34 0.50 −0.65 1.33 0.502
Hypertension −0.33 0.38 −1.08 0.43 0.396
Hyperlipidemia 0.00 0.45 −0.87 0.88 0.992
Diabetes mellitus 0.19 0.36 −0.52 0.89 0.605
Current smoker 0.87 0.39 0.11 1.63 0.024 0.53 0.35 −0.17 1.22 1.080 0.136
Metabolic syndrome 0.53 0.37 −0.19 1.25 0.147
Statin use −0.82 0.35 −1.51 −0.13 0.020 −0.49 0.35 −1.17 0.19 1.144 0.155
ACE-I/ARB use −0.09 0.37 −0.81 0.63 0.811
Acute coronary syndrome
1.23 0.37 0.50 1.96 0.001 0.89 0.36 0.18 1.60 1.085 0.014
ACE-I indicates angiotensin-converting enzyme inhibitor; ARB, angiotensin-II receptor blocker; CI, confidence interval; TCFA, thin-cap fibroatheroma; and VIF, variance inflation factor.

672 Circ Cardiovasc Imaging September 2013
with expansive remodeling may have been excluded. Fourth, no inflammatory markers such as high-sensitive C reactive protein were assessed in this study. Fifth, the duration and type of DM were not available in the registry, which might have influenced plaque characteristics. Sixth, we used lipid index calculated from OCT parameters. However, this value is a surrogate of the necrotic core burden. Finally, a lack of longitudinal follow-up data did not allow for the assessment of the clinical impact of OCT findings on the future events.
ConclusionsPlaques in subjects with MetS contain larger lipid content than those in subjects without MetS, whereas FCT was not signifi-cantly associated with the diagnosis of MetS.
Sources of FundingThis study was supported by research grants from St. Jude Medical, the Cardiology Division of Massachusetts General Hospital, and Dr John Nam Fellowship Grant.
DisclosuresDr Jang received a research grant and consulting fee from LightLab Imaging/St. Jude Medical, and Dr Zhang is an employee of LightLab Imaging/St. Jude Medical. Dr Vergallo received a grant from the Enrico ed Enrica Sovena Foundation, Rome, Italy. Dr Jia has received a grant from the National Natural Science Foundation of China (grant contract no. 81200076). Dr Yu received a grant from the National Natural Science Foundation of China (grant contract no. 30871064/C140401). The other authors report no conflict.
References 1. Alberti KG, Eckel RH, Grundy SM, Zimmet PZ, Cleeman JI, Donato KA,
Fruchart JC, James WP, Loria CM, Smith SC Jr. Harmonizing the meta-bolic syndrome: a joint interim statement of the International Diabetes Federation Task Force on Epidemiology and Prevention; National Heart, Lung, and Blood Institute; American Heart Association; World Heart Federation; International Atherosclerosis Society; and International Association for the Study of Obesity. Circulation. 2009;120:1640–1645.
2. Expert Panel on Detection, Evaluation, and Treatment of High Blood Cholesterol in Adults. Executive Summary of The Third Report of The National Cholesterol Education Program (NCEP) Expert Panel on Detection, Evaluation, And Treatment of High Blood Cholesterol In Adults (Adult Treatment Panel III). JAMA. 2001;285:2486–2497.
3. Deedwania P, Barter P, Carmena R, Fruchart JC, Grundy SM, Haffner S, Kastelein JJ, LaRosa JC, Schachner H, Shepherd J, Waters DD; Treating to New Targets Investigators. Reduction of low-density lipoprotein cho-lesterol in patients with coronary heart disease and metabolic syndrome: analysis of the Treating to New Targets study. Lancet. 2006;368:919–928.
4. Gami AS, Witt BJ, Howard DE, Erwin PJ, Gami LA, Somers VK, Montori VM. Metabolic syndrome and risk of incident cardiovascular events and death: a systematic review and meta-analysis of longitudinal studies. J Am Coll Cardiol. 2007;49:403–414.
5. Jang IK, Tearney GJ, MacNeill B, Takano M, Moselewski F, Iftima N, Shishkov M, Houser S, Aretz HT, Halpern EF, Bouma BE. In vivo charac-terization of coronary atherosclerotic plaque by use of optical coherence tomography. Circulation. 2005;111:1551–1555.
6. Kume T, Akasaka T, Kawamoto T, Watanabe N, Toyota E, Neishi Y, Sukmawan R, Sadahira Y, Yoshida K. Assessment of coronary arterial plaque by optical coherence tomography. Am J Cardiol. 2006;97:1172–1175.
7. Diagnosis and classification of diabetes mellitus. Diabetes Care. 36(suppl 1):S67–S74.
8. Conen D, Rexrode KM, Creager MA, Ridker PM, Pradhan AD. Metabolic syndrome, inflammation, and risk of symptomatic peripheral artery dis-ease in women: a prospective study. Circulation. 2009;120:1041–1047.
9. Arnlöv J, Ingelsson E, Sundström J, Lind L. Impact of body mass index and the metabolic syndrome on the risk of cardiovascular disease and death in middle-aged men. Circulation. 2010;121:230–236.
10. Kato K, Yonetsu T, Kim SJ, Xing L, Lee H, McNulty I, Yeh RW, Sakhuja R, Zhang S, Uemura S, Yu B, Mizuno K, Jang IK. Nonculprit plaques in patients with acute coronary syndromes have more vulnerable features compared with those with non acute coronary syndromes: a 3-vessel optical coherence tomography study. Circ Cardiovasc Imaging. 2012; 5:660–666.
11. Burke AP, Farb A, Malcom GT, Liang YH, Smialek J, Virmani R. Coronary risk factors and plaque morphology in men with coronary disease who died suddenly. N Engl J Med. 1997;336:1276–1282.
12. Tearney GJ, Yabushita H, Houser SL, Aretz HT, Jang IK, Schlendorf KH, Kauffman CR, Shishkov M, Halpern EF, Bouma BE. Quantification of macrophage content in atherosclerotic plaques by optical coherence to-mography. Circulation. 2003;107:113–119.
13. MacNeill BD, Jang IK, Bouma BE, Iftimia N, Takano M, Yabushita H, Shishkov M, Kauffman CR, Houser SL, Aretz HT, DeJoseph D, Halpern EF, Tearney GJ. Focal and multi-focal plaque macrophage distributions in patients with acute and stable presentations of coronary artery disease. J Am Coll Cardiol. 2004;44:972–979.
14. Tearney GJ, Waxman S, Shishkov M, Vakoc BJ, Suter MJ, Freilich MI, Desjardins AE, Oh WY, Bartlett LA, Rosenberg M, Bouma BE. Three-dimensional coronary artery microscopy by intracoronary opti-cal frequency domain imaging. J Am Coll Cardiol Cardiovasc Imaging. 2008;1:752–761.
15. Takano M, Yamamoto M, Inami S, Murakami D, Ohba T, Seino Y, Mizuno K. Appearance of lipid-laden intima and neovascularization after implan-tation of bare-metal stents extended late-phase observation by intracoro-nary optical coherence tomography. J Am Coll Cardiol. 2009;55:26–32.
16. Yabushita H, Bouma BE, Houser SL, Aretz HT, Jang IK, Schlendorf KH, Kauffman CR, Shishkov M, Kang DH, Halpern EF, Tearney GJ. Characterization of human atherosclerosis by optical coherence tomogra-phy. Circulation. 2002;106:1640–1645.
17. Falk E, Shah PK, Fuster V. Coronary plaque disruption. Circulation. 1995;92:657–671.
18. Hong YJ, Jeong MH, Choi YH, Ko JS, Lee MG, Kang WY, Lee SE, Kim SH, Park KH, Sim DS, Yoon NS, Yoon HJ, Kim KH, Park HW, Kim JH, Ahn Y, Cho JG, Park JC, Kang JC. Plaque characteristics in culprit lesions and inflammatory status in diabetic acute coronary syndrome patients. J Am Coll Cardiol Cardiovasc Imaging. 2009;2:339–349.
19. Zheng M, Choi SY, Tahk SJ, Lim HS, Yang HM, Choi BJ, Yoon MH, Park JS, Hwang GS, Shin JH. The relationship between volumetric plaque components and classical cardiovascular risk factors and the metabolic syndrome a 3-vessel coronary artery virtual histology-intravascular ultra-sound analysis. J Am Coll Cardiol Intv. 2011;4:503–510.
20. Niccoli G, Giubilato S, Di Vito L, Leo A, Cosentino N, Pitocco D, Marco V, Ghirlanda G, Prati F, Crea F. Severity of coronary atherosclerosis in patients with a first acute coronary event: a diabetes paradox. Eur Heart J. 2013;34:729–741.
21. Marso SP, Mercado N, Maehara A, Weisz G, Mintz GS, McPherson J, Schiele F, Dudek D, Fahy M, Xu K, Lansky A, Templin B, Zhang Z, de Bruyne B, Serruys PW, Stone GW. Plaque composition and clinical out-comes in acute coronary syndrome patients with metabolic syndrome or diabetes. J Am Coll Cardiol Img. 2012;5(3 suppl):S42–S52.
22. Tanaka A, Imanishi T, Kitabata H, Kubo T, Takarada S, Tanimoto T, Kuroi A, Tsujioka H, Ikejima H, Ueno S, Kataiwa H, Okouchi K, Kashiwaghi M, Matsumoto H, Takemoto K, Nakamura N, Hirata K, Mizukoshi M, Akasaka T. Morphology of exertion-triggered plaque rupture in patients with acute coronary syndrome: an optical coherence tomography study. Circulation. 2008;118:2368–2373.
23. Yonetsu T, Kakuta T, Lee T, Takahashi K, Kawaguchi N, Yamamoto G, Koura K, Hishikari K, Iesaka Y, Fujiwara H, Isobe M. In vivo critical fi-brous cap thickness for rupture-prone coronary plaques assessed by opti-cal coherence tomography. Eur Heart J. 2011;32:1251–1259.
24. Takarada S, Imanishi T, Ishibashi K, Tanimoto T, Komukai K, Ino Y, Kitabata H, Kubo T, Tanaka A, Kimura K, Mizukoshi M, Akasaka T. The effect of lipid and inflammatory profiles on the morphological changes of lipid-rich plaques in patients with non-ST-segment elevated acute coro-nary syndrome: follow-up study by optical coherence tomography and intravascular ultrasound. J Am Coll Cardiol Intv. 2010;3:766–772.
25. Sattar N, Gaw A, Scherbakova O, Ford I, O’Reilly DS, Haffner SM, Isles C, Macfarlane PW, Packard CJ, Cobbe SM, Shepherd J. Metabolic syn-drome with and without C-reactive protein as a predictor of coronary heart disease and diabetes in the West of Scotland Coronary Prevention Study. Circulation. 2003;108:414–419.
26. Huang PL. eNOS, metabolic syndrome and cardiovascular disease. Trends Endocrinol Metab. 2009;20:295–302.

Yonetsu et al Plaque Characteristics in Metabolic Syndrome 673
27. Sattar N, McConnachie A, Shaper AG, Blauw GJ, Buckley BM, de Craen AJ, Ford I, Forouhi NG, Freeman DJ, Jukema JW, Lennon L, Macfarlane PW, Murphy MB, Packard CJ, Stott DJ, Westendorp RG, Whincup PH, Shepherd J, Wannamethee SG. Can metabolic syndrome usefully predict cardiovascular disease and diabetes? Outcome data from two prospective studies. Lancet. 2008;371:1927–1935.
28. Kahn R. Metabolic syndrome: is it a syndrome? Does it matter? Circulation. 2007;115:1806–1810; discussion 1811.
29. Prati F, Regar E, Mintz GS, Arbustini E, Di Mario C, Jang IK, Akasaka T, Costa M, Guagliumi G, Grube E, Ozaki Y, Pinto F, Serruys PW; Expert’s OCT Review Document. Expert review document on methodology, ter-minology, and clinical applications of optical coherence tomography: physical principles, methodology of image acquisition, and clinical appli-cation for assessment of coronary arteries and atherosclerosis. Eur Heart J. 2010;31:401–415.
30. Tearney G, Jang IK, Bouma B. Evidence of cholesterol crystals in athero-sclerotic plaque by optical coherence tomographic (OCT) imaging. Eur Heart J. 2003;24:1.
31. Doyle B, Caplice N. Plaque neovascularization and antiangiogenic thera-py for atherosclerosis. J Am Coll Cardiol. 2007;49:2073–2080.
32. Khurana R, Simons M, Martin JF, Zachary IC. Role of angiogen-esis in cardiovascular disease: a critical appraisal. Circulation. 2005;112:1813–1824.
33. Wong ND, Nelson JC, Granston T, Bertoni AG, Blumenthal RS, Carr JJ, Guerci A, Jacobs DR Jr, Kronmal R, Liu K, Saad M, Selvin E, Tracy R, Detrano R. Metabolic syndrome, diabetes, and incidence and progression of coronary calcium: the Multiethnic Study of Atherosclerosis study. J Am Coll Cardiol Img. 2012;5:358–366.
34. Tearney GJ, Regar E, Akasaka T, Adriaenssens T, Barlis P, Bezerra HG, Bouma B, Bruining N, Cho JM, Chowdhary S, Costa MA, de Silva R, Dijkstra J, Di Mario C, Dudek D, Dudeck D, Falk E, Falk E, Feldman MD, Fitzgerald P, Garcia-Garcia HM, Garcia H, Gonzalo N, Granada JF, Guagliumi G, Holm NR, Honda Y, Ikeno F, Kawasaki M, Kochman J, Koltowski L, Kubo T, Kume T, Kyono H, Lam CC, Lamouche G, Lee DP, Leon MB, Maehara A, Manfrini O, Mintz GS, Mizuno K, Morel MA, Nadkarni S, Okura H, Otake H, Pietrasik A, Prati F, Räber L, Radu MD, Rieber J, Riga M, Rollins A, Rosenberg M, Sirbu V, Serruys PW, Shimada K, Shinke T, Shite J, Siegel E, Sonoda S, Sonada S, Suter M, Takarada S, Tanaka A, Terashima M, Thim T, Troels T, Uemura S, Ughi GJ, van Beusekom HM, van der Steen AF, van Es GA, van Es GA, van Soest G, Virmani R, Waxman S, Weissman NJ, Weisz G; International Working Group for Intravascular Optical Coherence Tomography (IWG-IVOCT). Consensus standards for acquisition, measure-ment, and reporting of intravascular optical coherence tomography studies: a report from the International Working Group for Intravascular Optical Coherence Tomography Standardization and Validation. J Am Coll Cardiol. 2012;59:1058–1072.
CLINICAL PERSPECTIVEPrevious studies have reported an association between metabolic syndrome (MetS) and cardiovascular disease. However, the underlying pathophysiology has not been fully explored. Moreover, some reports have raised questions about the strength of the association between MetS and cardiovascular events. In the present study, we evaluated the plaque charac-teristics of MetS in comparison with patients with diabetes mellitus and control group without MetS or diabetes mellitus by using 3-vessel optical coherence tomographic investigation. Our data demonstrated larger amount of lipid in nonculprit/nontarget lesions of MetS and diabetes mellitus groups as compared with control group. However, fibrous cap thickness and presence of thin-cap fibroatheroma, which are recognized as hallmarks of plaque vulnerability, were not different among the 3 groups. Our results suggest additional information is needed to identify patients with MetS who are at higher risk for cardiovascular events.
SUPPLEMENTAL MATERIAL
Supplemental Table 1. Patient characteristics of DM group in subjects who underwent 1 or 2
vessel optical coherence tomography and those with 3 vessel imaging.
1 or 2 vessel OCT 3 vessel OCT p value
N 232 77
Age 62±13 59±11 0.070
Male, n(%) 160 (69) 55 (71) 0.830
Hypertension, n(%) 170 (73) 59 (77) 0.667
Current smoking, n(%) 38 (16) 14 (18) 0.849
Weight, kg 71±12 70±10 0.511
Height, cm 165±8 168±7 0.004*
Body mass index, kg/m2 26.0±3.6 24.9±2.5 0.013*
Creatinine, mg/dl 1.0±0.8 1.4±1.8 0.011*
Total cholesterol, mg/dl 160±43 159±46 0.862
LDL cholesterol, mg/dl 90±37 88±36 0.680
HDL cholesterol, mg/dl 45±13 42±12 0.075
Triglyceride, mg/dl 150±100 145±75 0.688
HbA1c, % 7.4±1.6 6.9±1.2 0.012*
Fasting glucose, mg/dl 150±59 130±42 0.006*
Insulin, n(%) 101 (44) 46 (60) 0.020*
OHA, n(%) 119 (51) 21 (27) <0.001*
Statin, n(%) 168 (72) 54 (70) 0.810
ACS, n(%) 91 (39) 26 (34) 0.472
* p<0.05 OHA indicates oral hypoglycemic agent; ACS, acute coronary syndrome.

Supplemental Table 2. Patient characteristics of MetS group in subjects who underwent 1 or 2
vessel optical coherence tomography and those with 3 vessel imaging.
1 or 2 vessel OCT 3 vessel OCT p value
N 181 35
Age 60±11 60±11 0.885
Male, n(%) 133 (73) 28 (80) 0.550
Hypertension, n(%) 147 (81) 29 (83) 0.993
Current smoking, n(%) 53 (29) 9 (26) 0.824
Weight, kg 77±15 71±8 0.022*
Height, cm 168±8 168±6 1.000
Body mass index, kg/m2 27.3±4.3 25.1±2.0 0.003*
Creatinine, mg/dl 1.0±0.3 1.0±0.2 0.852
Total cholesterol, mg/dl 173±43 159±37 0.073
LDL cholesterol, mg/dl 97±37 89±28 0.227
HDL cholesterol, mg/dl 40±11 38±3 0.288
Triglyceride, mg/dl 200±110 217±145 0.429
HbA1c, % 6.0±0.7 5.6±0.5 0.002*
Fasting glucose, mg/dl 110±16 107±14 0.302
Statin, n(%) 111 (61) 21 (60) 0.966
ACS, n(%) 109 (60) 15 (43) 0.086
*p<0.05 ACS indicates acute coronary syndrome.