Zero TE MR Bone Imaging in the Head
8
FULL PAPER Zero TE MR Bone Imaging in the Head Florian Wiesinger, 1 * Laura I. Sacolick, 1 Anne Menini, 1 Sandeep S. Kaushik, 2 Sangtae Ahn, 3 Patrick Veit-Haibach, 4 Gaspar Delso, 4,5 and Dattesh D. Shanbhag 2 Purpose: To investigate proton density (PD)-weighted zero TE (ZT) imaging for morphological depiction and segmentation of cranial bone structures. Methods: A rotating ultra-fast imaging sequence (RUFIS) type ZT pulse sequence was developed and optimized for 1) effi- cient capture of short T 2 bone signals and 2) flat PD response for soft-tissues. An inverse logarithmic image scaling (i.e., log(image)) was used to highlight bone and differentiate it from surrounding soft-tissue and air. Furthermore, a histogram-based bias-correction method was developed for subsequent threshold-based air, soft-tissue, and bone segmentation. Results: PD-weighted ZT imaging in combination with an inverse logarithmic scaling was found to provide excellent depiction of cranial bone structures. In combination with bias correction, also excellent segmentation results were achieved. A two-dimensional histogram analysis demonstrates a strong, approximately linear correlation between inverse log-scaled ZT and low-dose CT for Hounsfield units (HU) between 300 HU and 1,500 HU (corresponding to soft-tissue and bone). Conclusions: PD-weighted ZT imaging provides robust and efficient depiction of bone structures in the head, with an excellent contrast between air, soft-tissue, and bone. Besides structural bone imaging, the presented method is expected to be of relevance for attenuation correction in positron emission tomography (PET)/MR and MR-based radiation therapy plan- ning. Magn Reson Med 75:107–114, 2016. V C 2015 Wiley Periodicals, Inc. Key words: UTE; zero TE; RUFIS; ZTE; bone; PET/MR; attenuation correction; segmentation INTRODUCTION In contrast to X-ray transmission imaging, MRI is intrinsically much less suited for the depiction of corti- cal bone structures. Nonetheless, there is a continuously increasing demand to actually address and solve this unmet need. Besides musculoskeletal applications (1,2), MR bone imaging has gained increased importance for applications such as MR-based attenuation correction in positron emission tomography (PET)/MR (3–5), MR- based radiation therapy planning (6–8), and MR-guided focused ultrasound (9–12). More specifically, MR depiction of solid bone struc- tures is challenging due to low proton density (20% of water) and short signal lifetimes (T2 390 ms at 3 tesla [T]) (13). Conventional gradient echo or spin echo pulse sequences with echo times (TE) in the millisecond range are generally too slow for meaningful bone signal detec- tion. Ultrashort echo time (UTE) pulse sequences with center-out k-space sampling starting immediately follow- ing the radio frequency (RF) excitation enable fast- enough MR data acquisition to capture the rapidly decay- ing bone signals (1,2). In order to selectively depict bone, long T2-suppression methods (e.g., echo subtraction and/ or saturation prepulses) are commonly applied (14). In this work, we explore proton density (PD)- weighted, zero TE (ZT) imaging for isotropic, high- resolution MR bone depiction in the head. Since its invention approximately two decades ago (15–17), zero TE has experienced a recent revival with several refine- ments in the form of ZTE (18,19) and pointwise encod- ing time reduction with radial acquisition (PETRA) (20,21). As will be demonstrated in the following, the pulse sequence provides imaging characteristics that are ideally suited for the depiction and segmentation of cra- nial bone structures. Elements of this work were pre- sented at the 2014 International Society for Magnetic Resonance in Medicine (ISMRM) meeting in Milan, Italy (22). METHODS Pulse Sequence, Image Reconstruction, and Experimental Details Zero TE imaging was implemented similarly to the rotat- ing ultrafast imaging sequence (RUFIS) (16). The pulse sequence consists of a nonselective hard pulse excitation followed by 3D center-out radial sampling. Unlike most MR pulse sequences, the readout gradients are not ramped down between repetitions. Accordingly, image encoding starts immediately at full speed at the time of spin excitation, leading to a nominal TE ¼ 0, with the nominal TE defined as the center k-space TE. The dia- gram of the pulse sequence is schematically illustrated in Figure 1. The pulse sequence was grouped into seg- ments, each containing a certain number of spokes. This grouping allows interleaving prepulses for contrast prep- aration, chemical shift selective saturation, or motion navigators. In order for the imaging gradients to not significantly disturb spin excitation, the excitation bandwidth must be wider than the imaging bandwidth (BW) (21). For typ- ical B 1 amplitudes of clinical whole-body MR scanners 1 GE Global Research, Munich, Germany. 2 GE Global Research, Bangalore, India. 3 GE Global Research, Niskayuna, NY, USA. 4 University Hospital, Zurich, Switzerland. 5 GE Healthcare, Waukesha, Wisconsin, USA *Correspondence to: Florian Wiesinger, PhD, Freisinger Landstrasse 50, 85748 Munich, Germany. E-mail: fl[email protected]. Received 23 September 2014; revised 29 October 2014; accepted 31 October 2014 DOI 10.1002/mrm.25545 Published online 16 January 2015 in Wiley Online Library (wileyonlinelibrary. com). Magnetic Resonance in Medicine 75:107–114 (2016) V C 2015 Wiley Periodicals, Inc. 107
Transcript of Zero TE MR Bone Imaging in the Head

FULL PAPER
Zero TE MR Bone Imaging in the Head
Florian Wiesinger,1* Laura I. Sacolick,1 Anne Menini,1 Sandeep S. Kaushik,2
Sangtae Ahn,3 Patrick Veit-Haibach,4 Gaspar Delso,4,5 and Dattesh D. Shanbhag2
Purpose: To investigate proton density (PD)-weighted zero TE
(ZT) imaging for morphological depiction and segmentation ofcranial bone structures.Methods: A rotating ultra-fast imaging sequence (RUFIS) type
ZT pulse sequence was developed and optimized for 1) effi-cient capture of short T2 bone signals and 2) flat PD response
for soft-tissues. An inverse logarithmic image scaling (i.e.,�log(image)) was used to highlight bone and differentiate itfrom surrounding soft-tissue and air. Furthermore, a
histogram-based bias-correction method was developed forsubsequent threshold-based air, soft-tissue, and bone
segmentation.Results: PD-weighted ZT imaging in combination with aninverse logarithmic scaling was found to provide excellent
depiction of cranial bone structures. In combination with biascorrection, also excellent segmentation results were achieved.
A two-dimensional histogram analysis demonstrates a strong,approximately linear correlation between inverse log-scaled ZTand low-dose CT for Hounsfield units (HU) between �300 HU
and 1,500 HU (corresponding to soft-tissue and bone).Conclusions: PD-weighted ZT imaging provides robust andefficient depiction of bone structures in the head, with an
excellent contrast between air, soft-tissue, and bone. Besidesstructural bone imaging, the presented method is expected to
be of relevance for attenuation correction in positron emissiontomography (PET)/MR and MR-based radiation therapy plan-ning. Magn Reson Med 75:107–114, 2016. VC 2015 WileyPeriodicals, Inc.
Key words: UTE; zero TE; RUFIS; ZTE; bone; PET/MR;attenuation correction; segmentation
INTRODUCTION
In contrast to X-ray transmission imaging, MRI isintrinsically much less suited for the depiction of corti-cal bone structures. Nonetheless, there is a continuouslyincreasing demand to actually address and solve thisunmet need. Besides musculoskeletal applications (1,2),MR bone imaging has gained increased importance forapplications such as MR-based attenuation correction inpositron emission tomography (PET)/MR (3–5), MR-
based radiation therapy planning (6–8), and MR-guidedfocused ultrasound (9–12).
More specifically, MR depiction of solid bone struc-tures is challenging due to low proton density (�20% ofwater) and short signal lifetimes (T2 � 390 ms at 3 tesla[T]) (13). Conventional gradient echo or spin echo pulsesequences with echo times (TE) in the millisecond rangeare generally too slow for meaningful bone signal detec-tion. Ultrashort echo time (UTE) pulse sequences withcenter-out k-space sampling starting immediately follow-ing the radio frequency (RF) excitation enable fast-enough MR data acquisition to capture the rapidly decay-ing bone signals (1,2). In order to selectively depict bone,long T2-suppression methods (e.g., echo subtraction and/or saturation prepulses) are commonly applied (14).
In this work, we explore proton density (PD)-weighted, zero TE (ZT) imaging for isotropic, high-resolution MR bone depiction in the head. Since itsinvention approximately two decades ago (15–17), zeroTE has experienced a recent revival with several refine-ments in the form of ZTE (18,19) and pointwise encod-ing time reduction with radial acquisition (PETRA)(20,21). As will be demonstrated in the following, thepulse sequence provides imaging characteristics that areideally suited for the depiction and segmentation of cra-nial bone structures. Elements of this work were pre-sented at the 2014 International Society for MagneticResonance in Medicine (ISMRM) meeting in Milan,Italy (22).
METHODS
Pulse Sequence, Image Reconstruction, and ExperimentalDetails
Zero TE imaging was implemented similarly to the rotat-ing ultrafast imaging sequence (RUFIS) (16). The pulsesequence consists of a nonselective hard pulse excitationfollowed by 3D center-out radial sampling. Unlike mostMR pulse sequences, the readout gradients are notramped down between repetitions. Accordingly, imageencoding starts immediately at full speed at the time ofspin excitation, leading to a nominal TE¼ 0, with thenominal TE defined as the center k-space TE. The dia-gram of the pulse sequence is schematically illustratedin Figure 1. The pulse sequence was grouped into seg-ments, each containing a certain number of spokes. Thisgrouping allows interleaving prepulses for contrast prep-aration, chemical shift selective saturation, or motionnavigators.
In order for the imaging gradients to not significantlydisturb spin excitation, the excitation bandwidth mustbe wider than the imaging bandwidth (BW) (21). For typ-ical B1 amplitudes of clinical whole-body MR scanners
1GE Global Research, Munich, Germany.2GE Global Research, Bangalore, India.3GE Global Research, Niskayuna, NY, USA.4University Hospital, Zurich, Switzerland.5GE Healthcare, Waukesha, Wisconsin, USA
*Correspondence to: Florian Wiesinger, PhD, Freisinger Landstrasse 50,85748 Munich, Germany. E-mail: [email protected].
Received 23 September 2014; revised 29 October 2014; accepted 31October 2014
DOI 10.1002/mrm.25545Published online 16 January 2015 in Wiley Online Library (wileyonlinelibrary.com).
Magnetic Resonance in Medicine 75:107–114 (2016)
VC 2015 Wiley Periodicals, Inc. 107

(�15 mT), this leads to flip angles of a few degrees maxi-mum, resulting in native PD-weighted image contrast.The minimal gradient ramping and short RF pulsingtranslates into fast and signal-to-noise ratio (SNR) effi-cient scanning with submillisecond repetition times(TR).
The radial spokes were sequentially ordered along aspiral path, resulting in a uniform sampling of the 3D k-space (23). This limits the gradient switching betweenrepetitions to incremental directional updates only, result-ing in robustness to eddy currents and virtually silentscanning. For a certain field-of-view (FOV) and matrixsize (N), the number of radial spokes corresponding toNyquist sampling at the k-space periphery is pN2. Alongthe radial direction, twofold oversampling was applied.
Finite RF transmit–receive switching times (dTTx/Rx)between spin excitation and signal reception results in aspherical k-space gap of radius dTTx/Rx/Dt data points;with Dt the sampling time. This missing region was reac-quired at the end using an imaging bandwidth reduced byat least the same factor (17). In the postprocessing, thetwo acquisitions were merged with a linear transition inthe overlap region and then reconstructed using 3D gridd-ing (24,25) and rooted-sum-of-square coil combination(26). For the coil array used here, the transmit–receiveswitching time was estimated to be dTTx/Rx � 30ms.
Phantom and in vivo volunteer experiments were con-ducted on a Discovery MR750w 3.0T scanner (GEHealthcare, Waukesha, WI) equipped with a GEM head-and-neck unit (HNU) receive array (GE Healthcare).Patient data were acquired on a sequential PET/CTþMRtrimodality system (27) consisting of a time-of-flight Dis-covery PET/CT 690 scanner, a Discovery MR750w 3.0T
scanner, and a dedicated patient transporter system thatpermits consistent scanning of the patient on both scan-ners (GE Healthcare). The zero TE acquisition parameters(including flip angle [a], imaging bandwidth (BW), FOV,isotropic resolution, number of spokes, number of spokesper segment, and scan time) are listed in Table 1.
Histogram-Based Intensity Correction
As preparation for the subsequent image segmentation,which is based on the assumption of uniform signalresponse from across the whole 3D FOV, a histogram-based bias-correction step was developed that specifi-cally takes advantage of the flat PD contrast characteris-tic of ZT images (Fig. 2). More specifically, the image isconsidered to consist of only two major constituents:soft-tissue (including white matter, gray matter, cerebro-spinal fluid [CSF], muscle, fat, etc.), and backgroundair. This assumption is confirmed by the image histo-gram (Fig. 3) of the inverse log-scaled ZT image, whichcontains only two major peaks (corresponding to soft-tissue on the left and background noise on the right)but does not resolve the individual soft-tissues. Thesoft-tissue signal distribution is broadened by the spa-tially nonuniform bias (primarily originating from RFtransmit and receive nonuniformities, as well as sensi-tivity variation due to the rooted-sum-of-square coilcombination). As illustrated by the histogram of asmaller region-of-interest (ROI), with accordingly lessvariation of the sensitivity profiles (Fig. 2, bottomright), the histogram signal peak becomes significantlynarrower such that the soft-tissue signal in this ROI canbe approximated by the center location of the signalpeak. Based on this observation, a bias-correction algo-rithm was devised by 1) dividing the image dataset into3D ROIs and 2) normalizing all pixels within a certain3D ROI by the signal intensity of the correspondingsoft-tissue peak.
This histogram-based bias-correction and normaliza-tion scheme was implemented as illustrated in the flow-chart of Figure 2. (Certain mathematical operations aredescribed by pseudo syntax: low-pass filter (LPF), natu-ral logarithm (log), exponential (exp), histogram (hist),and maximum (max); and variables are introduced for acomprehensive annotation: ZT input image (y0), numberof bins (Nbins), and predefined minimum number ofcounts (Nmin) ). The outer loop describes a multiresolu-tion approach starting with a single ROI covering the full3D volume and refining to smaller ROIs in subsequentiterations (i.e., ROI¼ [(l-1),l]*FOV/L]). The inner loopdescribes the histogram-based bias correction for a ROIat a specific resolution (i.e., tmp¼�log(y0(ROI)),[N,X]¼hist(tmp,Nbins)). The bias-correction factor for aspecific ROI is only updated (i.e., bias(ROI)¼ exp(�X(I)))if sufficient signal statistics is available (i.e., Y>Nmin
FIG. 1. Schematic illustration of the zero TE pulse sequence withRF, signal, and gradient activity. The gradients are kept active dur-ing the RF pulsing with only small directional updates in between
repetitions, resulting in a nominal TE¼0 as well as fast and quietscanning. The pulse sequence is grouped into segments (one seg-
ment illustrated here) to interleave preparation pulses and/ormotion navigators.
Table 1
Acquisition Parameters for the Default and the High-Resolution ZT Protocol Used
a BW FOV Resolution Number of Spokes Spokes per Segment Scan Time
Default protocol 1.2� 662.5 kHz 260 mm 1.35 mm 147,456 512 2 min 53 s
High-resolution protocol 1.2� 662.5 kHz 220 mm 0.85 mm 262,144 512 6 min 12 s
108 Wiesinger et al.

condition with [Y,I]¼max(N)); otherwise the value fromthe last iteration is retained. After the multiresolutionbias correction is finished, the obtained bias field is low-pass filtered (i.e., bias¼LPF[bias]), which eliminates thecheckerboard pattern from the discrete ROIs, and is thenapplied to the original input image (i.e., output¼ y0/bias). Besides bias correction, the algorithm also providesimage normalization by assigning soft-tissue a value of 1.
Segmentation
Following the bias correction and signal normalization,the images are segmented into three classes: air, soft-tissue,and bone. For the segmentation, simple thresholding wasapplied using two threshold values for soft-tissue/boneand bone/air differentiation. Figure 4 shows an inverselogarithmic scaled (i.e., �log(image)) ZT dataset afterapplication of the histogram-based intensity correction andimage normalization using the default protocol defined inTable 1. The bottom curve contains the image histogram ofthe inverse log-scaled image, with soft-tissue (left) andnoise (right) appearing as clearly distinguishable peaks.Conversely, the bone signals are smeared in between, lend-ing more toward the soft-tissue peak on the left. The toptwo rows show the zero TE images along three orthogonalviews using different windowing. For the top row, thewindow level was adjusted to cover the full signal range[�0.3, 3], whereas for the middle row the window levelwas adjusted to selectively depict bone with soft-tissueand air appearing consistently black and white, respec-tively. For the latter, the window levels (green verticallines) were derived from Gaussian fits (red curves) of thesignal and noise peak [center(signal)þ 2*FWHM(signal),center(noise)�2*FWHM(noise)].
The obtained raw segmentation results are refinedusing standard image-processing methods, includingdistance-transform operations (to remove partial volumeeffects at air–tissue interfaces) and connected componentanalysis (to remove structures outside the head, originat-ing from cushions and the RF coil’s plastic housing). Inaddition, intrabody air can be distinguished from theoutside air via morphologic mask-filling operations.
RESULTS
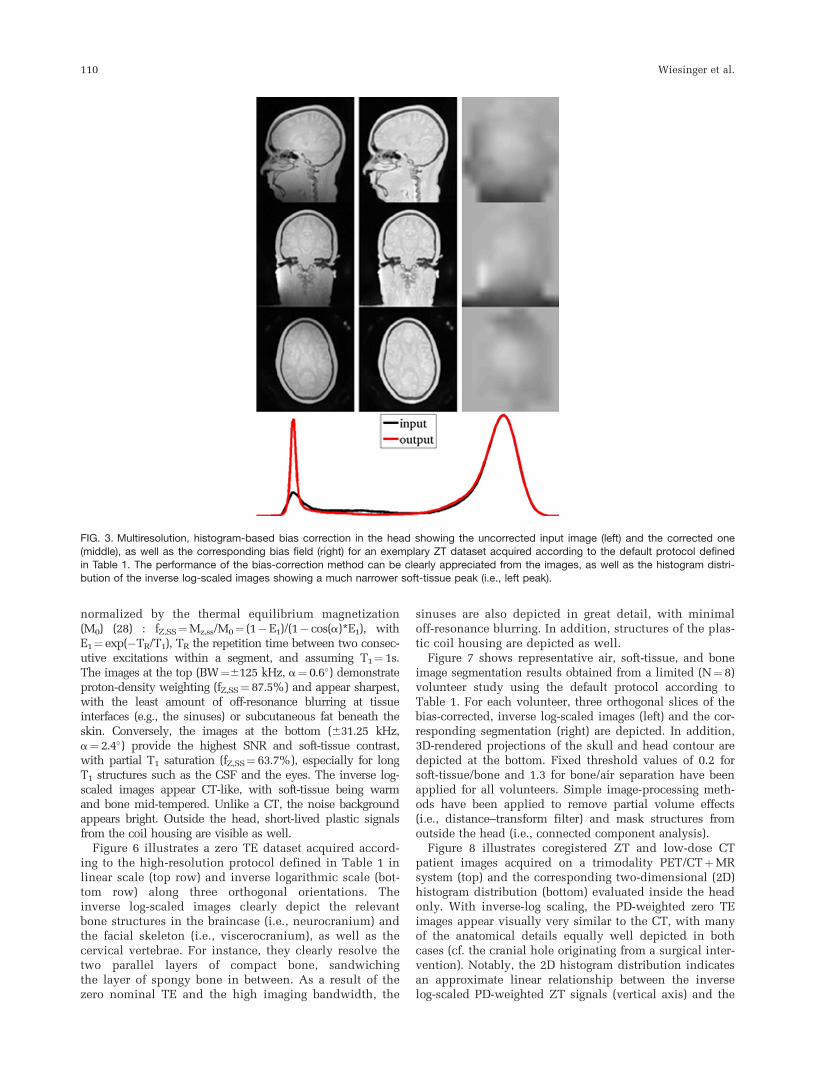
Figure 3 compares image uniformity before (left) and after(middle) multiresolution, histogram-based bias correction,with the corresponding bias field-map depicted on theright for an exemplary zero TE dataset acquired accordingto the default protocol defined in Table 1. Apparently, theproposed bias-correction method significantly improvesRF shading without affecting the low but still appreciablecontrast behavior. It is important to note that this methodalso provides image normalization with a soft-tissue sig-nal of 1. The bias correction is also apparent from the his-togram distribution of the inverse logarithmic-scaled ZTimages at the bottom, showing a significantly narrowersoft-tissue distribution (left peak) after the correction. Forbetter illustration, the histogram distributions were scaledsuch that the noise peaks approximately overlap.
Figure 5 shows inverse log-scaled zero TE imagesacquired according to the default protocol defined inTable 1 but using different imaging bandwidths and flipangles (top row: BW¼6125 kHz, a¼ 0.6�, TR¼ 0.48 ms,fZ,SS¼ 87.5%; middle row: BW¼662.5 kHz, a¼ 1.2�,TR¼ 0.96 ms, fZ,SS¼ 77.8%; bottom row: 631.25 kHz,a¼ 2.4�, TR¼1.92 ms, fZ,SS¼ 63.7%). With fZ,SS thesteady-state longitudinal magnetization (MZ,SS)
FIG. 2. Schematic illustration of the histogram-based bias-correction method. From the histogram of a region-of-interest (ROI) of the
inverse log-scaled image, the soft-tissue peak is identified (right). In case of sufficient statistics, the corresponding soft-tissue signal isthen assigned the bias-correction factor for the considered ROI. The algorithm is implemented in a multiresolution approach, with theROI initially starting as the full FOV and then iteratively refining. The method is based on the flat proton-density (PD) contrast and
assumes soft-tissues to be approximately indistinguishable within the considered ROIs. The improved signal uniformity can be clearlyappreciated from the obtained images and the corresponding histogram distribution (Fig. 3).
Zero TE Bone Imaging 109
normalized by the thermal equilibrium magnetization(M0) (28) : fZ,SS¼Mz,ss/M0¼ (1�E1)/(1� cos(a)*E1), withE1¼ exp(�TR/T1), TR the repetition time between two consec-utive excitations within a segment, and assuming T1¼1s.The images at the top (BW¼6125 kHz, a¼ 0.6�) demonstrateproton-density weighting (fZ,SS¼ 87.5%) and appear sharpest,with the least amount of off-resonance blurring at tissueinterfaces (e.g., the sinuses) or subcutaneous fat beneath theskin. Conversely, the images at the bottom (631.25 kHz,a¼ 2.4�) provide the highest SNR and soft-tissue contrast,with partial T1 saturation (fZ,SS¼ 63.7%), especially for longT1 structures such as the CSF and the eyes. The inverse log-scaled images appear CT-like, with soft-tissue being warmand bone mid-tempered. Unlike a CT, the noise backgroundappears bright. Outside the head, short-lived plastic signalsfrom the coil housing are visible as well.
Figure 6 illustrates a zero TE dataset acquired accord-ing to the high-resolution protocol defined in Table 1 inlinear scale (top row) and inverse logarithmic scale (bot-tom row) along three orthogonal orientations. Theinverse log-scaled images clearly depict the relevantbone structures in the braincase (i.e., neurocranium) andthe facial skeleton (i.e., viscerocranium), as well as thecervical vertebrae. For instance, they clearly resolve thetwo parallel layers of compact bone, sandwichingthe layer of spongy bone in between. As a result of thezero nominal TE and the high imaging bandwidth, the
sinuses are also depicted in great detail, with minimaloff-resonance blurring. In addition, structures of the plas-tic coil housing are depicted as well.
Figure 7 shows representative air, soft-tissue, and boneimage segmentation results obtained from a limited (N¼8)volunteer study using the default protocol according toTable 1. For each volunteer, three orthogonal slices of thebias-corrected, inverse log-scaled images (left) and the cor-responding segmentation (right) are depicted. In addition,3D-rendered projections of the skull and head contour aredepicted at the bottom. Fixed threshold values of 0.2 forsoft-tissue/bone and 1.3 for bone/air separation have beenapplied for all volunteers. Simple image-processing meth-ods have been applied to remove partial volume effects(i.e., distance–transform filter) and mask structures fromoutside the head (i.e., connected component analysis).
Figure 8 illustrates coregistered ZT and low-dose CTpatient images acquired on a trimodality PET/CTþMRsystem (top) and the corresponding two-dimensional (2D)histogram distribution (bottom) evaluated inside the headonly. With inverse-log scaling, the PD-weighted zero TEimages appear visually very similar to the CT, with manyof the anatomical details equally well depicted in bothcases (cf. the cranial hole originating from a surgical inter-vention). Notably, the 2D histogram distribution indicatesan approximate linear relationship between the inverselog-scaled PD-weighted ZT signals (vertical axis) and the
FIG. 3. Multiresolution, histogram-based bias correction in the head showing the uncorrected input image (left) and the corrected one(middle), as well as the corresponding bias field (right) for an exemplary ZT dataset acquired according to the default protocol defined
in Table 1. The performance of the bias-correction method can be clearly appreciated from the images, as well as the histogram distri-bution of the inverse log-scaled images showing a much narrower soft-tissue peak (i.e., left peak).
110 Wiesinger et al.

CT signals (horizontal axis) for Hounsfield units (HU)between �300 HU and 1,500 HU (corresponding to soft-tissue and bone). Conversely, air (depicted in the upperleft corner of the 2D histogram) appears very bright in ZTbut does not overlap with tissue and bone signal inten-sities and thus can be segmented out. Some of the remain-ing smearing can be explained by imperfect registration aswell as MR partial volume effects.
DISCUSSION
In this paper, we demonstrated 3D cortical-bone depictionin the head using RUFIS-type zero TE imaging. Themethod takes advantage of specific zero TE imaging char-acteristics such as the efficient sampling of short T2 sig-nals and flat PD-weighted contrast. Furthermore,submillisecond TRs and 3D radial sampling provide fastand motion-insensitive scanning. The high sampling effi-ciency of close to 100% (i.e., most of the TR is used toacquire data) provides efficient scanning and offers a flex-ible tradeoff between BW, number of averages, and SNR.The minimal gradient switching in between repetitionsminimizes eddy currents to a negligible level and renders
the pulse sequence very robust and virtually silent. Onthe contrary, the readout gradient present during RF exci-tation requires excitation bandwidths equal or wider thanthe imaging bandwidth (21), resulting in short, nonselec-tive RF block pulses with flip angles below the corre-sponding Ernst angle (e.g., TR¼0.5 ms, T1¼ 223 ms,aErnst¼ 3.8�), resulting in native PD-weighted image con-trast. The latter is important to avoid T1 saturation thatwould result in the misclassification of long T1 soft-tis-sues (i.e., CSF and eyes) as bone or air (Fig. 5, bottomrow). The inverse logarithmic scaling (i.e., –log(image))inverts and stretches the image contrast towards CT-likeappearance, with bone appearing warm and soft-tissueappearing cold in front of a hot background. For patientimages obtained on a trimodality PET/CTþMR system(Fig. 8), the cranial anatomy is almost equivalentlydepicted in ZT and CT. Furthermore a 2D-histogram anal-ysis indicates an approximate linear correlation betweenCT and inverse log-scaled ZT for soft-tissue and bone(between �300 HU and þ1500 HU).
PD-weighted ZT bone depiction is fundamentally dif-ferent from methods presented in the literature thus far.In comparison to UTE-based methods (3,4,14), whichmostly explore T2 relaxation differences, the presentedmethod instead takes advantage of PD differences. As
FIG. 4. Illustration of threshold-based bone, soft-tissue, and air
segmentation of intensity-corrected, inverse log-scaled ZT images(acquired according to the default protocol defined in Table 1).The image histogram at the bottom displays the sparse signal
spectrum (black solid line) with two major peaks for soft-tissue(left) and noise (right). Corresponding Gaussian-fitting results (redsolid lines) with center peak and full-width-half-maximum (FWHM)
information (blue dashed lines) are shown as well. Conversely,bone signal intensities are distributed in between the two peaks,
lending more toward soft-tissue. The top two rows display theinput image along three orthogonal views, with window settingscovering the full dynamic range [�0.3, 3] (top row) and [center
(signal)þ2*FWHM(signal), center(noise)�2*FWHM (noise)] (middlerow). In particular, the middle row illustrates that bone (gray), tis-
sue (black), and air (white) can be clearly distinguished usingthreshold values automatically derived from the image histogram.
FIG. 5. Inverse log-scaled, zero TE head images acquired accord-ing to the default protocol in Table 1 comparing different imagingbandwidths with the flip angle scaled accordingly: BW¼6125 kHz
with a¼0.6� (top), BW¼662.5 kHz with a¼1.2� (middle), andBW¼631.25 kHz with a¼2.4� (bottom). The corresponding histo-
gram distributions are shown at the bottom. As expected, ultrashortT2 structures (i.e., cortical bone and plastic from the coil housing)appear strongest and sharpest at the highest BW with the fastest
sampling. At the lowest BW (with the highest a), T1 saturation andoff-resonance effects appear strongest.
Zero TE Bone Imaging 111

such, zero TE does not require specific, long T2 suppres-sion methods such as echo subtraction or application ofsaturation or inversion pulses (14). This significantlyadds to the speed and robustness of the method, in par-ticular in comparison to UTE-based alternatives that areknown to be sensitive to gradient imperfections and sus-ceptibility artifacts at tissue interfaces (1,14,29). The pro-
posed method also does not require prior knowledge inthe form of an atlas (30,31) or template (32,33).
The sparse PD-weighted contrast behavior is also appa-rent from the histogram distribution of the inverse log-scaled images, showing only two well-separated peaks.This observation was explored for a bias-correctionmethod. In an iterative, multiresolution approach, each
FIG. 7. Representative ZT segmentation results in four volunteers. In each column, the RF bias-corrected, inverse log-scaled images(left) are shown next to the corresponding segmentation results (right) along three orthogonal slices. The ZT-derived segmentation distin-
guished background (black), intrabody air (dark gray), soft-tissue (light gray), and bone (bright). Corresponding 3D renderings of the skulland the head contour are displayed at the bottom.
FIG. 6. High-resolution zero TEimage of the head (acquired
according to the high-resolutionprotocol of Table 1) in linear (top)and inverse logarithmic (bottom)
scale. The inverse logarithmicimage scaling in combination
with the flat proton density con-trast demonstrates excellentcortical bone depiction.
112 Wiesinger et al.

ROI gets normalized by the mean soft-tissue signal of acertain local neighborhood. Accordingly, the obtainedRF bias-corrected images are intrinsically normalizedwith a soft-tissue signal intensity of approximately 1.Alternative MR bias-correction methods exist (e.g., (34))but were not evaluated in the context of this work. Theobtained RF bias-corrected and normalized images werethen segmented into air, soft-tissue, and bone usingthresholding followed by simple refinement operationsto remove partial volume effects and outside headstructures.
It is expected that this method will be of particularinterest for applications that require accurate characteri-zation of bone attenuation such as MR-based PET attenu-ation correction, radiation therapy planning, or MR-guided focused ultrasound. In addition, the methodmight also be of interest for musculoskeletal applicationsand the detection of traumatic injuries. As a next step,zero TE MR bone imaging needs to be evaluated relativeto CT from a clinical perspective involving a certainnumber of relevant patient cases. In addition, its applic-ability to other body regions (e.g., the chest (35) or pel-vis) needs be investigated.
REFERENCES
1. Robson MD, Gatehouse PD, Bydder M, Bydder GM. Magnetic reso-
nance: an introduction to ultrashort TE (UTE) imaging. J Comput
Assist Tomogr 2003;27:825–846.
2. Robson MD, Bydder GM. Clinical ultrashort echo time imaging of
bone and other connective tissues. NMR Biomed 2006;19:765–780.
3. Keereman V, Fierens Y, Broux T, De Deene Y, Lonneux M,
Vandenberghe S. MRI-based attenuation correction for PET/MRI using
ultrashort echo time sequences. J Nucl Med 2010;51:812–818.
4. Catana C, van der Kouwe A, Benner T, Michel CJ, Hamm M, Fenchel
M, Fischl B, Rosen B, Schmand M, Sorensen AG. Toward implement-
ing an MRI-based PET attenuation-correction method for neurologic
studies on the MR-PET brain prototype. J Nucl Med 2010;51:1431–
1438.
5. Samarin A, Burger C, Wollenweber SD, Crook DW, Burger IA,
Schmid DT, Schulthess GK, Kuhn FP. PET/MR imaging of bone
lesions–implications for PET quantification from imperfect attenua-
tion correction. Eur J Nucl Med Mol Imaging 2012;39:1154–1160.
6. Chen L, Price RA, Wang L, Li J, Qin L, McNeeley S, Ma C-MC,
Freedman GM, Pollack A. MRI-based treatment planning for radio-
therapy: dosimetric verification for prostate IMRT. Int J Radiat Oncol
2004;60:636–647.
7. Jonsson JH, Karlsson MG, Karlsson M, Nyholm T. Treatment planning
using MRI data: an analysis of the dose calculation accuracy for dif-
ferent treatment regions. Radiat Oncol 2010;5:62.
8. Johansson A, Karlsson M, Nyholm T. CT substitute derived from MRI
sequences with ultrashort echo time. Med Phys 2011;38:2708.
FIG. 8. Coregistered ZT and CTpatient images acquired on a tri-
modality PET/CTþMR system.The cranial anatomy depicted byCT is almost equivalent to the
one obtained from inverse log-scaled ZT. The 2D-histogram dis-
tribution (evaluated inside thehead only) indicates a strong,approximately linear correlation
between CT and ZT for HU corre-sponding to soft-tissue and bone
(between �300 HU and 1,500HU). Conversely, air appears verybright in ZT (upper left corner in
the 2D histogram) but does notoverlap with soft-tissue and bonesignals.
Zero TE Bone Imaging 113

9. Cline HE, Schenck JF, Hynynen K, Watkins RD, Souza SP, Jolesz FA.
MR-guided focused ultrasound surgery. J Comput Assist Tomogr
1992;16:956–965.
10. Martin E, Jeanmonod D, Morel A, Zadicario E, Werner B. High-inten-
sity focused ultrasound for noninvasive functional neurosurgery.
Ann Neurol 2009;66:858–861.
11. McDannold N, Clement GT, Black P, Jolesz F, Hynynen K. Transcra-
nial magnetic resonance imaging– guided focused ultrasound surgery
of brain tumors: initial findings in 3 patients. Neurosurgery 2010;66:
323–332.
12. Schlesinger D, Benedict S, Diederich C, Gedroyc W, Klibanov A,
Larner J. MR-guided focused ultrasound surgery, present and future.
Med Phys 2013;40:080901.
13. Du J, Carl M, Bydder M, Takahashi A, Chung CB, Bydder GM. Quali-
tative and quantitative ultrashort echo time (UTE) imaging of cortical
bone. J Magn Reson 2010;207:304–311.
14. Du J, Bydder M, Takahashi AM, Carl M, Chung CB, Bydder GM. Short
T2 contrast with three-dimensional ultrashort echo time imaging.
Magn Reson Imaging 2011;29:470–482.
15. Hafner S. Fast imaging in liquids and solids with the back-projection low
angle shot (BLAST) technique. Magn Reson Imaging 1994;12:1047–1051.
16. Madio DP, Lowe IJ. Ultra-fast imaging using low flip angles and fids.
Magn Reson Med 1995;34:525–529.
17. Wu Y, Ackerman JL, Chesler DA, Graham L, Wang Y, Glimcher MJ.
Density of organic matrix of native mineralized bone measured by
water- and fat-suppressed proton projection MRI. Magn Reson Med
2003;50:59–68.
18. Weiger M, Pruessmann KP, Hennel F. MRI with zero echo time: hard
versus sweep pulse excitation. Magn Reson Med 2011;66:379–389.
19. Weiger M, Brunner DO, Dietrich BE, M€uller CF, Pruessmann KP. ZTE
imaging in humans. Magn Reson Med 2013;70:328–332.
20. Grodzki DM, Jakob PM, Heismann B. Ultrashort echo time imaging
using pointwise encoding time reduction with radial acquisition
(PETRA). Magn Reson Med 2012;67:510–518.
21. Grodzki DM, Jakob PM, Heismann B. Correcting slice selectivity in
hard pulse sequences. J Magn Reson 2012;214:61–67.
22. Wiesinger F, Sacolick L, Kaushik S, Ahn S, Delso G, Shanbhag D.
Zero TE bone imaging. In: Proceedings of the 22nd Annual Meeting
of ISMRM, Milan, Italy, 2014. p. 4261.
23. Wong STS, Roos MS. A strategy for sampling on a sphere applied to
3D selective RF pulse design. Magn Reson Med 1994;32:778–784.
24. Jackson JI, Meyer CH, Nishimura DG, Macovski A. Selection of a con-
volution function for Fourier inversion using gridding [computerised
tomography application]. IEEE Trans Med Imaging 1991;10:473–478.
25. Beatty PJ, Nishimura DG, Pauly JM. Rapid gridding reconstruction
with a minimal oversampling ratio. IEEE Trans Med Imaging 2005;24:
799–808.
26. Roemer PB, Edelstein WA, Hayes CE, Souza SP, Mueller OM. The
NMR phased array. Magn Reson Med 1990;16:192–225.
27. Veit-Haibach P, Kuhn FP, Wiesinger F, Delso G, von Schulthess G.
PET–MR imaging using a tri-modality PET/CT–MR system with a
dedicated shuttle in clinical routine. Magn Reson Mater Phys Biol
Med 2013;26:25–35.
28. Bernstein MA. Handbook of MRI Pulse Sequences. Amsterdam, The
Netherlands; Boston, MA: Academic Press; 2004.
29. Aitken AP, Giese D, Tsoumpas C, Schleyer P, Kozerke S, Prieto C,
Schaeffter T. Improved UTE-based attenuation correction for cranial
PET-MR using dynamic magnetic field monitoring. Med Phys 2014;
41:012302.
30. Hofmann M, Steinke F, Scheel V, Charpiat G, Farquhar J, Aschoff P,
Brady M, Scholkopf B, Pichler BJ. MRI-based attenuation correction
for PET/MRI: a novel approach combining pattern recognition and
atlas registration. J Nucl Med 2008;49:1875–1883.
31. Wollenweber SD, Ambwani S, Lonn AHR, Mullick R, Wiesinger F,
Piti Z, Tari A, Novak G, Fidrich M. Evaluation of an atlas-based PET
head attenuation correction using PET/CT & MR patient data. IEEE
Nucl Sci Symp (NSS/MIC) 2012;4048–4053.
32. Kops ER, Herzog H. Template based attenuation correction for PET in
MR-PET scanners. IEEE Nucl Sci Symp (NSS/MIC) 2008;3786–3789.
33. Wagenknecht G, Kops ER, Tellmann L, Herzog H. Knowledge-based
segmentation of attenuation-relevant regions of the head in T1-
weighted MR images for attenuation correction in MR/PET systems.
IEEE Nucl Sci Symp (NSS/MIC) 2009;3338–3343.
34. Sled JG, Zijdenbos AP, Evans AC. A nonparametric method for auto-
matic correction of intensity nonuniformity in MRI data. IEEE Trans
Med Imaging 1998;17:87–97.
35. Gibiino F, Sacolick L, Menini A, Landini L, Wiesinger F. Free-breath-
ing, zero-TE MR lung imaging. MAGMA 2014.
114 Wiesinger et al.


![[Infográfico] O Que Os Heróis Podem Te Ensinar Sobre Como Estudar Para Concursos Públicos DO ZERO ABSOLUTO - Esquemaria](https://static.fdocuments.us/doc/165x107/5695cf4f1a28ab9b028d7fac/infografico-o-que-os-herois-podem-te-ensinar-sobre-como-estudar-para-concursos.jpg)