ZERO ENERGY HOMES – TRANSFORMING SACRAMENTO’S NEW …
40
ZERO ENERGY HOMES – TRANSFORMING SACRAMENTO’S NEW HOME MARKET Presentation to ACEEE Symposium On Market Transformation March 31, 2008 Mike Keesee Project Manager Energy Efficiency Customer Research & Development SMUD
Transcript of ZERO ENERGY HOMES – TRANSFORMING SACRAMENTO’S NEW …

ZERO ENERGY HOMES –TRANSFORMING SACRAMENTO’S
NEW HOME MARKET Presentation to ACEEE Symposium On
Market TransformationMarch 31, 2008
Mike KeeseeProject Manager
Energy Efficiency Customer Research & Development
SMUD

SMUD’s Zero Home Experience
• SMUD’s ZEH R&D Experience• SolarSmart Homes• Home of the Future• Lessons Learned/Recommendations

SMUD Profile• Service territory area: 900 sq mi (2331 sq
km)• Population: 1.4 million• Board Members: 7 members elected by
voters• Revenues: $1.4 Billion• Employees: 2,200+• Summer Peak: 3299 MW in July 2006• 2nd largest muni in California, 6th in nation

SMUD Profile2006 Statistics
Customers GWh RevenuesResidential 517,000 4,760 $515 MCommercial 68,000 6,039 $567 MSubtotal 585,000 10,799 $1,082 MSale of Surplus Power 3,964 $ 192 MSale of Surplus Natural Gas $ 113 MTotal 14,764 $1.39 BAverage Annual Consumption and Cost
Residential 9,200 kWh 10.8¢/kWhCommercial89,000 kWh 9.4¢ /kWh

ZEH Drivers - Policy
• SB 1– 125 MW Goal
• PUC Big Bold Initiative– ZEH by 2020
• AB 32 GHG Emissions• SMUD Efficiency Goals
– 15% reduction in energy use in 10 years

ZEH Drivers - PV
• Residential New Construction is PV’s “Holy Grail”– High volume drives down costs– Standardized system design– Builders masters of cost cutting
• New Solar Homes – Energy Efficiency with 2 kW PV Energy Roofs– Potential: 16+MW Capacity in District per year
• At <$3/W, energy cost of <8-10¢/kWh for delivered power
• Our customers want it!

ZEH Drivers - New PV Products Available
GE Energy BP Solar
Kyocera SolarSharp SolarSunPower
Open Energy

Building America/NREL
• Voluntary US Department of Energy Program• CRADA w/ NREL• Current Goals
– 60% Reduction in Energy Bill– Target Annual Net-Zero Electricity Use– Use Commercially Available Technologies
• Annual Net-Zero Energy Use by 2020

ZEH Analysis
• NREL BEopt Analysis– Building America Benchmark Home
• Title-24 Analysis– ZEH Proforma
• Energy Savings/Incremental Costs

General BEopt Capabilities• Finds optimal designs for the entire range of
energy savings from the base case to zero net energy
• Evaluates realistic (discrete) options for building efficiency and solar water heating
• Identifies near-optimal alternative designs• Automatically implements the BA Benchmark• Runs hour-by-hour physically detailed simulations:• DOE2 and TRNSYS• Accurately accounts for interactions across
categories (e.g., glass type and HVAC)Courtesy of NREL
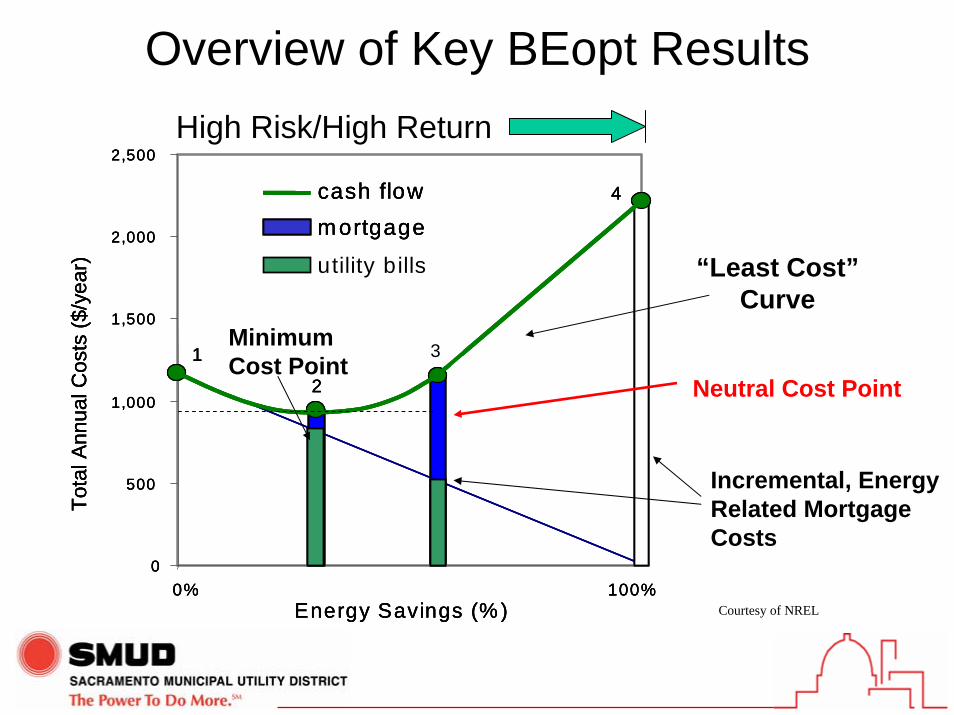
Overview of Key BEopt Results
0
500
1,000
1,500
2,000
2,500
0% 100%Energy Savings (% )
Tota
l Ann
ual C
osts
($/y
ear)
mortgage
utility bills
cash flow
1
2
3
4
0
500
1,000
1,500
2,000
2,500
0% 100%Energy Savings (% )
Tota
l Ann
ual C
osts
($/y
ear)
mortgage
utility bills
cash flow
1
2
3
4
0
500
1,000
1,500
2,000
2,500
0% 100%Energy Savings (% )
Tota
l Ann
ual C
osts
($/y
ear)
mortgage
utility bills
cash flow
1
2
3
4
Neutral Cost Point
Incremental, Energy Related MortgageCosts
Minimum Cost Point
“Least Cost”Curve
High Risk/High Return
Courtesy of NREL

Parametrics(~750,000 simulations)
Optimization (~750 simulations)
Sequential Search
Optimization
Courtesy of NREL

BEopt outputCourtesy of NREL
Courtesy of NREL

NREL Reference House
• 2400 SF, 3 Bdrm, 2 Ba• 16% Glazing• Back Facing West• 4 Occupants Courtesy of NREL

What Efficiency/Renewables Combination Maximizes Cost
Effective Savings?
Courtesy of NREL

ZEH Strategy: Efficiency Minimizes Energy Use, PV Supplies the Rest!
Courtesy of NREL

What About Impact on Peak Electric Demand?
Courtesy of NREL

Zero Peak Cooling Strategy:Efficiency+PV+Thermal Storage
Courtesy of NREL

BEopt Economic Assumptions
•30 year analysis period•3% inflation rate•5% discount rate (nominal)•7% interest rate (nominal)•$7.50/watt PV (installed cost)•$1/Therm natural gas•State average electric costs (EIA 2005)•National average efficiency costs

SMUD ZEH R&D Projects• Beazer Powerhouse 2000-02
– 5 Subdivision/ 18 Units– Entry level – Optional feature– 3,300 Watt ac
• Morrison Homes Lakeside 2003– 12 units– Move-up, in-fill project– Spec’d and Optional Upgrade– >30% Title-24, 2 kW ac Solar

SMUD ZEH R&D Projects• Premier Homes Premier Gardens 2004-05
– 95 units– Entry level, in-fill project– >30% Title-24, 2 kW PV– Standard Feature
• Treasure Homes 2006-07– 32 units– Entry level, in-fill project– >40% Title-24, 2 kW PV– Standard Feature

Energy Efficiency Features23-42% better than 2005 Title 24 plus solarMeasure Base ZEHAttic Insulation R-38 R-38Radiant Barrier No YesWall Insulation R-13 R-13 + 1” R-4.2 FoamQuality Installation No YesLow Air Infiltration Yes YesWindows Vinyl, low U,SHGC Vinyl, Low U, SHGCFURN AFUE 0.80 0.95A/C SEER 13 (3.7 ton) 14 w/TXV (3.1 ton)ACCA Design No Yes -- Short RunsDuct Testing No YesWater Heater storage EF .60 Tankless EF .82*Distribution Standard Pipe insulation*Home Energy Rating No YesFluorescent Lighting Yes Yes (All fixtures)Solar Electric NA 2kW AC Solar System
* Water Heating Measures Optional under SolarSmart

Real Bill SavingsSolar vs No n So lar Avg Mo nthly Bi lls 2007
$ 0.0 0
$2 0.0 0
$4 0.0 0
$6 0.0 0
$8 0.0 0
$100.0 0
$120.0 0
Prem ier H om e s $3 5.3 0 $4 4.1 2 $ 29 .27 $ 18 .37 $1 9. 88 $2 0.3 3 $ 40 .3 1 $ 37 .30 $5 6. 32 $2 6.2 0 $26 .8 1 $ 45 .92 $5 8. 76
NO N ZEH AV G B IL L $7 2.7 7 $6 2.7 7 $ 52 .50 $ 47 .46 $5 3. 63 $6 4.4 9 $ 101 .5 5 $ 96 .43 $1 24. 57 $6 0.4 1 $51 .7 5 $ 73 .46 $8 4. 17
Tre asu re H om es $3 4.2 7 $3 6.3 3 $ 34 .59 $ 20 .04 $1 6. 83 $2 0.1 1 $ 32 .2 1 $ 52 .03 $5 3. 77 $4 1.4 4 $21 .7 5 $ 36 .57 $4 5. 59
Avg . M o . Bill
Jan , 0 7 Feb , 0 7 Ma rch , 0 7 A pr il, 07 Ma y, 0 7 Ju ne , 0 7 July, 0 7 A ug , 0 7 Se pt , 0 7 Oct, 07 No v, 0 7 D e c, 0 7
P rem ier a nd Trea sure m onthly e lec tric bills are 5 1% a nd 53 % less , respe ct ive ly, tha n N on-S olar Hom e s a nd 52 % and 53% lo we r, repse c tive ly, tha n Av g. S MU D Res ident ial Cus tom e r e le ct ric bill.

Real Bill SavingsMonthly Avg Gas Bills ZEH vs Non ZEH
$0.00
$20.00
$40.00
$60.00
$80.00
$100.00
$120.00
2006-09 2006-10 2006-11 2006-12 2007-01 2007-02 2007-03 2007-04 2007-05 2007-06 2007-07 2007-08
Premier GardensCresleighTreasure
Premier 23.6% less and Treasure 24.2% less than Cresleigh
Courtesy PG&E

Real Peak Demand Savings5.14 kW/Customer A ug 25 - 31 2007 Z EH vs . No n-ZEH A vg Lo ad Profile
- 0.5
0
0.5
1
1.5
2
2.5
3
12AM
1AM
2A M
3A M
4A M
5AM
6A M
7A M
8A M
9AM
10AM
1 1A M
1 2P M
1P M
2PM
3PM
4P M
5P M
6PM
7PM
8P M
9P M
10PM
11PM
kW
D a ta Avera ge of ZEH N et Gr id L oa d (kW )
D a ta Avera ge of Po we r Prod uce d b y PV (kW )
D a ta Avera ge of N on-ZEH N e t G rid Lo ad (k W)
D a ta Avera ge of T re asu re N et Gr id L oa d (kW )
D a ta Avera ge of Po we r Prod uce d b y T rea sure P V (kW )
Pe ak E nd in g 5 p m 1.7 8 kW
P e ak E nd ing 5 p m2.62 kW
Prem ier P eak Savings 0.72 kW.48 kW Solar, .25 kW Eff.T reasure Peak Savings 0.84.43 kW Solar, .42 kW Eff
98 .1 ° Avg H igh Temp
Pe ak E nd in g 5 p m 1.8 9 kW
Avg Sys tem Peak 3,000 M W

Premier Gardens Distribution System Study
• Impacts on Distribution System – Indiscernible impact on substation voltage and
transformers– Significant impact at peak July/Aug– West facing PV has more impact

SMUD/Lennar Partnership• 1,254 Single Family Homes
in 14 Communities over 4 years (2007-10)
• Maximum SMUD contribution ~$10.8 Million
• 2,410 kW installed solar• Peak Reduction
– 1.51 kW avg. from 1-9 pm, per home
– Total of 1.89 MW• Energy Savings
– 5,147 kWh/yr avg., per home
– Total of 6,454 MWh • Access to valuable real
world data (R&D)

Sacramento Area Partnerships
Market momentum - 46 Communities, over 4,000 new homes over next 4 years
• Sunrise Lofts LLC• Tim Lewis Communities Multiple• Homes by Towne Multiple• Regis• Centex • 49 Mile Development• DR Horton• Standard Pacific Homes• Woodside Homes

The Need at SMUDZero Energy or Zero Peak?4-7 pm peak, July & August
Hours of System Load Duration
2,0002,1002,2002,3002,4002,5002,6002,7002,8002,9003,000
1 25 49 73 97 121
145
169
193
217
241
265
289
313
Hours per year
Syst
em P
eak
(MW
) Critical peak: 500 MW for < 50 hrs/year

Current ZEH Results5.14 kW/Customer Z EH vs Non ZE H Net L oad July 5, 2007
-0 .5
0
0.5
1
1.5
2
2.5
3
3.5
4
12AM
1AM
2AM
3AM
4AM
5AM
6AM
7AM
8AM
9AM
10AM
11AM
12PM
1PM
2PM
3PM
4PM
5PM
6PM
7PM
8PM
9PM
10PM
11PM
kW
Average o f Prem ier Net Grid Load (kW )Average o f Power Produced by PV (k W )Average o f Non-ZEH Net Grid Load (kW )Average o f Treasure Net Grid Load (kW )Average o f Power Produced by Treasure PV (k W)
Peak d emand 3,099 M W ending @ 5 pm temp erature 107 degrees @ 4 p m
4-7 p m Avg PeakNon ZEH 3.63 kW
Premier 3.03 kW - .59 less( .39 PV/.2 EF F)T reasure 2 .93 kW - .69 less(.44 PV/.25 EFF)
Treas ure peak demand ending 5 pm 2.82 kW
Non-ZEH peak dem and end ing @ 5 pm 3 .57 kW
Prem ier Peak demand end ing 5 pm 2.49 kW

Home of the Future • Build a true Net Zero Energy Home with no
annual electric or natural gas utility bill, and has zero net electric demand during summer peak periods– Annual Source Energy: 80% Reduction– Zero Net Summer Peak Electric Demand:
4 PM to 8 PM• Demonstrate the features of the home to
the public and builders

HOF Energy Performance Specs• Advanced Framing 2x6/R19-R21cavity/R12 insulating sheathing (R30 wall
assembly) • R50 ceiling assembly• Tight Envelope, .0002 SLA (4 ACH50)• Low e/low SHGC glazing (0.3 U-value, 0.26 SHGC)• 100% CFL/LEED Lighting• SEER 18 or AC/Evap Condensor/2 ton • AFUE 90+ furnace or solar assisted hydronic• Solar hot water with tankless gas hot water backup (EF 0.80+) or Hi-Eff boiler• Tight ducts, inside conditioned space (mastic, < 5% leakage)• Gas (cooking, clothes) and Energy Star Appliances • Third part testing and inspection• 3.5kW AC PV, grid-tied (dispatchable) battery back up• Home Automation System• Estimated cost increase relative to standard home: +$20.00/ft2
Notes:1. Equivalent packages may be substituted, based on specific builder preferences2. Incremental costs estimated relative to minimum T-24

Peak Demand: HOF Base, 4kWac West Array
HOF Electric Demand Reduction
-2
-1
0
1
2
3
4
5
1:00 7:00 13:00 19:00 1:00 7:00 13:00 19:00 1:00 7:00 13:00 19:00
July4-July 6 TMY Cooling Peak
Hou
rly D
eman
d (k
W)
T24
HOF

Program ChallengesProgram Challenges
• Current Real Estate Market– Slow sales, bldr consolidation
• PV and SDHW Costs (and supply)• Builder Concerns
– Market & product concerns• Integration w/ State NHSP program
– Lagging program, 2008 T-24 Changes• QA Concerns

Lessons Learned - Buyers• Significant utility bill savings• Solar/Efficiency has little appeal as an
option but immense appeal as a standard feature
• Energy savings needs to be sold on cash flow not payback
• New home buyers are unfamiliar with the benefits of owning their own PV system
• Solar and efficiency have not hit “critical mass,” with buyers, but momentum is building

Lessons Learned - Builders• Most builders in “wait and see” mode• Builder skepticism regarding energy efficiency
and solar is driven by concerns over cost and demand
• Builders believe demand is widespread but weak (“soft demand”)
• Clear builder preference for building-integrated PV systems over roof mounted PV systems
• Concerned about the availability of qualified manufacturers and installers of solar power systems
• Builders want to use their own subcontractors and/or have turn key solutions

Lessons Learned - Others• UTILITIES
– Peak Matters!– Significant peak demand reduction. – Potential Distribution System savings (yet
to be proven)• Engage and train Local Government• PV manufacturers must be full service
suppliers – installation support, sales training, warranty

Recommendations• Partner w/ the Building America Program • Focus early program efforts on “Pioneers” –
builders willing to pursue solar and efficiency regardless of what other builders do
• Reward the Pioneers • Approach builders from the same perspective as
buyers – that solar/efficiency features make economic sense beyond its altruistic benefits
• Keep it Simple – Prescriptive Measures and Min Paperwork

Recommendations
• Assure builders about the availability of parts and installation expertise in the area
• Aggressive public education campaign• Engage your local utility• Work w/ local building association• Sponsor comprehensive training
– Builders, Subs, Bldg Officials, Solar Contractors

More Information
Mike KeeseeProject Manager(916) 732-5244
Ren Anderson(303) 384-7433