Zero Emission Bus Feasibility Study - DASH bus
32
Zero Emission Bus Feasibility Study Submitted by: Center for Transportation and the Environment Issued: December 6, 2019
Transcript of Zero Emission Bus Feasibility Study - DASH bus

Zero Emission Bus Feasibility Study
Submitted by: Center for Transportation and the Environment
Issued: December 6, 2019

DASH Zero Emission Bus Feasibility Study
Alexandria Transit Company
Center for Transportation and the Environment
Table of Contents 1 Introduction............................................................................................................................................1
2 BackgroundAnalysis............................................................................................................................22.1 LocalSupport&Initiatives....................................................................................................................................22.2 FundingSources..........................................................................................................................................................32.3 DASHZEBResearch&Demonstrations..........................................................................................................42.4 DASHStrategicPlanning.........................................................................................................................................6
3 HighLevelFeasibilityAnalysis..........................................................................................................83.1 Assumptions..................................................................................................................................................................83.1.1TypicalBatteryCapacity..................................................................................................................................93.1.2LocalClimateConditions...............................................................................................................................103.2 Current&FutureDASHBlockStructures....................................................................................................123.2.1CurrentDASHBlockStructure....................................................................................................................133.2.2Assumptionsfor2030Vision......................................................................................................................133.2.3FutureDASHBlockStructure......................................................................................................................143.3 EstimatedZeroEmissionBusesRequired..................................................................................................153.3.1CurrentSystem....................................................................................................................................................163.3.2FutureSystem(2030Vision).......................................................................................................................163.4 DeploymentOptions...............................................................................................................................................183.4 FeasibilityAnalysisConclusions.......................................................................................................................19
4 BestPractices........................................................................................................................................20
Appendices.....................................................................................................................................................21Appendix1:CurrentBlockEnergyAssessment...............................................................................................22Appendix2:LessonsLearned....................................................................................................................................25
DASH Zero Emission Bus Feasibility Study
Alexandria Transit Company
Center for Transportation and the Environment
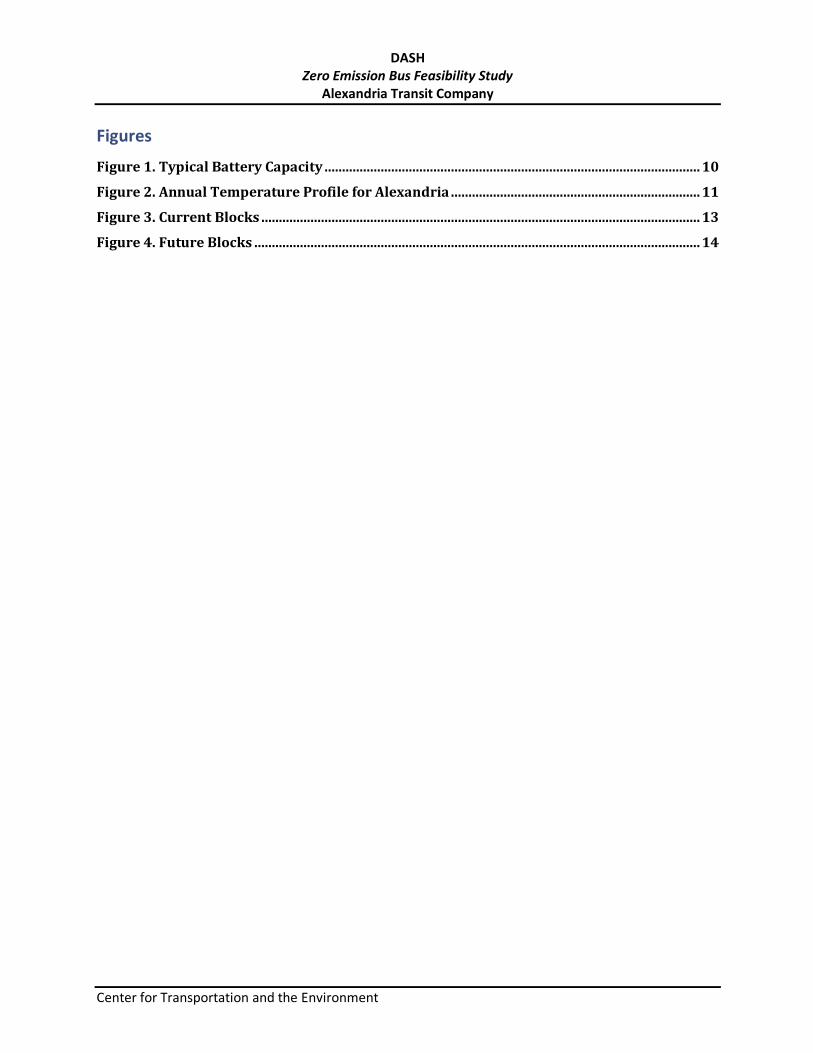
Figures
Figure1.TypicalBatteryCapacity...........................................................................................................10
Figure2.AnnualTemperatureProfileforAlexandria.......................................................................11
Figure3.CurrentBlocks.............................................................................................................................13
Figure4.FutureBlocks...............................................................................................................................14

DASH Zero Emission Bus Feasibility Study
Alexandria Transit Company
Center for Transportation and the Environment
Tables
Table1.DASHFundingSources..................................................................................................................3
Table2.BEBDemonstrationSummary....................................................................................................6
Table3.ActiveFleetCurrentComposition..............................................................................................7
Table4.FeasibilityStudyScenarios..........................................................................................................8
Table5.Assumptionsfor2030Vision(ChangesfromCurrent)......................................................14
Table6.ZeroEmissionBusesRequiredUnderCurrentRouteStructure.....................................16
Table7.ZeroEmissionBusesRequiredUnderFutureRouteStructure.......................................17

DASH Zero Emission Bus Feasibility Study
Alexandria Transit Company
Center for Transportation and the Environment Page 1 of 32
1 Introduction DASH is the city bus system for Alexandria, Virginia. It is operated by the Alexandria Transit Company, a non-profit service corporation wholly owned by the City of Alexandria. DASH provides service to nearly four million passengers annually within portions of the City of Alexandria and between the City and the Pentagon Metrorail station. As part of its key role in providing safe, reliable service while supporting key city goals to provide environmentally friendly alternatives to the single occupant vehicle, DASH has undertaken several initiatives to understand zero emission bus technologies and their implementation. As part of their overall long-term fleet policy planning, DASH has engaged the Center for Transportation and the Environment (CTE) to perform a zero-emission bus fleet feasibility and planning study.
The study was conducted in two parts:
• Part 1 - Background Analysis & Feasibility Study: This body of work helps DASH understand the feasibility of transitioning to a zero-emission bus fleet based on: 1) evaluating the internal efforts taken to date, 2) collecting information on DASH’s fleet, facilities, routes (including current and future block schedules) as well as governmental support and environmental conditions in the city, 3) performing a high level feasibility assessment based on this information, and 4) including supplemental best practices and external research.
• Part 2- Implementation Plan Scope: Based on the information from Part 1, CTE developed a draft scope of work that identifies tasks that are needed to develop a plan to transition the fleet to 100% zero emission.
This document describes Part 1– Background Analysis & Feasibility Study, shown in the first panel in the figure below.
DASH Zero Emission Bus Feasibility Study
Alexandria Transit Company
Center for Transportation and the Environment Page 2 of 32
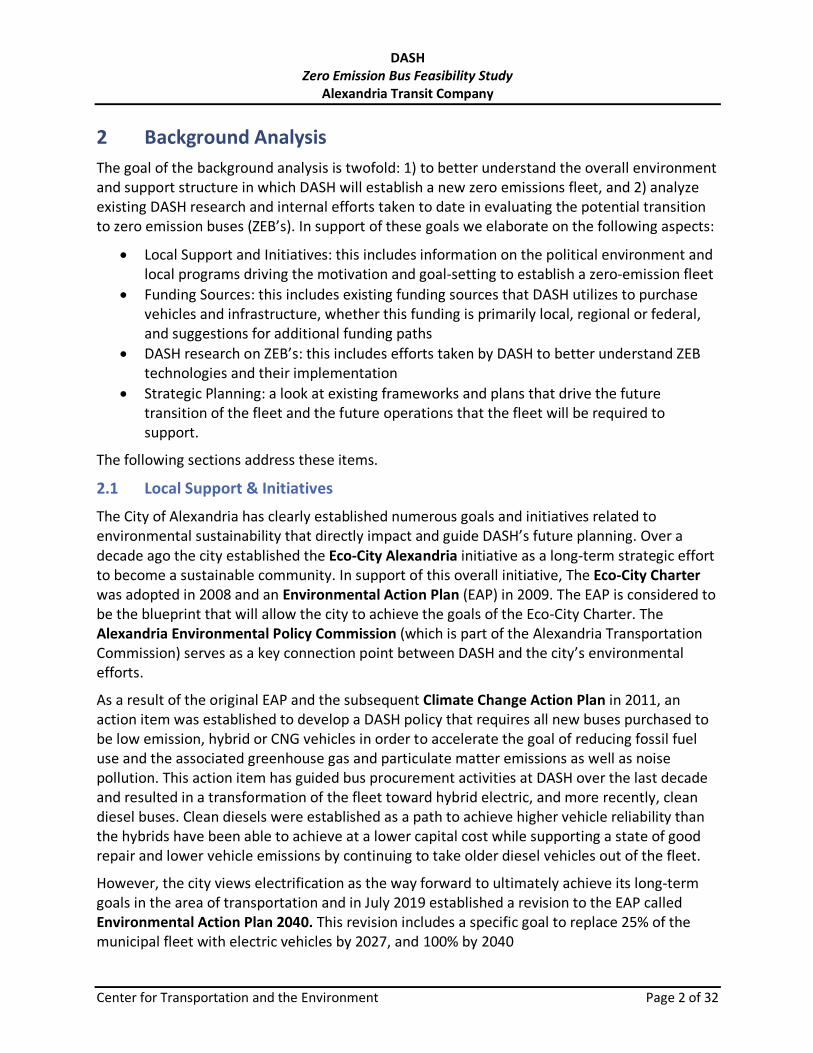
2 Background Analysis The goal of the background analysis is twofold: 1) to better understand the overall environment and support structure in which DASH will establish a new zero emissions fleet, and 2) analyze existing DASH research and internal efforts taken to date in evaluating the potential transition to zero emission buses (ZEB’s). In support of these goals we elaborate on the following aspects:
• Local Support and Initiatives: this includes information on the political environment and local programs driving the motivation and goal-setting to establish a zero-emission fleet
• Funding Sources: this includes existing funding sources that DASH utilizes to purchase vehicles and infrastructure, whether this funding is primarily local, regional or federal, and suggestions for additional funding paths
• DASH research on ZEB’s: this includes efforts taken by DASH to better understand ZEB technologies and their implementation
• Strategic Planning: a look at existing frameworks and plans that drive the future transition of the fleet and the future operations that the fleet will be required to support.
The following sections address these items.
2.1 Local Support & Initiatives
The City of Alexandria has clearly established numerous goals and initiatives related to environmental sustainability that directly impact and guide DASH’s future planning. Over a decade ago the city established the Eco-City Alexandria initiative as a long-term strategic effort to become a sustainable community. In support of this overall initiative, The Eco-City Charter was adopted in 2008 and an Environmental Action Plan (EAP) in 2009. The EAP is considered to be the blueprint that will allow the city to achieve the goals of the Eco-City Charter. The Alexandria Environmental Policy Commission (which is part of the Alexandria Transportation Commission) serves as a key connection point between DASH and the city’s environmental efforts.
As a result of the original EAP and the subsequent Climate Change Action Plan in 2011, an action item was established to develop a DASH policy that requires all new buses purchased to be low emission, hybrid or CNG vehicles in order to accelerate the goal of reducing fossil fuel use and the associated greenhouse gas and particulate matter emissions as well as noise pollution. This action item has guided bus procurement activities at DASH over the last decade and resulted in a transformation of the fleet toward hybrid electric, and more recently, clean diesel buses. Clean diesels were established as a path to achieve higher vehicle reliability than the hybrids have been able to achieve at a lower capital cost while supporting a state of good repair and lower vehicle emissions by continuing to take older diesel vehicles out of the fleet.
However, the city views electrification as the way forward to ultimately achieve its long-term goals in the area of transportation and in July 2019 established a revision to the EAP called Environmental Action Plan 2040. This revision includes a specific goal to replace 25% of the municipal fleet with electric vehicles by 2027, and 100% by 2040

DASH Zero Emission Bus Feasibility Study
Alexandria Transit Company
Center for Transportation and the Environment Page 3 of 32
(https://www.alexandriava.gov/news_display.aspx?id=110544). Together with other key goals and actions (including the adoption of a new Green Building Policy in June 2019), the new initiative supports an overarching goal of reducing community greenhouse gas emissions 50% by 2030 and 100% by 2050. Clearly the city is committed to sustainability, and transportation is a key part of the effort. DASH’s leadership and board has also recommended that DASH eventually convert to fully electric vehicles to meet its fleet replacement needs (TDP FY’19-FY’24) and stated its support to gradually transition the fleet to electric powered buses as soon as it is technically and financially possible. In 2018 DASH also established a Zero-Emission Fleet Working Group to guide transition planning. Finally, the City of Alexandria also supports the Paris Agreement and complementary initiatives in neighboring Washington, DC. The nation’s capital currently participates in the Mayors National Climate Action Plan Agreement (MNCAA) and has its own goal of buying all zero emission buses from 2025 forward.
2.2 Funding Sources
DASH’s funding currently comes from primarily local and regional sources. Capital funding for bus replacements and facility improvements comes primarily from the city’s Capital Improvement Program funds, as well as funds from the Northern Virginia Transportation Authority (NVTA) and the Virginia Department of Rail and Public Transportation (DRPT). Additional funding for electric buses is being provided by the VW Settlement Fund which is being managed by the Virginia Department of Environmental Quality (DEQ). $14 million of the nearly $94 million total VW Settlement for Virginia is being allotted to electric bus transit systems across the state. Primary examples of DASH capital funding are in Table 1 below.
Table 1. DASH Funding Sources
Source Amount Example Projects Funded
CIP (FY’19-FY-28) $51 million Bus & battery replacements, facility expansion, technology
DRPT Smart Scale $11.3 million Bus facility expansion from 90 to 130 bus capacity, 6 buses
NVTA (FY’18-FY’23 Six Year Plan) $11.9 million 8 ZEBs and facility upgrades for electric buses
VW Mitigation Cost differential between clean diesel and electric
6 battery electric buses (funded in 2020)
Operating costs for DASH are primarily covered by a subsidy from the City of Alexandria’s General Fund each year. The city also provides operational funding from the Transportation Improvement Program (TIP) and Capital Improvement Program (CIP). Fare revenues cover
DASH Zero Emission Bus Feasibility Study
Alexandria Transit Company
Center for Transportation and the Environment Page 4 of 32
approximately 20-25% of operating costs.
DASH does not generally receive federal funds for its capital improvement projects. In lieu of applying for its own federal funding, DASH provides information to the National Transit Database (NTD) which supports additional funding to the City of Alexandria, a designated recipient, who in turn uses the funds to subsidize WMATA. As mentioned above, the City of Alexandria also subsidizes DASH. A few years ago, DASH did get federal funds through the Congestion Mitigation and Air Quality (CMAQ) program and Regional Surface Transportation Program (RSTP) when those programs were managed through the Federal Highway Administration (FHWA), but DASH discontinued these grant requests after these programs were put under the Federal Transit Authority (FTA). DASH does not currently abide by the requirements to be a recipient of FTA funds but has recently started re-evaluating the effort and cost to do so in the future relative to the potential funds that could be obtained.
Obviously, any additional funding source can be of benefit in assisting and budgeting for individual deployment projects as part of a larger fleet transition effort. However, DASH should also consider the requirements of various federal programs when deciding whether to pursue such funding. Application criteria (available at the appropriate federal websites) should be evaluated to make sure the appropriate data and supporting documents are available that would result in competitive entries. Furthermore, DASH should assess the impacts of any post-award reporting requirements, such as Federal Financial Reports and Milestone Reports that would require ongoing monitoring during any deployment project. Regardless of funding source, CTE recommends that once DASH starts operating their first battery electric buses, they should put a priority on tracking vehicle performance and emissions reductions through a validation reporting/KPI process. This not only strengthens the case for future funding but also helps the agency and city understand if the project is meeting the emissions and financial goals of the program.
2.3 DASH ZEB Research & Demonstrations
DASH has taken a number of steps to better understand ZEB technologies and the requirements for implementation and operation. This has included the following:
• Interacting with other transit agencies that have done bus pilots/deployments to share information and learn from their experience
• Interacting with electric bus manufacturers to learn about their offerings, the technologies they employ and present/future product lines
• Participating in workshops and plant trips to OEM facilities as available • Meeting with the local utility (Dominion Energy) to discuss applicability of current rate
plans and potential future rate plans specific to ZEB’s • Organized both battery electric and fuel cell electric bus demonstrations on DASH’s
actual routes in order to collect real-world data on potential vehicle performance and the sensitivities relative to DASH’s route structure and conditions.
A specific example of interacting with OEM’s is a trip that DASH personnel took to visit the New Flyer Vehicle Innovation Center in Anniston, AL, where they participated in a workshop and

DASH Zero Emission Bus Feasibility Study
Alexandria Transit Company
Center for Transportation and the Environment Page 5 of 32
learned about the vehicle manufacturing process. This will help DASH in the future as they determine vehicle specifications that are most relevant and beneficial to their operation. Meeting with the local utility is an important step that many agencies do not think of during early planning- one which can have a future impact as the fleet expands and charging becomes a larger percentage of overall operating expenses. Available rate plans and charging schedule can dramatically impact overall cost to charge the buses, and many utilities have not yet developed rate schedules that are optimized for electric bus charging. Furthermore, DASH has had numerous discussions with Dominion Energy about Dominion’s mandate in establishing a future electric vehicle rate plan, and they have also discussed plans for the creation of Time of Day/Time of Use rates that could benefit the agency if they could take advantage of off-peak hours to charge the fleet.
It is certainly important for an agency to obtain some real-world experience with ZEB’s before and after they make the decision to select one or more OEM’s and issue purchase orders. One way to do this is to take advantage of bus demonstrations on their local routes. The other way recommended by CTE is to plan one or more pilot programs using relatively small bus deployments to gain experience in operating these buses and setting expectations for performance and maintenance. This includes the realization and documentation of any operational limitations (e.g. battery capacity/range) that must be accounted for in the agency’s process & route planning. This recommendation is already being implemented, as DASH has been awarded Volkswagen settlement funds enabling the purchase and deployment of six battery electric buses. The agency decided to award three buses to New Flyer and three to Proterra for the purposes of this project.
Regarding bus demonstrations, DASH has completed one program with bus OEM New Flyer and one with Proterra. The first one was done with a New Flyer 40-foot Xcelsior Charge in February 2018. The bus was run on a number of different routes at varying times of day and varying temperatures. This was an effective time to test a battery electric bus (BEB) and get a sense for the potential impact of the use of HVAC on overall efficiency, especially with regard to electric heat. The second demonstration was in May 2018 with a Proterra 40-foot Catalyst E2 model. Due to the moderate spring weather there were no extreme effects of HVAC, but the test provided the team additional data from a different OEM’s product for comparison purposes. CTE finds it useful to compare and contrast between different OEM’s in different conditions, especially since it allows DASH to get a sense for the design priorities each OEM has and how each company interacts and coordinates with its potential customers. A summary of the demonstrations is in Table 2 below.

DASH Zero Emission Bus Feasibility Study
Alexandria Transit Company
Center for Transportation and the Environment Page 6 of 32
Table 2. BEB Demonstration Summary
Date OEM / Model Measured Efficiency * Observations
February 2018 New Flyer 40’ Excelsior Charge
2.26 – 2.93 kWh/mi
(Average 2.55)
HVAC energy usage significant due to cold weather, no significant impacts from grade/hills
May 2018 Proterra 40’ Catalyst E2
2.0 – 2.6 kWh/mi
(Average 2.3)
Moderate spring weather, no extreme HVAC impacts
* Note: the term “efficiency” with regard to battery electric buses refers to the amount of energy consumed per mile of travel. Therefore, lower numbers represent better efficiency.
Finally, CTE recommends that, in addition to demonstrations and pilot deployments, another good way to incorporate real-world data into the planning process is through route and vehicle modeling and simulation. In this process, actual route data is collected to derive speed and elevation/grade across representative routes from the agency. Then this information is fed into a computer simulation that runs these routes using vehicle system data based on actual specifications from the manufacturer. In this way, energy usage and potential charging schedules can be estimated relatively early in the process, the ideal time being after a bus model is selected and before a purchase order is placed with the OEM.
2.4 DASH Strategic Planning
DASH has been engaged in significant strategic planning in recent months due to the fleet replacement initiatives driven by the local plans and commitments discussed earlier in this report. There are two key strategic planning documents DASH uses to communicate long range plans for its fleet, infrastructure, and service/route structure. The first is the annual Transit Development Plan (TDP), which contains sections that talk about current and future fleet structure and size, funding sources, and details of projects that will accomplish the fleet replacement schedule and associated facility improvements. The second document is the Alexandria Transit Vision (ATV), the result of a process by which DASH evaluates its overall service and route structure looking into the future to best support the needs of a growing and changing community.
Through review of the TDP and additional information shared by the DASH team on this project, CTE has compiled a view of the current fleet structure and planned replacement dates. See Table 3 below.
DASH Zero Emission Bus Feasibility Study
Alexandria Transit Company
Center for Transportation and the Environment Page 7 of 32
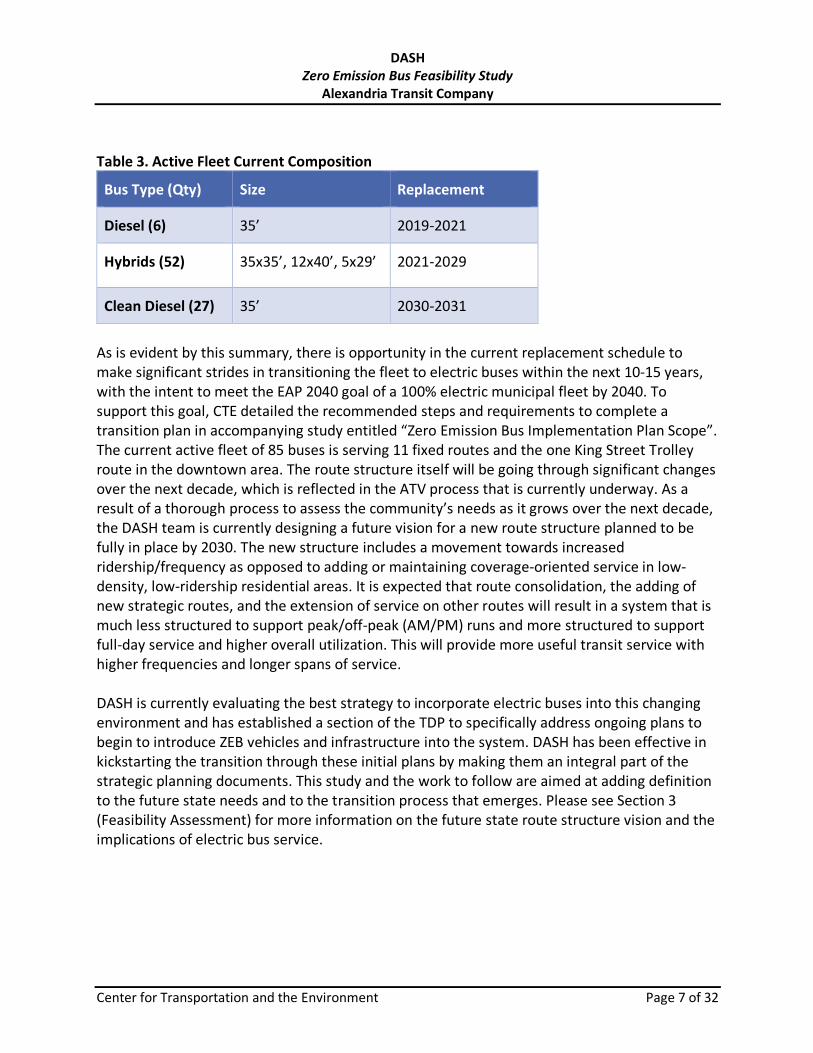
Table 3. Active Fleet Current Composition
Bus Type (Qty) Size Replacement
Diesel (6) 35’ 2019-2021
Hybrids (52) 35x35’, 12x40’, 5x29’ 2021-2029
Clean Diesel (27) 35’ 2030-2031
As is evident by this summary, there is opportunity in the current replacement schedule to make significant strides in transitioning the fleet to electric buses within the next 10-15 years, with the intent to meet the EAP 2040 goal of a 100% electric municipal fleet by 2040. To support this goal, CTE detailed the recommended steps and requirements to complete a transition plan in accompanying study entitled “Zero Emission Bus Implementation Plan Scope”. The current active fleet of 85 buses is serving 11 fixed routes and the one King Street Trolley route in the downtown area. The route structure itself will be going through significant changes over the next decade, which is reflected in the ATV process that is currently underway. As a result of a thorough process to assess the community’s needs as it grows over the next decade, the DASH team is currently designing a future vision for a new route structure planned to be fully in place by 2030. The new structure includes a movement towards increased ridership/frequency as opposed to adding or maintaining coverage-oriented service in low-density, low-ridership residential areas. It is expected that route consolidation, the adding of new strategic routes, and the extension of service on other routes will result in a system that is much less structured to support peak/off-peak (AM/PM) runs and more structured to support full-day service and higher overall utilization. This will provide more useful transit service with higher frequencies and longer spans of service. DASH is currently evaluating the best strategy to incorporate electric buses into this changing environment and has established a section of the TDP to specifically address ongoing plans to begin to introduce ZEB vehicles and infrastructure into the system. DASH has been effective in kickstarting the transition through these initial plans by making them an integral part of the strategic planning documents. This study and the work to follow are aimed at adding definition to the future state needs and to the transition process that emerges. Please see Section 3 (Feasibility Assessment) for more information on the future state route structure vision and the implications of electric bus service.

DASH Zero Emission Bus Feasibility Study
Alexandria Transit Company
Center for Transportation and the Environment Page 8 of 32
3 High Level Feasibility Analysis The purpose of the high-level feasibility analysis is to assess current and projected route structures and estimate the capability of an electric fleet to meet those requirements given the current technology capabilities in the industry. Specifically, we incorporate CTE’s knowledge and experience regarding two leading technologies: the battery electric bus (BEB) and the fuel cell electric bus (FCEB). For BEB’s we utilize generic, average efficiencies expressed in kWh/mi to estimate the energy requirements per block and the capability of BEB’s to complete those blocks on one charge. In cases where BEB’s cannot complete an existing block on one charge, we provide options for DASH to consider that will allow a fully electric fleet to meet all block service requirements.
To summarize, the results of this section will include the requirements to replace the current DASH fleet with the equivalent number of battery electric buses or fuel cell electric buses to meet service needs of the current route structure and the estimated route structure based on DASH’s 2030 Vision. This vision is described by the current draft of the ATV, which was under development as of the date this analysis was performed. Please see Table 4 for a summary of these scenarios.
Table 4. Feasibility Study Scenarios
Battery Electric Fuel Cell Electric Current Route
Structure
2030 Vision
3.1 Assumptions Because this level of analysis is meant to be for initial screening and scoping, there are a number of basic assumptions that apply to the whole study and are important to understand before the results are interpreted. First, we have some basic assumptions about characteristics of the current fleet and route structure:
• We utilize a 20% industry-standard spare ratio to reflect DASH’s current goal. • We use the weekday schedule as a basis to calculate the number of buses required,
since the weekday schedule is the most demanding in terms of the number of buses (i.e. the most blocks)
DASH Zero Emission Bus Feasibility Study
Alexandria Transit Company
Center for Transportation and the Environment Page 9 of 32
Second, there are basic assumptions with regard to technology and performance:
• We assume that the technology level (e.g. battery capacity) remains constant over time
• Battery capacity for BEB’s is 450 kWh nameplate / 360 kWh useable service energy (when battery is new). This is based on current battery technology for buses of similar size to what DASH currently has and has planned for the fleet. There is more explanation of battery capacity in the next section of this report.
• The BEB energy required for the blocks is based on an overall efficiency of 2.7 kWh/mi. This includes the energy required for moving the bus as well as for HVAC/accessory usage. This is a generic average based on CTE’s experience with bus planning and deployments across the country. At this level of analysis, this number is not customized for DASH’s operational environment but does reflect relatively strenuous energy usage which CTE considers conservative and prudent for high-level planning purposes. We considered both climate in the Alexandria, VA area as well as data reviewed from the bus demonstrations to help validate this assumption. We also provide a sensitivity analysis so that DASH can understand the impact of an even less favorable efficiency of 3.0 kWh/mi for further use in planning. Route & vehicle modeling, if chosen by DASH at a later date, would provide more customized and accurate results relative to the actual DASH operation.
• For FCEB’s we assume that based on current technology and range, buses can be replaced on a 1:1 basis (one FCEB to replace one diesel). This is based on FCEB capabilities relative to DASH’s current overall block duration and mileage requirements.
3.1.1 Typical Battery Capacity
Battery capacity is most often presented by the OEM’s to potential customers as a “nameplate” number. This is an identifier given by the OEM to help customers better understand the overall, generalized capacity of the battery and to distinguish the capabilities of various battery/vehicle combinations. It does not represent the actual service capacity (total energy that can be stored and used) in a particular battery. In reality, there are regions of the total battery cell capacity that cannot be used without damaging and/or otherwise shortening the life of the cells. These zones are deemed “unusable” by the battery OEM and are not reflected in total battery State of Charge (SOC) indicators- therefore they are invisible and inaccessible to the customer during actual use.
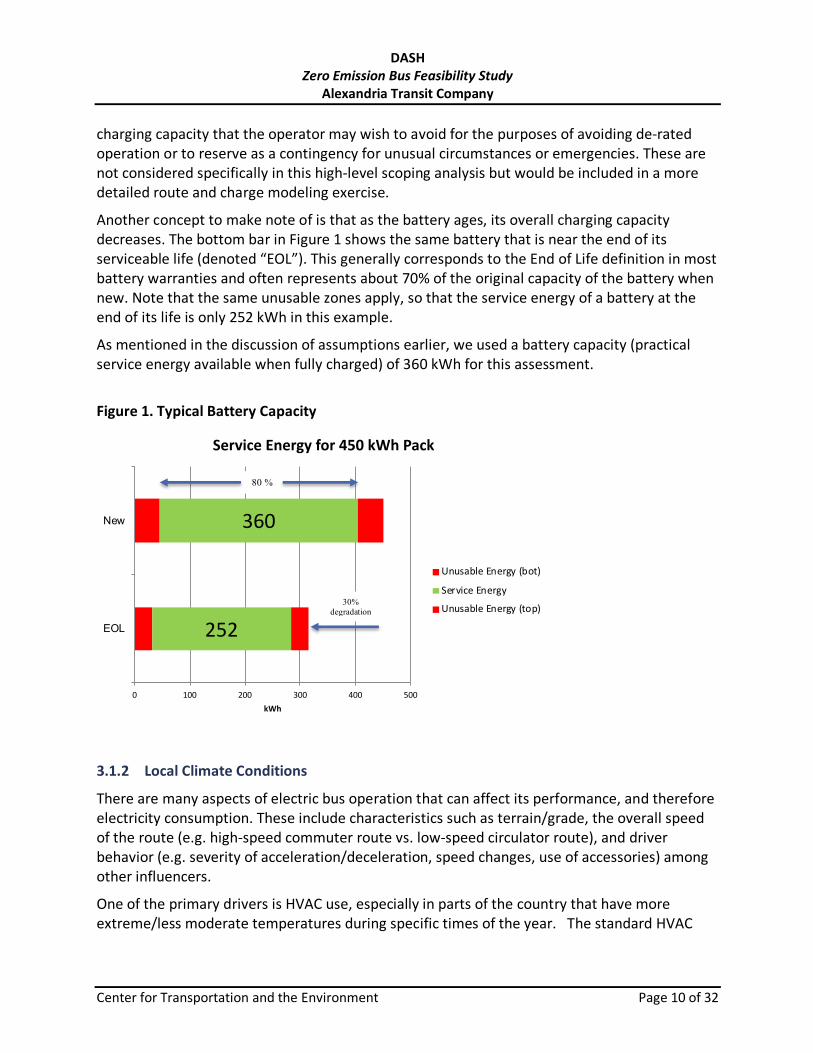
By way of explanation, please refer to the top bar of Figure 1. In this example, the nameplate or marketed capacity of the battery is 450 kWh when the battery is new. Note that, there are two zones marked in red, one at the bottom of the charging range and one at the top. These zones are the unusable zones and can represent up to 20% of the battery nameplate capacity. Therefore, the actual usable battery capacity (denoted as Service Energy in green) is 360 kWh. That means that the actual energy available for use by the bus is 360 kWh when the battery is fully charged. Note that there are additional zones (not shown here) that are part of the total
DASH Zero Emission Bus Feasibility Study
Alexandria Transit Company
Center for Transportation and the Environment Page 10 of 32
charging capacity that the operator may wish to avoid for the purposes of avoiding de-rated operation or to reserve as a contingency for unusual circumstances or emergencies. These are not considered specifically in this high-level scoping analysis but would be included in a more detailed route and charge modeling exercise.
Another concept to make note of is that as the battery ages, its overall charging capacity decreases. The bottom bar in Figure 1 shows the same battery that is near the end of its serviceable life (denoted “EOL”). This generally corresponds to the End of Life definition in most battery warranties and often represents about 70% of the original capacity of the battery when new. Note that the same unusable zones apply, so that the service energy of a battery at the end of its life is only 252 kWh in this example.
As mentioned in the discussion of assumptions earlier, we used a battery capacity (practical service energy available when fully charged) of 360 kWh for this assessment.
Figure 1. Typical Battery Capacity
3.1.2 Local Climate Conditions
There are many aspects of electric bus operation that can affect its performance, and therefore electricity consumption. These include characteristics such as terrain/grade, the overall speed of the route (e.g. high-speed commuter route vs. low-speed circulator route), and driver behavior (e.g. severity of acceleration/deceleration, speed changes, use of accessories) among other influencers.
One of the primary drivers is HVAC use, especially in parts of the country that have more extreme/less moderate temperatures during specific times of the year. The standard HVAC
252
360
0 100 200 300 400 500
EOL
New
kWh
Service Energy for 450 kWh Pack
Unusable Energy (bot)
Service EnergyUnusable Energy (top)30%
degradation
80 %
DASH Zero Emission Bus Feasibility Study
Alexandria Transit Company
Center for Transportation and the Environment Page 11 of 32
systems included in BEB’s are driven by the same energy source that the motor is, namely the battery.
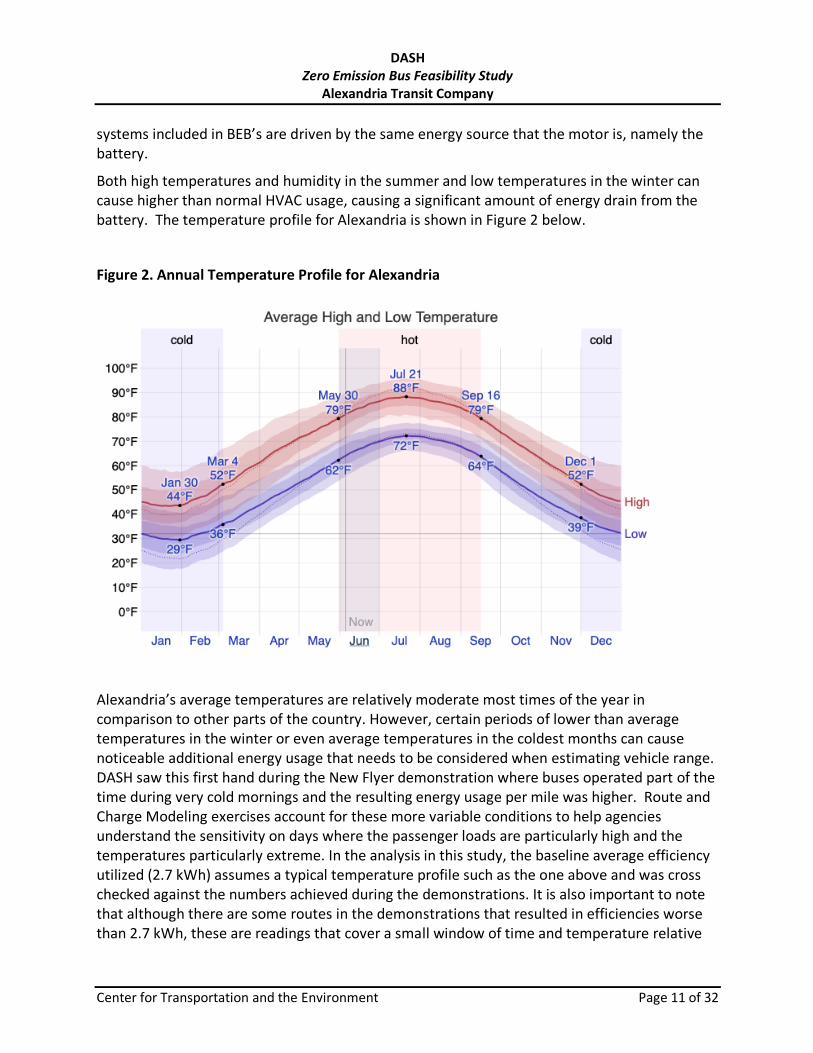
Both high temperatures and humidity in the summer and low temperatures in the winter can cause higher than normal HVAC usage, causing a significant amount of energy drain from the battery. The temperature profile for Alexandria is shown in Figure 2 below.
Figure 2. Annual Temperature Profile for Alexandria
Alexandria’s average temperatures are relatively moderate most times of the year in comparison to other parts of the country. However, certain periods of lower than average temperatures in the winter or even average temperatures in the coldest months can cause noticeable additional energy usage that needs to be considered when estimating vehicle range. DASH saw this first hand during the New Flyer demonstration where buses operated part of the time during very cold mornings and the resulting energy usage per mile was higher. Route and Charge Modeling exercises account for these more variable conditions to help agencies understand the sensitivity on days where the passenger loads are particularly high and the temperatures particularly extreme. In the analysis in this study, the baseline average efficiency utilized (2.7 kWh) assumes a typical temperature profile such as the one above and was cross checked against the numbers achieved during the demonstrations. It is also important to note that although there are some routes in the demonstrations that resulted in efficiencies worse than 2.7 kWh, these are readings that cover a small window of time and temperature relative
DASH Zero Emission Bus Feasibility Study
Alexandria Transit Company
Center for Transportation and the Environment Page 12 of 32
to the entire operation, and there can be other factors contributing to higher energy usage during any one run. The efficiencies used in this study (2.7 kWh baseline and 3.0 kWh for the sensitivity analysis) are at a much less granular level and are averaged over a longer period of time.
Some operators in colder, more extreme climates than Alexandria’s (such as in the Upper Midwest) have opted to utilize diesel heaters to take some HVAC energy burden off of the battery and extend the range of the bus. It should be noted that the need for a diesel heater is also dependent on a number of additional factors including how strenuous the routes are (e.g. topography, speed, length, passenger loads) as well as whether any on-route charging is available. These factors can be better assessed once detailed route modeling takes place. Based on the basic information gathered to date, CTE recommends that DASH pursue a possible option with the OEM’s to outfit some of the six buses expected in FY 2020 with diesel heaters to get some initial experience with them and to assess their impact on energy usage in DASH’s operational environment. Furthermore, since diesel heaters do produce some emissions, the agency should consider potential impacts on emission reduction targets and milestones. As battery technology continues to improve, the need for diesel heaters, and therefore the associated environmental impacts, should diminish over time.
3.2 Current & Future DASH Block Structures
The material in this section contains summaries of DASH’s current block structure, the assumptions that are part of the draft 2030 Vision being developed as part of the ATV, and finally a picture of the block structure anticipated when the 2030 Vision assumptions are incorporated.
DASH Zero Emission Bus Feasibility Study
Alexandria Transit Company
Center for Transportation and the Environment Page 13 of 32
3.2.1 Current DASH Block Structure
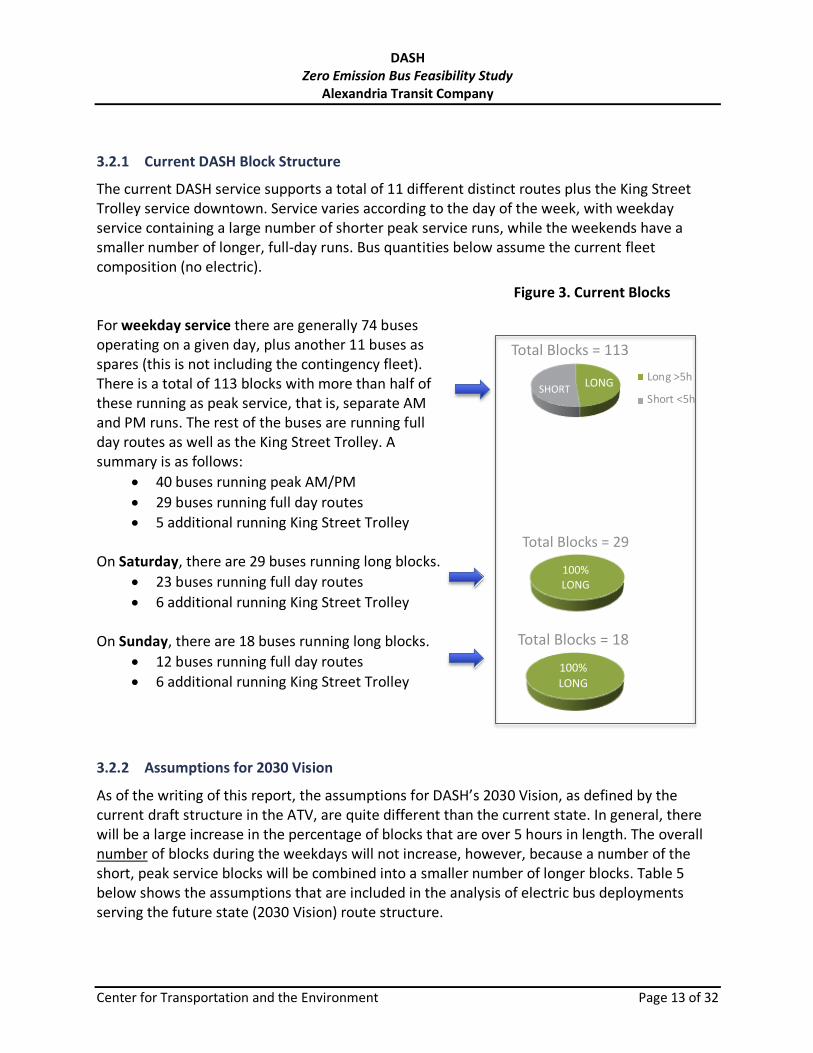
The current DASH service supports a total of 11 different distinct routes plus the King Street Trolley service downtown. Service varies according to the day of the week, with weekday service containing a large number of shorter peak service runs, while the weekends have a smaller number of longer, full-day runs. Bus quantities below assume the current fleet composition (no electric). For weekday service there are generally 74 buses operating on a given day, plus another 11 buses as spares (this is not including the contingency fleet). There is a total of 113 blocks with more than half of these running as peak service, that is, separate AM and PM runs. The rest of the buses are running full day routes as well as the King Street Trolley. A summary is as follows:
• 40 buses running peak AM/PM • 29 buses running full day routes • 5 additional running King Street Trolley
On Saturday, there are 29 buses running long blocks.
• 23 buses running full day routes • 6 additional running King Street Trolley
On Sunday, there are 18 buses running long blocks.
• 12 buses running full day routes • 6 additional running King Street Trolley
3.2.2 Assumptions for 2030 Vision
As of the writing of this report, the assumptions for DASH’s 2030 Vision, as defined by the current draft structure in the ATV, are quite different than the current state. In general, there will be a large increase in the percentage of blocks that are over 5 hours in length. The overall number of blocks during the weekdays will not increase, however, because a number of the short, peak service blocks will be combined into a smaller number of longer blocks. Table 5 below shows the assumptions that are included in the analysis of electric bus deployments serving the future state (2030 Vision) route structure.
LONGSHORT
Total Blocks = 113Long >5h
Short <5h
100%LONG
Total Blocks = 29
100%LONG
Total Blocks = 18
Figure 3. Current Blocks

DASH Zero Emission Bus Feasibility Study
Alexandria Transit Company
Center for Transportation and the Environment Page 14 of 32
Table 5. Assumptions for 2030 Vision (Changes from Current)
Days Apply To: # Blocks Duration/Miles
Weekday Long Blocks (>5hr) Short Blocks (<5hr)
15% increase 50% of blocks stay as is, remainder combined
10% increase Increase combined blocks by 5 hours
Saturday All Blocks 40% increase 20% increase
Sunday All Blocks 10% less than Saturday 10% less than Saturday
All King St Trolley 2 additional blocks Increase by 1-7 hours
3.2.3 Future DASH Block Structure
The new DASH service again varies according to the day of the week, except with a much larger percentage of longer blocks during the weekdays and more overall blocks on the weekend (and of longer duration and length) relative to the current structure. The bus quantities below assume the current fleet composition (no electrics). For weekday service there would be 94 buses operating on a given day, plus another 24 buses as spares (this is not including the contingency fleet). There is a total of 108 blocks, with only 15% running as peak service, and only 23% of the blocks are over five hours. The rest of the buses are running longer routes, including the King Street Trolley. A summary is as follows:
• 14 buses running peak AM/PM • 73 buses running full day routes • 7 additional running King Street Trolley
On Saturday, there are 41 buses running long blocks.
• 33 buses running full day routes • 8 additional running King Street Trolley
On Sunday, there are 37 buses running long blocks.
• 30 buses running full day routes • 7 additional running King Street Trolley
LONGSHORT
Total Blocks = 108Long >5h
Short <5h
100% LONG
Total Blocks = 41
100% LONG
Total Blocks = 37
Figure 4. Future Blocks

DASH Zero Emission Bus Feasibility Study
Alexandria Transit Company
Center for Transportation and the Environment Page 15 of 32
3.3 Estimated Zero Emission Buses Required After the data collection and detailed blocking structures were generated, CTE estimated the number of battery electric buses and fuel cell electric buses that would be required to support both the current and future state systems. During the data collection phase of this project, CTE obtained detailed mileage and duration information from DASH describing each of their current blocks. For battery electric buses, we applied the kWh/mi efficiency baseline to those mileages to estimate the total energy required for each block for an average weekday as well as for Saturday and Sunday. Weekdays contain the most demanding schedule (requiring the most buses, both in the baseline and future state), therefore we used the weekday results to guide our recommendation regarding the number of buses required. We include fuel cell electric buses (FCEB’s) in this analysis because fuel cell technology is rapidly developing and expected to play a potentially important role as agencies transition their fleets to 100% zero emissions. One benefit of FCEB’s is that their current range is comparable to that of diesel buses, so an FCEB is capable of completing any of the individual DASH blocks analyzed in this study. The downside of current FCEB’s is that the vehicle and infrastructure buildout costs as well as the cost of hydrogen remain high due to the relative infancy of the market. However, this is changing in a positive direction as the technology and markets continue to develop. Even though the number of current deployments of FCEB’s is relatively low, CTE considers the technology an important one to consider for a role during the timeframe required for full fleet transitions. Therefore, this analysis as well as our transition planning studies include scenarios with FCEB’s as an option for consideration. Current battery electric bus technology does not provide the range to complete all of blocks that their diesel counterparts do, at least not on one full charge. So, our BEB results are based on analyzing the block energy requirements and counting the cases where electric buses can replace current buses on a 1:1 basis versus cases where it would take more than one electric bus to operate a block currently covered by one conventional bus. We start with the initial assumption that buses are charged overnight and are expected to run as long as they can the following day on that one charge. This is partially based on initial conversations with DASH personnel regarding the hub & spoke route structure. The center of the “hub” is generally the King Street area where buses do not spend much time and therefore would not be able to achieve significant charging. Outlier locations have somewhat more layover time but would have barriers to consider regarding permitting and an evaluation of whether a significant part of the fleet would benefit from charging at any one location. This is beyond the scope of this study. Based on these initial conditions, we determine that any block that requires an amount of energy that is less than the service energy available for a new battery (360 kWh) would be able to be served by one battery electric bus (BEB). Any block that requires more than (360 kWh) would require more than one bus under the assumption of one overnight charge per day. As

DASH Zero Emission Bus Feasibility Study
Alexandria Transit Company
Center for Transportation and the Environment Page 16 of 32
discussed earlier, the capacity of batteries does degrade as the battery gets older. It is assumed here that there will be a relatively steady replacement schedule over time such that as an older BEB becomes less capable of completing a longer, more strenuous route it could be moved to an easier route on the schedule and substituted with a newer BEB. In the case of fuel cell electric buses, current technology and range is such that each DASH block would be served by one FCEB. Therefore, replacements can be made on a 1:1 basis. This is reflected in each set of results below. Please refer to the Appendix for detailed lists of block-level energy calculation results for different types of routes. Finally, note that these results do not capture variations in efficiencies across different routes and distinct conditions. Therefore, this data should be used for high level scoping only. For more accurate and detailed planning, CTE recommends route modeling to capture a better cross-section of DASH’s operating conditions and associated vehicle system performance.
3.3.1 Current System
As mentioned previously, under the current route & block structure, DASH operates 74 buses on a typical weekday and has an additional 11 buses as operational spares, reflecting a spare ratio of just over 12%. However, DASH’s current goal is to reach the industry standard of 20%, so we calculate a total current fleet size of 93 (19 spares) to reflect that spare ratio. Out of the 74 operating buses, 64 of them can be replaced with BEB’s on a 1:1 basis based on the energy required to complete each of those blocks. The other 10 buses cannot complete their blocks on one charge. Therefore, under the scenario of operating a full day on one charge, those 10 blocks would require twice as many buses (20). This means that 84 BEB’s would be required to operate the blocks that 74 buses are able to complete today. Including spares (at a spare ratio of 20%) means that DASH should plan for a total of 105 BEB’s (versus 93 buses today). Using all FCEB’s, the fleet size would remain the same as today. Results are summarized in Table 6. Table 6. Zero Emission Buses Required Under Current Route Structure
For: Current Route Structure
Current Fleet
BEB 1:1
BEB 2:1
BEB Total
FCEB Total
# buses operating 74 64 20 84 74
# buses w/20% spare goal 93
105 93
3.3.2 Future System (2030 Vision)
Under the future block structure described in Section 3.2.3, CTE estimates that with the current (non-electric) fleet composition, DASH would require 94 buses plus 24 additional buses as operational spares. Out of the 94 operating buses, 70 of them can be replaced on a 1:1 basis
DASH Zero Emission Bus Feasibility Study
Alexandria Transit Company
Center for Transportation and the Environment Page 17 of 32
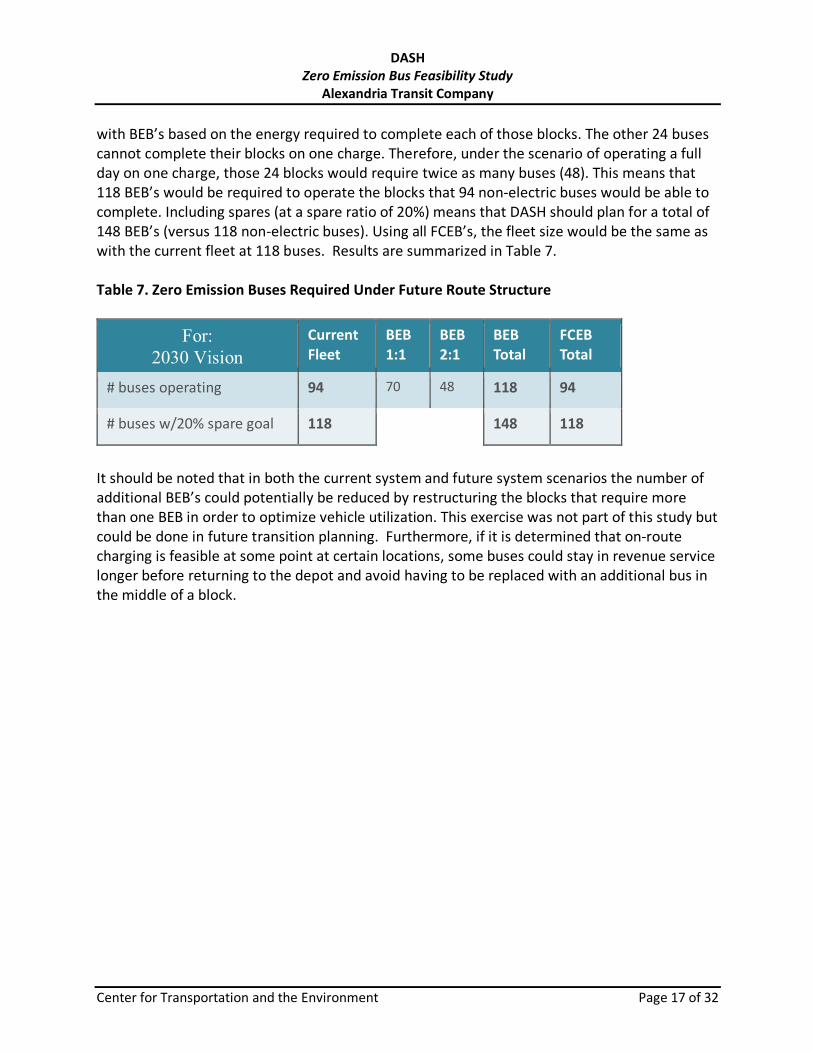
with BEB’s based on the energy required to complete each of those blocks. The other 24 buses cannot complete their blocks on one charge. Therefore, under the scenario of operating a full day on one charge, those 24 blocks would require twice as many buses (48). This means that 118 BEB’s would be required to operate the blocks that 94 non-electric buses would be able to complete. Including spares (at a spare ratio of 20%) means that DASH should plan for a total of 148 BEB’s (versus 118 non-electric buses). Using all FCEB’s, the fleet size would be the same as with the current fleet at 118 buses. Results are summarized in Table 7. Table 7. Zero Emission Buses Required Under Future Route Structure
For: 2030 Vision
Current Fleet
BEB 1:1
BEB 2:1
BEB Total
FCEB Total
# buses operating 94 70 48 118 94
# buses w/20% spare goal 118
148 118
It should be noted that in both the current system and future system scenarios the number of additional BEB’s could potentially be reduced by restructuring the blocks that require more than one BEB in order to optimize vehicle utilization. This exercise was not part of this study but could be done in future transition planning. Furthermore, if it is determined that on-route charging is feasible at some point at certain locations, some buses could stay in revenue service longer before returning to the depot and avoid having to be replaced with an additional bus in the middle of a block.
DASH Zero Emission Bus Feasibility Study
Alexandria Transit Company
Center for Transportation and the Environment Page 18 of 32
3.4 Deployment Options In the context of this study, deployment options are discussed relevant to an end state of a 100% zero emissions fleet. There are three primary ways an agency can handle the additional requirements of an electric fleet caused by battery/range limitations. The first option is to add BEB’s to accommodate the portions of blocks that cannot be completed on one charge. This is accomplished by the BEB calculations in the previous sections. As mentioned previously, the above results are based on a 2.7 kWh/mi average efficiency across all routes, which does not account for variation in environmental or load conditions or differences in operational conditions such as speed or grade between specific routes. To provide additional insight in this study, CTE performed a sensitivity analysis by running the same calculations using an efficiency of 3.0 kWh/mi. DASH can use this variant if they require more conservative numbers for certain planning activities or as a way to set expectations in advance regarding the fleet requirements under different sets of conditions. Using the more pessimistic average efficiency of 3.0 kWh/mi results in a requirement for roughly 10 additional buses (including spares) beyond the numbers shown in the previous sections for the current route structure and 11 additional buses (including spares) for the future route structure. Transitioning a fleet to all BEB’s has a few advantages. First it allows for a consistent and less complex charging/fueling infrastructure and process since there would presumably be one set of depot-style chargers in one location where all buses would be charged overnight. This eliminates the need to have different types of chargers in the field (such as overhead chargers) as well as eliminating the need to tightly control the logistics of buses charging remotely where there is limited layover time and the potential for multiple buses competing for the same charger while in revenue service. The disadvantage of this option is the higher costs associated with owning and maintaining a larger fleet. As described in section 3.3.2, block restructuring can help in reducing the number of extra buses required. Also offsetting this extra cost is the fact that BEB’s upfront per unit purchase cost (~$750,000 not including add-ons/option) is somewhat lower than other technologies, such as FCEB’s (~$1,200,000 not including add-ons/options). The second option is to purchase fuel cell electric buses (FCEB’s) instead of battery electric buses (BEB’s). This would allow a one-to-one replacement due to the longer range of FCEB’s. However, as mentioned above, the upfront unit cost is higher, and another disadvantage is that it requires additional investment in hydrogen fueling infrastructure and logistics to either get the hydrogen delivered or manufactured on-site. It follows that another variant of these first two options is to have a mixed fleet incorporating both technologies, which can take advantage of each technology’s strengths but also adds more complexity to the fleet and to the transition. Finally, a third option is to utilize on-route charging with a BEB fleet. The advantage of this option is that it would allow for a longer range away from the depot and achieve more revenue hours in a given day. Another advantage is that electricity demand would be spread across the
DASH Zero Emission Bus Feasibility Study
Alexandria Transit Company
Center for Transportation and the Environment Page 19 of 32
day and in different locations to possibly help minimize demand charges that could otherwise be incurred by buses charging concurrently for longer periods in the evening. The disadvantages include the additional up-front cost for charging infrastructure, potential permitting and location restrictions, and adding buses may still be required depending on the amount of block restructuring that could be done.
3.4 Feasibility Analysis Conclusions There are three summary conclusions as a result of this analysis:
1. The DASH route structure, both current and future, generally supports the transition to an all-electric fleet. The centralized system, covering a relatively small area with routes of reasonable duration and mileage, is beneficial in effectively managing a gradual and phased transition to electric technology. This is enhanced by local support and initiatives as well as the amount of research and effort that DASH is putting into understanding the benefits and implementation requirements of the technology.
2. Utilizing battery electric buses will most likely require a somewhat larger fleet assuming today’s level of technology. However, as technology advances (which CTE firmly expects that it will continue to do), this requirement will be reduced. Furthermore, the options of incorporating fuel cell electric buses, block restructuring, and possible focused use of on-route charging can also compensate for current BEB range limitations.
3. Modeling and full transition planning can further clarify the expected impacts and optimize deployments relative to DASH’s current and future operations. CTE recommends that this next level of planning be pursued by DASH so that a more complete picture of benefits, impacts and lifecycle costs can be generated. Furthermore, master planning will enable an effective set of phased projects to gradually introduce both vehicles and infrastructure in a controlled fashion to maximize performance and minimize service disruptions through the transition period.
Center for Transportation and the Environment Page 20 of 32
4 Best Practices As a result of CTE’s involvement in a large number of electric bus deployments over a long period of time and across a diverse set of transit agencies, we have had the opportunity to collect a large database of best practices and lessons learned. This knowledge base is becoming increasingly important as more agencies are preparing for a long-term commitment to these beneficial technologies via full fleet transition.
The Appendix includes a selection of these lessons learned that we feel would be of particular interest to DASH at this time in their evaluation activities based on the work we have done together on this project. Below is a summary of the topics covered in the Appendix. CTE is also happy to provide more complete access to additional topics or topic categories upon request.
Battery Electric Buses
• Impact of HVAC on range
• Mid-day charging
• Maximizing utilization
• Understanding manufacturer’s claims
• Operating ZEB’s during emergencies / back up power
Charging Battery Electric Buses
• Managing demand
• Charging technology selection
• Charge and rate modeling
• Considering charging time in block planning
Fuel Cell Buses
• Spare parts and downtime
• Modeling fuel costs
• Hydrogen safety training
Hydrogen Fueling
• Fueling station technology selection
• Fueling station operation
• Redundancy – hydrogen delivery
• Scaling up fueling infrastructure
Center for Transportation and the Environment Page 21 of 32
Appendices
1. Block Level Energy Requirements (Current System) 2. Selection of Lessons Learned

Center for Transportation and the Environment Page 22 of 32
Appendix 1: Current Block Energy Assessment AM/PM Blocks: Optimized Pairing of Long & Short Blocks to Maximize Utilization on One Charge
Block # Miles Energy Reqd Block # Miles Energy Reqd Total Miles TOTAL ENERGY24 76 204 97 18 47 93 25210 66 177 104 19 52 85 22938 65 176 90 25 67 90 24311 56 152 1323 25 67 81 21915 54 145 1327 25 67 79 21331 51 136 105 26 71 77 208
4 49 132 88 27 72 76 20425 46 125 80 30 82 77 207
2 45 122 96 31 83 76 2058 44 118 102 32 87 76 205
29 43 116 72 33 88 76 20548 43 115 73 33 89 76 20419 42 115 95 33 89 75 20344 41 111 1335 33 89 74 20030 40 108 78 35 93 75 20134 40 108 1331 35 95 75 20323 39 106 87 36 98 76 204
6 39 105 85 38 103 77 20745 37 99 94 38 103 75 202
9905 36 97 100 43 115 79 213
AM BLOCKS PM BLOCKS FULL DAYBlock # Miles Energy Reqd Block # Miles Energy Reqd Total Miles TOTAL ENERGY
60 36 96 69 46 125 82 22154 35 93 82 46 125 81 218
1330 33 90 84 48 130 81 22050 33 89 89 49 133 82 22249 31 84 101 50 135 81 21956 31 83 77 53 142 83 225
9901 29 79 93 53 143 82 22262 29 78 81 54 146 83 223
1326 28 75 86 54 147 82 2221334 28 75 68 56 150 84 2269904 27 72 9906 57 154 84 225
27 26 71 83 58 157 84 22842 26 69 74 58 157 84 226
1322 25 68 76 61 163 86 23132 24 66 67 67 181 91 246
9903 24 65 91 69 186 93 25163 21 58 103 72 193 93 251
9902 19 52 75 83 224 102 27664 17 46 71 85 229 102 275
70 85 230 85 230
AM BLOCKS PM BLOCKS FULL DAY
Battery Service Energy Capacity (New) = 360 kWh

Center for Transportation and the Environment Page 23 of 32
Appendix 1 (Continued) First In / First Out Block Pairing
Block # Miles Energy Reqd Block # Miles Energy Reqd Total Miles TOTAL ENERGY27 26 71 67 67 181 93 25232 24 66 68 56 150 80 216
9904 27 72 69 46 125 73 1979901 29 79 70 85 230 114 309
42 26 69 71 85 229 110 29856 31 83 72 33 88 64 172
1326 28 75 1335 33 89 61 1656 39 105 74 58 157 97 2622 45 122 75 83 224 128 346
64 17 46 1331 35 95 52 1419902 19 52 76 61 163 80 2151330 33 90 80 30 82 64 1721334 28 75 78 35 93 62 1699905 36 97 77 53 142 89 239
49 31 84 81 54 146 85 2301322 25 68 82 46 125 72 193
63 21 58 83 58 157 80 21523 39 106 84 48 130 87 23634 40 108 85 38 103 78 21054 35 93 1327 25 67 59 161
AM BLOCKS PM BLOCKS FULL DAYBlock # Miles Energy Reqd Block # Miles Energy Reqd Total Miles TOTAL ENERGY
19 42 115 86 54 147 97 26130 40 108 87 36 98 76 20650 33 89 88 27 72 60 162
4 49 132 89 49 133 98 26425 46 125 90 25 67 71 19260 36 96 91 69 186 104 28244 41 111 102 32 87 74 19945 37 99 93 53 143 90 242
9903 24 65 94 38 103 62 1688 44 118 95 33 89 77 207
11 56 152 1323 25 67 81 21962 29 78 96 31 83 60 16131 51 136 9906 57 154 108 29015 54 145 100 43 115 97 26129 43 116 73 33 89 76 20548 43 115 101 50 135 93 25010 66 177 103 72 193 137 37038 65 176 97 18 47 83 22324 76 204 104 19 52 95 256
105 26 71 26 71
AM BLOCKS PM BLOCKS FULL DAY
Battery Service Energy Capacity (New) = 360 kWh
Center for Transportation and the Environment Page 24 of 32
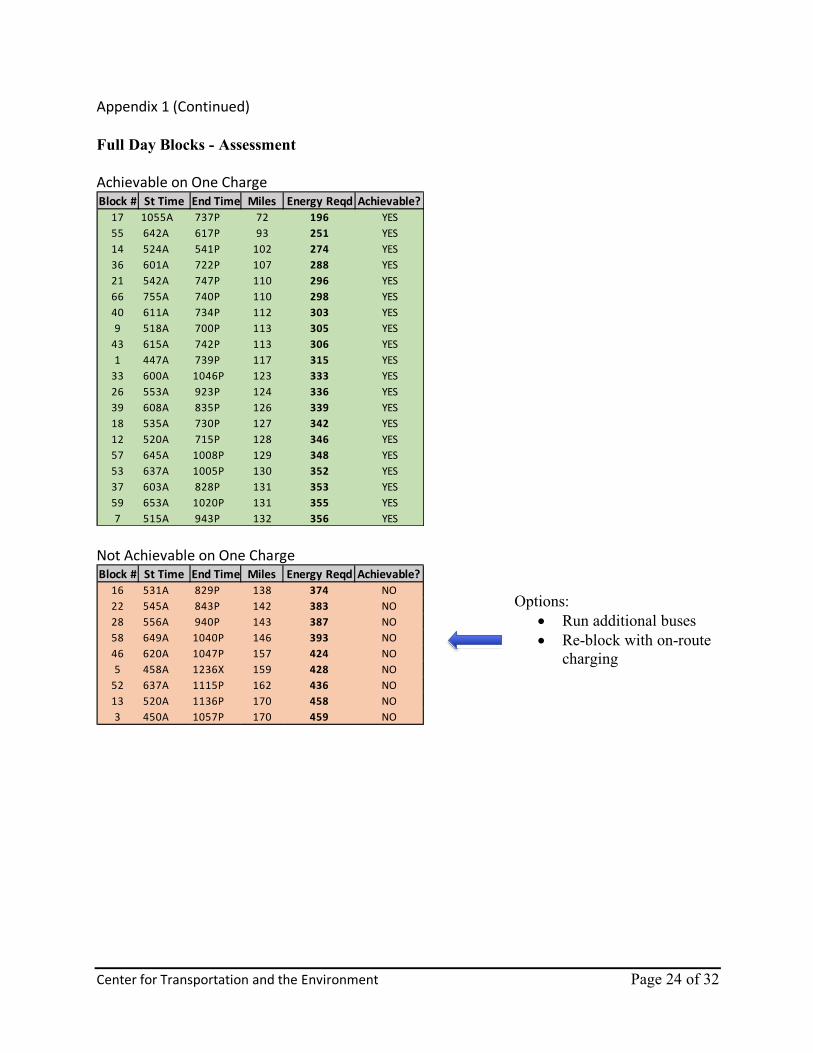
Appendix 1 (Continued) Full Day Blocks - Assessment Achievable on One Charge
Not Achievable on One Charge
Block # St Time End Time Miles Energy Reqd Achievable?17 1055A 737P 72 196 YES55 642A 617P 93 251 YES14 524A 541P 102 274 YES36 601A 722P 107 288 YES21 542A 747P 110 296 YES66 755A 740P 110 298 YES40 611A 734P 112 303 YES9 518A 700P 113 305 YES
43 615A 742P 113 306 YES1 447A 739P 117 315 YES
33 600A 1046P 123 333 YES26 553A 923P 124 336 YES39 608A 835P 126 339 YES18 535A 730P 127 342 YES12 520A 715P 128 346 YES57 645A 1008P 129 348 YES53 637A 1005P 130 352 YES37 603A 828P 131 353 YES59 653A 1020P 131 355 YES7 515A 943P 132 356 YES
Block # St Time End Time Miles Energy Reqd Achievable?16 531A 829P 138 374 NO22 545A 843P 142 383 NO28 556A 940P 143 387 NO58 649A 1040P 146 393 NO46 620A 1047P 157 424 NO5 458A 1236X 159 428 NO
52 637A 1115P 162 436 NO13 520A 1136P 170 458 NO3 450A 1057P 170 459 NO
Options: • Run additional buses • Re-block with on-route
charging

Center for Transportation and the Environment Page 25 of 32
Appendix 2: Lessons Learned Battery Electric Buses
Plan for utilizing ZEBs during emergencies
In the event of a power outage, you may want to consider implementing a backup power or other power storage solution to ensure uninterrupted operation of the ZEB fleet. Your agency may provide assistance for community critical functions, such as evacuations. A backup power source will allow your ZEB fleet to continue to support these functions as needed.
Impact of HVAC systems on range
High air conditioning or heating requirements can impact the range of a BEB in extreme climates. Identify if changes must be made to the ZEB deployment plan seasonally to allow for more charging time, or to deploy BEBs on shorter pieces of work.
Consider incorporating a mid-day charge to increase bus usage
If appropriate for your agency's service plan and fuel costs, pairing blocks with a mid-day charge can maximize the utilization of the buses, while accommodating range limitations.
Service planning to maximize bus use throughout its service life
Ensure that you complete sufficient planning to maximize bus use when the battery is new and towards the end of its service life. Identify blocks that will optimize usage of the electric bus, to fully utilize the available battery capacity. Consider the costs and benefits of designing new blocks specifically for the capabilities of your electric buses. For initial deployment projects, this may not be cost effective. Changes to your service may be required as ZEBs compose a larger percentage of your fleet.
Understanding manufacturer's claims
A large transit agency ordered several Battery Electric Buses (BEBs) to deploy in their service area for a specific route based on manufacturer claims for expected range. After buses were delivered, the agency found that the buses did not meet the range and performance required to be deployed on the planned routes.

Center for Transportation and the Environment Page 26 of 32
Appendix 2 (Continued) Battery Electric Bus Charging
Managing demand charges
A transit agency installing five depot chargers found that by locating the chargers on the same meter servicing the maintenance facility, the increase in demand created by the depot chargers overnight was offset by the facility demand during the day.
Select charging technology
Three options exist for charging BEBs: plug-in charging, overhead conductive charging, and wireless inductive charging.
When selecting charging infrastructure, agencies must consider their route demands (speeds, grades, stops, lengths, layovers), bus service or blocking demands (deadheads, duration, and frequency), seasonal temperatures, passenger loads, available garage space and power, layover or transit center locations and space, and utility rate schedules and costs.
Charge modeling as a complement to electricity rate modeling
Ensure that estimates of how long it will take to charge your buses, as well as any proposed charge management procedures are incorporated into your electricity rate modeling. For example, you may be able to charge buses sequentially, instead of simultaneously, to lower demand charges.
For on-route charging, consider that the charger will only be available at certain times of the day. Therefore, you will need to determine when, where, and for what duration the bus will be charged.
Incorporating charging time into block planning
Adjust route schedules to accommodate BEB charging time; this is part of the transition from conventional technology buses to electric buses. An agency may need to add deadhead miles prior to the start of the route depending on the location of the on-route charging station and availability of an in-depot charger.
Center for Transportation and the Environment Page 27 of 32
Appendix 2 (Continued) Fuel Cell Buses
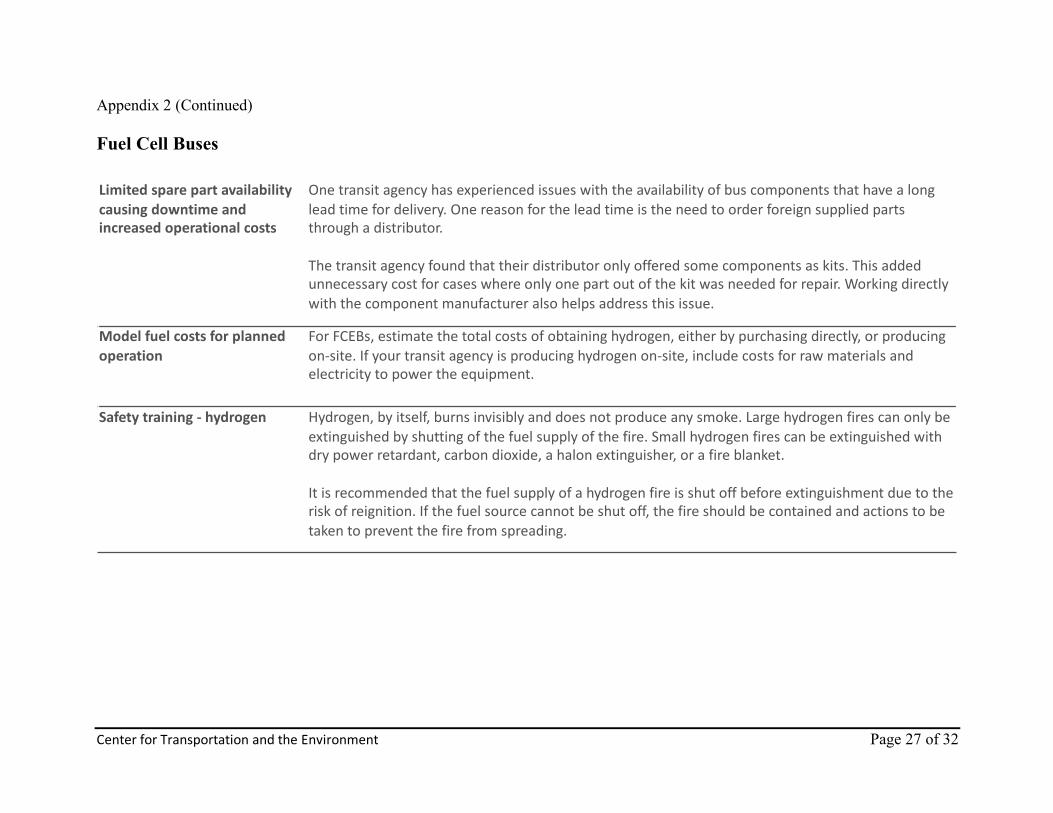
Limited spare part availability causing downtime and increased operational costs
One transit agency has experienced issues with the availability of bus components that have a long lead time for delivery. One reason for the lead time is the need to order foreign supplied parts through a distributor.
The transit agency found that their distributor only offered some components as kits. This added unnecessary cost for cases where only one part out of the kit was needed for repair. Working directly with the component manufacturer also helps address this issue.
Model fuel costs for planned operation
For FCEBs, estimate the total costs of obtaining hydrogen, either by purchasing directly, or producing on-site. If your transit agency is producing hydrogen on-site, include costs for raw materials and electricity to power the equipment.
Safety training - hydrogen Hydrogen, by itself, burns invisibly and does not produce any smoke. Large hydrogen fires can only be extinguished by shutting of the fuel supply of the fire. Small hydrogen fires can be extinguished with dry power retardant, carbon dioxide, a halon extinguisher, or a fire blanket.
It is recommended that the fuel supply of a hydrogen fire is shut off before extinguishment due to the risk of reignition. If the fuel source cannot be shut off, the fire should be contained and actions to be taken to prevent the fire from spreading.
Center for Transportation and the Environment Page 28 of 32
Appendix 2 (Continued) Hydrogen Fueling
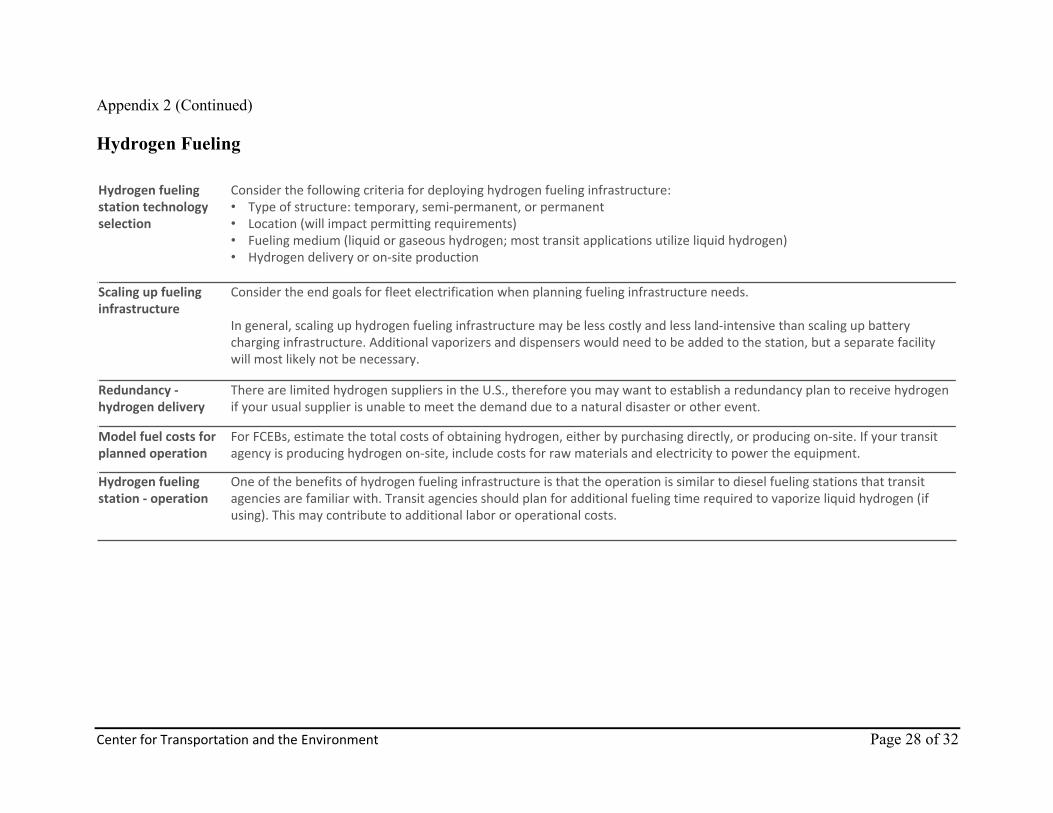
Hydrogen fueling station technology selection
Consider the following criteria for deploying hydrogen fueling infrastructure: • Type of structure: temporary, semi-permanent, or permanent • Location (will impact permitting requirements) • Fueling medium (liquid or gaseous hydrogen; most transit applications utilize liquid hydrogen)• Hydrogen delivery or on-site production
Scaling up fueling infrastructure
Consider the end goals for fleet electrification when planning fueling infrastructure needs.
In general, scaling up hydrogen fueling infrastructure may be less costly and less land-intensive than scaling up battery charging infrastructure. Additional vaporizers and dispensers would need to be added to the station, but a separate facility will most likely not be necessary.
Redundancy -hydrogen delivery
There are limited hydrogen suppliers in the U.S., therefore you may want to establish a redundancy plan to receive hydrogen if your usual supplier is unable to meet the demand due to a natural disaster or other event.
Model fuel costs for planned operation
For FCEBs, estimate the total costs of obtaining hydrogen, either by purchasing directly, or producing on-site. If your transit agency is producing hydrogen on-site, include costs for raw materials and electricity to power the equipment.
Hydrogen fueling station - operation
One of the benefits of hydrogen fueling infrastructure is that the operation is similar to diesel fueling stations that transit agencies are familiar with. Transit agencies should plan for additional fueling time required to vaporize liquid hydrogen (ifusing). This may contribute to additional labor or operational costs.