Zenith Bank Annual Report 2013
106
ZENITH BANK PLC AND SUBSIDIARY COMPANIES CONSOLIDATED AND SEPARATE FINANCIAL STATEMENTS FOR THE YEAR ENDED 31 DECEMBER 2013
-
Upload
michael-olafusi -
Category
Investor Relations
-
view
267 -
download
13
description
Zenith Bank Annual Report 2013
Transcript of Zenith Bank Annual Report 2013

ZENITH BANK PLC AND SUBSIDIARY COMPANIES
CONSOLIDATED AND SEPARATE FINANCIAL STATEMENTS
FOR THE YEAR ENDED 31 DECEMBER 2013

DIRECTORS, OFFICERS & PROFESSIONAL ADVISERS
Directors
Sir Steve Omojafor - Chairman
Godwin Emefiele - Managing Director
Babatunde Adejuwon - Non-Executive Director
Alhaji Baba Tela - Non-Executive Director/ Independent
Prof. Chukuka Enwemeka - Non-Executive Director
Mr. Jeffrey Efeyini - Non-Executive Director
Chief (Mrs) Chinyere Asika - Non-Executive Director/ Independent
Dr Haruna Usman Sanusi - Non-Executive Director/ Independent
Udom Emmanuel - Executive Director
Peter Amangbo - Executive Director
Ms. Adaora Umeoji - Executive Director
Ebenezer Onyeagwu - Executive Director
Company Secretary
Michael Osilama Otu
Registered Office
Zenith Bank Plc
Zenith Heights
Plot 87, Ajose Adeogun Street
Victoria Island
Lagos.
Auditors
KPMG Professional Services
KPMG Tower
Bishop Aboyade Cole street
Victoria Island
Lagos
Registrar & Transfer Office
Veritas Registrars Limited (formerly Zenith Registrars Limited)
Plot 89 A, Ajose Adeogun Street
Victoria Island
Lagos.
Consolidated and Separate Financial Statements 31 December, 2013
Page 2

Zenith Bank Plc
Index To The Consolidated And Separate Financial Statements
For The Year Ended 31 December 2013
Note Page Note Page
Directors' Report 4 5 Segment analysis 75Corporate Governance Report 10 6 Interest and similar income 78
Statement of Directors' Responsibility 19 7 Interest and similar expense 78Audit Committee Report 20 8 Impairment charge for credit losses 78Independent Auditors' Report 21 9 Fee and commission income 78Consolidated and Separate Statements of 10 Net gains on financial instruments
Comprehensive Income 23 measured at fair value through profit
Consolidated and Separate Statements of and loss 78 Financial Position 24 11 Other income 79
Consolidated and Separate Statements of 12 Operating expenses 79 Changes in Equity 25 13 Income tax expense 79
Consolidated and Seperate Statements of 14 Profit for the year from discontinuedCash Flows 27 operations 80
Notes to the Consolidated and Separate 15 Earnings per share 81 Financial Statements 29 16 Cash and balances with central
1 General information 29 banks 812(i) Change in accounting policies 29 17 Treasury bills 812(ii) Significant accounting 18 Due from other banks 82
policies 30 19 Derivative assets held for risk management 822.1 Basis of preparation 20 Loans and advances to customers 822.2 New standards, interpretations and 21 Investment securities 85
amendments to existing standards 22a Investment in subsidiaries 87that are not yet effective 30 22b Condensed financial statements 88
2.3 Basis of consolidation 31 23 Investment in associates 902.4 Foreign currency translations 31 24 Deferred tax 912.5 Cash and cash equivalents 32 25 Other assets 922.6 Financial instruments 32 26 Assets classified as held for sale 92
2.7 Derivative assets held for risk management 35 27 Property and equipment 932.8 Impairment of financial assets 36 28 Intangible assets 952.9 Impairment of non-financial assets 37 29 Customers' deposits 95
2.10 Property and equipment 37 30 Other liabilities 952.11 Intangible assets 38 31 On-lending facilities 962.12 Leases 38 32 Borrowings 972.13 Provisions 39 33 Liabilities classified as held for sale 972.14 Employee benefits 39 34 Share capital 972.15 Share capital 39 35 Share premium, retained earnings 2.16 Recognition of interest income and and other reserves 98
expense 40 36 Pension contribution 982.17 Recognition of fees, commissions 37 Personnel expenses 99
and other income 40 38 Group subsidiaries and related party 2.18 Insurance and investment contracts 40 transactions 1002.19 Current and deferred income tax 41 39 Contingent liabilities and 2.20 Earnings per share 42 commitments 1012.21 Segment reporting 42 40 Dividends per share 102
2.22 Fiduciary activities 42 41 Cash and cash equivalents 1022.23 Discontinued operations 42 42 Compliance with banking regulations 1022.24 Non-current assets held-for-sale or 43 Events after reporting date 102
distribution 42 44 Value added statement 1033 Risk management 43 45 Five-year financial summary 105
3.13 Sustainability report 71
4 Critical accounting estimates and 73
Consolidated and Separate Financial Statements 31 December, 2013
Page 3

Zenith Bank Plc
Directors' Report
For The Year Ended 31 December 2013
2013 2012N'million N'million
Profit before tax (continuing and discontinued operations) 102,100
Taxation (continuing and discontinued operations) (15,279) (1,419)
Profit after taxation (continuing and discontinued operations) 100,681
Non- controlling interest (742) (534)
Profit attributable to equity holders of the parent 94,576 100,147
Appropriations:
Transfer to statutory reserve 12,563 14,994
Transfer to contingency reserve 374 245
Transfer to retained earnings reserve 81,639 84,908
100,147
Non-performing loan ratio 3.0% 3.1%
Dividends
Payment of dividends is subject to withholding tax at a rate of 10% in the hand of recipients.
94,576
TThe Board of Directors, pursuant to the powers vested in it by the provisions of section 379 of the Companies and Allied MattersAct (CAMA) of Nigeria, proposed a dividend of N1.75 kobo per share (December 2012: N1.60 kobo per share ) from the retainedearnings account as at 31 December 2013. This is subject to approval by shareholders at the next Annual General Meeting.
If the proposed dividend is approved by the shareholders, the Bank will be liable to pay additional corporate tax estimated at N13.8billion, which represents the difference between the tax liability calculated at 30% of the dividend approved and the minimum taxcharge reported in the statement of comprehensive income for year ended 31 December 2013.
The directors present their annual report on the affairs of Zenith Bank Plc (“the Bank”) and its subsidiaries (together “the Group"),together with the financial statements and auditor's report for the year ended 31 December, 2013.
a. Legal Form
The Bank was incorporated in Nigeria under the Companies and Allied Matters Act as a private limited liability company on 30May,1990. It was granted a banking licence in June 1990, to carry on the business of commercial banking and commencedbusiness on 16 June 1990. The Bank was converted into a Public Limited Liability Company on 20 May 2004. The Bank’s shareswere listed on the 21 October 2004 on the floor of the Nigerian Stock Exchange.
b. Principal Activities and Business Review
The principal activity of the Bank is the provision of banking and other financial services to corporate and individual customers.Such services include granting of loans and advances, corporate finance and money market activities.
The Bank has eleven subsidiary companies namely, Zenith Bank (Ghana), Zenith Bank (UK) Limited, Zenith Bank (Sierra Leone)Limited, Zenith Bank (Gambia) Limited, Zenith General Insurance Company Limited, Zenith Life Assurance Company Limited,Zenith Medicare Limited, Zenith Pension Custodian Limited, Zenith Capital Limited, Zenith Securities Limited and Zenith TrusteesLimited.
95,318
The Group does not have any unconsolidated structured entity.
In line with regulatory directives on the scope of banking operations in Nigeria, the Bank has elected to discontinue its non-corebanking operations with the exception of Pension Custodianship. Accordingly, non-core banking subsidiaries which have not beendisposed of have been accounted for as discontinued operations in line with IFRS 5. These non-core banking subsidiaries are theInsurance operations (Zenith General Insurance Company Limited, Zenith Life Assurance Company Limited, Zenith MedicareLimited) and the capital market operations (Zenith Capital Limited, Zenith Securities Limited and Zenith Trustees Limited). For theinsurance operations, discussion with the potential buyers is in an advanced stage with certain commitments such as saleagreements and shareholders' agreement already in place. The transaction is expected to be fully completed and the subsidiarieswithin the insurance operation are expected to be de-recognized before the end of the first half of 2014. For the subsidaries withinthe capital market operations, a restructuring of their balance sheets was concluded in December 2013 and the final sale to theidentified investors is expected to be concluded before the end of the first half of 2014.
c. Operating Results
Gross earnings of the Group increased by 14% and profit before tax increased by 8% respectively. Highlights of the Group’soperating results for the year under review are as follows:
110,597
Consolidated and Separate Financial Statements 31 December, 2013Page 4

Zenith Bank Plc
Directors' Report
For The Year Ended 31 December 2013
Name
Sir Steve Omojafor
Godwin Emefiele
Babatunde Adejuwon 3,752,853
Alhaji Baba Tela Non Executive Director / Independent 250,880
Alhaji Lawal Sani ** Non Executive Director / Independent -
Mr. Jeffrey Efeyini
Prof. Chukuka Enwemeka
Chief (Mrs) Chinyere Asika Non Executive Director / Independent 95,757 -
Dr Haruna Usman Sanusi * Non Executive Director / Independent -
Peter Amangbo
Elias Igbinakenzua **
Andy Ojei **
Udom Emmanuel ***
Ms. Adaora Umeoji 20,035,604 25,949,887
Ebenezer Onyeagwu * 2,000,000 -
* Appointed by the Board on April 24, 2013 and approved by the Central Bank of Nigeria (CBN) on June 25, 2013.
** Retired with effect from July 24, 2013.
*** On leave of absence with effect from July 31, 2013.
For the purpose of section 277 of the Companies and Allied Matters Act, none of the existing directors had direct or indirect interestin contracts or proposed contracts with the Bank during the year.
f. Acquisition of Own Shares
The shares of the Bank are held in accordance with the Articles of Association of the Bank. The Bank has no beneficial interest inany of its shares.
g. Property and Equipment
Information relating to changes in property and equipment is given in Note 27 to the financial statements. In the opinion of thedirectors, the market value of the Group’s properties is not less than the value shown in the financial statements.
Executive Director 7,110,308 7,110,308
Executive Director
Executive Director
e. Directors’ Interests in Contracts
Executive Director 11,401,341 11,401,341
Executive Director 8,122,074 9,522,074
Non-Executive Director 127,137 127,137
-
Executive Director 5,000,000 5,000,000
Non-Executive Director 3,752,853
250,880
-
Non-Executive Director 197,400 197,400
Chairman 4,466,036 4,447,563
Group Managing Director/CEO 46,700,792 44,700,792
The direct interests of directors in the issued share capital of Zenith Bank as recorded in the register of directors shareholdingand/or as notified by the directors for the purposes of sections 275 and 276 of the Companies and Allied Matters Act and the listingrequirements of the Nigerian Stock Exchange are as follows:
Number of Shareholding
Designation 2013 2012
d. Directors’ Shareholding
Consolidated and Separate Financial Statements 31 December, 2013Page 5

Zenith Bank Plc
Directors' Report
For The Year Ended 31 December 2013
Share Range
No. of
Shareholders
Percentage
Holdings
(%)1-9,999 547,119 83.13% 5.34%
10,000 - 50,000 88,210 13.40% 5.76%
50,001 - 1,000,000 21,758 3.31% 10.46%
1,000,001 - 5,000,000 782 0.12% 5.23%
5,000,001 - 10,000,000 132 0.02% 2.91%
10,00,001 - 50,00,000 125 0.02% 8.21%
50,00,001 - 100,000,000 28 0.00% 6.67%
23 0.00% 15.04%
3 0.00% 5.88%
Above 1,000,000,000 5 0.00% 34.50%
658,185 100.00% 100.00%
Share Range
No. of
Shareholders
Percentage
Holdings
(%)1-9,999 551,582 82.65% 5.46%
10,000 - 50,000 91,740 13.75% 6.00%
50,001 - 100,000 10,914 1.64% 2.41%
100,001 - 500,000 11,054 1.66% 6.59%
500,001 - 1,000,000 916 0.14% 2.05%
1,000,001 - 5,000,000 873 0.13% 5.94%
5,000,001 - 10,000,000 142 0.02% 3.18%
10,00,001 - 50,00,000 126 0.02% 8.02%
50,00,001 - 100,00,000 24 0.00% 5.60%
28 0.00% 19.38%
3 0.00% 5.14%
Above 1,000,000,000 5 0.00% 30.22%
667,407 100.00% 100.00%
10,827,979,391
31,396,493,786
2,578,251,111
2,095,421,405
100,000,001 - 500,000,000 4,723,471,330
500,000,001 - 1,000,000,000 1,845,907,290
1,714,937,257
1,885,285,543
1,759,195,224
100,000,001 - 500,000,000 6,084,636,747
500,000,001 - 1,000,000,000 1,613,347,555
The shareholding pattern of the Bank as at 31 December 2012 is as stated below:
Percentage of
Shareholders (%)
Number of Holdings
(%)
757,374,308
2,069,814,212
1,809,701,360
3,284,733,586
1,640,586,902
913,513,381
h. Shareholding Analysis
The shareholding pattern of the Bank as at 31 December 2013 is as stated below:
Percentage of
Shareholders (%)
Number of Holdings
(%) 1,676,928,030
644,079,303
1,864,323,308
999,376,950
2,516,751,236
9,487,372,143
31,396,493,786
Consolidated and Separate Financial Statements 31 December, 2013Page 6

Zenith Bank Plc
Directors' Report
For The Year Ended 31 December 2013
Jim Ovia
2,901,359,725
2,353,437,304
Jim Ovia
2,578,440,480
1,772,836,681
The beneficiaries are as follows:
N' million
300
Delta State ICT Centre 62
50
26
20
20
20
20
15
9
5
5
Others below N5 million 304
856
Musical Society of Nigeria
Adamawa State Windstorm Disaster Relief Fund
Project 52 Mobile Health Center
Delta State Football Association
Day Waterman College Indigent Student Scholarship Fund
African Youth Athletics Championship
Edo State Security Fund
Jesuit Fathers of Nigeria Youth Development
Government Science Secondary School -Kuru Jos Plateau State
j. Donations and Charitable Gifts
The Bank made contributions to charitable and non-political organisations amounting to N 856 million during the year (2012: N 587million)
Federal Government Flood Disaster Fund
Lagos State Security Trust Fund
2,946,199,395 9.38%
Stanbic Nominees Nigeria Limited/C001 - TRAD 9.24%
Stanbic Nominees Nigeria Limited/C002 - TRAD 7.50%
Stanbic Nominees Nigeria Limited/C002 - TRAD 5.65%
2,747,223,748 8.75%
Stanbic Nominees Nigeria Limited/C001 - TRAD 8.21%
i. Substantial Interest in Shares
According to the register of members at 31 December 2013, the following shareholders held more than 5.0% of the issued sharecapital of the Bank.
Number of Shares Held
Percentage Holdings
(%)
According to the register of members at 31 December 2012, the following shareholders held more than 5.0% of the issued sharecapital of the Bank.
Number of Shares Held
Percentage Holdings
(%)
Consolidated and Separate Financial Statements 31 December, 2013Page 7

Zenith Bank Plc
Directors' Report
For The Year Ended 31 December 2013
Fire prevention and fire-fighting equipment are installed in strategic locations within the Bank’s premises.
The average number of employees of the Bank during the year by gender and level is as follows;
(a) Analysis of total employees
Male Female Total Male Female
Employees 3,469 3,146 6,615 52% 48%
(b) Analysis of board and top management staff
Male Female Total Male Female
Board Members
(Executive and Non Executive Directors)
9 2 11 82% 18%
Top Management Staff (AGM-GM)
62 21 83 75% 25%
71 23 94 76% 24%
Number Percentage
Gender Gender
Number Percentage
The Bank ensures, through various fora, that employees are informed on matters concerning them. Formal and informal channelsare also employed in communication with employees with an appropriate two-way feedback mechanism.
In accordance with the Bank’s policy of continuous development, training facilities are provided in our well-equipped trainingcentres. In addition, employees of the Bank are nominated to attend both locally and internationally organized courses. These arecomplemented by on-the-job training.
iv. Gender Analysis of Staff
Gender Gender
i. Employment of Disabled Persons
The Bank continues to maintain a policy of giving fair consideration to the application for employment made by disabled personswith due regard to their abilities and aptitude. The Bank’s policy prohibits discrimination against disabled persons in the recruitment,training and career development of its employees. In the event of members of staff becoming disabled, efforts will be made toensure that their employment continues and appropriate training arranged to ensure that they fit into the Bank's workingenvironment.
ii. Health, Safety and Welfare at Work
The Bank enforces strict health and safety rules and practices at the work environment, which are reviewed and tested regularly.The Bank retains top-class private hospitals where medical facilities are provided for staff and their immediate families at the Bank’sexpense.
The Bank operates both a Group Personal Accident and the Workmen’s Compensation Insurance covers for the benefit of itsemployees. It also operates a contributory pension plan in line with the Pension Reform Act.
iii. Employee Training and Development
k. Post Balance Sheet Events
There were no significant events after the balance sheet date that could affect the reported amount of assets and liabilities as of thebalance sheet date.
l. Human Resources
Consolidated and Separate Financial Statements 31 December, 2013Page 8


Zenith Bank Plc
Corporate Governance Report
For The Year Ended 31 December 2013
a. Introduction
As a major player in the Nigerian financial services industry, Zenith Bank has an effective governance system that ensures proper over-sight of its business
by the Directors and other principal organs of the bank.
b. Shareholding
The Bank has a large and diversified shareholder base. No single individual ultimate beneficiary holds more than 9.5% of the Bank’s total shares.
• Overseeing major capital expenditures, acquisitions and divestitures.
• Providing oversight of senior management.
• Monitoring the effectiveness of the governance practices under which the bank operates and making appropriate changes as necessary.
The Managing Director/Chief Executive is responsible for the day to day running of the Bank, assisted by the Executive Committee (EXCO).
e. Responsibilities of the Board
The Board is responsible for:
• Reviewing and providing guidance for the bank’s corporate and business strategy, major plans of action and risk policy.
• Overseeing major capital expenditures, acquisitions and divestitures.
• Review and approval of annual budgets and business plans; setting performance objectives, monitoring implementation and corporate performance.
c. Board of Directors
The Board is responsible for driving the governance structure of the Bank. Besides possessing the requisite academic qualifications and experience in
Board affairs, Directors are well abreast of their responsibilities and are conversant with the Bank’s business. They are therefore able to exercise sound
judgment on matters relating to its business.
d. Board Structure
The board is made up of a non-executive Chairman, six (6) non-executive Directors and five (5) executive Directors including the GMD/CEO. Three (3) of
the non-executive Directors are independent directors, appointed in compliance with the Central Bank of Nigeria (CBN) circular on appointment of
independent directors by banks.
• Ensuring the integrity of the bank’s accounting and financial reporting systems, including the independent audit and that appropriate systems of control and
risk monitoring are in place.
• Establishment of the various Committees of the bank including the terms of reference and review of reports of such Committees to address key areas of
the bank’s business
Consolidated and Separate Financial Statements 31 December, 2013Page 10

Zenith Bank Plc
Corporate Governance Report
For The Year Ended 31 December 2013
Board of Directors
POSITION
Chairman
Non Executive Director / Independent
Non Executive Director / Independent
Non Executive Director / Independent
Non Executive Director / Independent
* Appointed by the Board on April 24, 2013 and approved by the Central Bank of Nigeria (CBN) on June 25, 2013.
** Retired with effect from July 24, 2013
*** On leave of absence with effect from July 31, 2013.
Mr. Ebenezer Onyeagwu *
Mr. Peter Amangbo
Mr. Godwin Emefiele
** Retired with effect from July 24, 2013
* Appointed with effect from April 24, 2013
The membership of the Committee during the year is as follows:
Mr. Jeffrey Efeyini – (Chairman)
Mr. Babatunde Adejuwon
Alhaji Baba Tela
Alhaji Lawal Sani **
Mr. Elias Igbinakenzua **
Membership of the Committees of the Board is intended to make the best use of the skills and experience of non-executive directors in particular.
The Committees have well defined terms of reference and Charters defining their scope of responsibilities in such a way as to avoid overlap or duplication of
functions.
The Committees of the Board meet quarterly but may hold extraordinary sessions as business of the bank demand.
The following are the current standing Committees of the Board:
i. Board Credit Committee
The Committee is made up of six (6) members comprising three (3) non Executive Directors and three (3) Executive Directors of the bank. The Board Credit
Committee is chaired by a non-Executive Director who is well versed in credit matters. The Committee considers loan applications above the level of
Management Credit Committee. It also determines the credit policy of the bank or changes therein.
Mr. Godwin Emefiele Group Managing Director / Chief Executive Officer
The Board meets at least every quarter but may hold extra-ordinary sessions to address urgent matters requiring the attention of the Board.
f. Board Committees
The Board carries out its oversight functions using its various Board Committees. This makes for efficiency and allows for a deeper attention to specific
matters for the board. The Committees are set up in line with statutory and regulatory requirements and consistent with global best practice.
Mr. Udom Emmanuel (***) Executive Director
Ms. Adaora Remy Umeoji Executive Director
Mr. Ebenezer Onyeagwu * Executive Director
Mr. Elias Igbinakenzua ** Executive Director
Mr. Peter Amangbo Executive Director
Mr. Andy Ojei ** Executive Director
The membership of the Board during the year is as follows:
Mr. Jeffrey Efeyini Non Executive Director
Prof. Chukuka S. Enwemeka Non Executive Director
Chief (Mrs) Chinyere Asika
Dr. Haruna Usman Sanusi *
NAME
Sir. Steve Omojafor
Mr. Babatunde Adejuwon Non Executive Director
Alhaji Baba Tela
Mr. Lawal Sani **
Consolidated and Separate Financial Statements 31 December, 2013Page 11

Zenith Bank Plc
Corporate Governance Report
For The Year Ended 31 December 2013
• Consideration of all large scale procurement to be made by the Bank;
• Review of contracts award for significant expenditures;
• Consideration of promotions of Senior Management staff of the Bank;
• Any other matter that may be referred to it by the Board.
Mr. Godwin Emefiele
** Retired with effect from July 24, 2013
Committee’s Terms of Reference
• Review of all matters relating to staff welfare, including remuneration of staff, and Executive Management;
Chief (Mrs) Chinyere Asika
Prof. Chukuka Enwemeka
Mr. Peter Amangbo
Mr. Andy Ojei **
Ms. Adaora Umeoji
This Committee is made up of six (6) members: three (3) non Executive Directors and three (3) Executive Directors. It is chaired by a non-executive
Director. The Committee considers large scale procurement by the Bank, as well as matters bordering on staff welfare, discipline, staff remuneration and
promotion.
The membership of the Committee is as follows:
Alhaji Baba Tela – (Chairman)
Mr. Lawal Sani **
• To recommend to the Board of Directors, as appropriate, new credit proposals, restructure plans, and amendments to existing plans.
• To select and retain independent experts and consultants in the field of credit analysis subject to Board’s approval, to advise with respect to market data
and assist the Committee with its duties, and to approve fees and set terms of engagement for such consultants.
• To report to the entire Board at such times as the Committee and Board shall determine, but not less than every quarter.
• To perform such other duties and responsibilities as the Board of Directors may assign from time to time.
• To recommend non-performing credits for write-off by the Board.
ii. Staff Matters, Finance and General Purpose Committee
• To recommend criteria by which the Board of Directors can evaluate the credit facilities presented from various customers.
• To review the credit portfolio of the Bank.
• To consider all credit facilities above Management approval limit.
• To establish and periodically review the Bank’s credit portfolio in order to align organizational strategies, goals, and performance.
• To evaluate on an annual basis the components of total credit facilities as well as market competitive data and other factors as deemed appropriate, and to
determine the credit level based upon this evaluation.
• To make recommendations to the Board of Directors with respect to credit facilities based upon performance, market competitive data, and other factors
as deemed appropriate.
Committee’s Terms of Reference
Consolidated and Separate Financial Statements 31 December, 2013Page 12

Zenith Bank Plc
Corporate Governance Report
For The Year Ended 31 December 2013
Mr. Babatunde Adejuwon – (Chairman)
Mr. Godwin Emefiele
* Appointed by the Board on April 24, 2013 and approved by the Central Bank of Nigeria (CBN) on June 25, 2013.
*** On leave of absence with effect from July 31, 2013.
• To establish and periodically review the bank’s risk portfolio in order to align organizational strategies, goals, and performance.
• To evaluate on a periodic basis the components of risk as well as market competitive data and other factors as deemed appropriate, and to determine the
risk level based upon this evaluation.
• To select and retain independent experts and consultants in the field of risk analysis subject to Board’s approval, to advise with respect to market data and
assist the Committee with its duties, and to approve fees and set terms of engagement for such consultants.
• To report to the entire Board at such times as the Committee and Board shall determine, but not less than twice a year.
• To perform such other duties and responsibilities as the Board of Directors may assign from time to time.
• Periodically review and monitor risk mitigation process and periodically review and report to the Board of Directors:
(a) magnitude of all material business risks;
(b) the processes, procedures and controls in place to manage material risks; and
(c) the overall effectiveness of the risk management process;
• Facilitate the development of a comprehensive risk management framework for the Bank and develop the risk management policies and processes and
enforce its compliance.
Committee’s Terms of Reference
• The primary responsibility of the Committee is to ensure that sound policies, procedures and practices are in place for the risk-wide management of the
Bank’s material risks and to report the results of the Committee’s activities to the Board of Directors.
• Design and implement risk management practices, specifically provide ongoing guidance and support for the refinement of the overall risk management
framework and ensuring that best practices are incorporated;
• Ensure that Management understands and accepts its responsibility for identifying, assessing and managing risk;
• Ensure and monitor risk management practices, specifically determine which enterprise risks are most significant and approve resource allocation for risk
monitoring and improvement activities, assign risk owners and approve action plans;
Mr. Udom Emmanuel (***)
** Retired with effect from July 24, 2013
Mr. Lawal Sani **
Dr. Haruna Usman Sanusi *
Prof. Chukuka Enwemeka
Mr. Andy Ojei **
The Chief Risk Officer have access to this Committee and makes quarterly presentations for the consideration of the Committee. Chaired by Mr. Adejuwon
(a non executive Director), the Committee’s membership comprises the following:
Mr. Jeffrey Efeyini
iii. Risk Management Committee:
The Board Risk Management Committee has oversight responsibility for the overall risk assessment of various areas of the Bank’s operations and
compliance.
Consolidated and Separate Financial Statements 31 December, 2013Page 13

Zenith Bank Plc
Corporate Governance Report
For The Year Ended 31 December 2013
Mr. Michael Olusoji Ajayi
Ms. Angela Agidi
Chief (Mrs) Chinyere Asika *
** Retired from the board with effect from July 24, 2013
• To conduct an annual evaluation of the Committee's performance.
• such other matters in connection with overseeing the financial reporting process and the maintenance of internal controls as the Committee shall deem
appropriate.
• To actively engage in a dialogue with the independent auditors with respect to any disclosed relationships or services that may impact the objectivity and
independence of the independent auditors and to take appropriate action in response to the independent auditors' report to satisfy itself of the independent
auditors' independence; to periodically evaluate the independent auditor's qualifications and performance including a review of the lead partner, taking into
account the opinion of management and the internal auditor.
• To review critical accounting policies and financial statement presentation; to discuss with management and the independent auditors significant financial
reporting issues and judgments made in preparation of the Bank's financial statements including the effect of alternative accounting methods; to review
major changes in accounting policies.
• To initiate, at its discretion, investigations within the parameters of its responsibilities.
• To prepare the Committee's report for inclusion in the bank's annual report.
• To report to the entire Board at such times as the Committee shall determine.
Committee’s Terms of Reference
• To meet with the independent Auditors, Chief Financial Officer, Internal Auditor and any other Bank executive both individually and/or together, as the
Committee deems appropriate at such times as the Committee shall determine to discuss and review:
• the terms of engagement for the independent auditors, the scope of the audit, and the procedures to be used;
• the bank's quarterly and audited annual financial statements, including any related notes, the bank's specific disclosures and discussion under
"Managements Control Report” and the independent auditors' report, in advance of publication;
• the performance and results of the external and internal audits, including the independent auditors' management letter, and management's responses
thereto;
• the effectiveness of the bank's system of internal controls, including computerized information systems and security; any recommendations by the
independent auditor and internal auditor regarding internal control issues and any actions taken in response thereto; and, the internal control certification
and attestation required to be made in connection with the bank's quarterly and annual financial reports;
Mr. Jeffrey Efeyini
* Appointed by the Board to the Committee on October 24, 2013 to replace Mr. Lawal Sani who retired from the Board with effect from July 24, 2013.
Mr. Babatunde Adejuwon
Alhaji Lawal Sani **
Non Executive Directors
The Committee is established in line with Section 359(6) of the Companies and Allied Matters Act, 1990. The Committee’s membership consists of three
(3) representatives of the shareholders elected at the Annual General Meeting (AGM) and three (3) non-executive Directors. The Committee meets every
quarter, but could also meet at any other time, should the need arise.
The membership of the Committee is as follows:
Shareholders' Representative
Alhaji Hamis B. Musa – (Chairman)
iv. Audit Committee
Consolidated and Separate Financial Statements 31 December, 2013Page 14

Zenith Bank Plc
Corporate Governance Report
For The Year Ended 31 December 2013
This Committee is responsible for regular analysis and consideration of risks other than credit risk in the Bank. It meets [at least monthly or as the need
arises] to review environmental and other risk issues and policies affecting the Bank and recommend steps to be taken. The Committee's approach is
entirely risk based. The Committee makes contributions to the Board Risk Management Committee and also ensures that the Board Risk Committee's
decisions and policies are implemented. The members of the Committee include the Managing Director, two Executive Directors and all divisional and
group heads.
(b) Assets and Liabilities Committee (ALCO)
The ALCO is responsible for the management of a variety of risks arising from the Bank's business including market and liquidity risk management, loan to
deposit ratio analysis, cost of funds analysis, establishing guidelines for pricing on deposit and credit facilities, exchange rate risks analysis, balance sheet
structuring, regulatory considerations and monitoring of the status of implemented assets and liability strategies. The members of the Committee include
the Managing Director, Executive Directors, the Treasurer, the Head of Financial Control, Group Head, Risk Management Group and a representative of the
Assets and Liability Management Unit. A representative of the Asset and Liability Management Department serves as the secretary of this Committee.
(c) Global Credit Committee
The Management Global Credit Committee is responsible for ensuring that the Bank complies with the Credit Policy Guide as established by the Board. The
Committee also makes contributions to the Board Credit Committee. The Committee can approve credit facilities to individual obligors not exceeding in
aggregate a sum as pre-determined by the Board from time to time. The Committee is responsible for reviewing and approving extensions of credit,
including one-obligor commitments that exceed an amount as may be determined by the Board. The Committee meets weekly or fortnightly depending on
the number of credit applications to be considered. The members of the Committee include the Managing Director, and all divisional and group heads,
including the Executive Directors.
The committee reviews the entire credit portfolio of the Bank and conducts periodic assessment of the quality of risk assets in the Bank. It also ensures that
adequate monitoring of performance is carried out. The secretary of the committee is the Head of the Credit Administration Department.
(d) Risk Management Committee
(b) Assets and Liabilities Committee (ALCO)
(c) Management Global Credit Committee (MGCC)
(d) Risk Management Committee (RMC)
(e) Information Technology (IT) Steering Committee
(a) Management Committee
The Management Committee comprises the senior management of the Bank and has been established to identify, analyse, and make recommendations on
risks arising from day-to-day activities. They also ensure that risk limits as contained in the Board and Regulatory policies are complied with. Members of
the management committee make contributions to the respective Board Committees and also ensure that recommendations of the Board Committees are
effectively and efficiently implemented. They meet weekly and as frequently as the need arises.
v. Executive Committee (EXCO)
The EXCO comprises of the Managing Director, who chairs it and all Executive Directors. The Committee meets twice weekly (or such other times as
business exigency may require) to deliberate and take policy decisions on the effective and efficient management of the bank. It also serves as a
processing unit for issues to be discussed at the Board level. EXCO’s primary responsibility is to ensure the implementation of strategies approved by the
Board, provide leadership to the Management team and ensure efficient deployment and management of the bank’s resources. Its Chairman is responsible
for the day-to-day running and performance of the bank.
vi. Other Committees
In addition to the afore-mentioned Committees, the Bank has in place, other Standing Management Committees. They include:
(a) Management Committee (MANCO)
Consolidated and Separate Financial Statements 31 December, 2013Page 15

Zenith Bank Plc
Corporate Governance Report
For The Year Ended 31 December 2013
(15) Head of Investigation
The Committee meets monthly or as the need arises.
(9) Head of Infotech - Software
(10) Head of Infotech - Enginering
(11) Head of Card Services
(12) Head of Operations
(13) Head of IT Audit
(14) Head of e-Business
(3) Head of Treasury
(4) Head of Trade Services
(5) Marketing Groups Representatives
(6) Chief Inspector
(7) Chief Risk Officer
(8) Head of IT
(e) Information Technology Steering Committee
The Information Technology Steering Committee is responsible for amongst others, development of Corporate information technology (IT) strategies and
plans that ensure cost effective application and management of resources throughout the organization.
Membership of the Committee is as follows:
(1) The Managing Director/Chief Executive
(2) Two (2) Executive Directors
Consolidated and Separate Financial Statements 31 December, 2013Page 16

Zenith Bank Plc
Corporate Governance Report
For The Year Ended 31 December 2013
Directors
Board Credit
Committee
Number of Meetings 4 4
Attendance
Sir Steve Omojafor 4 N/A
Mr. Babatunde Adejuwon 4 4
Alhaji Baba Tela 4 4
Alhaji Lawal Sani ** 3 N/A
Mr. Jeffrey Efeyini 4 4
Prof. Chukuka S.Enwemeka 4 N/A
Chief (Mrs) Chinyere Asika * 4 N/A
Dr. Haruna Usman Sanusi * 2 N/A
Mr. Elias Igbinakenzua ** 3 3
Mr. Peter Amangbo 4 3
Mr. Andy Ojei ** 3 N/A
Mr. Udom Emmanuel (***) 3 N/A
Ms. Adaora Umeoji 4 N/AMr. Ebenezer Onyeagwu * 2 1Mr. Godwin Emefiele 4 4
Note:
Members
Number of Meetings
Attendance
Alhaji Hamis B. Musa
Mr. Michael Olusoji Ajayi
Ms. Angela Agidi
Mr. Babatunde Adejuwon
Mr. Jeffrey Efeyini
Alhaji Lawal Sani **
Chief (Mrs) Chinyere Asika *
** Retired from the board with effect from July 24, 2013
3
-
* Appointed by the Board to the Committee on October 24, 2013 to replace Mr. Lawal Sani who retired from the Board with effect from July 24, 2013.
4
4
4
4
4
4
* * Retired from the Board with effect from July 24, 2013.
*** On leave of absence with effect from July 31, 2013.
N/A Not Applicable (not a Committee member).
The table below shows the frequency of meetings of the Audit Committee and members’ attendance at these meetings during the year under review.
Audit committee
N/A N/A
4 4
* Appointed by the Board on April 24, 2013 and approved by the Central Bank of Nigeria (CBN) on June 25, 2013
3 3
N/A 3
3 N/A
N/A 1
N/A N/A
4 N/A
N/A 4
4 4
3 N/A
N/A 4
4 N/A
3 3
4 4
N/A N/A
BOARD AND BOARD COMMITTEES MEETINGS
The table below shows the frequency of meetings of the Board of Directors, Board Committees and members’ attendance at these meetings during the year
under review.
Staff Matters, Finance & General
Purpose Committee
Risk Management Committee
Consolidated and Separate Financial Statements 31 December, 2013Page 17

Zenith Bank Plc
Corporate Governance Report
For The Year Ended 31 December 2013
Description
2013 2012 2013 2012 2013 2012N N N N
Pending complaint b/f 5 12 921,558,783 939,772,160
Received Complaints 84 125 3,825,870,583 3,509,075,829
Resolved Complaints 70 132 2,302,784,576 3,527,289,206 336,822,865 1,087,915,913 Unresolved Complaints
escalated to CBN for
Intervention 19 5 2,444,644,790 921,558,783 Unresolved Complaints
pending with the Bank C/F 19 5 2,444,644,790 921,558,783
Zenith Bank maintains an effective communication with its shareholders, which enables them understand our business, financial condition and operating
performance and trends. Apart from our annual report and accounts, proxy statements and formal shareholders’ meetings, we maintain a rich website (with
suggestion boxes) that provide information on a wide range of issues for all stakeholders.
The Bank has an Investors Relations Unit which holds regular forum to brief all stakeholders on operations of the Bank.
The Bank also, from time to time, holds briefing sessions with market operators (stockbrokers, dealers, institutional investors, issuing houses, stock
analysts, mainly through investors conference) to update them with the state of our business. These professionals, as advisers and purveyors of
information, relate with and relay to the shareholders useful information about us. We also regularly brief the regulatory authorities, and file statutory returns
which are usually accessible to the shareholders.
g. Disclosure Of Customer Complaints In Financial Statements For The Year Ended December 2013
f. Relationship with Shareholders
Number Amount Claimed Amount refunded
Consolidated and Separate Financial Statements 31 December, 2013Page 18


Zenith Bank Plc
Consolidated and Separate Statements of Comprehensive Income
For The Year Ended 31 December 2013
Group 2013 Group 2012 Bank 2013 Bank 2012
In millions of Naira Note
Gross earnings 351,470 307,082 311,275 279,042
Continuing Operations:
Interest and similar income 6 260,059 221,318 243,852 213,230
Interest and similar expense 7 (70,796) (64,561) (68,471) (65,352)
Net interest income 189,263 156,757 175,381 147,878
Impairment charge for credit losses 8 (11,067) (9,099) (9,907) (7,998)
178,196 147,658 165,474 139,880
Fee and commission income 9 52,550 50,480 47,116 44,211
10 21,787 19,012 19,580 16,201Other income 11 754 1,038 727 5,400Share of profit of associates 23 118 23 - - Amortisation of intangible assets 28 (951) (1,059) (844) (624)Depreciation of property and equipment 27 (9,766) (10,307) (9,015) (9,500)Personnel expenses 37 (59,952) (52,427) (56,864) (49,787)Operating expenses 12 (76,527) (55,826) (72,066) (51,733)
Profit before minimum tax and income
tax from continuing operations 106,209 98,592 94,108 94,048
Minimum tax 13(a) (2,663) (2,469) (2,663) (2,469)Income tax expense from continuing operations 13(b) (11,958) 2,007 (8,031) 4,224
Profit after tax from continuing operations 91,588 98,130 83,414 95,803
Discontinued Operations:
Gross income from discontinued operations 16,320 15,234 - - Gross expenses from discontinued operations (11,932) (11,726) - -
Profit before tax from discontinued operations 14 4,388 3,508 - -
Income tax expense from discontinued operations 14 (658) (957) - -
Profit after tax from discontinued operations 3,730 2,551 - -
Continued and Discontinued Operations:
Profit for the year before minimum tax and income tax 110,597 102,100 94,108 94,048Minimum tax 13(a) (2,663) (2,469) (2,663) (2,469)Income tax expense 13(b) (12,616) 1,050 (8,031) 4,224
Profit for the year after tax 95,318 100,681 83,414 95,803
Other comprehensive income:
Items that will never be reclassified to profit or loss
Fair value movements on equity instruments 549 15 549 15Related tax credit / (expense) 890 (5) 890 (5)
(225) 196 - -
Items that are or may be reclassified to profit or loss
Foreign currency translation differences (2,070) (2,424) - - Effective portion of changes in fair value of cash flow hedges 2,771 - - - Related tax expense (760) - - -
1,155 (2,218) 1,439 10
Total comprehensive income for the year 96,473 98,463 84,853 95,813
Profit attributable to:
Equity holders of the parent 94,576 100,147 83,414 95,803Non controlling interests 742 534 - -
Total comprehensive income attributable to:
Equity holders of the parent 95,746 97,971 84,853 95,813Non controlling interests 727 492 - -
Profit from continuing operations attributable to:Equity holders of the parent 91,411 98,044 83,414 95,803Non controlling interests 177 86 - -
Basic and diluted 15 301 k 319 k 266 k 305 k
Basic and diluted 15 291 k 312 k 266 k 305 k
Net interest income after impairment charge for credit
losses
Net gains on financial instruments measured at fair
value through profit or loss
Other comprehensive income for the year, net of tax
Fair value movements on equity
instruments - discontinued operations
Earnings per share for profit from total operations
attributable to equity holders of parent
Earnings per share for profit from continuing
operations attributable to equity holders of parent
The accompanying notes are an integral part of these consolidated and separate financial statements.
Consolidated and Separate Financial Statements 31 December, 2013
Page 23

Zenith Bank Plc
Consolidated and Separate Statements of Financial Position
As At 31 December 2013
In millions of Naira
Group 2013 Group 2012 Bank 2013 Bank 2012
Assets Note
Cash and balances with central banks 16 603,851 332,515 587,793 313,546Treasury bills 17 586,441 669,164 572,598 647,474Due from other banks 18 256,729 182,020 249,524 203,791Derivative assets held for risk management 19 2,681 - - - Loans and advances 20 1,251,355 989,814 1,126,559 895,354Investment securities 21 303,125 299,343 212,523 256,905Investment in subsidiaries 22 - - 24,375 24,375Investment in associates 23 165 420 90 463Deferred tax assets 24 749 432 - - Other assets 25 36,238 28,665 31,415 16,814Assets classified as held for sale 26 30,454 31,943 4,749 10,338Property and equipment 27 69,410 68,782 67,364 66,651Intangible assets 28 1,935 1,406 1,703 1,175
Total assets 3,143,133 2,604,504 2,878,693 2,436,886
Liabilities
Customers' deposits 29 2,276,755 1,929,244 2,079,862 1,802,008Current income tax 13 7,017 6,577 5,266 5,071Deferred income tax liabilities 24 678 5,584 - 5,573Other liabilities 30 215,643 117,355 201,265 115,027On-lending facilities 31 59,528 56,066 59,528 56,066Borrowings 32 60,150 15,138 60,150 15,138Liabilities classified as held for sale 33 14,111 11,584 - -
Total liabilities 2,633,882 2,141,548 2,406,071 1,998,883
Capital and reserves
Consolidated and Separate Financial Statements 31 December, 2013
Page 24
Share capital 34 15,698 15,698 15,698 15,698Share premium 35 255,047 255,047 255,047 255,047Retained earnings 161,144 130,153 126,678 106,010Other reserves 73,347 58,786 75,199 61,248
Attributable to equity holders of the parent 505,236 459,684 472,622 438,003
Non-controlling interest 4,015 3,272 - -
Total shareholders' equity 509,251 462,956 472,622 438,003
Total liabilities and equity 3,143,133 2,604,504 2,878,693 2,436,886
Sir Steve Omojafor (Chairman)
Godwin Emefiele (Group Managing Director and Chief Executive)
Ebenezer Onyeagwu (Executive Director)
FRC/2013/ICAN/00000003788
Stanley Amuchie (Chief Financial Officer)
FRC/2013/MULTI/00000001063
The accompanying notes are an integral part of these consolidated and separate financial statements.
The financial statements were approved by the Board of Directors on 12 February 2014 and signed on its behalf by:
FRC/2013/IODN/00000001299
FRC/2013/IODN/00000001080
Consolidated and Separate Financial Statements 31 December, 2013
Page 24
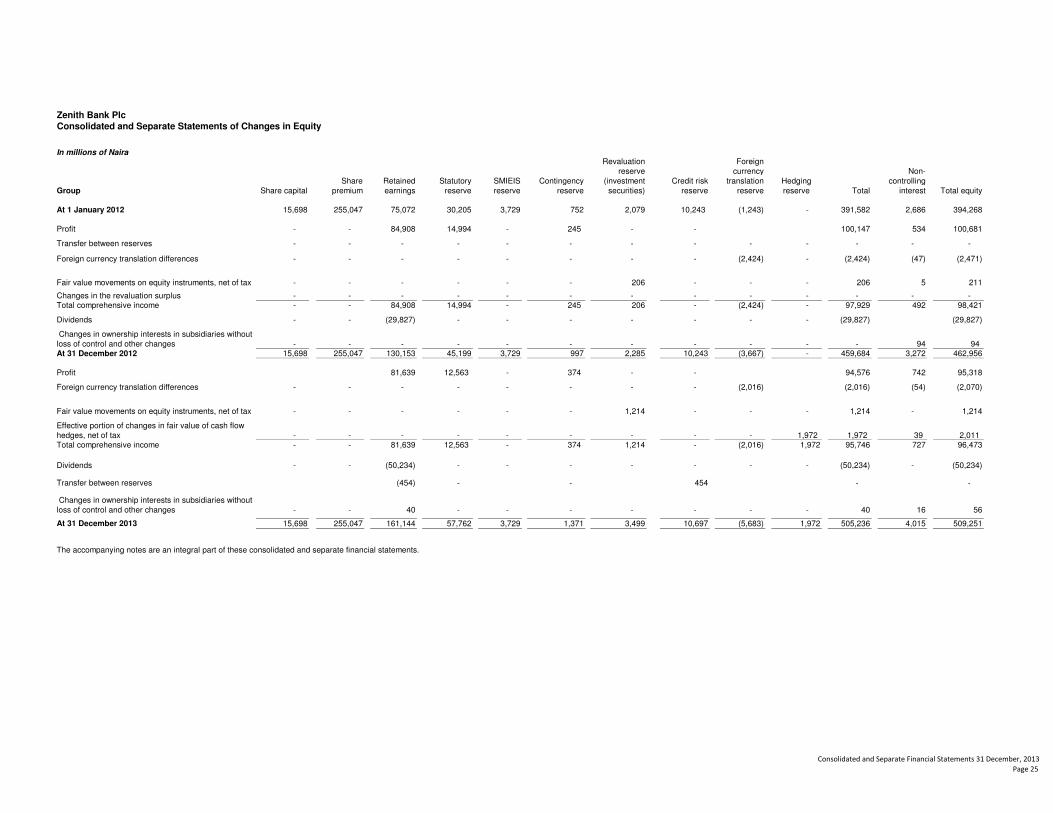
Zenith Bank Plc
Consolidated and Separate Statements of Changes in Equity
In millions of Naira
Group Share capitalShare
premiumRetained earnings
Statutory reserve
SMIEIS reserve
Contingency reserve
Revaluation reserve
(investment securities)
Credit risk reserve
Foreign currency
translation reserve
Hedging reserve Total
Non- controlling
interest Total equity
At 1 January 2012 15,698 255,047 75,072 30,205 3,729 752 2,079 10,243 (1,243) - 391,582 2,686 394,268
Profit - - 84,908 14,994 - 245 - - 100,147 534 100,681
Transfer between reserves - - - - - - - - - - - - -
Foreign currency translation differences - - - - - - - - (2,424) - (2,424) (47) (2,471)
Fair value movements on equity instruments, net of tax - - - - - - 206 - - - 206 5 211
Changes in the revaluation surplus - - - - - - - - - - - - - Total comprehensive income - - 84,908 14,994 - 245 206 - (2,424) - 97,929 492 98,421
Dividends - - (29,827) - - - - - - - (29,827) (29,827)
Changes in ownership interests in subsidiaries without loss of control and other changes - - - - - - - - - - - 94 94 At 31 December 2012 15,698 255,047 130,153 45,199 3,729 997 2,285 10,243 (3,667) - 459,684 3,272 462,956
Profit 81,639 12,563 - 374 - - 94,576 742 95,318
Foreign currency translation differences - - - - - - - - (2,016) (2,016) (54) (2,070)
Fair value movements on equity instruments, net of tax - - - - - - 1,214 - - - 1,214 - 1,214
Effective portion of changes in fair value of cash flow hedges, net of tax - - - - - - - - - 1,972 1,972 39 2,011 Total comprehensive income - - 81,639 12,563 - 374 1,214 - (2,016) 1,972 95,746 727 96,473
Dividends - - (50,234) - - - - - - - (50,234) - (50,234)
Transfer between reserves (454) - - 454 - -
Changes in ownership interests in subsidiaries without loss of control and other changes - - 40 - - - - - - - 40 16 56
At 31 December 2013 15,698 255,047 161,144 57,762 3,729 1,371 3,499 10,697 (5,683) 1,972 505,236 4,015 509,251
The accompanying notes are an integral part of these consolidated and separate financial statements.
Consolidated and Separate Financial Statements 31 December, 2013
Page 25

Zenith Bank PlcConsolidated and Separate Statements of Changes in Equity
In millions of Naira
Bank Share CapitalShare
PremiumRetained earnings
Statutory reserve
SMIEIS reserve
Revaluation reserve
(investment securities)
Credit Risk reserve Total equity
At 1 January 2012 15,698 255,047 55,028 30,204 3,729 2,068 10,243 372,017-
Profit - - 80,809 14,994 - - - 95,803
Fair value movements on equity instruments, net of tax - - - - - 10 - 10
Total comprehensive income - - 80,809 14,994 - 10 - 95,813
Dividends - - (29,827) - - - - (29,827)At 31 December 2012 15,698 255,047 106,010 45,198 3,729 2,078 10,243 438,003
Profit - - 70,902 12,512 - - - 83,414
- - - - - 1,439 - 1,439- - Total comprehensive income - - 70,902 12,512 - 1,439 - 84,853
Dividends - - (50,234) - - - - (50,234)
At 31 December 2013 15,698 255,047 126,678 57,710 3,729 3,517 10,243 472,622
The accompanying notes are an integral part of these consolidated and separate financial statements.
Fair value movements on equity instruments, net of tax
Consolidated and Separate Financial Statements 31 December, 2013
Page 26

Zenith Bank Plc
Consolidated And Separate Statements of Cash Flows
For The Year Ended 31 December 2013
Group 2013 Group 2012 Bank 2013 Bank 2012 In millions of Naira Note
Cash flows from operating activities
Profit after tax for the year 95,318 100,681 83,414 95,803
Impairment - on loans and advances 11,012 9,066 9,852 7,965
- on leases 55 33 55 33
- on other assets - 1,280 - 1,280
- on investment in associates 371 851 371 851
Fair value changes recognised in profit and loss (64) - (39) -
Depreciation of property and equipment 27 9,766 10,307 9,015 9,500
Depreciation of investment property - 136 - 136
Amortisation of intangible assets 28 951 1,059 844 624
Dividend income 11 (303) (110) (303) (694)
Net interest income (189,263) (156,757) (175,381) (147,878)
Share of profit of associates 23 (118) (23) - -
Profit on sale of property and equipment 11 (151) (10) (124) (9)
Profit on sale of investment property 11 - (150) - (150)
Gain on disposal of subsidiary - (32) - (3,811)
Tax expense 13 15,279 1,419 10,694 (1,755)
(57,147) (32,250) (61,602) (38,105)
Loans and advances (272,085) (104,415) (241,112) (76,317)
Other assets (7,573) (4,435) (14,601) (478)
Treasury bills with maturities greater than three months 157,139 (52,524) 151,982 (47,594)
Reinsurance assets and insurance receivables - - - -
Restricted balances (cash reserves) (168,557) (73,528) (169,009) (73,081)
Net assets of subsidiary disposed - (4,479) - -
Debt securities (3,716) 8,629 45,670 10,160
Changes in operating assets: (294,792) (230,752) (227,070) (187,310)
Customers deposits 347,511 273,786 277,854 224,718
Other liabilities 98,288 (35,481) 86,238 (11,633)
Changes in operating liabilities: 445,799 238,305 364,092 213,085
Cash flows (used in)/generated from
operating activities 93,860 (24,697) 75,420 (12,330)
Interest received 260,059 221,318 243,852 213,230
Interest paid (70,796) (64,561) (68,471) (65,352)
Tax paid (19,724) (12,799) (15,182) (10,272)
Cash flows from discontinued operations 2,180 (15,621) - -
Net cash flows generated from operations 265,579 103,640 235,619 125,276
Cash flows from investing activities
Purchase of property and equipment 27 (10,772) (11,290) (9,826) (10,477)
Purchase of intangible assets 28 (1,421) (1,709) (1,313) (1,138)
Proceed from sale of property and equipment 218 361 163 212
Purchase of investment property - (37) - (37)
Proceed from sale of investment property - 7,165 - 7,165
Purchase of equity securities 21 (700) - (700) -
Disposal of associates 2 508 2 508
Dividends received 11 303 110 303 694
Investment in subsidiaries - - - (5,030)
Proceeds from sale of subsidiary - 4,511 - 4,311
Cash flows from discontinued operations 1,845 (567) 5,589 -
Net cash used in investing activities (10,525) (948) (5,782) (3,792)
Consolidated and Separate Financial Statements 31 December, 2013
Page 27

In millions of Naira
Cash flows from financing activities
Dividend paid to shareholders (50,234) (29,827) (50,234) (29,827)
Borrowed funds - inflow from long term borrowing 50,209 313 50,209 313
- repayment of long term borrowing (5,197) (6,245) (5,197) (6,245)
Inflow from On-lending facilities 3,462 6,696 3,462 6,696
56 - - -
Net cash used in financing activities (1,704) (29,063) (1,760) (29,063)
Increase in cash and cash equivalents 253,350 73,629 228,077 92,421
Analysis of changes in cash and cash equivalents:Cash and cash equivalents at start of year 41 614,817 525,616 613,400 520,979
Increase in cash and cash equivalents 253,350 73,629 228,077 92,421
Cash and cash equivalents from discontinued operations 143 18,708 - -
Exchange rate movements on cash and cash
equivalents (1,589) (3,136) - -
Cash and cash equivalents at end of year 41 866,721 614,817 841,477 613,400
The accompanying notes are an integral part of these consolidated and separate financial statements.
Net cash from changes in ownership interest in
subsidiaries
Consolidated and Separate Financial Statements 31 December, 2013
Page 28

Zenith Bank Plc
Notes to the Consolidated and Separate Financial Statements
For The Year Ended 31 December 2013
1 General information
2(i) Changes in accounting policies
Zenith Bank Plc (the "Bank") was incorporated in Nigeria under the Companies and Allied Matters Act as a private limited liability
company on May 30, 1990. It was granted a banking licence in June 1990, to carry on the business of commercial banking and
commenced business on 16 June 1990. The Bank was converted into a Public Limited Liability Company on May 20, 2004. The
Bank’s shares were listed on October 21, 2004 on the Nigerian Stock Exchange.
The principal activity of the Bank is the provision of banking and other financial services to corporate and individual customers. Such
services include granting of loans and advances, corporate finance and money market activities.
The Bank has nine subsidiary companies namely, Zenith General Insurance Company Limited, Zenith Bank (Ghana) Limited, Zenith
Pension Custodian Limited, Zenith Bank (UK) Limited, Zenith Capital Limited, Zenith Medicare Limited, Zenith Life Assurance
Company Limited, Zenith Bank (Sierra Leone) Limited and Zenith Bank (Gambia) Limited.
The consolidated financial statements as at and for the year ended 31 December 2013 comprise the Bank and its subsidiaries
(together referred to as "the Group" and individually as "Group entities") and the Group's interest in associates. The separate financial
statements comprise the Bank. The consolidated and separate financial statements for the year ended 31 December 2013 were
approved for issue by the Board of Directors on 12 February 2014.
In line with regulatory directives on the scope of banking operations in Nigeria, the Bank has elected to discontinue its non-core
banking operations with the exception of Pension Custodianship. Accordingly, non-core banking subsidiaries which have not been
disposed of have been accounted for as discontinued operations in line with IFRS 5. These non-core banking subsidiaries are the
Insurance operations (Zenith General Insurance Company Limited, Zenith Life Assurance Company Limited, Zenith Medicare Limited)
and the capital market operations (Zenith Capital Limited, Zenith Securities Limited and Zenith Trustees Limited). For the insurance
operations, discussion with the potential buyers is in an advance stage with certain commitments such as sale agreements and
shareholders' agreement already in place. The transaction is expected to be fully completed and the subsidiaries within the insurance
operation are expected to be de-recognized before the end of the first half of 2014. For the subsidaries within the capital market
operations, a restructuring of their balance sheets was concluded in December 2013 and the final sale to the identified investors is
expected to be concluded before the end of the first half of 2014.
(a) Subsidiaries, including structured entities
As a result of IFRS 10 (2011), the Group has changed its accounting policy for determining whether it has control over and
consequently whether it consolidates other entities. IFRS 10 (2011) introduces a new control model that focuses on whether the
Group has power over an investee, exposure or rights to variable returns from its involvement with the investee and the ability to use
its power to affect those returns
In accordance with the transitional provision provisions of IFRS 10 (2011), the Group reassessed its control conclusions as of 1
January 2013. The Group did not have unconsolidated enties, which by virtue of the reassessment of control, would have been
qualified for consolidation.
The Group does not have any unconsolidated structured entity.
e. Presentation of Items of Other Comprehensive Income (Amendments to IAS 1).
The nature and the effects of the changes are explained below.
Except as noted below, the Group has consistently applied the accounting policies as set out in Note 2(ii) to all periods presented in
these consolidated financial statements
The Group has adopted the following new standards and amendments to standards, including any consequential amendments to
other standards, with a date of initial application of 1 January 2013.
a. IFRS 10 Consolidated Financial Statements
b. IFRS 12 Disclosure of Interests in Other Entities
c. IFRS 13 Fair Value Measurement
d. Disclosures – Offsetting Financial Assets and Financial Liabilities (Amendments to IFRS 7).
The change did not have a material impact on the Group's financial statements.
Consolidated and Separate Financial Statements 31 December, 2013
Page 29

Zenith Bank Plc
Notes to the Consolidated and Separate Financial Statements
For The Year Ended 31 December 2013
2(ii) Significant accounting policies
a. Statement of compliance
b. Basis of measurement
c. Use of estimates and judgements
● IFRS 9 early adoption
The principal accounting policies adopted in the preparation of these financial statements are set out below.
● Offsetting Financial Assets and Financial Liabilities (Amendments to IAS 32)
The Group plan to adopt these standards at their respective effective dates. Management is in the process of assessing the impact
of these standards on the Group.
2.1 Basis of preparation
The financial statements are prepared in accordance with International Financial Reporting Standards (IFRSs), as issued by the
International Accounting Standards Board (IASB) and in the manner required by the Companies and Allied Matters Act of Nigeria, the
Financial Reporting Council of Nigeria Act, 2011, the Banks and other Financial Institutions Act of Nigeria, and relevant Central Bank
of Nigeria circulars. The IFRS accounting policies have been consistently applied to all periods presented.
The financial statements have been prepared in accordance with the going concern principle under the historical cost convention as
modified by the measurement of certain financial assets and financial liabilities held at fair value.
The preparation of financial statements in conformity with IFRS requires the use of certain critical accounting estimates. It also
requires management to exercise its judgement in the process of applying the Group's accounting policies. The areas involving a
higher degree of judgment or complexity, or areas where assumptions and estimates are significant to the consolidated and separate
financial statements are disclosed in note 4.
2.2 New standards, interpretations and amendments to existing standards that are not yet effective
A number of new standards, amendments to standards and interpretations are effective for annual periods beginning after 1 January
2014, and have not been applied in preparing these consolidated and separate financial statements.
The amendments to IFRS 7 require additional disclosures about offsetting financial assets and financial liabilities,which does not
apply to the Group as the Group does not offset financial assets and financial liabilities.
(e) Presentation of items of OCI
As a result of the amendments to IAS 1, the Group has modified the presentation of items of OCI in its statement of comprehensive
income, to present items that would be reclassified to profit or loss in the future separately from those that would never be.
Comparative information has been re-presented on the same basis.
Except for the changes explained in Note 2(i), the Group has consistently applied the following accounting policies to all periods
presented in these consolidated financial statements, unless otherwise stated.
(b) Interests in other entities
(c) Fair value measurement
The amendments to IAS 32 clarify the offsetting criteria in IAS 32 by explaining when an entity currently has a legally enforceable
right to set off and when gross settlement is equivalent to net settlement. The amendments are effective for annual periods beginning
on or after 1 January 2014 and interim periods within those annual periods. Early application is permitted.
As a result of IFRS 12 , the Group has expanded disclosures about its interests in subsidiaries (see Note 38). The Group does not
have interest in any unconsolidated structured entity.
In accordance with the transitional provisions of IFRS 13, the Group has applied the new definition of fair value, as set out in Note 2.6
(h), prospectively. The change had no significant impact on the measurements of the Bank’s assets and liabilities, but the Group has
included new disclosures in the financial statements, which are required under IFRS 13. These new disclosure requirements are not
included in the comparative information. However, to the extent that disclosures were required by other standards before the effective
date of IFRS 13, the Group has provided the relevant comparative disclosures under those standards.
(d) Offsetting financial assets and financial liabilities
The Group is still evaluating the potential effect of the amendments to IAS 32.
FRS 9, Financial Instruments ( amended November 2013), which is available for early adoption has been early adopted by the group
in the preparation of this financial statement as permitted by the standard.
Consolidated and Separate Financial Statements 31 December, 2013
Page 30
Zenith Bank Plc
Notes to the Consolidated and Separate Financial Statements
For The Year Ended 31 December 2013
2.3 Basis of consolidation
(a) Subsidiaries
(b) Loss of Control
(c) Associates
(d) Non-controlling interests
2.4 Foreign currency translations
(b) Group companies
Unrealised gains on transactions between the Group and its associates are eliminated to the extent of the Group's interest in the
associates. Unrealised losses are also eliminated unless the transaction provides evidence of an impairment of the asset transferred.
Accounting policies of associates have been changed where necessary to ensure consistency with the policies adopted by the Group.
Dilution gains and losses arising in investments in associates are recognised in profit or loss.
Items included in the financial statements of each of the Group’s entities are measured using the currency of the primary economic
environment in which the entity operates (functional currency). The parent entity’s functional currency (Nigerian Naira) is adopted as
the presentation currency for the consolidated financial statements. Except as otherwise indicated, financial information presented in
Naira has been rounded to the nearest million.
The results and financial position of all the Group entities (none of which has the currency of a hyper-inflationary economy) that have
a functional currency different from the presentation currency are translated into the presentation currency as follows:
(a) Functional and presentation currency
Non-controlling interests are measured at their proportionate share of the acquiree's identifiable net assets at the acquisition date.
Changes in the Group's interest in a subsidiary that do not result in a loss of control are accounted for as equity transactions.
Changes in the Group’s interest in a subsidiary that do not result in a loss of control are accounted for as equity transactions
(transactions with owners). Any difference between the amount by which the non-controlling interest is adjusted and the fair value of
the consideration paid or received is recognised directly in equity and attributed to the Group.
On loss of control, the Group derecognises the assets and liabilities of the subsidiary, any controlling interests and the other
components of equity related to the subsidiary. Any surplus or deficit arising on the loss of control is recognised in profit or loss. If the
Group retains any interest in the previous subsidiary, then such interest is measured at fair value at the date that control is lost.
Subsequently, that retained interest is accounted for as an equity-accounted investee or as an available-for-sale financial asset
depending on the level of influence retained.
IFRIC 21 defines a levy as an outflow from an entity imposed by a government in accordance with legislation. It confirms that an
entity recognises a liability for a levy when – and only when – the triggering event specified in the legislation occurs. IFRIC 21 is not
expected to have a material effect on the Group's financial statements
Inter-company transactions, balances and unrealised gains on transactions between companies within the Group are eliminated on
consolidation. Unrealised losses are also eliminated in the same manner as unrealised gains, but only to the extent that there is no
evidence of impairment. Accounting policies of subsidiaries have been changed where necessary to ensure consistency with the
policies adopted by the Group.
In the separate financial statements, investments in subsidiaries and associates are measured at cost.
Associates are all entities over which the Group has significant influence but not control, generally accompanying a shareholding of
between 20% and 50% of the voting rights. Investments in associates are accounted for using the equity method of accounting and
are initially recognised at cost. The Group's investment in associates includes goodwill identified on acquisition, net of any
accumulated impairment loss.
The Group's share of its associates' post-acquisition profits or losses is recognised in profit or loss, and its share of post-acquisition
movements in reserves is recognised in reserves. The cumulative post-acquisition movements are adjusted against the carrying
amount of the investment. When the Group's share of losses in an associate equals or exceeds its interest in the associate, including
any other unsecured receivables, the Group does not recognise further losses, unless it has incurred obligations or made payments
on behalf of the associate.
● IFRIC 21 Levies
The financial statements of subsidiaries are consolidated from the date the Group acquires control, up to the date that such effective
control ceases. For the purpose of these financial statements, subsidiaries are entities over which the Group, directly or indirectly, has
the power to govern the financial and operating policies so as to obtain benefits from their activities.
Consolidated and Separate Financial Statements 31 December, 2013
Page 31

Zenith Bank Plc
Notes to the Consolidated and Separate Financial Statements
For The Year Ended 31 December 2013
(c) Transactions and balances
2.5 Cash and cash equivalents
2.6 Financial instruments
(b) Subsequent measurement
(c) Classification and measurement
(i) Financial assets
Non-monetary assets and liabilities denominated in foreign currencies that are measured at historical cost are translated to the
functional currency using the exchange rate at the transaction date, and those measured at fair value are translated to the functional
currency at the exchange rate at the date that the fair value was determined. Exchange differences on non-monetary assets are
accounted for based on the classification of the underlying items.
Translation differences on non-monetary financial assets and liabilities held at fair value through profit or loss are recognised in profit
or loss as part of the fair value gain or loss. Translation differences on equities measured at fair value through other comprehensive
income are included in the revaluation reserve in other comprehensive income.
Foreign currency gains and losses on intra-group loans are recognised in profit or loss unless settlement of the loan is neither
planned nor likely to occur in the foreseeable future, in which case the foreign currency gains and losses are initially recognised in the
foreign currency translation reserve in the consolidated financial statements. Those gains and losses are recognised in profit or loss
at the earlier of settling the loan or at the time at which the foreign operation is disposed.
(a) Initial recognition and measurement
A financial asset is subsequently measured at amortised cost if it is held within a business model whose objective is to hold assets in
order to collect contractual cash flows and the contractual terms of the financial asset give rise on specified dates to cash flows that
are solely payments of principal and interest on the principal amount outstanding. Interest in this context is consideration for the time
value of money and for the credit risk associated with the principal amount outstanding during a particular period of time. Interest
income is recognised in Interest and similar income.
• assets and liabilities for statement of financial position presented are translated at the closing rate at the reporting date;• income and expenses for each statement of comprehensive income are translated at average exchange rates (unless this
average is not a reasonable approximation of the cumulative effect of the rates prevailing on the transaction dates, in which case
income and expenses are translated at the rate on the dates of the transactions); and• all resulting exchange differences are recognised in other comprehensive income.
For the purposes of the statement of cash flow, cash and cash equivalents comprise balances with less than three months’ maturity
from the date of acquisition, including cash and non-restricted balances with central banks, treasury bills and other eligible bills, loans
and advances to banks, amounts due from other banks and short-term government securities.
Financial instruments at fair value through profit or loss are recognised at fair value with transaction costs, which are directly
attributable to the acquisition or issue of the financial instruments, being recognised immediately through profit or loss. Financial
instruments that are not carried at fair value through profit or loss are initially measured at fair value plus transaction costs that are
directly attributable to the acquisition or issue of the financial instruments.
Financial instruments are recognised or de-recognised on the date the Group commits to purchase or sell the instruments (trade day
accounting).
Subsequent to initial measurement, financial instruments are measured either at fair value or amortised cost depending on their
classification.
The Group classifies its financial assets as subsequently measured at amortised cost or fair value.
On the disposal of a foreign operation, the Group recognises in profit or loss the cumulative amount of exchange differences relating
to that foreign operation. When a subsidiary that includes a foreign operation is partially disposed of or sold, the Group re-attributes
the proportionate share of the cumulative amount of the exchange differences recognised in other comprehensive income to the non-
controlling interests in that foreign operation. In the case of any other partial disposal of a foreign operation, the Group reclassifies to
profit or loss only the proportionate share of the cumulative amount of exchange differences recognised in other comprehensive
income.
Goodwill and fair value adjustments arising on the acquisition of a foreign entity are treated as assets and liabilities of the foreign
entity and translated at the closing rate at the reporting date.
Foreign currency transactions are translated into the functional currency using the exchange rates prevailing at the dates of the
transactions or valuation where items are re-measured. Foreign exchange gains and losses resulting from the settlement of such
transactions and from the translation at year-end exchange rates of monetary assets and liabilities denominated in foreign currencies
are recognised in profit or loss.
Consolidated and Separate Financial Statements 31 December, 2013
Page 32

Zenith Bank Plc
Notes to the Consolidated and Separate Financial Statements
For The Year Ended 31 December 2013
- Held-to-maturity debt securities- Held-to-maturity treasury bills.
(ii) Financial liabilities
(iii) Financial guarantees
(d) Determination of fair value
(e) De-recognitionFinancial assets are de-recognised when the contractual rights to receive the cash flows from these assets have expired or the Group
has transferred the financial asset in a transaction in which substantially all the risks and rewards of ownership of the financial assets
are transferred or which the Group neither retains substantially all the risks and rewards of ownership and it does not retain control of
the financial assets. Any interest in transferred financial assets that qualify for de-recognition that is created or retained by the Group
is recognised as a separate asset or liability in the statement of financial position. On de-recognition of a fianncial asset, the
difference between the carrying amount of the asset (or the carrying amount allocated to the portion of the asset transferred), and
consideration received (including any new asset obtained less any new liability assumed) is recognised in profit or loss.
The Group enters into transactions whereby it transfers assets recognised in the statement of financial position, but retains either all
or substantially all of the risks and rewards of the transferred assets or a portion of them. If all or substantially all risks and rewards
are retained, then the transferred assets are not de-recognised. Transfers of assets with retention of all or substantially all risks and
rewards include, for example, securities lending and repurchase transactions.
In transactions in which the Group neither retains nor transfers substantially all the risks and rewards of ownership of a financial asset
and it retains control over the asset, the Group continues to recognise the asset to the extent of its continuing involvement,
determined by the extent to which it is exposed to changes in the value of the transferred asset.
The Group derecognises a financial liability when its contractual obligations are discharged, cancelled or expired.
The following instruments have been measured at fair value through profit or loss, or other comprehensive income:
- Trading debt securities measured at fair value through profit or loss.
The following instruments have been measured at amortised cost;
- Loans and advances
A financial guarantee contract is a contract that requires the Group (issuer) to make specified payments to reimburse the holder for a
loss it incurs because a specified debtor fails to make payment when due in accordance with the original or modified terms of a debt
instrument.
Financial guarantee liabilities are initially recognised at fair value, which is generally equal to the premium received, and then
amortised over the life of the financial guarantee. Subsequent to initial recognition, the financial guarantee liability is measured at the
higher of the present value of any expected payment, when a payment under the guarantee has become probable, and the
unamortised premium.
Financial liabilities that are not classified at fair value through profit or loss are measured at amortised cost. Interest expenditure is
recognised in Interest and similar expense.
No financial liabilities have been classified as fair value through profit or loss at any of the reporting dates covered by this set of
financial statements.
At initial recognition, the best evidence of the fair value of a financial instrument is the transaction price (i.e. the fair value of the
consideration paid or received), unless the fair value of that instrument is evidenced by comparison with other observable current
market transactions in the same instrument, without modification or repackaging, or based on valuation techniques such as
discounted cash flow models and option pricing models whose variables include only data from observable markets.
- Equity securities measured at fair value through other comprehensive income.
Subsequent to initial recognition, the fair value of a financial instrument is based on quoted market prices or dealer price quotation for
financial instruments traded in an active market. If the market for a financial instrument is not active or the instrument is not listed, the
fair value is determined using valuation techniques. Refer to note 3.3.6(c) for a description of the valuation techniques used by the
Group.
Financial liabilities consist of financial liabilities at fair value through profit or loss and financial liabilities at amortised cost.
All other financial assets are subsequently measured at fair value. Financial assets which meet the requirement for measurement at
amortised cost may also be designated as measured at fair value through profit or loss if doing so eliminates or significantly reduces a
measurement or recognition inconsistency (accounting mismatch). Gains and losses arising from changes in the fair value of financial
assets subsequently measured at fair value are recognised in profit or loss ("FVTPL"), except where the Group elects to present in
other comprehensive income fair value gains and losses arising on investments in equity instruments which are not held for trading
but for strategic purposes ("Fair value through OCI"). Gains and losses recognised directly in other comprehensive income are not
subsequently transferred to profit or loss on disposal of the equity instrument.
- Derivatives held for risk management purposes and hedge accounting measured at fair value through OCI (effective portion of
changes in fair value) and through profit or loss (ineffective portion of changes in fair value)
- Financial guarantees measured at fair value through profit or loss.
Consolidated and Separate Financial Statements 31 December, 2013
Page 33

Zenith Bank Plc
Notes to the Consolidated and Separate Financial Statements
For The Year Ended 31 December 2013
(f) Offsetting
(g) Amortised cost measurement
(h) Fair value
The fair value of a demand deposit is not less than the amount payable on demand, discounted from the first date on which the
amount could be required to be paid.
If a market for a financial instrument is not active, then the Bank establishes fair value using a valuation technique. The chosen
valuation technique makes maximum use of market inputs, relies as little as possible on estimates specific to the Bank, incorporates
all factors that market participants would consider in setting a price and is consistent with accepted economic methodologies for
pricing financial instruments.
The best evidence of the fair value of a financial instrument at initial recognition is the transaction price – i.e. the fair value of the
consideration given or received. However, in some cases the initial estimate of fair value of a financial instrument on initial recognition
may be different from its transaction price. If this estimated fair value is evidenced by comparison with other observable current
market transactions in the same instrument (without modification or repackaging) or based on a valuation technique whose variables
include only data from observable markets, then the difference is recognised in profit or loss on initial recognition of the instrument. In
other cases, the fair value at initial recognition is considered to be the transaction price and the difference is not recognised in profit or
loss immediately but is recognised over the life of the instrument on an appropriate basis or when the instrument is redeemed,
transferred or sold, or the fair value becomes observable.
Portfolios of financial assets and financial liabilities that are exposed to market risk and credit risk that are managed by the Bank on
the basis of the net exposure to either market or credit risk are measured on the basis of a price that would be received to sell a net
long position (or paid to transfer a net short position) for a particular risk exposure. Those portfolio level adjustments are allocated to
the individual assets and liabilities on the basis of the relative risk adjustment of each of the individual instruments in the portfolio.
The Bank recognises transfers between levels of the fair value hierarchy as of the end of the reporting period during which the
change has occurred.
Policy applicable before 1 January 2013
‘Fair value’ is the amount for which an asset could be exchanged, or a liability settled, between knowledgeable, willing parties in an
arm’s length transaction on the measurement date. When available, the Bank measures the fair value of an instrument using quoted
prices in an active market for that instrument. A market is regarded as active if quoted prices are readily and regularly available and
represent actual and regularly occurring market transactions on an arm’s length basis.
Financial assets and liabilities are offset and the net amount presented in the statement of financial position when, and only when, the
Group has a legal right to set off the recognised amounts and it intends to settle on a net basis or to realise the asset and settle the
liability simultaneously.
If an asset or a liability measured at fair value has a bid price and an ask price, then the Bank measures assets and long positions at
a bid price and liabilities and short positions at an ask price.
The amortised cost of a financial asset or liability is the amount at which the financial asset or liability is measured at initial
recognition, minus principal repayments, plus or minus the cumulative amortisation using the effective interest rate method of any
difference between the initial amount recognised and the maturity amount, minus any reduction for impairment.
‘Fair value’ is the price that would be received to sell an asset or paid to transfer a liability in an orderly transaction between market
participants at the measurement date in the principal or, in its absence, the most advantageous market to which the Bank has access
at that date. The fair value of a liability reflects its non performance risk.
Policy applicable from 1 January 2013
The best evidence of the fair value of a financial instrument at initial recognition is normally the transaction price – i.e. the fair value of
the consideration given or received. If the Bank determines that the fair value at initial recognition differs from the transaction price
and the fair value is evidenced neither by a quoted price in an active market for an identical asset or liability nor based on a valuation
technique that uses only data from observable markets, then the financial instrument is initially measured at fair value, adjusted to
defer the difference between the fair value at initial recognition and the transaction price. Subsequently, that difference is recognised
in profit or loss on an appropriate basis over the life of the instrument but no later than when the valuation is wholly supported by
observable market data or the transaction is closed out.
When available, the Bank measures the fair value of an instrument using the quoted price in an active market for that instrument. A
market is regarded as active if transactions for the asset or liability take place with sufficient frequency and volume to provide pricing
information on an ongoing basis.
If there is no quoted price in an active market, then the Bank uses valuation techniques that maximise the use of relevant observable
inputs and minimise the use of unobservable inputs. The chosen valuation technique incorporates all of the factors that market
participants would take into account in pricing a transaction.
Income and expenses are presented on a net basis only when permitted under IFRS, or for gains and losses arsing from a group of
similar transactions.
Consolidated and Separate Financial Statements 31 December, 2013
Page 34
Zenith Bank Plc
Notes to the Consolidated and Separate Financial Statements
For The Year Ended 31 December 2013
(a) Cash flow hedges
(b) Other non trading derivatives
Derivatives held for risk management purposes include all derivative assets and liabilities that are not classified as trading assets or
liabilities. Derivatives held for risk management purposes are measured at fair value in the statement of financial position.
When a derivative is designated as the hedging instrument in a hedge of the variability in cash flows attributable to a particular risk
associated with a recognised asset or liability that could affect profit or loss, the effective portion of changes in the fair value of the
derivative is recognised in OCI and presented in the hedging reserve within equity. Any ineffective portion of changes in the fair value
of the derivative is recognised immediately in profit or loss. The amount recognised in OCI is reclassified to profit or loss as a
reclassification adjustment in the same period as the hedged cash flows affect profit or loss, and in the same line item in the
statement of profit or loss and OCI.
If the hedging derivative expires or is sold, terminated, or exercised, or the hedge no longer meets the criteria for cash flow hedge
accounting, or the hedge designation is revoked, then hedge accounting is discontinued prospectively. However, if the derivative is
novated to a central counterparty by both parties as a consequence of laws or regulations without changes in its terms except for
those that are necessary for the novation, then the derivative is not considered as expired or terminated.
If an asset or a liability measured at fair value has a bid price and an ask price, then the Bank measures assets and long positions at
a bid price and liabilities and short positions at an ask price. Where the Bank has positions with offsetting risks, mid market prices are
used to measure the offsetting risk positions and a bid or ask price adjustment is applied only to the net open position as appropriate.
The fair value of a demand deposit is not less than the amount payable on demand, discounted from the first date on which the
amount could be required to be paid.
The Bank recognises transfers between levels of the fair value hierarchy as of the end of the reporting period during which the
change has occurred.
2.7 Derivatives held for risk management purposes and hedge accounting
If a market for a financial instrument is not active, then the Group establishes fair value using a valuation technique. Valuation
techniques include using recent arm's length transactions between knowledgeable, willing parties (if available), reference to the
current fair value of other instruments that are substantially the same, discounted cash flow analyses and option pricing models. The
chosen valuation technique makes maximum use of market inputs, relies as little as possible on estimates specific to the Group,
incorporates all factors that market participants would consider in setting a price, and is consistent with accepted economic
methodologies for pricing financial instruments. Inputs into valuation techniques reasonably represent market expectations and
measures of the risk-return factors inherent in the financial instrument.
The Group designates certain derivatives held for risk management as hedging instruments in qualifying hedging relationships. On
initial designation of the hedge, the Group formally documents the relationship between the hedging instrument(s) and hedged
item(s), including the risk management objective and strategy in undertaking the hedge, together with the method that will be used to
assess the effectiveness of the hedging relationship. The Group makes an assessment, both at inception of the hedge relationship
and on an ongoing basis, of whether the hedging instrument(s) is(are) expected to be highly effective in offsetting the changes in the
fair value or cash flows of the respective hedged item(s) during the period for which the hedge is designated, and whether the actual
results of each hedge are within acceptable profitable range. The Group makes an assessment for a cash flow hedge of a forecast
transaction, of whether the forecast transaction is highly probable to occur and presents an exposure to variations in cash flows that
could ultimately affect profit or loss.
These hedging relationships are discussed below.
If a derivative is not held for trading, and is not designated in a qualifying hedge relationship, then all changes in its fair value are
recognised immediately in profit or loss as a component of net income from other financial instruments at fair value through profit or
loss.
See note 3.36 on fair value disclosures of financial assets and liabilities.
Consolidated and Separate Financial Statements 31 December, 2013
Page 35

Zenith Bank Plc
Notes to the Consolidated and Separate Financial Statements
For The Year Ended 31 December 2013
2.8 Impairment of financial assets
(a) Assets carried at amortised cost
If, in a subsequent period, the amount of the impairment loss decreases and the decrease can be related objectively to an event
occurring after the impairment was recognised (such as an improvement in the debtor’s credit rating), the previously recognised
impairment loss is reversed by adjusting the allowance account. The amount of the reversal is recognised in profit or loss under
impairment charge for credit losses.
When a loan is uncollectible, it is written off against the related provision for loan impairment. Such loans are written off after all the
necessary procedures have been completed and the amount of the loss has been determined.
The Group first assesses whether objective evidence of impairment exists individually for financial assets that are individually
significant, and individually or collectively for financial assets that are not individually significant. If the Group determines that no
objective evidence of impairment exists for an individually assessed financial asset, whether significant or not, it includes the asset in
a group of financial assets with similar credit risk characteristics and collectively assesses them for impairment. Assets that are
individually assessed for impairment and for which an impairment loss is or continues to be recognised are not included in a collective
assessment of impairment.
• Initiation of bankruptcy proceedings;• Deterioration of the borrower’s competitive position;• Deterioration in the value of collateral; and• Downgrading below investment grade level.
The amount of impairment loss for financial assets carried at amortised cost is measured as the difference between the asset’s
carrying amount and the present value of estimated future cash flows (excluding future credit losses that have not been incurred)
discounted at the financial asset’s original effective interest rate. The carrying amount of the asset is reduced through the use of an
allowance account and the amount of the loss is recognised in profit or loss. If a financial instrument has a variable interest rate, the
discount rate for measuring any impairment loss is the current effective interest rate determined under the contract.
The calculation of the present value of the estimated future cash flows of a collateralised financial asset reflects the cash flows that
may result from foreclosure less costs for obtaining and selling the collateral, whether or not foreclosure is probable.
For the purposes of a collective evaluation of impairment, financial assets are grouped on the basis of similar credit risk
characteristics (i.e. on the basis of the Group’s grading process that considers asset type, industry, geographical location, collateral
type, past-due status and other relevant factors). Those characteristics are relevant to the estimation of future cash flows for groups
of such assets by being indicative of the debtors’ ability to pay all amounts due according to the contractual terms of the assets being
evaluated.
Future cash flows in a group of financial assets that are collectively evaluated for impairment are estimated on the basis of the
contractual cash flows of the assets in the group and historical loss experience for assets with credit risk characteristics similar to
those in the group. Historical loss experience is adjusted on the basis of current observable data to reflect the effects of current
conditions that did not affect the period on which the historical loss experience is based and to remove the effects of conditions in the
historical period that do not currently exist.
Estimates of changes in future cash flows for groups of assets are reflected and directionally consistent with changes in related
observable data from period to period (for example, changes in unemployment rates, property prices, payment status, or other factors
indicative of changes in the probability of losses in the group and their magnitude). The methodology and assumptions used for
estimating future cash flows are reviewed regularly by the Group to reduce any differences between loss estimates and actual loss
experience.
The Group assesses at each reporting date whether there is objective evidence that a financial asset or group of financial assets not
carried at fair value through profit or loss is impaired. A financial asset or a group of financial assets is impaired and impairment
losses are incurred only if there is objective evidence of impairment as a result of one or more events that occurred after the initial
recognition of the asset (a ‘loss event’) and that loss event (or events) has an impact on the estimated future cash flows of the
financial asset or group of financial assets that can be reliably estimated.
The criteria that the Group uses to determine that there is objective evidence of an impairment loss include:
• Delinquency in contractual payments of principal or interest;• Cash flow difficulties experienced by the borrower (for example, equity ratio, net income percentage of sales);• Breach of loan covenants or conditions;
Consolidated and Separate Financial Statements 31 December, 2013
Page 36

Zenith Bank Plc
Notes to the Consolidated and Separate Financial Statements
For The Year Ended 31 December 2013
2.9 Impairment of non-financial assets
2.10 Property and equipment
Leasehold land - Over the remaining lease periodMotor vehicles - 4 yearsOffice equipment - 5 yearsFurniture and fittings - 5 yearsComputer hardware and equipment - 3 yearsBuildings - 50 yearsLeasehold improvement - Over the remaining lease period
Depreciation is included in profit or loss.
Depreciation methods, useful lives and residual values are reassessed at each reporting date and adjusted if appropriate.
Property and equipment are stated at historical cost less accumulated depreciation and accumulated impairment losses. Historical
cost includes expenditure that is directly attributable to the acquisition of the items. Where significant parts of an item of property and
equipment have different useful lives, they are accounted for as separate items (major components) of property and equipment.
Subsequent costs are included in the asset's carrying amount or recognised as a separate asset, as appropriate, only when it is
probable that future economic benefits associated with the item will flow to the Group and the cost of the item can be measured
reliably. All other repairs and maintenance are charged to profit or loss during the financial period in which they are incurred.
Property and equipment are depreciated on the straight line basis to their residual values over the estimated useful lives of the
assets. The assets’ residual values and useful lives are reviewed, and adjusted if appropriate at each reporting date and the
depreciation method is reviewed at each financial year end. Leasehold land and buildings are depreciated over the period of the
lease or over such lesser period as is considered appropriate.
Depreciation is calculated on a straight line basis to write down the cost of property and equipment to their residual values over their
estimated useful lives as follows:
Work in progress consists of items of property and equipment that are not yet available for use. Work in progress is carried at cost
less any required impairment. An impairment loss is recognised if the asset’s recoverable amount is less than cost. The asset is
reviewed for impairment when events or changes in circumstances indicate that the carrying amount may not be recoverable. Once
the items are available for use, they are transferred to relevant classes of property and equipment as appropriate.
Gains and losses on disposal are determined by comparing proceeds with carrying amount. These are included in profit or loss.
The carrying amounts of the Group's non-financial assets, other than investment property and deferred tax assets, are reviewed at
each reporting date to determine whether there is any indication of impairment. If any such indication exists, then the asset's
recoverable amount is estimated. For intangible assets that have indefinite useful lives or that are not yet available for use, the
recoverable amount is estimated each year at the same time.
An impairment loss is recognised if the carrying amount of an asset or its Cash Generating Unit (CGU) exceeds its estimated
recoverable amount. The recoverable amount is the higher of an asset’s fair value less costs to sell and value in use. In assessing
value in use, the estimated future cash flows are discounted to their present value using a pre-tax discount rate that reflects current
market assessments of the time value of money and the risks specific to the asset or CGU. For the purposes of assessing
impairment, assets that cannot be tested individually are grouped together into the smallest group of assets that generates cash
inflows from continuing use that are largely independent of the cash flows of other assets or CGU.
The Group's corporate assets do not generate separate cash inflows and are utilised by more than one CGU. Corporate assets are
allocated to CGUs on a reasonable and consistent basis and tested for impairment as part of the testing of the CGU to which the
corporate asset is allocated.
Impairment losses are recognised in profit or loss. Impairment losses in respect of CGUs are allocated first to reduce the carrying
amount of any goodwill allocated to the CGU (group of CGUs) and then to reduce the carrying amount of the other assets in the CGU
(group of CGUs) on a pro rata basis.
Impairment losses recognised in prior periods are assessed at each reporting date for any indications that the loss has decreased or
no longer exists. An impairment loss is reversed if there has been a change in the estimates used to determine the recoverable
amount. An impairment loss is reversed only to the extent that the asset’s carrying amount does not exceed the carrying amount that
would have been determined, net of depreciation or amortisation, if no impairment loss had been recognised. An impairment loss in
respect of goodwill is not reversed.
Consolidated and Separate Financial Statements 31 December, 2013
Page 37

Zenith Bank Plc
Notes to the Consolidated and Separate Financial Statements
For The Year Ended 31 December 2013
2.11 Intangible assets
(a) Computer software
2.12 Leases
(a) A Group company is the lessee
(b) A Group company is the lessor
Amortisation methods, useful lives and residual values are reviewed at each financial year-end and adjusted if appropriate.
Leases, where the Group assumes substantially all the risks and rewards of ownership, are classified as finance leases. Finance
leases are capitalised at the inception of the lease at the lower of the fair value of the leased asset and the present value of the
minimum lease payments. Lease payments are separated using the interest rate implicit in the lease to identify the finance cost,
which is charged against income over the lease period, and the capital repayment, which reduces the liability to the lessor.
Leases of assets are classified as operating leases if the lessor effectively retains all the risks and rewards of ownership. Payments
made under operating leases, net of any incentives received from the lessor, are charged to profit or loss on a straight-line basis over
the period of the lease. When an operating lease is terminated before the lease period has expired, any payment required to be made
to the lessor by way of penalty is recognised as an expense in the period in which termination takes place.
Lease and instalment sale contracts are primarily financing transactions in banking activities, with rentals and instalments receivable,
less unearned finance charges, being included in Loans and advances to customers in the statement of financial position.
Finance charges earned are computed using the effective interest method which reflects a constant periodic return on the investment
in the finance lease. Initial direct costs paid are capitalised to the value of the lease amount receivable and accounted for over the
lease term as an adjustment to the effective rate of return.
Leases of assets under which the Group effectively retains all the risks and rewards of ownership are classified as operating leases.
Receipts of operating leases from properties held as investment properties in investment management and life insurance activities,
net of any incentives given to lessees, are accounted for as income on the straight-line basis over the period of the lease. When an
operating lease is terminated before the lease period has expired, any payment required by the lessee by way of penalty is
recognised as income in the period in which termination takes place.
• it can be demonstrated how the software product will generate probable future economic benefits;• adequate technical, financial and other resources to complete the development and to use or sell the software product are
available; and• the expenditure attributable to the software product during its development can be reliably measured.
Subsequent expenditure on computer software is capitalised only when it increases the future economic benefits embodied in the
specific asset to which it relates.
Amortisation is recognised in profit or loss on a straight-line basis over the estimated useful life of the software, from the date that the
asset is available for use since this most closely reflects the expected pattern of consumption of the future economic benefits
embodied in the asset. The estimated useful life is 5 years.
Software not integral to the related hardware acquired by the Group is stated at cost less accumulated amortisation and accumulated
impairment losses.
Costs associated with maintaining computer software programmes are recognised as an expense as incurred. Development costs
that are directly attributable to the design and testing of identifiable and unique software products controlled by the Group, are
recognised as intangible assets when the following criteria are met:
• it is technically feasible to complete the software product so that it will be available for use;• management intends to complete the software product and use or sell it;• there is an ability to use or sell the software product;
Consolidated and Separate Financial Statements 31 December, 2013
Page 38

Zenith Bank Plc
Notes to the Consolidated and Separate Financial Statements
For The Year Ended 31 December 2013
2.13 Provisions
2.14 Employee benefits
(a) Post-employment benefits
(b) Short-term benefits
(c) Termination benefits
2.15 Share capital
(a) Share issue costs
(b) Dividends on ordinary shares
(c) Treasury shares
Incremental costs directly attributable to the issue of new shares or options or to the acquisition of a business are shown in equity as
a deduction, net of tax, from the proceeds.
Dividends on ordinary shares are recognised in equity in the period in which they are approved by the Bank’s shareholders. Dividends
for the year that are declared after the end of the reporting period are dealt with in the subsequent events note.
Where the Bank or other members of the Group purchase the Bank’s equity share capital, the consideration paid is deducted from
total shareholders’ equity as treasury shares until they are cancelled. Where such shares are subsequently sold or reissued, any
consideration received is included in shareholders’ equity.
Provisions are recognised when the Group has a present legal or constructive obligation as a result of past events and it is probable
that an outflow of resources embodying economic benefits will be required to settle the obligation and a reliable estimate of the
amount of the obligation can be made. Provisions are determined by discounting the expected future cash flows using a pre-tax
discount rate that reflects current market assessments of the time value of money and, where appropriate, the risks specific to the
liability.
A provision for restructuring is recognised when the Group has approved a detailed formal plan, and the restructuring either has
commenced or has been announced publicly. Future operating costs or losses are not provided for. A provision for onerous contracts
is recognised when the expected benefits to be derived by the Group from a contract are lower than the unavoidable cost of meeting
its obligations under the contract. The provision is measured at the present value of the lower of the expected cost of terminating the
contract and the expected net cost of continuing with the contract. Before a provision is established, the Group recognises any
impairment loss on the assets associated with that contract.
Contingent liabilities are possible obligations that arise from past events whose existence will be confirmed only by the occurrence, or
non-occurrence, of one or more uncertain future events not wholly within the Group’s control. Contingent liabilities are not recognised
in the financial statements but are disclosed in the notes to the financial statements.
Provisions are recognised when the separate entities in the Group have a present or constructive obligation as a result of past events
and it is probable that an outflow of resources embodying economic benefits will be required to settle the obligation and reliable
estimate of the amount of the obligation can be made.
Short-term benefits consist of salaries, accumulated leave allowances, profit share, bonuses and any non-monetary benefits.
The Group recognises termination benefits as an expense when the Group is demonstrably committed , without realistic possibility of
withdrawal, to a formal detailed plan to either terminate employment before the normal retirement date, or to provide ternmination
benefits as a result of an offer made to encourage voluntary redundancy. The Group settles termination benefits within twelve months
and are accounted for as short-term benefits.
A defined contribution plan is a pension plan under which the Group pays fixed contributions into a separate entity. The Group has no
legal or constructive obligations to pay further contributions if the fund does not hold sufficient assets to pay all employees the
benefits relating to employee service in the current and prior periods. For defined contribution plans, the Group makes contributions
on behalf of qualifying employees to a mandatory scheme under the provisions of the Pension Reform Act. The Group has no further
payment obligations once the contributions have been paid. The contributions are recognised as employee benefit expense when
they are due. Prepaid contributions are recognised as an asset to the extent that a cash refund or a reduction in the future payments
is available. For entities operating in Nigeria, the contribution by employees and the employing entities are 2.5% and 12.5%
respectively of the employees' basic salary, housing and transport allowances. Entities operating outside Nigeria contribute in line with
the relevant pension laws in their jurisdictions.
Short-term employees’ benefits are measured on an undiscounted basis and are expensed as the related services are provided.
A liability is recognised for the amount expected to be paid under short-term cash benefits such as accumulated leave and leave
allowances if the Group has a present legal or constructive obligation to pay this amount as a result of past services provided by the
employee and the obligation can be measured reliably.
The Group has a defined contribution plan.
Consolidated and Separate Financial Statements 31 December, 2013
Page 39

Zenith Bank Plc
Notes to the Consolidated and Separate Financial Statements
For The Year Ended 31 December 2013
(a) Insurance contracts
(i) Individual life
2.16 Recognition of interest income and expense
Dividend income is recognised in profit or loss in the period in which the right of receipt is established.
The Group issues contracts that transfer insurance risk, financial risk or both.
Insurance contracts are those contracts that transfer significant insurance risk. The Group defines as significant insurance risk the
possibility of having to pay benefits, on the occurrence of an insured event, that are significantly more than the benefits payable if the
insured event did not occur.
Investment contracts are those contracts that transfer financial risk without significant insurance risk. Financial risk refers to the risk of
a possible future change in the value of an asset or financial instrument due to a change in interest rate, commodity price, index of
prices, foreign exchange rate or other measurable variable.
In terms of IFRS 4, insurance liabilities are measured under existing local practice at the date of adoption of IFRS 4.
The Group had, prior to the adoption of IFRS 4, valued insurance liabilities using certain actuarial techniques as described below. The
Group has continued to value insurance liabilities in accordance with these.
Interest income and expense for all financial assets and financial liabilities carried at amortised cost are recognised in profit or loss
using the effective interest method.
The effective interest method is a method of calculating the amortised cost of a financial asset or a financial liability and of allocating
the interest income or interest expense over the relevant period. The effective interest rate is the rate that exactly discounts estimated
future cash payments or receipts through the expected life of the financial instrument or, when appropriate, a shorter period to the net
carrying amount of the financial asset or financial liability. Direct incremental transaction costs incurred and origination fees received,
including loan commitment fees, as a result of bringing margin-yielding assets or liabilities in the statement of financial position, are
capitalised to the carrying amount of financial instruments, excluding financial instruments at fair value through profit or loss, and
amortised as interest income or expense over the life of the asset as part of the effective interest rate.
When calculating the effective interest rate, the Group estimates cash flows considering all contractual terms of the financial
instrument (for example, prepayment options) but does not consider future credit losses. The calculation includes all fees and points
paid or received between parties to the contract that are an integral part of the effective interest rate, transaction costs and all other
premiums or discounts. Where the estimated cash flows on financial assets are subsequently revised, other than impairment losses,
the carrying amount of the financial assets is adjusted to reflect actual and revised estimated cash flows.
Where a financial asset or a Group of similar financial assets has been written down as a result of an impairment loss, interest
income is recognised using the rate of interest used to discount the future cash flows for the purpose of measuring the impairment
loss.
2.17 Fees, commissions and other income
Fees and commission income and expense that are integral to the effective interest rate on a financial asset or liability are included in
the measurement of the effective interest rate. Other fees and commission income and expenses are generally recognised on an
accrual basis when the service has been provided. Loan commitment fees for loans that are likely to be drawn down are deferred
(together with related direct costs) and recognised as an adjustment to the effective interest rate on the loan. Loan syndication fees
are recognised as revenue when the syndication has been completed and the Group has retained no part of the loan package for
itself or has retained a part at the same effective interest rate as the other participants. Commission and fees arising from negotiating,
or participating in the negotiation of, a transaction for a third party, are recognised on completion of the underlying transaction.
2.18 Insurance and investment contracts
Insurance contracts are classified into three broad categories, depending on the duration of the risk and the type of risk insured,
namely Individual Life, Group Life and General insurance.
These contracts insure mainly against death. For the published accounts, the contracts are valued based on a gross premium
valuation taking into account the present value of expected future premium, claim and associated expense cash flows.
Any resultant negative policyholder liabilities, measured on an individual policy level, are set to zero (“zeroised”) so as not to
recognise profits prematurely.
Where the same policy includes both insurance and investment components and where the policy is classified as insurance, the
insurance and investment benefits are valued separately.
Consolidated and Separate Financial Statements 31 December, 2013
Page 40
Zenith Bank Plc
Notes to the Consolidated and Separate Financial Statements
For The Year Ended 31 December 2013
(ii) Group Life
(iii) General Insurance
(iv) Outstanding claims provision
(i) Embedded Investment Derivatives
(ii) Guaranteed Annuity Options
2.19 Current and deferred income tax
(a) Current tax
(b) Deferred tax
• investments in subsidiaries and joint ventures (excluding mutual funds) where the group controls the timing of the reversal of temporary differences and it is probable that these differences will not reverse in the foreseeable future.
Deferred income tax assets are recognised only to the extent that it is probable that future taxable profits will be available against
which the temporary differences can be utilised.
These contracts insure against death on a group basis. These contracts are short term in nature and are typically renewed annually.
Gross premium on life contract are recognised in the life fund account when payable by the policy holder. Gross life insurance written
premium comprise the total premium receivable for the whole period of cover provided by contracts entered into during the
accounting period and are recognised on the date of inception of the policy.
These contracts provide Fire, Accident, Motor, Marine, Bond, Engineering and Aviation insurance. Gross premiums comprise the
premiums on insurance contracts entered into during the year, irrespective of whether they relate in whole or in part to a later
accounting period. It is recognised at the point of attachment of risk to a policy before deducting cost of reinsurance cover and
unearned portion of the premium.
Unearned premiums are those proportions of premiums written in the year that relate to periods of risks after the reporting date. It is
computed separately for each insurance contract using a time proportionate basis, or another suitable basis for uneven risk contracts.
A full provision is made for the estimated cost of all claims notified but not settled at the reporting date, using the best information
available at that time. Provision is also made for the cost of claims incurred but not reported ("IBNR") until after the reporting date.
Similarly, provisions are made for “unallocated claims expenses” being the estimated administrative expenses that will be incurred
after the reporting date in settling all claims outstanding as at the date, including IBNR. Differences between the provision for
outstanding claims at a reporting date and the subsequent settlement are included in the Revenue Account of the following year.
(b) Insurance contracts with Discretionary Participation Features
Zenith issues single premium contracts that provide primarily savings benefits to policyholders but also transfer insurance risk. The
investment return credited to the policyholders is at Zenith’s discretion, subject to fair oversight and a minimum guaranteed. These
contracts are valued on a retrospective basis.
Embedded derivatives are analysed and valued separately where significant to the total liability, taking into account variation in
investment performance and interest rates.
Guaranteed Annuity Options, where a guaranteed rate of conversion to a life annuity is provided, is offered on some products. This
feature provides an option to the policyholder as is analysed and valued separately where significant to the total liability, taking into
account expected take-up rates, mortality variation and investment variation.
The amount of deferred tax provided is based on the expected manner of realisation or settlement of the carrying amount of the asset
or liability and is not discounted. Deferred tax assets are reviewed at each reporting date and are reduced to the extent that it is no
longer probable that the related tax benefit will be realised.
Deferred tax assets and liabilities are offset if there is a legally enforceable right to offset current tax liabilities and assets, and they
relate to taxes levied by the same tax authority on the same taxable entity, or on different tax entities, but they intend to settle current
tax liabilities and assets on a net basis or their tax assets and liabilities will be realised simultaneously.
The tax expense for the period comprises current and deferred tax. Tax is recognised in profit or loss, except to the extent that it
relates to items recognised directly in equity. In this case, the tax is also recognised in equity and subsequently recognised in profit or
loss when the related deferred gain or loss is recognised.
The current income tax charge is calculated on the basis of the tax laws enacted or substantively enacted at the reporting date in the
countries where the Bank’s subsidiaries and associates operate and generate taxable income.
Deferred income tax is provided in full, using the liability method, on all temporary differences arising between the tax bases of assets
and liabilities and their carrying values for financial reporting purposes. Deferred income tax is determined using tax rates enacted or
substantively enacted at the reporting date and are expected to apply when the related deferred income tax liability is settled.
Deferred tax is not recognised for the following temporary differences:• the initial recognition of goodwill;• the initial recognition of assets and liabilities in a transaction that is not a business combination, which affects neither accounting nor taxable profits or losses; and
Consolidated and Separate Financial Statements 31 December, 2013
Page 41
Zenith Bank Plc
Notes to the Consolidated and Separate Financial Statements
For The Year Ended 31 December 2013
2.20 Earnings per share
2.21 Segment reporting
2.22 Fiduciary activities
2.23 Discontinued operations
A discontinued operation is a component of the Group's business that represents a separate major line of business or a geographical
area of operations that has been disposed of or is held for sale or distribution, or is a subsidiary acquired exclusively with a view to
resale. Classification as a discontinued operation occurs upon disposal or when the operation meets the criteria to be classified as
held for sale, if earlier. When an operation is classified as a discontinued operation, the comparative statement of comprehensive
income is re-presented as if the operation had been discontinued from the start of the comparative year.
Non-current assets, or disposal groups comprising assets and liabilities, that are expected to be recovered primarily through sale or
distribution rather than through continuing use, are classified as held for sale or distribution. Immediately before classification as held
for sale or distribution, the assets, or components of a disposal group, are re-measured in accordance with the Group's accounting
policies. Thereafter generally, the assets, or disposal group, are measured at the lower of their carrying amount and fair value less
costs to sell. Any impairment loss on a disposal group first is allocated to goodwill, and then to remaining assets and liabilities on a
pro rata basis, except that no loss is allocated to financial assets and deferred tax assets, which continue to be measured in
accordance with the Group's accounting policies. Impairment losses on initial classification as held for sale or distribution and
subsequent gains and losses on re-measurement are recognized in profit or loss. Gains are not recognized in excess of any
cumulative impairment loss.
Intangible assets and property and equipment once classified as held for sale or distribution are not amortized or depreciated. In
addition, equity accounting of equity-accounted investees ceases once classified as held for sale or distribution.
Deferred tax related to the fair value re-measurement of equity instruments which are charged or credited directly to other
comprehensive income, is also credited or charged directly to other comprehensive income and is not subsequently transferred from
equity to profit or loss.
The Group presents basic earnings per share (EPS) for its ordinary shares. Basic EPS is calculated by dividing the profit or loss
attributable to ordinary shareholders of the Bank by the weighted average number of ordinary shares outstanding during the period.
An operating segment is a component of the Group engaged in business activities from which it can earn revenues, whose operating
results are regularly reviewed by the Group's Executive [Management/Board] in order to make decisions about resources to be
allocated to segments and assessing segment performance. The Group’s identification of segments and the measurement of
segment results is based on the Group’s internal reporting to management.
The Group acts as trustees and in other fiduciary capacities through Zenith Trustees Limited and Zenith Pension Custodians that
result in the holding or placing of assets on behalf of individuals, trusts, retirement benefit plans and other institutions. These assets
and income arising thereon are excluded from these financial statements, as they are not assets of the Group.
2.24 Non-current assets held for sale or distribution
Additional taxes that arise from the distribution of dividends by the Bank are recognised at the same time as the liability to pay the
related dividend is recognized.
Consolidated and Separate Financial Statements 31 December, 2013
Page 42

Zenith Bank Plc
Notes To The Consolidated And Separate Financial Statements
For The Year Ended 31 December 2013
3. Risk management
3.1.1 Risk Management Philisophy/Strategy
3.1.3 Risk Management Approach
In addition, Zenith Group manages its risks in a structured, systematic and transparent manner through a global risk policy which embeds
comprehensive risk management processes into the organisational structure and risk measurement and monitoring activities. This structure
ensures that the Group’s overall risk exposures are within the thresholds set by the Board.
The key features of the Group’s risk management policy are:
• The Board of Directors provides overall risk management direction and oversight.
• The Group’s risk appetite is approved by the Board of Directors.
• Risk management is embedded in the Group as an intrinsic process and is a core competence of all its employees.
• The Group manages its credit, market, operational and liquidity risks in a co-ordinated manner within the organisation.
• The Group’s risk management function is independent of the business divisions.
• The Group’s internal audit function reports to the Board Audit Committee and provides independent validation of the business units’
compliance with risk policies and procedures and the adequacy and effectiveness of the risk management framework on an enterprise-wide
basis.
The Group continually modifies and enhances its risk management policies and systems to reflect changes in markets, products and
international best practices. Training, individual responsibility and accountability, together with a disciplined and cautious culture of control, is an
intergral part of the Group’s management of risk.
The Board of Directors ensures strict compliance with relevant laws, rules and standards issued by the industry regulators and other law
enforcement agencies, market conventions, codes of practices promoted by industry associations and internal policies.
The compliance function, under the leadership of the Chief Compliance Officer of the bank has put in place a robust compliance framework,
which includes:
• Comprehensive compliance manual detailing the roles and responsibilities of all stakeholders in the compliance process,
• Review and analysis of all relevant laws and regulations, which are adopted into policy statements to ensure business is conducted
professionally;
• Review of the Bank's Anti Money Laundering Policy in accordance with changes in the Money Laudering Prohibition Act 2011 and Anti
Terrorism Act 2011 as amended;
• Incorporation of new guidelines in the Bank's Know Your Customer policies in line with the increasing global trend as outlined in the Central
Bank of Nigeria's Anti Money Laundering/Combating Finance of Terrorism Compliance Manual.
The Group's culture emphasizes high standard of ethical behaviour at all levels of the Bank. Therefore the Bank's board of directors promotes
sound organisation.
3.1 Enterprise Risk Review
Zenith Bank Group operates a business model that is largely diversified and spread across different geographical locations. This therefore
neccesitates the need for proper identification, measurement, aggregation and effective management of risks and efficient utilisation of capital
to derive an optimal risk and return ratio.
Risks associated with the business of the Group include financial risks, namely, credit risk, liquidity risk and market risk, counterparty and
concentration risks (which includes currency risk, interest rate risk and other price risks) as well as other risks such as operational risk,
strategic risk, legal risk, reputational risk, taxation risk, regulatory risk and insurance risk.
•The group considers sound risk management practise to be the foundation of a long lasting financial institution.
•The group continues to adopt a holistic and integrated approach to risk management and therefore,brings all risks together under one or a
limited number of oversight functions.
•Risk management is a shared responsibility.Therefore the Group aims to build a shared perspective on risks that is grounded in consensus.
•There is clear segregation of duties between market facing business units and risk management functions.
•Risk Management is governed by well defined policies which are clearly communicated across the Group.
•Risk related issues are taken into consideration in all business decisions. The Group shall continually strive to maintain a conservative balance
between risk and revenue consideration.
3.1.2 Risk Appetite
The Group's risk appetite is reviewed by the Board of Directors annually, at a level that minimises erosion of earnings or capital due to
avoidable losses or from frauds and operational inefficiencies. This reflect the conservative nature of Zenith Group as far as risk taking is
concerned.
The Group employs a range of quantitative and qualitative indicators to monitor the risk profile. Specific limits are set in line with the Group’s
risk appetite.
The Group addresses the challenge of risks comprehensively through an enterprise-wide risk management framework and a risk governance
policy by applying leading practices that is supported by a robust governance structure consisting of board level and executive management
committees. The Board drives the risk governance and compliance process through its committees. The audit commitee provides oversight on
the systems of internal control, financial reporting and compliance. The Board credit commitee reviews the credit policies and approves all
loans above the defined limits for Executive Management. The Board Risk Committee sets the risk philosophy, policies and strategies as well
as provides guidance on the various risk elements and their management.
The Board Risk Control Functions are supported by various management committees and sub committees (Global Credit commitee and
Management Risk committee) that help it develop and implement various risk strategies. The Global Credit commitee manages the credit
approval and documentation activities. It ensures that the credit policies and procedures are aligned with the Group's business objectives and
strategies. The Management Risk committee drives the management of the financial risks (Market, Liquidity and Credit Risk), operational risks
as well as strategic and reputational risks.
Consolidated and Separate Financial Statements 31 December, 2013
Page 43

Zenith Bank Plc
Notes To The Consolidated And Separate Financial Statements
For The Year Ended 31 December 2013
3.1.4 Methodology for risk rating
2. The likelihood of failure to pay over the period stipulated in the contract. 3. The size of the facility in case default occurs.4. Estimated Rate of Recovery which is a measure of the portion of the debt that can be regained through freezing of assets and collateral
should default occur.
• A pricing model that reflects variations in the risk profile of various credits to ensure that higher risks are compensated by higher returns is
adopted.
• All insiders’ related credits are limited to regulatory and strict internal limits and are disclosed as required.• The consequences for non-compliance with the credit policy and credit indiscipline are communicated to all staff and implemented.
3.2.1 Credit Metrics and Measurement Tools
Over the years, Zenith Bank and its subsidiaries have been able to devote resources and harness its credit data into developing models to
improve the determination of economic and financial threats due to credit risk. As a result some key factors are considered in credit risk
assesement and measurement.
1. Adherence to the strict credit selection criteria which includes defined target market, credit history, the capacity and character of customers.
The Group has robust credit standards, policies and procedures to control and monitor intrinsic and concentration risks through all credit levels
of selection, underwriting, administration and control. Some of the policies are:
• Credit is only extended to suitable and well identified customers and never where there is any doubt as to the ethical standards and record of
the intending borrower.• Exposures to any industry or customer will be determined by the regulatory guidelines, clearly defined internal policies, debt service capability
and balance sheet management guidelines.• Credit is not extended to customers where the source of repayment is unknown or speculative, and also where the destination of funds is
unknown. There must be clear and verifiable purpose for the use of the funds.• Credit is not given to a customer where the ability of the customer to meet obligations is based on the most optimistic forecast of events. Risk
considerations will always have priority over business and profit considerations• The primary source of repayment for all credits must be from an identifiable cash flow from the counterparty’s normal business operations or
other financial arrangements. The realization of security remains a fall back option.
• The contribution of the activity/sector to the total assets of the Bank.• The net income of the sector.• The risk inherent in the activity and sector.
Risk Management structures and processes are continually reviewed to ensure, their adequacy and appropriateness for the group’s risk and
opportunities profile as well as bringing them up to date with changes in strategy, business environment, evolving thoughts and trends in risk
management.
3.2 Credit Risk
Credit risk is defined as the likelihood that a customer or counterparty is unable to meet the contracted financial obligations resulting in a default
situation and/or financial loss. Credit exposures arise principally in credit-related risk that is embedded in loans and advances and investments.
There is also credit risk in off-balance sheet financial instruments, such as letters of credit, guarantees and loan commitments.
• Create adequate awareness to make risk management a part of the corporate culture of the Group.
• Ensure that risk remains within the boundaries established by the Board.
• Ensure that business lines comply with risk parameters and prudent limits established by the Board.
The CBN Risk Management Guidelines prescribes quantitative and qualitative criteria for the identification of significant activities and sets a
threshold of contributions for determining significant activities in Bank and its subsidiaries. This practice is essentially to drive the risk control
focus of financial institutions.
Zenith Bank applies a mix of qualitative and quantitative techniques in the determination of its significant activities under a prescribed broad
headings. The criteria used in estimating the materiality of each activity is essentially based on the following:• The strategic importance of the activity and sector.
• Risk identification, measurement, monitoring and control procedures.
• Establish effective internal controls that cover each risk management process.• Ensure that the group’s risk management processes are properly documented.
The risk management strategy is to develop an integrated approach to risk assessments, measurement, monitoring and control that captures all
risks in all aspects of the Group’s activities.
All activities in the Group have been profiled and the key risk drivers and threats in them identified. Mitigation and control techniques are then
determined in tackling each of these threats. These techniques are implemented as risk policies and procedures that drive the strategic
direction and risk appetite as specified by the board. Techniques employed in meeting these objectives culminate in the following roles for the
risk control functions of the Group:
• Develop and implement procedures and practices that translate the board's goals, objectives, and risk tolerances into operating standards that
are well understood by staff.
• Establish lines of authority and responsibility for managing individual risk elements in line with the Board’s overall direction.
Consolidated and Separate Financial Statements 31 December, 2013
Page 44

Zenith Bank Plc
Notes To The Consolidated And Separate Financial Statements
For The Year Ended 31 December 2013
Zenith Group’s internal rating:
Zenith Group Rating
AAAAA A
BBBBBB
CCCCCC D
Unrated
(b) Other debt instruments
3.2.3 Credit Processes
• Regulatory agencies reports
In addition to the above, we have put in place a conservative limits structure which is monitored from time to time in order to limit our risk
exposures on these securities.
Control mechanisms for the credit risk rating system
Zenith’s credit risk rating system is reviewed periodically to confirm that the rating criteria and procedures are appropriate given the current
portfolio and external conditions. Hence, in accordance with the Groups model risk policy, all models that materially impact the risk rating
process are reviewed.
Furthermore, the ratings accorded to customers are regularly reviewed, incorporating new financial information available and the experience in
the development of the banking relationship. The regularity of the reviews increases in the case of clients who reach certain levels in the
automated warning systems. The rating system is currently undergoing external review with a view to enhancing its robustness.
Zenith operates a Centralised Credit Approval Process System. Credits are originated from the branches/business groups and subjected to
reviews at various levels before presentation to the Global Credit Committee for approvals, and including all documents and information defined
for the proper assessment and decision of Credit. All credit presented for approval are required to be in conformity with the documented and
communicated Risk Acceptance Criteria(RAC).
As part of credit appraisal process, the Group will have to satisfy itself in the following areas:
a) Credit assessment of the borrower’s industry, and macro economic factors.
b) The purpose of credit and source of repayment.
c) The track record / repayment history of borrower.
d) Assess/evaluate the repayment capacity of the borrower.
e) The Proposed terms and conditions and covenants.
f) Adequacy and enforceability of collaterals.
g) Approval from appropriate authority.
Unrated Unrated
The credit rating system seeks to achieve the foundation level of the internal ratings based approach under Basle II, through continuous
validation exercises over the years.
With respect to other debt instruments, the Group takes the following into consideration in the management of the associated credit risk:
• External ratings of such instruments/institutions by rating agencies like Fitch; Standard & Poor’s; Agusto & Co. etc.
• Internal and external research and market intelligence reports
Non Investment Grade (Extremely High Risk) CCNon Investment Grade (High Likelihood of Default) C
Non Investment Grade (Lost) D
Lower Standard Grade (Moderately High Risk) BB Non Investment Grade (High Risk) B
Non Investment Grade (Very High Risk) CCC
Investment Risk (Very Low Risk) AA Investment Risk (Low Risk) A
Upper Standard Grade (Acceptable Risk) BBB
Each individual borrower is rated based on an internally developed rating model that evaluates risk based on financial, qualitative and industry
specific inputs. The associated loss estimate norms for each grade have been developed based on the experience of the Bank and its various
subsidiaries.
In order to allow for a meaningful distribution of exposures across grades with no excessive concentrations on the Group's borrower-rating and
its facility-rating scale, the Group maintains the under listed rating grade which is applicable to both new and existing customers.
Description of the grade Equivalent of external rating
Investment Risk (Extremely Low Risk) AAA
3.2.2 Credit Rating Tools
The principal objective of the credit risk rating system is to produce a reliable assessment of the credit risk to which the Group is exposed. As
such, all loans and indirect credits such as guarantees and bonds as well as treasury investments undergo a formal credit analysis process that
would ensure the proper appraisal of the facility.
(a) Loans and advances and amounts due from banks
Consolidated and Separate Financial Statements 31 December, 2013
Page 45

Zenith Bank Plc
Notes To The Consolidated And Separate Financial Statements
For The Year Ended 31 December 2013
Approval Authority level
Board Credit CommitteeGlobal Credit Committee
(a) Collateral Security
The capabilities of the credit review team is continously being improved in order to improve the facility monitoring activity and assure good
quality Risk Assets Portfolio accross the Group.A specialised and focused loan recovery and workout team handles the management and collection of problem credit facilities.
3.2.7(a) Credit Risk Mitigation, Collateral and other Credit Enhancements
Portfolio diversification is the cornerstone of the Group’s credit risk mitigation strategy which is implemented through customer, facility, industry
and geographical limit structure. Zenith uses a variety of techniques to manage the credit risk arising from its lending activities.
Enforceable legal documentation establishes Zenith’s direct, irrevocable and unconditional recourse to any collateral, security or other credit
enhancements provided to secure facilities granted.
A key mitigation step employed by the Group in its credit risk management process includes the use of collateral securities to secure its loans
and advances as alternative sources of repayment during adverse conditions. All major credit facilities to our customers are to be secured and
the security instruments and documentations must be perfected and all conditions precedent must be met before drawdown or disbursement is
allowed. Collateral analysis includes a good description of the collateral, its value, how the value was arrived at, and when the valuation was
made. It is usually necessary to review the potential adverse changes in the value of collateral security for the foreseeable future.
N7 billion and above (Not exceeding 20% of Total Shareholders’ funds)Below N7 billion
These internal approval limits are set and approved by the Group Board and are reviewed regularly as the state of affairs of the Group and the
wider financial environment demands.
3.2.6 Group Credit Risk Monitoring
The Group’s exposures are continuously monitored through a system of triggers and early-warning signals aimed at detecting symptoms which
could result in deterioration of credit risk quality. The triggers and early-warning systems are supplemented by facility utilisation and collateral
valuation monitoring together with a review of upcoming credit facility expiration and market intelligence to enable timely corrective action by
management. The results of the monitoring process are reflected in the internal rating process in a quarterly review activity.
Credit risk is monitored on an ongoing basis with formal weekly,monthly and quarterly reporting to ensure senior management awareness of
shifts in credit quality and portfolio performance along with changing external factors such as economic and business cycles.
The Group applies credit risk limits, among other techniques in managing credit risk. This is the practice of stipulating a maximum amount that
the individual or counterparty can obtain as loan. Internal and regulatory limits are strictly adhered to.Through this, the Group not only protects
itself, but also in a sense, protects the counterparty from borrowing more than they are capable of paying.
The Group continues to focus on its concentration and intrinsic risks and further manage them to a more comfortable level. This is very
important due to the serious risk implications that intrinsic and concentration risk pose to the Group. A thorough analysis of economic factors,
market forecasting and prediction based on historical evidence is used to mitigate the crystallization of these risks.
The Group has in place various portfolio concentration limits( which is subject to periodic review) .These limits are closely monitored and
reported on from time to time.
The Group’s internal credit approval limits for the various authorities levels are as indicated below.
Approval limit (% of Shareholders' Fund)
Zenith's dynamic and proactive approach in managing credit risk is a key element in achieving its strategic objective of maintaining and further
enhancing its asset quality and credit portfolio risk profile. The conservative, prudent and well-established credit standards, policies and
procedures, risk methodologies and framework, solid structure and infrastructure, risk monitoring and control activities enable the Group to deal
with the emerging risks and challenges with a high level of confidence and determination.
The framework for Credit Risk at Zenith is well defined and institutionally predicated on:
• Clear tolerance limits and risk appetite set at the Board level, well communicated to the business units and periodically reviewed and
monitored to adjust as appropriate.
• Well-defined target market and risk asset acceptance criteria.
• Rigorous financial, credit and overall risk analysis for each customer/transaction.
• Portfolio quality examined on regular basis according to key performance indicators mechanism and periodic stress testing.
• Concentrations together with mitigation strategies are continuously assessed.
• Early warning system is continually validated and modified to ensure proper functioning for risk identification.
• Systematic and objective credit risk rating methodologies that are based on quantitative, qualitative and expert judgment.
• Systematic credit limits management enabling the Bank to monitor its credit exposure on daily basis at country, borrower, industry, credit risk
rating and credit facility type levels.
• Solid documentation and collateral management process with proper coverage and top-up triggers and follow-ups.
• Annual and interim individual credit reviews to ensure detection of weakness signs or warning signals and considering proper remedies.
Our rigorous credit processes are supplemented by sectoral portfolio reviews focused on countries, regions or specific industries as well as
multiple stress testing scenarios.
These are intended to identify any inherent risks in the portfolios resulting from changes in market conditions and are supplemented by
independent reviews from our Group Internal Audit.
Additionally, the Group continues to upgrade and fine-tune the above in line with the developments in the financial services industry
environment and technology.
3.2.5 Group Credit Risk Limits
3.2.4 Group Credit Risk Management
Consolidated and Separate Financial Statements 31 December, 2013
Page 46

Zenith Bank Plc
Notes To The Consolidated And Separate Financial Statements
For The Year Ended 31 December 2013
Details of collateral held and their carrying amounts as at 31 December 2013 are as follows:
In millions of Naira Group Group Bank Bank
Total
exposure
Value of
collateral
Total
exposure
Value of
collateral
Secured against real estate 177,379 137,292 152,379 127,292 Secured by shares of quoted companies 32,482 10,652 17,482 5,652 Cash Collateral, lien over fixed and floating assets 860,299 340,038 810,299 325,038 Unsecured 205,962 - 168,218 -
1,276,122 487,982 1,148,378 457,982
Details of collateral held and their carrying amounts as at 31 December 2012 are as follows:
In millions of Naira Group Group Bank Bank
Total
exposure
Value of
collateral
Total
exposure
Value of
collateral
Secured against real estate 164,620 185,137 140,789 156,540Secured by shares of quoted companies 11,217 7,507 8,666 3,680Cash Collateral, lien over fixed and floating assets 788,155 535,830 728,208 489,071Unsecured 50,534 - 39,128 -
1,014,526 728,474 916,791 649,291
(a) Geographical sectors
The following table breaks down the Group’s main credit exposure at their gross amounts ( "Due from banks" at carrying amount), as
categorised by geographical region at 31 December 2013 and 2012 respectively. For this table, the Group has allocated exposures to regions
based on the region of domicile of our counterparties.
Guarantees and Standby Letters of Credit are considered to carry about the same level of credit risk as loans and advances. And in accordance
with the Group’s credit policies, banks and creditworthy companies and individuals with high net worth are accepted as guarantor, subject to
credit risk assessment. Furthermore Zenith only recognises unconditional irrevocable guarantees or standby letters of credit provided they are
not related to the underlying obligor.
3.2.7 (b) Maximum Exposure to Credit Risk Before Collateral Held or Credit Enhancements
The Group's maximum exposure to credit risk at 31 December 2013 and 2012 respectively, is represented by the net carrying amounts of the
financial assets, with the exception of financial and other guarantees issued by the Group for which the maximum exposure to credit risk is
represented by the maximum amount the Group would have to pay if the guarantees are called on (refer note 39 Contingent liabilities and
commitments).
3.2.8 Concentration of Risks of Financial Assets with Credit Risk Exposure
The Group monitors concentrations of credit risk by geographical location and by industry sector. An analysis of concentrations of credit risk at
31 December 2013 and 2012 respectively for loans and advances to customers and amounts due from banks, is set out below:
Collateral securities are usually valued and inspected prior to disbursement and on a regular basis thereafter until full repayment of the
exposure. We regularly conduct a review of all collateral documentation in respect of all credits in the Bank and specific gaps in the collateral
documentation are advised to the Lending Group/Zones/Branch for appropriate action and follow-up.
The type and size of collateral held as security for financial assets other than loans and advances is usually a function of the nature of the
instrument. Our debt securities, treasury and other eligible bills are normally unsecured but our comfort is on the issuer’s credit rating which is
the Federal Government of Nigeria (FGN).
(b) Balance Sheet Netting Arrangements
Risk reduction by way of current account set-off is recognised for exposures to highly rated and creditworthy customers. Customers are required
to enter into formal agreements giving Zenith the unfettered right to set-off gross credit and debit balances in their nominated accounts to
determine the Groups net exposure. Cross-border set-offs are not permitted.
(c) Guarantees and Standby Letters of Credit
• Real estate, plant and equipment collateral (usually all asset or mortgage debenture or charge) which have to be registered and enforceable
under Nigerian law;• Collateral consisting of inventory, accounts receivable, machinery equipment, patents, trademarks, farm products, general intangibles, etc.
These require a security agreement (usually a floating debenture) which has to be registered and, must be enforceable under Nigerian law;
• Stocks and shares of publicly quoted companies;•Domiciliation of contracts proceeds;
• Documents of title to goods such as shipping documents consigned to the order of Zenith Bank or any of its subsidiaries; and• Letter of lien.
Collateral securities that are pledged must be in negotiable form and usually fall under the following categories:
Consolidated and Separate Financial Statements 31 December, 2013
Page 47

Zenith Bank Plc
Notes To The Consolidated And Separate Financial Statements
For The Year Ended 31 December 2013
In millions of Naira
At 31 December 2013
Nigeria 153,887 1,148,378 1,302,265 97,257 1,148,378 1,245,635
Rest of Africa 12,039 52,783 64,822 - - -
Outside Africa 90,803 74,961 165,764 152,267 - 152,267
256,729 1,276,122 1,532,851 249,524 1,148,378 1,397,902
At 31 December 2012
Nigeria 20,717 916,791 937,508 12,359 916,791 929,150
Rest of Africa 3,498 32,474 35,972 - - - Outside Africa 157,805 65,261 223,066 191,432 - 191,432
182,020 1,014,526 1,196,546 203,791 916,791 1,120,582
2013 2012 2013 2012
Agriculture 64,696 62,541 60,722 52,541
Oil and gas 193,883 170,890 173,143 160,850
Consumer Credit 30,141 43,182 29,901 35,182
Manufacturing 287,636 244,723 262,848 214,691
Real estate and construction 84,709 72,734 77,101 59,734
Finance and Insurance 25,667 28,208 22,463 20,208
Government 113,801 82,358 102,572 80,695
Power 49,696 4,111 44,938 2,111
Other public utilities 28,208 153 28,192 153
Transportation 93,183 48,661 86,712 51,661
Communication 186,176 141,671 168,041 141,671
Education 3,578 2,038 3,185 2,038
General Commerce 72,058 80,031 64,573 69,031
Others 42,690 33,225 23,987 26,225 1,276,122 1,014,526 1,148,378 916,791
(b) Industry sectors
Group Bank
Loans and
advances to
customers
Loans and
advances to
customers
Loans and
advances to
customers
Loans and
advances to
customers
Due from
banks
Loans and
advances to
customers Total
Due from
banks
Loans and
advances to
customers Total
Group Bank
Due from
banks
Loans and
advances to
customers Total
Due from
banks
Loans and
advances to
customers Total
Consolidated and Separate Financial Statements 31 December, 2013
Page 48


Zenith Bank Plc
Notes To The Consolidated And Separate Financial Statements
For The Year Ended 31 December 2013
At 31 December (N'millions)
2013 2012 2013 2012
South South 70,109 66,955 70,109 66,955
South West 974,519 783,607 974,519 783,606 South East 17,294 19,607 17,294 19,607 North Central 57,689 16,665 57,689 16,666 North West 7,874 6,933 7,874 6,933 North East 20,893 23,024 20,893 23,024 Rest of Africa 52,783 32,474 - - Outside Africa 74,961 65,261 - -
1,276,122 1,014,526 1,148,378 916,791
At 31 December 2013
AAA 256,729 814,467 249,524 734,057
AA to A - 156,932 - 123,644
BBB to BB - 193,838 - 189,669
Below B - 35,281 - 32,540
Unrated - 36,540 - 32,602 -
256,729 1,237,058 249,524 1,112,512
At 31 December 2012
AAA 182,020 640,001 203,791 579,818
AA to A - 123,827 - 97,664
BBB to BB - 152,316 - 149,816
Below B - 27,723 - 25,703
Unrated - 28,713 - 25,752
182,020 972,580 203,791 878,753
Due from
banks
Loans and
advances to
customers
Due from
banks
Loans and
advances to
customers
The credit quality of the portfolio of loans and advances and amounts due from banks that were neither past due nor impaired can be assessed
by reference to the internal rating system adopted by the Group.
Group Bank
Due from
banks
Loans and
advances to
customers
Due from
banks
Loans and
advances to
customers
Loans and
advances to
customers
Loans and
advances to
customers
Loans and
advances to
customers
Loans and
advances to
customers
All other financial assets are neither past due nor impaired, except other assets. NGN 3.05 billion of financial assets which are neither past
due nor impaired have been renegotiated (2012: NGN 2.9 billion).
(a) Credit portfolio neither past due nor impaired
(a) Geographical Sectors
The following table breaks down the Group’s main credit exposure at their carrying amounts, as categorised by geographical region at 31
December 2013 together with prior period comparatives. For this table, the Group has allocated exposures to regions based on the domicile
region of our counterparties.
Group Bank
Consolidated and Separate Financial Statements 31 December, 2013
Page 50

Zenith Bank Plc
Notes To The Consolidated And Separate Financial Statements
For The Year Ended 31 December 2013
At 31 December 2013
AAA 603,851 586,441 292,471 587,793 572,598 201,869
AA to A - - 10,654 - - 10,654
BBB to BB - - - - - -
Below B - - - - - -
Unrated - - - - - -
603,851 586,441 303,125 587,793 572,598 212,523
In millions of Naira
At 31 December 2012
AAA 332,515 669,164 289,938 313,546 647,474 247,500
AA to A - - 9,405 - - 9,405
BBB to BB - - - - - -
Below B - - -
Unrated - - -332,515 669,164 299,343 313,546 647,474 256,905
2013 2012 2013 2012
N'millions N'millions N'millions N'millions
Past due up to 30 days 4,701 1,633 4,601 1,364
Past due 30 - 60 days 894 7,999 824 7,844
Past due 60 - 90 days 2,552 384 2,464 373
8,147 10,016 7,889 9,581
A 7,974 9,318 7,758 9,289 BB 173 698 131 292
8,147 10,016 7,889 9,581
In millions of Naira 2013 2012 2013 2012
N'millions N'millions N'millions N'millions
Gross amount
BB 10,300 10,120 8,530 8,152
Grade: Below BB 3,543 4,360 2,491 3,840
Specific impairment (7,972) (10,601) (5,600) (8,368)
5,871 3,879 5,421 3,624
Included in interest income on loans and advances are amounts totalling N 3,160 million (2012: N4,186 million) and N 2,022 million (2012:
N2,308 million) for the Group and Bank respectively which represent interest incomes on impaired financial assets, recognised using the rate of
interest used to discount the future cash flows for the purpose of measuring the impairment loss.
(c) Credit rating of past due but not impaired
(d) Credit portfolio individually impaired
Group Bank
Loans and
advances to
customers
Loans and
advances to
customers
Loans and
advances to
customers
Loans and
advances to
customers
The credit risk associated with other financial assets that were neither past due nor impaired are considered to be low at 31 December 2013
and 2012.
(b) Credit portfolio past due but not impaired
Group Bank
Loans and
advances to
customers
Loans and
advances to
customers
Loans and
advances to
customers
Loans and
advances to
customers
Group Bank
Cash and
balances
with central
Treasury
bills
Investment
securities
Cash and
balances
with central
Treasury
bills
Investment
securities
Cash and
balances
with central
Treasury
bills
Investment
securities
Cash and
balances
with central
Treasury
bills
Investment
securities
The credit quality of cash and balances with central banks, treasury bills, investment securities and other financial assets that were neither past
due nor impaired can also be assessed by reference to the internal rating system adopted by the Group.
Group Bank
Consolidated and Separate Financial Statements 31 December, 2013
Page 51

Zenith Bank Plc
Notes To The Consolidated And Separate Financial Statements
For The Year Ended 31 December 2013
Restructuring policy
The group’s credit committee may from time to time grant approval for restructuring of certain facilities due to the following reasons;
i. Where the execution of the loan purpose and the repayment is no longer realistic in light of new cash flows.
vi. Where the customer’s going concern status is NOT in doubt or threatened.
Write-off policy
3.3.2 Measurement of Market Risk
The Group proactively manages its Market risk exposures in both the trading and banking books within the acceptable levels.
The Group's Market Risks exposures are broadly categorised into:
(i) Trading Market Risks - These are risks that arise primarily through trading activities and Market Making activities. These include position
taking in foreign exchange and fixed income securities (Bonds and Treasury Bills).
(ii) Non Trading Market Risks -These are risks that arise from assets and liabilities that are usually on our books for a longer period of time,
but where the Intrinsic value is a function of the movement of financial market parameter.
The Group currently adopts both VAR and Non-VAR approach for quantitative measurement and control of market risks in both trading and
non trading books. The Non -VAR measurements includes: Duration;Factor Sensitivities (Pv01), Stress Testing, Aggregate Open Position etc.
The measured risks are therefore monitored against the pre-set limits on a daily basis. All exceptions are investigated and report in line with our
internal policies and guidelines.
Limits are sets to reflect the risk appetite that is approved by the Board of Directors.These limits are reviewed, at least, annually or at a more
frequent interval. Some of the limits include; Net Open Position (NOP- for foreign exchange); Aggregate Control Limits (for Securities);
Management Action Trigger (MAT); Duration; Factor Sensitivities (Pv01); Permitted Instrument and Tenor Limits; Holding Period and Off Market
Rate Tolerance limit.
Zenith Group generally does not offer very complex derivative products. However, with the setting up of Financial Market Quotation Plc
(FMDQ), it is expected that more sophisicated products will be introduced into the market. We will ensure that adequate capacity (both systems
and training/knowledge base) are in place to handle these products as at when they are introduced. The overall size of the trading book is
maintained at a very manageable size.
The Group's market risk objectives, policies and processes are aimed at instituting a model that objectively identifies, measures and manages
market risks in the Group and ensure that:
1. The individuals who take or manage risk clearly understand it.2. The Group's risk exposure is within established limits.3. Risk taking decisions are in line with business strategy and objectives set by the Board of Directors.4. The expected payoffs compensate for the risks taken.5. Sufficient capital, as a buffer, is available to take risk.
The revised terms of restructured facilities usually include extended maturity, changing timing of interest payments and amendments to the
terms of the loan agreement.
The group writes off a loan balance when the Group’s credit department determines that the loan is uncollectable and had been declared
delinquent and subsequently classified as lost. This determination is made after considering information such as the continuous deterioration in
the customer’s financial position, such that the customer can no longer pay the obligation, or that proceeds from the collateral will not be
sufficient to pay back the entire exposure. Board approval is required for such write-off. The loan recovery department continues with its
recovery efforts and any loan subsequently recovered is treated as other income.
3.3 Market risk
The Group undertakes activities which give rise to a considerable level of market risks exposures (i.e. the risk that the fair value of future cash
flows of our trading and investment positions or other financial instrument will fluctuate because of changes in market prices). Market risks can
arise from adverse changes in interest rates, foreign exchange rates,equity prices,commodity prices and other relevant factors such as Market
volatilities.The objective of market risk management activities is to continually manage and control market risk exposure within acceptable
parameters, while optimizing the return on risks taken.
3.3.1 Management of market risk
The Group has an independent Market Risk Management unit which assesses, monitors, manages and reports on market risk taking activities
across the group. We have continued to enhance our Market Risk Management Framework. The operations of the unit is guided by the mission
of "inculcating enduring market risk management values and culture, with a view to reducing the risk of losses associated with
market risk-taking activities, and optimizing risk-reward trade-off.”
Loans with renegotiated terms are loans that have been restructured because the Group has made concessions by agreeing to terms and
conditions that are more favorable for the customer than the Group has provided initially. The Group implements restructuring policy in order to
maximize collections opportunities and minimize the risk of default.
ii, To avoid unintended default arising from adverse business conditions .iii. To align loan repayment with new pattern of achievable cash flows.
iv. Where there are proven cost over runs that may significantly impair the project repayment capacity.v. Where there is temporary downturn in the customer’s business environment .
Consolidated and Separate Financial Statements 31 December, 2013
Page 52

Zenith Bank Plc
Notes To The Consolidated And Separate Financial Statements
For The Year Ended 31 December 2013
3.3.3 Foreign exchange risk
(a) Group
At 31 December 2013 Naira Dollar GBP Euro Others Total
Assets
Cash and balances with central banks 426,581 119,433 38,064 19,750 23 603,851
Treasury bills 572,598 - 13,789 - 54 586,441
Due from other banks 152,267 81,201 128 2,011 21,122 256,729
Loans and advances to customers (gross) 921,643 296,435 578 - 57,466 1,276,122 insurance receivables - Investment securities 212,523 40,249 - 49,729 624 303,125 Other assets (gross) 36,052 - 3,071 - 1,752 40,875
2,321,664 537,318 55,630 71,490 81,041 3,067,143
LiabilitiesDeposits from customers 1,831,245 424,241 5,852 13,300 2,117 2,276,755
Other liabilities 25,937 168,695 2,423 16,034 2,554 215,643
On-lending facilities 59,528 - - - - 59,528 Borrowings - 60,150 - - - 60,150
1,916,710 653,086 8,275 29,334 4,671 2,612,076
Net on-balance sheet position 404,954 (115,768) 47,355 42,156 76,370 455,067
At 31 December 2012
In millions of Naira Naira Dollar GBP Euro Others Total
Assets
Cash and balances with central banks 321,907 660 6,786 58 3,104 332,515 Treasury bills 647,475 - - - 21,689 669,164 Due from other banks 12,359 149,924 4,046 - 15,691 182,020
Loans and advances to customers (gross) 836,219 165,184 712 - 12,411 1,014,526 Investment securities 256,905 33,546 6,604 1,019 1,269 299,343
Other assets (gross) 21,770 - - - 11,532 33,302
2,096,635 349,314 18,148 1,077 65,696 2,530,870
Liabilities
Deposits from customers 1,653,908 190,330 5,259 8,027 71,720 1,929,244 Other liabilities 11,608 88,221 1,954 14,228 1,344 117,355
On-lending facilities 56,066 - - - - 56,066
Borrowings - 15,138 - - - 15,138
1,721,582 293,689 7,213 22,255 73,064 2,117,803
Net on-balance sheet position 375,053 55,625 10,935 (21,178) (7,368) 413,067
2013 2012
US Dollars effect of 10% up or (down) movement on profit before tax and balance sheet size 11,577 5,563
GBP effect of 10% up or (down) movement on profit before tax and balance sheet size 4,736 1,093
The table below summarizes the Group’s exposure to foreign currency exchange rate risk at 31 December 2013 and 31 December 2012.
Included in the table are the Group’s financial instruments at carrying amounts (except for loans and advances to customers and other assets
which are shown at thier gross amount), categorised by currency.
The Group’s exposure to foreign currency risk is largely concentrated in the US Dollar and Pound Sterling. Movement in exchange rate between
the US Dollar,GBP and the Nigerian Naira affects reported earnings through revaluation gain or loss and balance sheet size through increase or
decrease in the revalued amounts of assets and liabilities denominated in US Dollars or GBP.
The table below shows the impact on the Group’s profit and balance sheet size if the exchange rate between the US Dollars,GBP and Nigerian
Naira had increased or decreased by 10%, with all other variables held constant.
Fluctuations in the prevailing foreign currency exchange rates can affect the groups financial position and cash flows - 'On' and 'Off' Balance
Sheet. The Group manages part of the Foreign exchange risks through basic derivatives products and hedges. The risk is also managed by
ensuring the Treasury Group operates within approved limits.
For example, Zenith employs the use of Internal limits (for Overall Overnight and Intra-day positions), Dealer limits, as well as individual
currency limits which is monitored by the Market Risk Department. There are other limits that are utilised in managing foreign exchange risks.
These limits are set with the aim of minimizing the Group's risk exposures to exchange rates volatilities to an acceptable level. The more
volatile currencies are assigned lower limits. The Group's transactions are carried out mainly in seven (7) foreign currencies with a significant
percentage of transactions involving US Dollars and British Pounds Sterling (GBP).
The Group's net exposure to foreign currency risk is largely concentrated in US Dollars and British Pounds Sterling.
Consolidated and Separate Financial Statements 31 December, 2013
Page 53

Zenith Bank Plc
Notes To The Consolidated And Separate Financial Statements
For The Year Ended 31 December 2013
(b) Bank
At 31 December 2013
In millions of Naira Naira Dollar GBP Euro Others Total
Assets
Cash and balances with central banks 458,572 96,293 15,431 17,497 - 587,793 Treasury bills 572,598 - - - - 572,598 Due from other banks 152,267 96,829 - 428 - 249,524 Loans and advances to customers (gross) 921,643 226,735 - - - 1,148,378 Investment securities 212,523 - - - - 212,523 Other assets (gross) 36,052 - - - - 36,052
2,353,655 419,857 15,431 17,925 - 2,806,868
Liabilities
Deposits from customers 1,831,245 237,526 2,958 8,133 - 2,079,862
On-lending facilities 59,528 - - - 59,528 Borrowings - 60,150 - - 60,150 Other liabilities 25,937 157,127 2,167 16,034 - 201,265
1,916,710 454,803 5,125 24,167 - 2,400,805
Net on-balance sheet position 436,944 (34,946) 10,306 (6,242) - 406,063
At 31 December 2012
In millions of Naira Naira Dollar GBP Euro Others Total
AssetsCash and balances with central banks 313,546 - - - - 313,546
Treasury bills 647,474 - - - - 647,474 Due from other banks 12,359 185,166 4,046 - 2,220 203,791 Loans and advances to customers (gross) 836,219 80,572 - - - 916,791 Investment securities 256,905 - - - - 256,905 Other assets (gross) 21,451 - - - - 21,451
2,087,954 265,738 4,046 - 2,220 2,359,958
Liabilities
Deposits from customers 1,653,908 141,861 2,378 3,861 - 1,802,008 Other liabilities 11,530 87,749 1,519 14,229 - 115,027
On-lending facilities 56,066 - - - - 56,066 Borrowings - 15,138 - - - 15,138
1,721,504 244,748 3,897 18,090 - 1,988,239
Net on-balance sheet position 366,450 20,990 149 (18,090) 2,220 371,719
2013 2012
US Dollar effect of 10% up or (down) movement on profit before tax and balance sheet size 3,495 2,099
GBP effect of 10% up or (down) movement on profit before tax and balance sheet size 1,031 15
The table below summarizes the bank’s exposure to foreign currency exchange rate risk at 31 December 2013 and 31 December 2012.
Included in the table are the Banks’s financial instruments at carrying amounts, categorised by currency.
The Bank’s exposure to foreign currency risk is largely concentrated in the US Dollar and Pound Sterling . Movement in exchange rate between
the US Dollar,GBP and the Nigerian Naira affects reported earnings through revaluation gain or loss and balance sheet size through increase or
decrease in the revalued amounts of assets and liabilities denominated in US Dollars and GBP.
The table below shows the impact on the Bank’s profit and balance sheet size if the exchange rate between the US Dollars, GBP and Nigerian
Naira had increased or decreased by 10%, with all other variables held constant.
Consolidated and Separate Financial Statements 31 December, 2013
Page 54

Zenith Bank Plc
Notes To The Consolidated And Separate Financial Statements
For The Year Ended 31 December 2013
(a) Group
At 31 December 2013
In millions of Naira
AssetsCash and balance with central banks 603,851 255,158 348,693 Treasury and other eligible bills (Amortized cost) 586,441 586,441 - Due from other banks 256,729 256,729 - Derivative assets held for risk management 2,681 2,681 -
Loans and advances to customers ( gross) 1,276,122 1,276,122 -
Investment securities (Amortized cost and Fair value through OCI) 303,125 303,125 - Deferred tax assets 749 - 749 Other assets ( gross) 40,875 - 40,875 Property and equipment 69,410 - 69,410 Intangible assets 1,935 - 1,935
Total assets 3,141,918 2,680,256 461,662
Liabilities
Customer deposits 2,276,755 1,089,012 1,187,743 On-lending facilities 59,528 59,528 -
Borrowings 60,150 60,150 -
Current income tax 7,017 - 7,017 Other liabilities 215,643 - 215,643 Deferred income tax liabilities 678 - 678
Total liabilities 2,619,771 1,208,690 1,411,080
Total interest repricing gap 522,147 1,471,566 (949,418)
Financial assets
Cash and balance with central banks 150,400 - - 104,758 - 255,158 Treasury bills 120,740 234,094 223,661 7,946 - 586,441 Due from other banks 256,729 - - - - 256,729 Derivative assets held for risk management 2,681 - - - - 2,681 Loans and advances to customers ( Gross) 496,418 69,133 52,286 74,612 583,673 1,276,122 Investment in securities ( Amortized
cost and fair value through OCI) - 39,384 151 70,755 192,835 303,125
Total assets 1,026,968 342,611 276,098 258,071 776,508 2,680,256
Financial liabilities
Customer deposits 977,400 94,192 5,282 12,138 - 1,089,012
On- lending facilities 1,309 31,804 2,000 1,560 22,855 59,528 Borrowing - - - - 60,150 60,150
Total liabilities 978,709 125,996 7,282 13,698 83,005 1,208,690
Total interest repricing gap 48,259 216,615 268,816 244,373 693,503 1,471,566
Up to 1 1 - 3 3 - 6 months 6 - 12 Over 1 year Total rate
3.3.4 Interest Rate Risk
The Group is exposed to a considerable level of interest rate risk-especially on the banking book (i.e. the risk that the future cash flows of a
financial instrument will fluctuate because of changes in market interest rates). Interest rate was quite volatile within the year in various
geographies where the bank operated. The increase in the Cash Reserve Ratio (CRR) on government deposits to 50% (from 12%) by the
Central Bank of Nigeria (CBN) resulted in huge jump in the market rates for sometimes before the market normalised.These changes could
have a negative impact on the Net Interest Income, if not properly managed. The Group however, has a significant portion of its liabilities in non-
rate sensitive liabilities. This greatly assists it in managing its exposure to interest rate risks. The Group also enjoys some form of flexibility in
adjusting both lending and deposits rates to reflect current realities.
Sensitivities analysis are carried out from time to time to evaluate the impact of rate changes on the net interest income( ranging from 1basis
point to 500 basis points). The assessed impacts on capital or earnings of the Group are within tolerance level.
The table below summarizes the Group's interest rate gap position:
Carrying
amount
Rate
sensitive
Non rate
sensitive
Consolidated and Separate Financial Statements 31 December, 2013
Page 55

Zenith Bank Plc
Notes To The Consolidated And Separate Financial Statements
For The Year Ended 31 December 2013
Group
In millions of Naira
At 31 December 2012
AssetsCash and balance with central banks 332,515 152,379 180,136 Treasury and other eligible bills (Amortized cost) 669,164 669,164 - Due from other banks 182,020 182,020 - Loans and advances to customers ( gross) 1,014,526 1,014,526 - Investment securities (Amortized cost and Fair value through OCI) 299,343 299,343 - Deferred tax assets 432 - 432 Other assets ( gross) 33,302 - 33,302 Property and equipment 68,782 - 68,782 Intangible assets 1,406 - 1,406 Total assets 2,601,490 2,317,432 284,058
LiabilitiesCustomer deposits 1,929,244 1,119,051 810,193 On-lending facilities 56,066 56,066 - Borrowings 15,138 15,138 - Current income tax 6,577 - 6,577 Other liabilities 117,355 - 117,355 Deferred income tax liabilities 5,584 - 5,584 Total liabilities 2,129,964 1,190,255 939,709 Total interest repricing gap 471,526 1,127,177 (655,651)
At 31 December 2012
Financial assetsCash and balance with central banks 129,969 - - 22,410 - 152,379
118,642 161,776 357,465 30,586 695 669,164 Due from other banks 179,920 - 2,100 - - 182,020 Loans and advances to customers ( gross) 409,039 95,370 31,099 64,611 414,407 1,014,526
18,400 50,545 1,958 45,283 183,157 299,343
Total assets 855,970 307,691 392,622 162,890 598,259 2,317,432
Financial liabilitiesCustomer deposits 952,766 110,548 34,596 4,944 16,198 1,119,051 On-lending facilities 1,142 - 270 - 54,654 56,066 Borrowings 318 - - 697 14,123 15,138
Total liabilities 954,226 110,548 34,866 5,641 84,975 1,190,255
Total interest repricing gap (98,256) 197,143 357,756 157,249 513,284 1,127,177
2013 2012
7,122 5,991
Treasury and other eligible bills (Amortized
cost)
Investment Securities (Amortized cost and Fair
value through OCI)
The management of interest risk against interest rate gap limits is supplemented by monitoring the sensitivity of the Group’s financial assets
and liabilities to various scenarios. Interest rate movement affects reported income by causing an increase or decrease in net interest income
and fair value changes.
The table below shows the impact on the Group’s profit before tax if interest rates on financial instruments held at amortized cost or at fair value
had increased or decreased by 100 basis points, with all other variables held constant.
Effect of 100 basis points movement on profit before tax
Carrying
amount
Rate
sensitive
Non rate
sensitive
Up to 1
month
1 - 3
months 3 - 6 months
6 - 12
months Over 1 year
Total rate
sensitive
Consolidated and Separate Financial Statements 31 December, 2013
Page 56
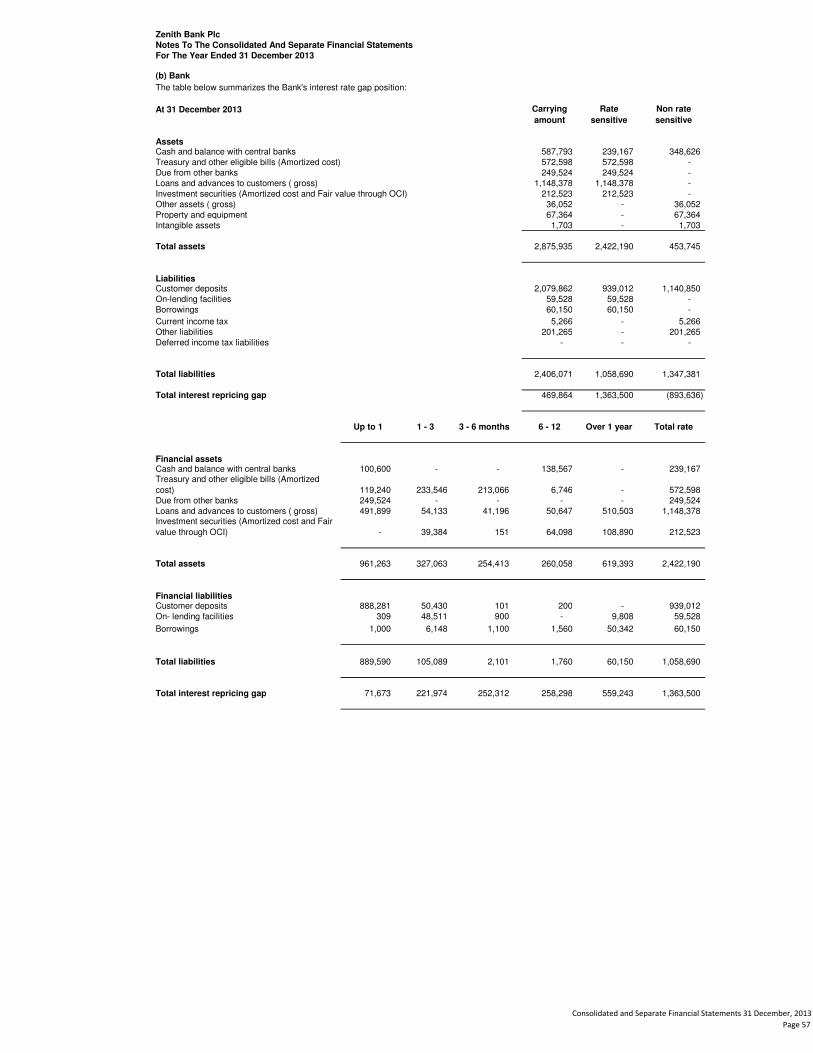
Zenith Bank Plc
Notes To The Consolidated And Separate Financial Statements
For The Year Ended 31 December 2013
(b) Bank
At 31 December 2013
AssetsCash and balance with central banks 587,793 239,167 348,626 Treasury and other eligible bills (Amortized cost) 572,598 572,598 - Due from other banks 249,524 249,524 - Loans and advances to customers ( gross) 1,148,378 1,148,378 - Investment securities (Amortized cost and Fair value through OCI) 212,523 212,523 - Other assets ( gross) 36,052 - 36,052 Property and equipment 67,364 - 67,364 Intangible assets 1,703 - 1,703
Total assets 2,875,935 2,422,190 453,745
LiabilitiesCustomer deposits 2,079,862 939,012 1,140,850 On-lending facilities 59,528 59,528 - Borrowings 60,150 60,150 -
Current income tax 5,266 - 5,266 Other liabilities 201,265 - 201,265 Deferred income tax liabilities - - -
Total liabilities 2,406,071 1,058,690 1,347,381
Total interest repricing gap 469,864 1,363,500 (893,636)
Financial assetsCash and balance with central banks 100,600 - - 138,567 - 239,167
119,240 233,546 213,066 6,746 - 572,598 Due from other banks 249,524 - - - - 249,524 Loans and advances to customers ( gross) 491,899 54,133 41,196 50,647 510,503 1,148,378
- 39,384 151 64,098 108,890 212,523
Total assets 961,263 327,063 254,413 260,058 619,393 2,422,190
Financial liabilitiesCustomer deposits 888,281 50,430 101 200 - 939,012 On- lending facilities 309 48,511 900 - 9,808 59,528
Borrowings 1,000 6,148 1,100 1,560 50,342 60,150
Total liabilities 889,590 105,089 2,101 1,760 60,150 1,058,690
Total interest repricing gap 71,673 221,974 252,312 258,298 559,243 1,363,500
Treasury and other eligible bills (Amortized
cost)
Investment securities (Amortized cost and Fair
value through OCI)
Carrying
amount
Rate
sensitive
Non rate
sensitive
Up to 1 1 - 3 3 - 6 months 6 - 12 Over 1 year Total rate
The table below summarizes the Bank's interest rate gap position:
Consolidated and Separate Financial Statements 31 December, 2013
Page 57

Zenith Bank Plc
Notes To The Consolidated And Separate Financial Statements
For The Year Ended 31 December 2013
In millions of Naira
At 31 December 2012
AssetsCash and balance with central banks 313,546 133,929 179,617 Treasury and other eligeble bills (Amortized cost) 647,474 647,474 - Due from other banks 203,791 203,791 - Loans and advances to customers ( gross) 916,791 916,791 - Investment securities ( Amortized cost and fair value through OCI) 256,905 256,905 - Other assets ( gross) 21,451 - 21,451 Property and equipment 66,651 - 66,651 Intangible assets 1,175 - 1,175
Total assets 2,427,784 2,158,890 268,894
LiabilitiesCustomer deposits 1,802,008 1,011,815 790,193 On- lending facilities 56,066 56,066 - Borrowings 15,138 15,138 - Current incom tax 5,071 - 5,071 Other liabilities 115,027 - 115,027 Deferred income tax liabilities 5,573 5,573
Total liabilities 1,998,883 1,083,019 915,864
Total interest repricing gap 428,901 1,075,871 (646,970)
At 31 December 2012
Financial assets
Cash and Balance with central banks 83,799 - - 50,130 - 133,929
114,560 161,120 344,144 27,650 - 647,474 Due from other banks 201,691 - 2,100 - - 203,791 Loans and advances to customers ( gross) 425,171 55,817 17,536 48,746 369,521 916,791
18,400 49,546 1,000 36,929 141,625 256,905
Total assets 843,621 266,484 364,780 163,455 511,146 2,158,890
Financial liabilitiesCustomer deposits 967,296 42,787 334 1,399 - 1,011,816 On-lending facilities 1,142 - 270 - 54,654 56,066 Borrowings 318 - - 697 14,123 15,138
Total liabilities 968,756 42,787 604 2,096 68,777 1,083,020
Total interest repricing gap (125,135) 223,696 364,177 161,359 442,369 1,075,870
2013 2012
6,960 6,750
The effect of 100 basis points movement on profit is considered moderate and we do not expect all the rates to move at the same time and in
the same direction. This risk can largely be handled by the flexibility in the changing/adjustment rates on loans and deposits.
Total rate
sensitive
Treasury and other eligible bills (Amortized
cost)
Investment securities (Amortized cost and Fair
value through OCI)
The management of interest risk against interest rate gap limits is supplemented by monitoring the sensitivity of the Group’s financial assets
and liabilities to various scenarios. Interest rate movement affects reported income by causing an increase or decrease in net interest income
and fair value changes.
The table below shows the impact on the Bank’s profit before tax if interest rates on financial instruments held at amortized cost or at fair value
had increased or decreased by 100 basis points, with all other variables held constant.
Effect of 100 basis points movement on profit before tax
Carrying
amount
Rate
sensitive
Non rate
sensitive
Up to 1
month
1 - 3
months 3 - 6 months
6 - 12
months Over 1 year
Consolidated and Separate Financial Statements 31 December, 2013
Page 58

Zenith Bank Plc
Notes To The Consolidated And Separate Financial Statements
For The Year Ended 31 December 2013
(a) Group
In millions of Naira
Financial assets
Cash and balances with central banks 603,851 603,851 332,515 332,515
Due from other banks 256,729 254,316 182,020 182,020
Treasury bills (Amortized cost) 586,441 580,929 669,164 648,284
Debt securities (Amortized cost) 290,191 279,926 289,938 247,897
Loans and advances to customers ( gross) 1,276,122 1,264,127 1,014,526 863,063
Other assets ( gross) 40,875 40,491 33,302 32,554
Financial liabilities
Deposits from customers 2,276,755 2,276,755 1,929,244 1,805,411
Other liabilities 215,643 213,616 117,355 111,614
Borrowings 60,150 60,002 15,138 10,483
On-lending facilities 59,528 59,382 56,066 38,826
(b) Bank
Financial assets
Cash and balances with central banks 587,793 587,793 313,546 313,546
Due from other banks 249,524 247,179 203,791 203,791
Treasury bills (Amortized cost) 572,598 557,331 647,474 648,284
Debt securities (Amortized cost) 201,280 194,160 247,500 176,341
Loans and advances to customers ( gross) 1,148,378 1,137,583 916,791 808,085
Other assets ( gross) 36,052 35,713 21,451 20,969
Financial liabilities
Deposits from customers 2,079,862 2,079,862 1,802,008 1,749,373
Other liabilities 201,265 199,373 115,027 108,130
On-lending facilities 59,528 37,965 15,138 10,483
Borrowings 60,150 60,002 56,066 38,827
Financial instruments measured at amortised cost
At 31 December 2013 At 31 December 2012
Carrying
value Fair value
Carrying
value Fair value
Financial instruments measured at amortised cost
At 31 December 2013 At 31 December 2012Carrying
value Fair value
Carrying
value Fair value
3.3.5 Equity and commodity price risk
The Group is exposed to equity price risk by holding investments quoted on the Nigerian Stock Exchange (NSE) and other non-quoted
investments. Equity securities quoted on the NSE are exposed to movement based on the general movement of the all share index and
movement in prices of specific securities held by the Group.
Unquoted equity security held by the Group is a 5% equity holding in African Finance Corporation (AFC) valued at N 9.95 billion (cost 6.4
billion) as at 31 December 2013. The AFC is a private sector-led investment bank and development finance institution which has the Central
Bank of Nigeria (CBN) as the single major shareholder (42.5%) with other African financial institutions and investors holding the remaining
shares. The AFC operates a US Dollar denominated balance sheet and provides financing in this currency.
The Group does not deal in commodities and is therefore not exposed to any commodity price risk.
3.3.6 Fair value of financial assets and liabilities
Consolidated and Separate Financial Statements 31 December, 2013
Page 59

Zenith Bank Plc
Notes To The Consolidated And Separate Financial Statements
For The Year Ended 31 December 2013
At 31 December 2013
Level 1 Level 2 Level 3
In millions of Naira
Financial assetsDerivative assets held for risk management - 2,681 -
Bonds (FVTPL) 2,280 - -
Investment securities (quoted) - - -
Investment securities (unquoted) - - 10,654
2,280 2,681 10,654
Reconciliation of Level 3 items
At 31 December 2012 9,405 - 549 700
-
-
Settlements -
At 31 December 2013 10,654
At 31 December 2012 Level 1 Level 2 Level 3
Financial assets
Treasury bills (FVTPL) - - -
Bonds (FVTPL) - - -
Investment securities (quoted) - - -
Investment securities (unquoted) - - 9,405
- - 9,405
Reconciliation of Level 3 itemsAt 31 December 2011 9,390
15
Settlements
At 31 December 2012 9,405
Sensitivity analysis of Level 3 items
Financial assets
Unqouted investment securities 525 (525) 333 (333)
The sensitivity analysis was determined based on 5% increase or decrease in profit of the investee company under normal operating conditions
with all other variables held constant.
At 31 December 2013 At 31 December 2012
Favourable
changes
Un-
favourable
changes
Favourable
changes
Un-
favourable
changes
Issues
Gains/(losses) recognised through profit or lossGains/(losses) recognised through other comprehensive incomePurchasesSales
Issues
This hierarchy requires the use of observable market data when available. The Group considers relevant and observable market prices in its
valuations where possible.
Gains/(losses) recognised through profit or lossGains/(losses) recognised through other comprehensive incomePurchases
Sales
(b) Financial instruments measured at fair value
IFRS 7 specifies a hierarchy of valuation techniques based on whether the inputs to those valuation techniques are observable or unobservable.
Observable inputs reflect market data obtained from independent sources; unobservable inputs reflect the Group's market assumptions. These
two types of inputs have created the following fair value hierarchy:
1 Level 1: Quoted prices (unadjusted) in active markets for identical assets or liabilities.2 Level 2: Inputs other than quoted prices included within Level 1 that are observable for the asset or liability, either directly (i.e. as prices) or prices) or indirectly (i.e. derived from prices).3 Level 3: Inputs for the asset or liability that are not based on observable market data (unobservable inputs).
Consolidated and Separate Financial Statements 31 December, 2013
Page 60

Zenith Bank Plc
Notes To The Consolidated And Separate Financial Statements
For The Year Ended 31 December 2013
(iv) Loans and advances to customers
(vi) Customer deposits and borrowings
The estimated fair value of deposits with no stated maturity, which includes non-interest-bearing deposits, is the amount repayable on demand.
The estimated fair values of fixed interest-bearing deposits and borrowings are determined using a discounted cash flow model based on a
current yield curve appropriate for the remaining term to maturity.
(iii) Treasury bills and investment securities
Treasury bills represent short term instruments issued by the Central banks of the jurisdiction where the Group has operations. The fair value of
treasury bills and bonds at fair value through profit or loss are determined with reference to quoted prices (unadjusted) in active markets for
identical assets. The estimated fair value of treasury bills and bonds at amortized cost represents the discounted amount of estimated future
cash flows expected to be received. Expected cash flows are discounted at current market rates to determine fair value.
The fair values of quoted equity securities are determined by reference to quoted prices (unadjusted) in active markets for identical instruments.
The fair value of the unquoted equity holding in AFC is determined on the basis of the discounted cashflow methodology which takes into
account the discounted stream of future income and free cashflows of the investement. Subsequently,the percantage holding of the Bank is then
applied on the derived company value.
Loans and advances are carried at amortized cost net of provision for impairment. The estimated fair value of loans and advances represents
the discounted amount of estimated future cash flows expected to be received. Expected cash flows are discounted at current market rates to
determine fair value.
(v) Other assets Other assets represent monetary assets which usually has a short recycle period and as such the fair values of these balances approximate
their carrying amount.
(c) Fair valuation methods and assumptions
(i) Cash and balances with central banks Cash and balances with Central banks represent cash held (including mandatory cash reserve requirements of 2012: N180.1 billion, 2011:
N106.7 billion) with Central banks of the various jurisdictions in which the Group operates. The fair value of these balances is their carrying
amounts.
(ii) Due from other banks
Due from other banks represents balances with local and correspondence banks, inter-bank placements and items in the course of collection.
The fair value of the current account balances, floating placements and overnight deposits are their carrying amounts.
Consolidated and Separate Financial Statements 31 December, 2013
Page 61
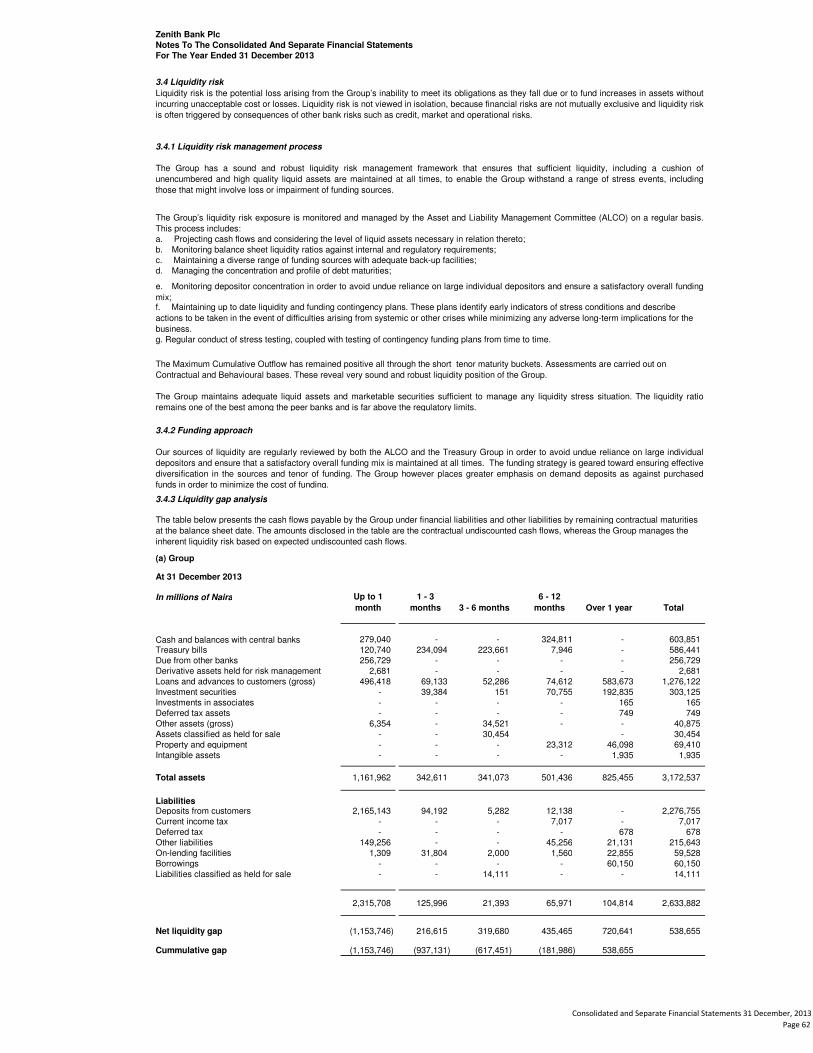
Zenith Bank Plc
Notes To The Consolidated And Separate Financial Statements
For The Year Ended 31 December 2013
3.4 Liquidity risk
3.4.1 Liquidity risk management process
3.4.2 Funding approach
3.4.3 Liquidity gap analysis
(a) Group
At 31 December 2013
In millions of Naira
Cash and balances with central banks 279,040 - - 324,811 - 603,851 Treasury bills 120,740 234,094 223,661 7,946 - 586,441 Due from other banks 256,729 - - - - 256,729 Derivative assets held for risk management 2,681 - - - - 2,681 Loans and advances to customers (gross) 496,418 69,133 52,286 74,612 583,673 1,276,122 Investment securities - 39,384 151 70,755 192,835 303,125 Investments in associates - - - - 165 165 Deferred tax assets - - - - 749 749 Other assets (gross) 6,354 - 34,521 - - 40,875 Assets classified as held for sale - - 30,454 - 30,454 Property and equipment - - - 23,312 46,098 69,410 Intangible assets - - - - 1,935 1,935
Total assets 1,161,962 342,611 341,073 501,436 825,455 3,172,537
LiabilitiesDeposits from customers 2,165,143 94,192 5,282 12,138 - 2,276,755 Current income tax - - - 7,017 - 7,017 Deferred tax - - - - 678 678 Other liabilities 149,256 - - 45,256 21,131 215,643 On-lending facilities 1,309 31,804 2,000 1,560 22,855 59,528 Borrowings - - - - 60,150 60,150 Liabilities classified as held for sale - - 14,111 - - 14,111
2,315,708 125,996 21,393 65,971 104,814 2,633,882
Net liquidity gap (1,153,746) 216,615 319,680 435,465 720,641 538,655
Cummulative gap (1,153,746) (937,131) (617,451) (181,986) 538,655
The Maximum Cumulative Outflow has remained positive all through the short tenor maturity buckets. Assessments are carried out on
Contractual and Behavioural bases. These reveal very sound and robust liquidity position of the Group.
The Group maintains adequate liquid assets and marketable securities sufficient to manage any liquidity stress situation. The liquidity ratio
remains one of the best among the peer banks and is far above the regulatory limits.
Our sources of liquidity are regularly reviewed by both the ALCO and the Treasury Group in order to avoid undue reliance on large individual
depositors and ensure that a satisfactory overall funding mix is maintained at all times. The funding strategy is geared toward ensuring effective
diversification in the sources and tenor of funding. The Group however places greater emphasis on demand deposits as against purchased
funds in order to minimize the cost of funding.
The table below presents the cash flows payable by the Group under financial liabilities and other liabilities by remaining contractual maturities
at the balance sheet date. The amounts disclosed in the table are the contractual undiscounted cash flows, whereas the Group manages the
inherent liquidity risk based on expected undiscounted cash flows.
Up to 1
month
1 - 3
months 3 - 6 months
6 - 12
months Over 1 year Total
b. Monitoring balance sheet liquidity ratios against internal and regulatory requirements;c. Maintaining a diverse range of funding sources with adequate back-up facilities;d. Managing the concentration and profile of debt maturities;
e. Monitoring depositor concentration in order to avoid undue reliance on large individual depositors and ensure a satisfactory overall funding
mix;f. Maintaining up to date liquidity and funding contingency plans. These plans identify early indicators of stress conditions and describe
actions to be taken in the event of difficulties arising from systemic or other crises while minimizing any adverse long-term implications for the
business.g. Regular conduct of stress testing, coupled with testing of contingency funding plans from time to time.
Liquidity risk is the potential loss arising from the Group’s inability to meet its obligations as they fall due or to fund increases in assets without
incurring unacceptable cost or losses. Liquidity risk is not viewed in isolation, because financial risks are not mutually exclusive and liquidity risk
is often triggered by consequences of other bank risks such as credit, market and operational risks.
The Group has a sound and robust liquidity risk management framework that ensures that sufficient liquidity, including a cushion of
unencumbered and high quality liquid assets are maintained at all times, to enable the Group withstand a range of stress events, including
those that might involve loss or impairment of funding sources.
The Group’s liquidity risk exposure is monitored and managed by the Asset and Liability Management Committee (ALCO) on a regular basis.
This process includes:a. Projecting cash flows and considering the level of liquid assets necessary in relation thereto;
Consolidated and Separate Financial Statements 31 December, 2013
Page 62

Zenith Bank Plc
Notes To The Consolidated And Separate Financial Statements
For The Year Ended 31 December 2013
At 31 December 2012In millions of Naira
Assets
Cash and balances with central banks 129,969 - - 202,546 - 332,515 Treasury bills 118,642 161,776 357,465 30,586 695 669,164
Due from other banks 179,920 - 2,100 - - 182,020 Loans and advances to customers (gross) 409,039 95,370 31,099 64,611 414,407 1,014,526
Investment securities 18,400 50,545 1,958 45,283 183,157 299,343
Investments in associates - - - - 420 420 Deferred tax assets - - - - 432 432 Other assets (gross) 15,394 10,106 14 7,773 15 33,302 Assets classified as held for sale - - 31,943 - - 31,943 Investment property - - - - - - Property and equipment - - - 18,093 50,689 68,782 Intangible assets - - - - 1,406 1,406
Total assets 871,364 317,797 424,579 368,892 651,221 2,633,853
LiabilitiesDeposits from customers 1,762,958 110,548 34,596 4,944 16,198 1,929,244 Current income tax - - - 6,577 - 6,577 Deferred tax - - - - 5,584 5,584
Other liabilities 56,518 21 - 37,460 23,356 117,355
On-lending facilities 11,088 13,276 - 1,787 29,915 56,066 Borrowings 2,994 3,584 - 483 8,077 15,138 Liabilities classified as held for sale - - 11,584 - - 11,584
1,833,558 127,429 46,180 51,251 83,130 2,141,548
Net liquidity gap (962,194) 190,368 378,399 317,641 568,091 492,305
Cummulative gap (962,194) (771,826) (369,691) (75,786) 492,305
Up to 1 1 - 3 3 - 6 months 6 - 12 Over 1 year Total
Consolidated and Separate Financial Statements 31 December, 2013
Page 63

Zenith Bank Plc
Notes To The Consolidated And Separate Financial Statements
For The Year Ended 31 December 2013
(a) Bank
At 31 December 2013
In millions of Naira
Cash and balances with central banks 263,693 - - 324,100 - 587,793 Treasury bills 119,240 233,546 213,066 6,746 - 572,598 Due from other banks 249,524 - - - - 249,524 Loans and advances to customers (gross) 491,899 54,133 41,196 50,647 510,503 1,148,378 Investment securities - 39,384 151 64,098 108,890 212,523 Investment in subsidiaries - - - - 24,375 24,375 Investments in associates - - - - 90 90 Other assets (gross) 10,991 - - 25,061 - 36,052 Assets classified as held for sale - - - 4,749 - 4,749 Property and equipment - - - 23,313 44,051 67,364 Intangible assets - - - - 1,703 1,703
Total assets 1,135,347 327,063 254,413 498,714 689,612 2,905,149
LiabilitiesDeposits from customers 1,985,581 84,050 211 10,020 - 2,079,862 Current income tax - - - 5,266 - 5,266 Other liabilities 152,409 30,874 17,982 201,265 On-lending facilities 1,309 31,804 2,000 1,560 22,855 59,528 Borrowings - - - - 60,150 60,150
2,139,299 115,854 2,211 47,720 100,987 2,406,071
Net liquidity gap (1,003,952) 211,209 252,202 450,994 588,625 499,078
Cummulative gap (1,003,952) (792,743) (540,541) (89,547) 499,078
At 31 December 2012
Assets
Cash and balances with central banks 133,929 - - 179,617 - 313,546 Treasury bills 114,560 161,120 344,144 27,650 - 647,474 Due from other banks 201,691 - 2,100 - - 203,791 Loans and advances to customers (gross) 425,171 55,817 17,536 48,746 369,521 916,791 Investment securities 18,400 49,546 1,000 36,929 151,030 256,905 Investment in subsidiaries - - - - 24,375 24,375 Investments in associates - - - - 463 463 Other assets (gross) 15,390 - - 6,061 - 21,451 Assets classified as held for sale - - 10,338 - - 10,338 Property and equipment - - - 17,184 49,467 66,651 Intangible assets - - - - 1,175 1,175
Total assets 909,141 266,483 375,118 316,187 596,031 2,462,960
LiabilitiesDeposits from customers 1,757,489 42,787 333 1,399 - 1,802,008 Current income tax - - - 5,071 - 5,071 Deferred tax - - - - 5,573 5,573 Other liabilities 50,417 - - 25,512 39,098 115,027 On-lending facilities 11,088 13,276 - 1,787 29,915 56,066 Borrowings 2,994 3,584 - 483 8,077 15,138 Liabilities classified as held for sale - - - - - -
1,821,988 59,647 333 34,252 82,663 1,998,883
Net liquidity gap (912,847) 206,836 374,785 281,935 513,368 464,077
Cummulative gap (912,847) (706,011) (331,226) (49,291) 464,077
Up to 1
month
1 - 3
months 3 - 6 months
6 - 12
months Over 1 year Total
Up to 1
month
1 - 3
months 3 - 6 months
6 - 12
months Over 1 year Total
Consolidated and Separate Financial Statements 31 December, 2013
Page 64

Zenith Bank Plc
Notes To The Consolidated And Separate Financial Statements
For The Year Ended 31 December 2013
3.5 Capital management
Banking subsidiaries in the Group, not incorporated in Nigeria, are directly regulated and supervised by their local banking supervisor and are
required to meet the capital requirement directive of the local regulatory jurisdiction. Parental support and guidance are given at the Group
level where the risk level in the Group in relation to capital level and adequacy is closely monitored. We support and meet all capital requests
from these regulatory jurisdictions and determine the adequacy based on our expansion strategies and internal capital assessments.
The Group’s capital plan is linked to its business expansion strategy which anticipates the need for growth and expansion in its branch network
and IT infrastructure. The capital plan sufficiently meets regulatory requirements as well as providing adequate cover for the Group’s risk profile.
The Group's capital adequacy remains strong and the capacity to generate and retain reserves continues to grow.
The Group will only seek additional capital where it finds compellling business need for it and with the expectation that the returns would
adequately match the efforts and risks undertaken.
The strategy for assessing and managing the impact of our business plans on present and future regulatory capital forms an integral part of the
Group’s strategic plan. Specifically, the Group considers how the present and future capital requirements will be managed and met against
projected capital requirements. This is based on the Group's assessment and against the supervisory/regulatory capital requirements taking
account of the Group business strategy and value creation to all its stakeholders.
The Group prides itself in maintaining very healthy capital adequacy ratio in all its areas of operations. Capital levels are determined either
based on internal assesments or regulatory requirements.
The Capital Adequacy of the Group is reviewed regularly to meet regulatory requirements and standard of international best practises in order
to adopt and implement the decisions necessary to maintain the capital at a level that ensures the realisation of the business plan with a certain
safety margin.
The Group undertakes a regular monitoring of capital adequacy and the application of regulatory capital by deploying internal systems based on
the guidelines provided by the Central Bank of Nigeria (CBN) and the regulatory authorities of the subsidiaries for supervisory purposes.
The group has consistently met and surpassed the minimum capital adequacy requirments applicable in all areas of operations.
Most of the Group's capital is Tier 1 (Core Capital) which consists of essentially share capital, and reserves created by appropriations of
retained earnings.
Consolidated and Separate Financial Statements 31 December, 2013
Page 65

Zenith Bank Plc
Notes To The Consolidated And Separate Financial Statements
For The Year Ended 31 December 2013
Group Group Bank Bank
In millions of Naira 2013 2012 2013 2012
Tier 1 capital
Share capital 15,698 15,698 15,698 15,698
Share premium 255,047 255,047 255,047 255,047 Statutory reserves 57,762 45,199 57,710 45,198
Contingency reserve 1,371 997 - - SMEIES reserve 3,729 3,729 3,729 3,729 Retained earnings 161,144 130,153 126,678 106,010
Credit risk reserve 10,697 10,243 10,243 10,243
Non- controlling interest 4,015 3,272 - -
Total qualifying Tier 1 capital 509,463 464,338 469,105 435,925
Deferred tax assets (749) (432) - -
Intangible assets (1,935) (1,406) (1,703) (1,175)
Adjusted Total qualifying Tier 1 capital 506,779 462,500 467,402 434,750
Tier 2 capital
Revaluation reserve - investment 3,499 2,285 3,517 2,078
Translation reserve (5,683) (3,667) - -
Total qualifying Tier 2 capital (2,184) (1,382) 3,517 2,078
Total regulatory capital (A) 504,595 461,118 470,919 436,828
Risk-weighted assets
On-balance sheet 1,456,562 1,166,719 1,329,965 1,079,887 Off-balance sheet 493,442 385,941 466,134 353,438
Total risk-weighted assets (B) 1,950,004 1,552,660 1,796,099 1,433,325
Risk-weighted Capital Adequacy Ratio (CAR) (A/B) 26% 30% 26% 30%
3.6 Operational risk
There was no significant operational risk incidence during the financial year across the group.
3.7 Strategic risk
Strategic risk examines the impact of design and implementation of business models and decisions, on earnings and capital as well as the
responsiveness to industry changes. This responsibility is taken quite seriously by the Board and Executive Management of the Group and
deliberate steps are taken to ensure that the right models are employed and appropriately communicated to all decision makers in the Group.
The execution, processes and constant reviews ensures that strategic objectives are achieved. This has essentially driven the Group’s sound
banking culture and performance record to date.
The group proactively identifies, assesses and manages all operational risks by aligning the people, technology and processes with best risk
management practices towards enhancing stake holder's value and sustaining industry leadership.
Operational risk objectives includes the following: • To provide clear and consistent direction in all operations of the group• To provide a standardised framework and appropriate guidelines for creating and managing all operational risk exposures• To enable the group identify and analyse events (both internal and external) that impact on its business.
The Operational Risk Unit constantly carry out reviews to identify and assess the operational risk inherent in all material products, activities,
processes and systems. It also ensures that before new products, activities, processes and systems are introduced or undertaken, the
operational risk inherent in them is identified clearly and subjected to adequate assessment procedures.
The following sources of funds are available to the group to meet its capital growth requirements:
1. Profit from Operations :The Group has consistently reported good profit which can easily be retained to support the capital base.
2. Issue of Shares: The Group can successfully access the capital market to raise desired funds for its operations and needs.
3. Bank Loans (Long Term/short Term):
The table below shows the computation of the Group's capital adequacy ratio for the year ended 31 December 2013 as well as the 2012
comparatives. During those two years, the individual entities within the Group complied with all of the externally imposed capital requirements to
which they are subject.
Operational Risk is the risk of loss resulting from inadequate and /or failed internal processes, people and systems or from external events,
including legal risk and any other risks that is deemed fit on an ongoing basis but exclude reputation & strategic risk. Operational risk exists in
all products and business activities. Operational Risk is considered as a critical risk faced by the Group.
Consolidated and Separate Financial Statements 31 December, 2013
Page 66

Zenith Bank Plc
Notes To The Consolidated And Separate Financial Statements
For The Year Ended 31 December 2013
3.8 Legal risk
3.9 Reputational risk
3.10 Taxation risk
3.11 Regulatory risk
3.12 Insurance risk
The Group manages the regulatory risk it is potentially exposed to by monitoring new regulatory rules and applicable laws, and the identification
of significant regulatory risks. The Group strives to maintain appropriate procedures, processes and policies that enable it to comply with
applicable regulation.
The Group has continued to maintain zero tolerance posture for any regulatory breaches in all its area of operations.
The strengthening of Compliance Group during the financial year has further enhanced the process of management of regulatory risk across
the Group.
Insurance risk is the risk that future risk claims and expenses will exceed the value placed on insurance liabilities. It occurs due to the
uncertainty of the timing and amount of future cash flows arising under insurance contracts. The timing is specifically influenced by future
mortality, longevity, morbidity, persistency and expenses about which assumptions are made in order to place a value on the liabilities.
Deviations from assumptions will result in actual cash flows differing from those projected in the policyholder liability calculations. As such, each
assumption represents a source of uncertainty.
The Group promotes sound business ethics among its employees.
The Group also strives to maintain quality customer services and procedures, and business operations that enable compliance with regulatory
rules and legislation in order to minimise the risk of a drop in the reputation of the Group.
The Group did not record any issue with major reputational effect in the financial year.
Taxation risk refers to the risk that new taxation laws will adversely affect the Group and/or the loss of non-compliance with tax laws.
The taxation risk is managed by monitoring applicable tax laws, maintaining operational policies that enable the Group to comply with taxation
laws and, where required, seeking the advice of tax specialists.
This risk is well managed across the group.
Legal risk is defined as the risk of loss due to defective contractual arrangements, legal liability (both criminal and civil) incurred during
operations by the inability of the organisation to enforce its rights, or by failure to address identified concerns to the appropriate authorities
where changes in the law are proposed.
The Group manages this risk by monitoring new legislation, creation of awareness of legislation amongst employees, identification of significant
legal risks as well as assessing the potential impact of these.
Legal risks management in the Group is also being enhanced by appriopriate product risk review and management of contractual obligations
via well documented Service Level Agreements and other contractual documents.
The Group also has a team of well experienced professionals who handle legal issues across the Group.
It is recognised that the Group’s reputation may suffer adversely due to bad publicity, non-compliance with regulatory rules and legislation,
which may lead to a significant drop in new business and/or a significant increase in the number of lapses and/or withdrawals.
Consolidated and Separate Financial Statements 31 December, 2013
Page 67

Zenith Bank Plc
Notes To The Consolidated And Separate Financial Statements
For The Year Ended 31 December 2013
3.12.1 Mortality and morbidity risks
(a) Individual life products – Term assurance, Mortgage protection, Savings Plan
(b) Group life products
(c) Deposit administration
3.12.2 Claims experience risk
3.12.3 Persistency risk
3.12.4 Expense risk
To manage this risk, the Group performs expense investigations annually and sets pricing and valuation assumptions to be in-line with the
actual expenses experience, with allowance for inflation.
The Group’s exposure to unexpected increases in the inflation rate is expected to be minimal due to the short-term nature of their business and
their ability to review premium rates at renewals (typically on an annual basis).
In terms of the short-term insurance contracts held by the Group, the claims experience risk for these policies is that the number of claims
and/or the monetary claim amounts are worse than that assumed in the pricing basis.
The Group manages this risk by charging premiums which are appropriate to the risks under the insurance contracts.
Under the short-term insurance products, the Group also holds a concentration risk, which is the risk of a large number of claims from a single
event or in a particular geographical area. This risk is reduced by diversification over a large number of uncorrelated risks, as well as taking out
catastrophe reinsurance.
Persistency risk relates to the risk that policyholders may withdraw their benefits and terminate their contracts prior to the contractual maturity
date of the contract. Expenses such as commission and acquisition expenses are largely incurred at the outset of the contract. These upfront
costs are expected to be recouped over the term of a contract from fees and charges from the contract. Therefore, if the contract is terminated
before the contractual date, expenses might not have been fully recovered, resulting in losses being incurred.
Where a surrender benefit is payable, the benefit amount on withdrawal normally makes provision for recouping any outstanding expenses.
However, losses may still occur if the expenses incurred in respect of the policy exceed the value of the policy, or where the withdrawal benefit
does not fully allow for the recovery of all unrecouped expenses. This may either be due to a regulatory minimum surrender benefit applying, or
because of product design.
There is a risk that the Group may experience a loss due to actual expenses being higher than those assumed when pricing and valuing
policies. This may be due to inefficiencies, higher than expected inflation, lower than expected volumes of new business or higher than
expected terminations resulting in smaller in-force policies.
taking out catastrophe reinsurance.
Employee benefit products provide life cover to members of a group, such as employees of companies or members of trade unions.
An aggregate stop-loss reinsurance agreement is in place to ensure that the Group's exposure to the aggregate mortality risk in its group life
business is managed and limited to a specified limit.
In addition, there is a catastrophe reinsurance treaty in place for both group business and individual business. Such a treaty is particularly
important for the group life business as there are considerably more concentrations of risks compared to individual business.
Deposit administration contracts provide a guaranteed life annuity conversion at the maturity of the contract. The mortality risk in this case is
that the policyholders may live longer than assumed in the pricing of the contract. This is known as the risk of longevity.
The Group manages this risk by allowing for improvements in mortality when pricing and valuing the contracts. The Group also performs more
detailed actuarial experience investigations and adjust assumptions in pricing for new contracts and valuation of existing contracts when
necessary.
area.
For contracts with fixed and guaranteed benefits (such as the minimum death benefits available on savings plan policies) and fixed future
premiums, there are no mitigating terms that reduce the risk accepted by Group. The Group therefore employs some underwriting controls to
ensure that only acceptable risks are accepted.
The following additional controls and measures are in place in order to ensure that the Group manages its exposure to mortality risk: • Claims assessment processes to ensure only valid claims are paid;• Reinsurance to limit liability on particularly large claims or substandard risks; and• Concentration risk is reduced by diversification of business over a large number of independent lives, as well as by
• Natural catastrophes such as floods, and unnatural catastrophes such as acts of terrorism;• The impact of HIV/AIDS or other health epidemics;• Anti-selection such as where a policyholder with a pre-existing condition or disease purchases a product where a benefit will be paid on death;• The effect of selective withdrawal; and• Concentration risk, which is the risk of a large number of claims from a single event or in a particular geographical
The risk that actual experience in respect of the rates of mortality and morbidity may vary from what is assumed in pricing and valuation,
depending on the terms of different products. The material classes of business most affected by these risks are discussed below:
Products are sold directly to individuals providing a benefit on death. The main insurance risk relates to the possibility that rates of death may
be higher than expected. This may be due to:
• Normal statistical variation due to the random nature of the insured events;
Consolidated and Separate Financial Statements 31 December, 2013
Page 68

Zenith Bank Plc
Notes To The Consolidated And Separate Financial Statements
For The Year Ended 31 December 2013
3.12.5 Business volume risk
3.12.6 Capital adequacy risk
3.12.7 Asset liability matching risk
3.12.8 Assumption risk
3.12.9 Data risk
3.12.10 Model risk
• Regular actual versus expected cash flow investigations to assess the appropriateness of the external models; and• Detailed investigations are performed annually to ensure the integrity of the data used in the valuation process.
Data risk is the risk that data used in the policyholders' liabilities valuation calculations are inaccurate or incomplete and, therefore, are not a
true and accurate view of the insurance contracts held by the Group. The data could be inaccurate or incomplete due to incorrect data or
valuation extracts between the policy administration system and the actuarial valuation model and/or incorrect capturing of data on the policy
administration system.
This risk is managed by the Group through regular data integrity testing in order to assess the appropriateness, accuracy and credibility of the
various data sets as well as investigations into data exceptions reported.
Where insufficient internal data is available, the Group makes use of external sources to derive its pricing and valuation assumptions. Frequent
monitoring of these external sources is performed, including actual versus expected investigations.
There is a risk that the Group may suffer a loss if the model used to calculate the insurance liabilities does not project expected cash flows
under the insurance contracts accurately. The expected cash flow projections may be inaccurate either due to the model itself being incorrect,
inappropriate to the policies being valued or inaccurate and/or the underlying assumptions used in the model being inappropriate.
The Group makes use of an independent valuation actuary to value its liabilities. The models being used to value the liabilities are, therefore,
not internal to but belong to an external third party. The model risk underlying the use of third party models are addressed by:
Due to the short-term nature of the Group’s insurance business, most of the liability cash flows will be of short-term nature. The asset liability
matching risk lies in the risk that the cash inflows from the assets held will not match liability cash outflows in terms of timing and/or amounts.
Therefore, the risk arises that Group will be unable to meet policyholder obligations. In this case, the asset liability mismatch risk is similar to
liquidity risk described in liquidity risk.
In determining the value of insurance liabilities, assumptions need to be made regarding future rates of mortality, morbidity, termination rates,
expenses and investment performance. The uncertainty of these rates may result in actual experience being different from that assumed and
hence actual cash flows being different from those projected, and, in the extreme, that the actual claims and benefits exceed the liabilities. The
risk is mitigated to an extent through:
• The addition of margins, specifically where there is evidence of moderate or extreme variation in experience;• The use of appropriate sources of data; and• Regular actual versus expected investigations.
Due to the short-term nature of the Group’s business, exposure to unexpected changes in trends in experience is minimal since premium rates
are reviewable at renewal.
There is a risk the Group may not sell sufficient volumes of new business to meet the expenses associated with distribution and administration.
A significant portion of the new business acquisition costs are variable and relate directly to sales volumes.
There is a risk that the capital held by the Group to back its insurance liabilities may prove to be inadequate on a regulatory solvency basis.
This may then lead to intervention by the Regulator and may further lead to a fall in the reputation of the group (see Reputational risk below for
further details). At an extreme, the Regulator may require the Group to close to new business. This will have a further negative impact on the
Group.
This risk is monitored and assessed by performing annual valuations on the life insurance liabilities performed by an independent valuation
actuary, calculating the outstanding claims reported (OCR) and Incurred But Not Reported (IBNR) contingency reserves, monitoring any
regulatory rules applying to the assets and the adequacy of the assets to back the liabilities and adopting an investment strategy which is aimed
at investing in admissible assets and maintaining adequate capital.
In addition, sensitivity and scenario analysis are performed to assess the Group capital adequacy under various scenarios and to ensure that
the Group will remain financially sound under some stress economic conditions.
Consolidated and Separate Financial Statements 31 December, 2013
Page 69

Zenith Bank Plc
Notes To The Consolidated And Separate Financial Statements
For The Year Ended 31 December 2013
3.12.11 Insurance premium rating
(a) Individual life products – Term-assurance, Mortgage protection and Savings Plan
• Age;• Gender;• Smoker status;• Medical conditions;• Financial condition; and • Hazardous pursuits.
(b) Deposit administration
(c) Group life products
• Region;• Salary structure;• Gender structure; and • Industry.
(d) Short-term insurance products
Premium rates are guaranteed for the period up to the renewal of a policy, typically, after 1 year.
• Use of the item(s) to be insured, for example, premium rates distinguish business and personal use for vehicle cover; • Physical condition of the item(s) to be insured;• Safety and security features installed; and• Past claims experience, for example, the premium rate payable on vehicle cover reflects the past claims experience on the vehicle and driver to be insured.
Where the value of the item(s) to be insured exceeds a pre-specified limit, the underwriting becomes more stringent. This is particularly the
case for marine and aviation cover. In this case the Group makes use of specialist underwriting agents to assess the risks and set an
appropriate premium for cover.
Underwriting on group business is much less stringent than for individual business, as there is typically less scope for anti-selection. The main
reason for this is that participation in the group schemes is normally compulsory, and members have limited choice in the level of the benefits.
Group policies are priced using standard mortality tables. The price for an individual scheme is adjusted for the following risk factors:
For large schemes, a scheme’s past experience is a crucial input in setting rates for the scheme. The larger the scheme the more weight is
given to the scheme’s past experience. Rates are guaranteed for one year and reviewable at the renewal of the policy.
Underwriting on short-term insurance products takes the form of the insurance applicant completing a proposal form. The following risk factors
are used in the risk classification:
• Age and gender of the insured driver or operator;• Value of the item(s) to be covered;
The Group employs the following additional controls and measures to ensure that only acceptable risks are accepted and risks are
appropriately priced:
• Underwriting controls, with risk classification based on the above risk factors;• Regular review of premium rates; and• Appropriate policy conditions, including any exclusion on the cover on the individual's life.
Premium rates are guaranteed for the period up to the renewal of a policy, typically, after 1 year.
Premium rating on deposit administration policies distinguishes between the ages and gender of prospective policyholders. Annual premiums,
payable up front, are repriced at renewal of the deposit administration policies.
The price for an individual life product is adjusted for the following risk factors:
Consolidated and Separate Financial Statements 31 December, 2013
Page 70

Zenith Bank Plc
Notes To The Consolidated And Separate Financial Statements
For The Year Ended 31 December 2013
3.13 Sustainability Report
(c) Employee Relations
Zenith Group believes that its people are the driving force behind its success and the main competitive advantage that positions it ahead of
competition. The group is of the view that its future lies in a committed team of individuals who are convinced of their future at the organisation.
To this end, Zenith remains committed to creating a healthy, safe and fulfilling work environment that supports personal growth, encourages
individuality and instigates team spirit. The group organizes numerous training programs covering soft skills, negotiation skills to personality
development and encourages all staff to participate actively.
(d) Diversity
Zenith Group recognizes the need to promote a diverse workforce as a means to attracting top-flight talent and enhancing its competitive
advantage. It further recognizes that each employee brings to the workplace experiences and capabilities that are as unique as the individual.
The group treats all employees fairly and the group do not discriminate on the basis of gender, race, colour, nationality, religious belief or any
other distinctive attribute. Furthermore, we take steps to assure that underrepresented groups continue to have access to available
opportunities within the organisation and that they are upwardly mobile within the system at all managerial levels within the group.
(e) Financial Inclusion
Financial Inclusion is achieved when adults have easy access to a broad range of financial products designed according to their needs and
provided at affordable costs. Promoting financial inclusion is essential to building a sustainable, vibrant and robust financial system. Financial
literacy on the other hand is a state that is achieved when all economic agents or bankable public know, understand and develop the ability to
evaluate and assess financial products and services or transact in financial markets.
Zenith as a key stakeholder in the Nigerian financial services landscape supports efforts to promote financial inclusion and literacy and views
same as a responsibility it owes the un-banked public. We take steps to reduce the preponderance of adults without access to suitable financial
products and explore opportunities to promote financial literacy. Some of our initiatives in this area include the introduction of eaZymoney the
bank’s flagship mobile banking product with agency partners in remote areas of the country. The group is also establishing a public
enlightenment group to deliver financial literacy content at regular customer forums.
Zenith has established an environmental guideline, management system and governance model that integrates environmental impact
considerations into lending decisions across the group with initial focus on some significant sectors/industries. The group’s lending policies has
been redesigned to ensure that facilities are not extended to industries that engage in illegal activities, pollute the environment, have no proper
pollution control methods, are involved in manufacturing and selling arms, as well as those engaged in activities that involve harmful or
exploitative forms of forced labour or child labour.
Zenith has in place an Environmental and Social Management System (ESMS) where the Group does a social and environmental risk analysis
for borrowers and takes measures to avoid, mitigate and minimise the risks identified. The ESMS of the Bank identifies Environmental & Social
(E&S) risks in the projects/companies the bank finances and encourages mitigatory action by these groups to minimize such risks at a very
early stage of the credit evaluation.
3.13.2 Internal Principles
(a) Energy Saving Measures
Environmentally responsible practices involve identifying, assessing and seeking to reduce the direct and indirect environmental impact of our
services.
Mindful of its carbon footprint, Zenith Group has taken measures to neutralise and minimise its adverse impact on the environment. As a
service- oriented organisation, reduction of energy consumption could be identified as being the most significant contribution towards reducing
our Carbon Footprint. The group has taken several measures to minimise energy consumption. Consequent to carrying out a comprehensive
Energy Audit, improvements have been implemented in the areas of lighting and energy management.
(b) Waste Reduction & Recycling
The Bank continually promotes reduced paperless culture where employees are encouraged to use electronic communications, online
approvals and other web- based applications, and to print documents only when required. Document workflows are automated, which minimizes
paper usage.
Zenith Group is committed to sustainable development and the responsible stewardship of resources. This implies developing solutions that link
economic success with social responsibility, which requires balancing short and long term goals and interests and integrating economic,
environmental and social considerations into business decisions across the board.
3.13.1 External Principles
(a) Sustainable Lending
Sustainability of the environment is central to the Zenith Group, and its wider social and environmental impact is of concern. Zenith Bank goes
beyond concerted efforts to minimise energy usage internally and dispose of waste responsibly, to also having in place lending policies that
promote sustainable lending and ensure high environmental standards.
(b) Integrating environmental impact considerations into business decisions across the group
Consolidated and Separate Financial Statements 31 December, 2013
Page 71

Zenith Bank Plc
Notes To The Consolidated And Separate Financial Statements
For The Year Ended 31 December 2013
(f) Occupational Health & Safety
The health and safety of employees, customers and other stakeholders is of paramount importance to the group. The group constantly seek to
identify and reduce the potential for accidents or injuries in all its operations. There is ongoing training of health and safety officers in line with
the group’s health and safety policy. There is also adequate communication of the health and safety policies across the group to ensure staff
are conversant with its content.
(g) Supply Chain Management
The group will continue to work in active partnership with its suppliers to help them manage their own social and environmental risks,
particularly those firms who have more significant impacts than it does and those in countries, where the regulatory framework is sometimes not
as stringent as our standards. The group is also committed to treating its suppliers with respect, especially in areas such as contract terms and
conditions and payment terms.
We continue to adopt a risk-based approach to managing our supply chain’s sustainability impacts. We conduct an initial risk assessment of all
new suppliers which allows us to determine whether the supplier, or its products and services, present a high level of risk in commercial, social,
environmental or ethical terms. All suppliers assessed to be ‘high risk’ have specific requirements to address these risks included in their
contracts with Zenith
(h) Active Engagements
In demonstrating our commitment to sustainability and greater market transparency, Zenith actively contributed to the development of the
Nigeria Sustainability Banking Principles, which aims to introduce good practice for banks to consider and mitigate the environmental and social
risks associated with their business operation; and deliver positive impacts to the society, while protecting the communities and environments in
which the they operate.
The Group also worked with a number of banks, organisations and multilateral institutions to help raise awareness of environmental and social
issues and contribute to the wider public debate. For example, from 2012, the bank has been working with International Finance Corporation
(IFC), The Bankers Committee, United Nations Environment Programme Finance Initiative (UNEP FI) on sustainability to develop cross-industry
capacity.
The group is a member of UNEP FI and continues to foster other partnership arrangements.
Consolidated and Separate Financial Statements 31 December, 2013
Page 72

Zenith Bank Plc
Notes to the Consolidated and Separate Financial Statements
For The Year Ended 31 December 2013
4. Critical accounting estimates and judgements
4.1 Impairment losses on loans and advances
4.2 Determining fair values
4.3 Income taxes
The Group is subject to income taxes in numerous jurisdictions. Significant estimates are required in determining the
groupwide provision for income taxes. There are many transactions and calculations for which the ultimate tax
determination is uncertain during the ordinary course of business. The Group recognises liabilities for anticipated tax
audit issues based on estimates of whether additional taxes will be due. Where the final tax outcome of these matters
is different from the amounts that were initially recorded, such differences will impact the income tax and deferred tax
provisions in the period in which such determination is made.
The Group makes estimates and assumptions that affect the reported amounts of assets and liabilities within the next
financial year. Estimates and judgements are continually evaluated and are based on historical experience and other
factors, including expectations of future events that are believed to be reasonable under the circumstances.
The Group reviews its loan portfolios to assess impairment at least on a quarterly basis. In determining whether an
impairment loss should be recognised, the Group makes judgements as to whether there is any observable data
indicating that there is a measurable decrease in the estimated future cash flows from a portfolio of loans before the
decrease can be identified with an individual loan in that portfolio. This evidence may include observable data
indicating that there has been an adverse change in the payment status of borrowers in a group, or national or local
economic conditions that correlate with defaults on assets in the group. Management uses estimates based on
historical loss experience for assets with credit risk characteristics and objective evidence of impairment similar to
those in the portfolio when scheduling its future cash flows. The methodology and assumptions used for estimating
both the amount and timing of future cash flows are reviewed regularly to reduce any differences between loss
estimates and actual loss experience.
The specific component of total allowance for impairment applies to credits evaluated individually for impairment and is
based upon management’s best estimate of the present value of the cash flows that are expected to be received. In
estimating these cash flows, management makes judgment about a customer’s financial situation and the net
realizable value of any underlying collateral. Each impaired asset is assessed on its merits, and the workout strategy
and estimates of cash flows considered recoverable are independently reviewed and approved.
Collectively assessed impairment allowances cover credit losses inherent in portfolios with similar economic
characteristics when there is objective evidence to suggest that they contain impaired claims, but the individual
impaired items cannot be identified. In assessing the need for collective loan assessment, management considers
factors such as credit quality, portfolio size, concentrations, and economic factors. In estimating the required
allowance, assumptions are made to define how inherent losses are modelled and to determine the required input
parameter, based on historical experience and current economic conditions. The accuracy of allowance depends on
how well future cash flows and the model assumptions and parameters are estimated.
The determination of fair value for financial assets and liabilities for which there is no observable market prices
requires the use valuation techniques as described in note 3.3.6(c). For financial instruments that trade infrequently
and have little price transparency, fair value is less objective, and requires varying degrees of judgment depending on
liquidity, concentration, uncertainty of market factors, pricing assumptions and other risks affecting the specific
instrument.
The Group measures fair values using the following fair value hierarchy that reflects the significance of the inputs used
in making the measurements.
i) Level 1 : Quoted market price(unadjusted) in an active market for an identical instrument.
ii) Level 2 : Valuation techniques based on observable inputs, either directly - i.e , as prices - or indirectly - i.e derived
from prices. This category includes instruments valued using : quoted market prices in active markets for similar
instruments ; quoted prices for identical or similar instruments in markets that are considered less than active; or other
valuation techniques where all significant inputs are directly or indirectly observable from market data
iii) Level 3 : Valuation techniques using significant unobservable inputs. This category includes all instruments where
the valuation technique includes inputs not based on observable data and the unobservable inputs have a significant
effect on the instrument's valuation. This category includes instrument that are valued based on quoted prices for
similar instruments where significant unobservable adjustments or assumptions are requried to reflect differences
between the instruments.
Consolidated and Separate Financial Statements 31 December, 2013
Page 73

Zenith Bank Plc
Notes to the Consolidated and Separate Financial Statements
For The Year Ended 31 December 2013
4.4 Determining the value of liabilities under insurance contracts
4.4.1 Mortality
4.4.2 Expenses
(a) Group life, term-assurance and mortgage protection products
(b) Deposit administration, Savings plan
(c) Non-life insurance
4.4.3 Prudential Adjustments
(b) The non-distributable reserve should be classified under Tier 1 as part of the core capital.
N'million N'million
Provision for loan losses per prudential guidelinesLoans and advances 30,415
Other financial assets 6,837
37,252 Impairment assessment under IFRSLoans and advances
Specific allowance for impairment 20(b) 5,600 Collective allowance for impairment 20(b) 16,219
21,819 Other financial assets
Specific allowance for impairment on associated companies 23 1,222 Specific allowance for impairment on other assets 25 4,637
(27,678)
Required credit reserve as at year end 9,574
The Group's life assurance business is very small and therefore the Group does not have sufficient credible data to set
its own mortality assumptions based on the mortality experience of its policyholders. Zenith relies on an independent
actuary to set the mortality assumptions based on standard mortality tables, with appropriate adjustments.
The Group makes an explicit allowance for expenses of 40% of the gross premiums received, consistent with past
experience.
No explicit assumption has been set to the level of the expenses. It has been assumed that the interest margin
(excess of interest earned over interest paid on life funds) will be sufficient to cover future expenses that will be
incurred.
Annual expense investigations are carried out on non-life insurance policies. Further expense analyses are performed
to split expenses between different lines of business, e.g. motor vehicle, aviation and marine insurance, as well as
different functions, e.g. initial, renewal and management, termination as well as investment expenses. The expense
assumptions for non-life insurance products are then set in-line with this expense investigation, with an additional
allowance for inflation.
During the year ended 31 December 2011, the Bank transferred an amount of N10,243 million to the Credit risk
reserve. This amount represents the difference between the provisions for credit and other known losses as
determined under the prudential guideline issued by the Central Bank of Nigeria (CBN), and the impairment reserve as
determined in line with IAS 39 as at the year then ended.
In line with the same directive of the CBN, the Bank has maintained this credit risk reserve as at 31 December 2013,
by comparing the provision and impairment as determined under both bases. A reconciliation of this amount is
provided below:
Although the expected closing credit risk reserve balance (as per the reconciliation above) is N 9.57 billion, the credit
risk reserve was left unchanged at N10,243 million because the Bank's directors are of the opinon that it is more
prudent to maintain the credit risk reserve at the balance as at 31 December 2013.
Provisions under prudential guidelines are determined using the time based provisioning prescribed by the Revised
Central Bank of Nigeria (CBN) Prudential Guidelines. This is at variance with the incurred loss model required by IFRS
under IAS 39. As a result of the differences in the methodology/provision, there will be variances in the impairments
allowances required under the two methodologies.
Paragraph 12.4 of the revised Prudential Guidelines for Deposit Money Banks in Nigeria stipulates that Banks would
be required to make provisions for loans as prescribed in the relevant IFRS Standards when IFRS is adopted.
However, Banks would be required to comply with the following:
(a) Provisions for loans recognised in the profit and loss account should be determined based on the requirements of
IFRS. However, the IFRS provision should be compared with provisions determined under prudential guidelines and
the expected impact/changes in general reserves should be treated as follows:
• Prudential Provisions is greater than IFRS provisions; the excess provision resulting should be transferred
from the general reserve account to a "regulatory risk reserve".
• Prudential Provisions is less than IFRS provisions; IFRS determined provision is charged to the statement of
comprehensive income. The cumulative balance in the regulatory risk reserve is thereafter reversed to the general
reserve account
Consolidated and Separate Financial Statements 31 December, 2013
Page 74

Zenith Bank Plc
Notes to the Consolidated and Separate Financial Statements
For The Year Ended 31 December 2013
5. Segment analysis
(i) Corporate, Retail Banking and pension custodial services - Nigeria
(ii) Treasury and Investment Management - Nigeria
(iii) Insurance - Nigeria
(iv) Outside Nigeria Banking - Africa and Europe
(v) All other segments
Transactions between the business segments are on normal commercial terms and conditions.
These segments provide a broad range of banking services to a diverse group of corporations, financial institutions,
investment funds, governments and individuals outside Nigeria. The reportable segments covers banking operations
in other parts of Africa (Ghana, Sierra Leone and The Gambia) and Europe (the United Kingdom).
These segments provide share registration and funds trusteeship services in Nigeria. None of these individual
activities or services constitutes a separate reportable segment.
The Group's strategic divisions offer different products and services, and are managed seperately based on the
Group's management and internal reporting structure. For each of the strategic divisions, the Group's Executive
Management ( Chief Operating Decision Maker) reviews internal management reports on a monthly basis.
The Group's operations are primarily organised on the basis of its products and service offerings in Nigeria, while the
banking operations outside Nigeria are reported seperately for Africa and Europe. The following summary describes
each of the Group's reportable segments:
This segment provides a broad range of banking and pension custodial services to a diverse group of corporations,
financial institutions, investment funds, governments and individuals.
Provision of investment advisory, financial planning services and investment product offerings (primarily through
separately managed accounts such as mutual funds and private investment funds) to a diverse group of institutions
and individuals. It also includes brokerage services, financing services and securities lending services to institutional
clients, including mutual funds, pension funds and to high-net-worth individuals.
The Group’s insurance operations in Nigeria write substantially all lines of insurance other than title insurance while its
life and health insurance operations offer a broad line of individual and group life, annuity and accident and health
policies.
Consolidated and Separate Financial Statements 31 December, 2013
Page 75

Zenith Bank Plc
Notes to the Consolidated Financial Statements
For The Year Ended 31 December 2013
Corporate,
Retail Banking
and Pension
custodial
services
(Continuing
operations)
Treasury and
Investment
Banking
(Discontinued
operations)
Insurance
(Discontinued
operations)
Africa
(Continuing
operations)
Europe
(Continuing
operations)
Total
reportable
segments
(Continuing
operations)
Total
reportable
segments
(Discontinued
operations)
Total
reportable
segments
all other
segments
(Discontinued
operations) Eliminations Consolidated
In millions of Naira
31 December 2013
Revenue:Derived from external customers 314,565 292 13,767 19,124 5,502 339,191 14,059 353,250 122 - 353,372Derived from other business segments 1,193 220 1,919 - 2,976 4,169 2,139 6,308 - (8,210) (1,902)
Total revenue* 315,758 512 15,686 19,124 8,478 343,360 16,198 359,558 122 (8,210) 351,470
Share of profit of associates - - - - - - - - - 118 118 Interest expense (68,471) - - (4,838) (3,793) (77,102) - (77,102) - 6,306 (70,796)Impairment charge for credit losses (9,907) - (109) (1,160) - (11,067) (109) (11,176) - - (11,176)Operating and underwriting expenses (139,074) (75) (11,664) (6,426) (1,696) (147,196) (11,739) (158,935) (84) - (159,019)
Profit before tax 98,306 437 3,913 6,700 2,989 107,995 4,350 112,345 38 (1,786) 110,597Tax expense (11,622) (124) (529) (2,351) (648) (14,621) (653) (15,274) (5) - (15,279)
86,684 313 3,384 4,349 2,341 93,374 3,697 97,071 33 (1,786) 95,318
Capital expenditure** 11,254 - 657 835 105 12,194 657 12,851 - - 12,851
Identifiable assets 2,890,293 2,630 24,645 146,692 225,074 3,262,059 27,275 3,289,334 3,179 (149,380) 3,143,133
Identifiable liabilities 2,406,847 967 10,196 127,782 205,399 2,740,028 11,163 2,751,191 2,948 (120,257) 2,633,882
* Revenues are allocated based on the location of the operations. ** Capital expenditure consists of expenditure on intangible assets and property and equipment during the year.
Outside Nigeria
Nigeria Banking
Consolidated and Separate Financial Statements 31 December, 2013
Page 76

Zenith Bank Plc
Notes to the Consolidated Financial Statements
For The Year Ended 31 December 2012
Total
Corporate,
Retail Banking
and Pension
custodial
services
(Continuing
operations)
Treasury and
Investment
Banking
(Discontinued
operations)
Insurance
(Discontinued
operations)
Africa
(Continuing
operations)
Europe
(Continuing
operations)
Total
reportable
segments
(Continuing
operations)
Total
reportable
segments
(Discontinued
operations)
Total
reportable
segments
all other
segments
(Discontinued
operations) Eliminations Consolidated
In millions of Naira
31 December 2012
Revenue:Derived from external customers 281,301 737 7,031 13,591 3,890 298,782 7,768 306,550 532 - 307,082Derived from other business segments 1,031 686 1,690 - 1,391 2,422 2,376 4,798 197 (4,995) -
Total revenue* 282,332 1,423 8,721 13,591 5,281 301,204 10,144 311,348 729 (4,995) 307,082
Share of profit of associates - - - - - - - - - 23 23Interest expense (65,352) - - (2,341) (1,861) (69,554) - (69,554) - 4,993 (64,561)Impairment charge for credit losses (7,999) - (346) (1,100) - (9,099) (346) (9,445) - - (9,445)Operating and underwriting expenses (116,359) (1,073) (5,665) (5,564) (1,880) (123,803) (6,738) (130,541) (460) 2 (130,999)
Profit before tax 92,622 350 2,710 4,586 1,540 98,748 3,060 101,808 269 23 102,100Tax expense 828 (216) (741) (874) (416) (462) (957) (1,419) - - (1,419)
93,450 134 1,969 3,712 1,124 98,286 2,103 100,389 269 23 100,681
Capital expenditure** 11,785 7 100 644 607 13,036 107 13,143 - - 13,143
Identifiable assets 2,445,596 10,315 21,015 89,112 155,336 2,690,044 31,330 2,721,374 2,427 (119,297) 2,604,504
Identifiable liabilities 2,000,083 2,870 6,516 73,836 138,772 2,212,691 9,386 2,222,077 2,240 (82,769) 2,141,548
* Revenues are allocated based on the location of the operations. ** Capital expenditure consists of expenditure on intangible assets and property and equipment during the year.
Outside Nigeria
Nigeria Banking
Consolidated and Separate Financial Statements 31 December, 2013
Page 77
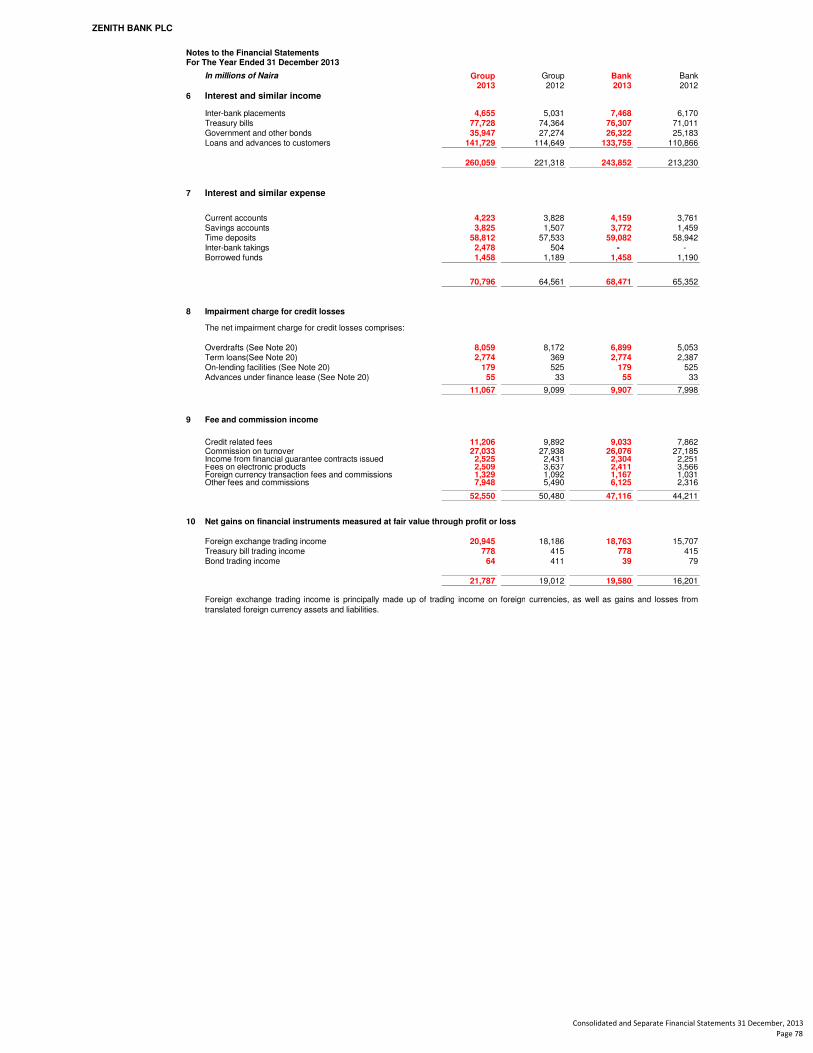
ZENITH BANK PLC
Notes to the Financial StatementsFor The Year Ended 31 December 2013
In millions of Naira Group Group Bank Bank2013 2012 2013 2012
6 Interest and similar income
Inter-bank placements 4,655 5,031 7,468 6,170Treasury bills 77,728 74,364 76,307 71,011Government and other bonds 35,947 27,274 26,322 25,183Loans and advances to customers 141,729 114,649 133,755 110,866
260,059 221,318 243,852 213,230
7 Interest and similar expense
Current accounts 4,223 3,828 4,159 3,761Savings accounts 3,825 1,507 3,772 1,459Time deposits 58,812 57,533 59,082 58,942Inter-bank takings 2,478 504 - - Borrowed funds 1,458 1,189 1,458 1,190
70,796 64,561 68,471 65,352
8 Impairment charge for credit losses
The net impairment charge for credit losses comprises:
Overdrafts (See Note 20) 8,059 8,172 6,899 5,053Term loans(See Note 20) 2,774 369 2,774 2,387On-lending facilities (See Note 20) 179 525 179 525Advances under finance lease (See Note 20) 55 33 55 33
11,067 9,099 9,907 7,998
9 Fee and commission income
Credit related fees 11,206 9,892 9,033 7,862Commission on turnover 27,033 27,938 26,076 27,185Income from financial guarantee contracts issued 2,525 2,431 2,304 2,251Fees on electronic products 2,509 3,637 2,411 3,566Foreign currency transaction fees and commissions 1,329 1,092 1,167 1,031Other fees and commissions 7,948 5,490 6,125 2,316
52,550 50,480 47,116 44,211
10 Net gains on financial instruments measured at fair value through profit or loss
Foreign exchange trading income 20,945 18,186 18,763 15,707Treasury bill trading income 778 415 778 415Bond trading income 64 411 39 79
21,787 19,012 19,580 16,201
Foreign exchange trading income is principally made up of trading income on foreign currencies, as well as gains and losses fromtranslated foreign currency assets and liabilities.
Consolidated and Separate Financial Statements 31 December, 2013
Page 78

ZENITH BANK PLC
Notes to the Financial StatementsFor The Year Ended 31 December 2013
Group Group Bank BankIn millions of Naira 2013 2012 2013 2012
11 Other income
Dividend income from equity investments 303 110 303 694Gain on disposal of property and equipment 151 10 124 9Gain on disposal of investment property - 150 - 150Gain on disposal of subsidiary - 32 - 3,811Income on cash handling 227 602 227 602Rental income 73 134 73 134
754 1,038 727 5,400
12 Operating expenses
Auditors' remuneration 420 320 329 250Directors' emoluments (Note 37(b)) 675 726 429 281Deposit insurance premium 8,279 7,588 8,279 7,588Professional fees 1,891 1,419 1,621 1,256Training and development 1,421 849 1,339 782Information technology 3,389 1,770 3,154 1,728Operating leases 2,496 2,200 1,882 1,579Advertisement 3,370 6,709 3,241 6,557Bank charges 1,166 833 1,025 783Fuel and maintenance 9,472 8,476 8,604 7,454Insurances 1,335 1,590 1,280 1,544Licenses, registrations and subscriptions 2,383 2,039 2,242 1,939Travel and hotel expenses 1,154 1,021 824 681Printing and stationery 1,148 1,268 948 1,073Security and cash handling 12,609 9,374 12,480 9,221Expenses on electronic products 2,954 1,242 2,892 1,216AMCON premum 17,553 6,507 17,553 6,507Others 4,812 1,895 3,944 1,294
76,527 55,826 72,066 51,733
13 Tax expense
(a) Minimum tax expense (see note (c)(i) below) 2,663 2,469 2,663 2,469
(b) Income tax expense
Corporate tax 4,363 2,648 - -
Excess dividend tax (see note (c)(ii) below) 11,773 - 11,773 - Information technology tax 941 940 941 940Current income tax - current period 17,077 3,588 12,714 940
(5,119) (5,595) (4,683) (5,164)
Income tax expense from continuing operations 11,958 (2,007) 8,031 (4,224)Income tax expense from discontinued operations 658 957 - - Total Income tax expense 12,616 (1,050) 8,031 (4,224)
The movement in the current income tax payable balance is as follows:
At start of the year 6,577 13,348 5,071 11,934Tax paid(continuing operations) (18,690) (12,799) (15,182) (10,272)
(610) (29) - - Minimum tax charge 2,663 2,469 2,663 2,469Income tax charge 17,077 3,588 12,714 940
At end of the year 7,017 6,577 5,266 5,071
Total tax expense 15,279 1,419 10,694 (1,755)
c(i)
c(ii)
Reversal of temporary deferred tax differences (Note 24)
Tax effect of translation
The Bank was assessed based on the minimum tax legislation for the years ended 31 December 2013 and 31 December 2012because of a tax exemption granted via Companies Income Tax (Exemption of Bonds and Short Term Government Securities) Order,2011 as contained in a gazette issued by the President of the Federal Republic of Nigeria, which took effect from 2 January 2012.
The Order exempts all interests earned on Bonds (Federal, state, local and corporate bodies including supra-nationals) and other shortterm securities such as Treasury Bills and Promissory Notes from being subjected to tax imposed under the Companies Income TaxAct. The Order is valid for a period of 10 years from the effective date of the Order, except for Bonds issued by the FederalGovernment, which will continue to enjoy the exemption.
A significant portion of the Bank’s income derives from short-term securities and government bonds, and as a result, the Bank’s currentincome tax assessment for both 2013 and 2012 financial years yielded tax credit in its favour. Consequently, the Bank applied theprovisions of the Companies Income Tax Act that mandate a minimum tax assessment, where a tax payer does not have any taxliability arising from its tax assessment.
During the year, the Bank was liable to excess dividend tax of N15.07 billion, representing 30% of N50.23 billion dividend paid as theNigerian tax laws requires companies to pay tax calculated at 30% of the higher of taxable profit and dividend paid. However, in the2012 financial statements, the Bank only accrued for tax of N2.50 billion based on minimum tax rule, as the Bank did not have taxableprofit and the dividend was not yet approved as at the reporting date. Therefore, total income tax paid in 2013 was N14.2 billion, whichwas net of tax credits amounting to N 0.828 billion. The difference between total tax paid and minimum tax accrued which amounted toN11.73 billion was charged as tax expense in 2013 financial statements.
Consolidated and Separate Financial Statements 31 December, 2013
Page 79

ZENITH BANK PLC
Notes To The Financial StatementsFor The Year Ended 31 December 2013
Group Group Bank BankIn millions of Naira 2013 2012 2013 2012
Reconciliation of effective tax rate
Profit before income tax 110,597 102,100 94,108 94,048
Tax calculated at the weighted average Group rate of 30% (2012: 30%) 33,179 30,630 28,232 28,214Effect of tax rates in foreign jurisdictions (610) (29) - - Non-deductible expenses 5,284 4,878 4,496 2,909Tax exempt income (32,262) (31,966) (32,159) (31,215)Balancing charge 41 7 41 7Tax loss effect (328) 367 (328) 367Tax effect Information technology levy (282) (282) (282) (282)Information technology tax levy 941 940 941 940Effect of deferred tax reversal (5,119) (5,595) (4,683) (5,164)Excess dividend tax paid 11,773 - 11,773 - Minimum tax 2,663 2,469 2,663 2,469
Income tax expense 15,279 1,419 10,694 (1,755)
Tax rate reconciliation % % % %Tax charge as a percentage of profit before tax 13.8 1.4 11.4 (1.9) Effect of tax rates in foreign jurisdictions 1.0 0.0 - - Non-deductible expenses (4.8) (4.8) (4.8) (3.1) Tax exempt income 29.2 31.3 34.2 33.2 Balancing charge (0.0) (0.0) (0.0) (0.0) Tax loss effect 0.3 (0.4) 0.3 (0.4) Tax effect Information technology levy 0.3 0.3 0.3 0.3 Information technology tax levy (0.9) (0.9) (1.0) (1.0) Effect of deferred tax reversal 4.6 5.5 5.0 5.5 Excess dividend tax paid (10.6) - (12.5) - Minimum tax (2.4) (2.4) (2.8) (2.6)
Standard rate of tax 30 30 30 30
14 Profit for the year from discontinued operations 2013 2012
In millions of Naira
Interest and similar income 2,349 3,066
Interest and similar expense - -
Net interest income 2,349 3,066
Impairment charge for credit losses (109) (346)
2,240 2,720
Fee and commission income 253 810
Underwriting profit 4,270 3,934
Gross premium income 10,527 9,730Reinsurances/ coinsurances (2,550) (2,964)Net premiums underwritten 7,977 6,766
Commission earned 644 434Claims recovered 2,367 1,185Claim expenses (5,208) (3,426)Acquisition costs (1,344) (1,025)Transfer to/ (from) profit and loss (166) -
Other income 180 9Operating expenses (2,555) (3,965)Profit before tax on discontinued operations 4,388 3,508
Taxation (658) (957)
Profit after tax on discontinued operations 3,730 2,551
Basic and diluted earnings per share (discontinued operations) 12 k 8 k
Net interest income after impairment charge for credit losses
In 2011, the group committed to a plan to sell all its non-banking subsidiaries with the exception of Zenith Pension Custodian Limited. This is in response to the Banking Reforms of the Central Bank of Nigeria which abolished the Universal Banking Regime in Nigeria. The subsidiaries to be disposed have been presented as discontinued operations in this financial statement. The related assets and liabilities of the discontinued operations have been classified as held for sale and are disclosed in notes 26 and 33 respectively.
Consolidated and Separate Financial Statements 31 December, 2013
Page 80

ZENITH BANK PLC
Notes To The Financial StatementsFor The Year Ended 31 December 2013
15 Earnings per share
Group Group Bank Bank2013 2012 2013 2012
94,576 100,147 83,414 95,803
91,411 98,044 83,414 95,803
31,396 31,396 31,396 31,396
31,396 31,396 31,396 31,396
301 k 319 k 266 k 305 k
291 k 312 k 266 k 305 k
16 Cash and balances with central banks
In millions of Naira
Cash 44,512 42,123 38,521 37,832
Operating accounts with Central Banks 210,646 110,256 200,646 96,097
348,693 180,136 348,626 179,617
603,851 332,515 587,793 313,546
Group Group Bank Bank2013 2012 2013 2012
17 Treasury bills In millions of Naira
Treasury bills (Amortized cost) 586,441 669,164 572,598 647,474
Classified as:Current 586,441 668,469 572,598 647,474Non-current - 695 - -
586,441 669,164 572,598 647,474
354,834 280,418 352,786 275,680
Mandatory reserve deposits with central banks represents a percentage of customers' deposits ( prescribed from time to time by thecentral bank) which are not available for daily use. For the purposes of the Statement of cashflow, this balance is excluded from cashand cash equivalents.
Included in treasury bills is N6.925 billion ( 2012: N6.92 billion) worth of treasury bills pledged as collateral to Nigeria Interbank Settlement System (NIBBS) , Federal Inland Revenue Services, V-Pay, E-Tranzact International Limited and Interswitch.
The following treasury bills have maturities less than three months and are classified as cash and cash equivalents for purposes of the statements of cash flows (Note 41).
Mandatory reserve deposits with central banks (cash reserve)
Profit attributable to shareholders of the
Bank (total operations) (N'million)
Number of shares in issue at end of the
period (millions)
Weighted average number of ordinary
shares in issue (millions)
Basic and diluted earnings per share(total operations)
Basic earnings per share (EPS) is calculated by dividing the net profit attributable to shareholders by the weighted average number ofordinary shares in issue during the year. Where a stock split or bonus share issue has occurred, the number of shares in issue in theprior year is adjusted to achieve comparability.
Profit attributable to shareholders of the
Bank (continuing operations) (N'million)
Basic and diluted earnings per share(continuing operations)
Consolidated and Separate Financial Statements 31 December, 2013
Page 81

ZENITH BANK PLC
Notes To The Financial StatementsFor The Year Ended 31 December 2013
Group Group Bank BankIn millions of Naira 2013 2012 2013 2012
18
a. Current balances with banks within Nigeria 11,384 8,358 - -
Current balances with banks outside Nigeria (see Note (b)) 109,791 84,267 152,267 144,389
Placements with banks and discount houses 135,554 89,395 97,257 59,402
256,729 182,020 249,524 203,791
Classified as:Current 256,729 182,020 249,524 203,791Non-current - - - -
256,729 182,020 249,524 203,791
b.
19 Derivative assets held for risk management
20 Loans and advances to customers
Overdrafts 351,642 270,672 321,361 252,107Term loans 858,389 672,931 761,183 594,095On-lending facilities 52,693 54,149 52,693 54,149Advances under finance lease 13,398 16,774 13,141 16,440
Gross loans and advances to customers 1,276,122 1,014,526 1,148,378 916,791
Less: Allowances for impairment (24,767) (24,712) (21,819) (21,437)
Specific allowances for impairment (7,972) (10,601) (5,600) (8,368)Collective allowance for impairment (16,795) (14,111) (16,219) (13,069)
Net loans and advances to customers 1,251,355 989,814 1,126,559 895,354
OverdraftsGross overdrafts 351,642 270,672 321,361 252,107
Less: Allowances for impairment (15,634) (17,896) (12,890) (14,777)
Specific allowances for impairment (5,867) (9,713) (3,695) (7,634)Collective allowance for impairment (9,767) (8,183) (9,195) (7,143)
Net overdrafts 336,008 252,776 308,471 237,330
Term loansGross term loans 858,389 672,931 761,184 594,095
Less: Allowances for impairment (8,280) (5,875) (8,076) (5,719)
Specific allowances for impairment (1,926) (888) (1,726) (734)Collective allowance for impairment (6,354) (4,987) (6,350) (4,985)
Net term loans 850,109 667,056 753,108 588,376
On- lending facilitiesCarrying amount 52,693 54,149 52,693 54,149
Less: Allowances for impairment (714) (857) (714) (857)
Specific allowances for impairment (179) (179)Collective allowance for impairment (535) (857) (535) (857)
Net on-lending facilities 51,979 53,292 51,979 53,292
Advances under finance leaseCarrying amount 13,398 16,774 13,141 16,440Less: Collective allowance for impairment (139) (84) (139) (84)
Net advance under finance lease 13,259 16,690 13,002 16,356
Gross Loans classified as:Current 692,449 600,119 637,875 547,270Non-current 583,673 414,407 510,503 369,521
1,276,122 1,014,526 1,148,378 916,791
Due from other banks
Included in balances with banks outside Nigeria is the amount of N64.96 billion and N64.96 billion for the Group and Bank respectively(2012: N38.45 billion and N38.44 billion respectively) which represents the Naira value of foreign currency balances held on behalf ofcustomers in respect of letters of credit. The corresponding liabilities are included in other liabilities (See Note 30). These balances arenot available for the day to day operations of the Group.
The Group used cross currency swaps to hedge its foreign currency risks arising from indebtedness in foreign currency. During the year,Zenith Bank (Ghana) Limited entered into foreign currency swaps with the Bank of Ghana to hedge foreign currency risks arising from itsindebtedness of USD 225 million to Zenith Bank (UK) Limited, at an agreed forward exhange rate of GH¢/USD 2.1725. The hedgedcash flows are expected to occur in June 2014, when the contract terminates. Upon termination in June 2014, total expected net gain inthe range of N1.7 billion (GH¢ 22 million ) and N4.3 billion (GH¢ 55 million) will be recognized in the statement of comprehensiveincome. In determining the expected net gains, spot rates ranging from GH¢/USD 2.300 to GH¢/USD 2.500 were projected.
During 2013, net gains of N2.01 billion relating to the fair value of the swap were recognised in other comprehensive income and no transfer was made between equity and profit or loss.
Consolidated and Separate Financial Statements 31 December, 2013
Page 82

ZENITH BANK PLC
Notes To The Financial Statements
For The Year Ended 31 December 2013
Reconciliation of impairment allowance on loans and advances to customers:
Group
Overdrafts Term loans
On-lending
facilities
Advances
under finance
lease TotalIn millions of Naira
Balance at 1 January 2013 17,896 5,875 857 84 24,712
Specific impairment 9,713 888 - - 10,601 Collective impairment 8,183 4,987 857 84 14,111
8,059 2,774 179 55 11,067
Specific impairment 5,136 990 179 - 6,305 Collective impairment 2,923 1,784 - 55 4,762
Write-backs 2 45 - - 47
(526) 3 - - (523) Write-offs (specific) (8,458) - - - (8,458) Write-offs (collective) * (1,339) (417) (322) - (2,078)
Balance at 31 December 2013 15,634 8,280 714 139 24,767
Specific impairment 5,867 1,926 179 - 7,972 Collective impairment 9,767 6,354 535 139 16,795
Balance at 1 January 2012 17,318 9,071 332 66 26,787
Specific impairment 8,721 3,687 - - 12,408 Collective impairment 8,597 5,384 332 66 14,379
8,172 369 525 33 9,099
Specific impairment 8,586 766 - 15 9,367 Collective impairment (414) (397) 525 18 (268)
- (664) - - (664) Write-offs (7,594) (2,901) - (15) (10,510)
Balance at 31 December 2012 17,896 5,875 857 84 24,712
Specific impairment 9,713 888 - - 10,601 Collective impairment 8,183 4,987 857 84 14,111
Foreign currency translation and other adjustments
Additional impairment charge for the year
Foreign currency translation and other adjustments
Additional impairment
charge for the year
Consolidated and Separate Financial Statements 31 December, 2013
Page 83

ZENITH BANK PLC
Notes To The Financial Statements
For The Year Ended 31 December 2013
In millions of Naira
Reconciliation of impairment allowance on loans and advances to customers:Bank
Overdrafts Term loans
On-lending
facilities
Advances
under finance
lease Total
Balance at 1 January 2013 14,777 5,719 857 84 21,437
Specific impairment 7,634 734 - - 8,368 Collective impairment 7,143 4,985 857 84 13,069
6,899 2,774 179 55 9,907
Specific impairment 3,508 992 179 - 4,679 Collective impairment 3,391 1,782 - 55 5,228
Write-offs (specific) (7,447) - - - (7,447) Write-offs (collective) * (1,339) (417) (322) - (2,078)
Balance at 31 December 2013 12,890 8,076 714 139 21,819
Specific impairment 3,695 1,726 179 - 5,600 Collective impairment 9,195 6,350 535 139 16,219
Balance at 1 January 2012 17,318 6,166 332 66 23,882
Specific impairment 8,721 1,447 - - 10,168 Collective impairment 8,597 4,719 332 66 13,714
5,053 2,387 525 33 7,998
Specific impairment 6,507 2,121 - 15 8,643 Collective impairment (1,454) 266 525 18 (645)
Amounts recovered during the year - - - - - impairment no longer required - - - - Write-offs (7,594) (2,834) - (15) (10,443)
Balance at 31 December 2012 14,777 5,719 857 84 21,437
Specific impairment 7,634 734 - - 8,368 Collective impairment 7,143 4,985 857 84 13,069
Additional impairment charge for the year
Additional impairment charge for the year
* Impaired loans that are not individually significant are included in the collective impairment. Therefore, when such loans are written off,the cummulative impairment on them are taken from the collective impairment reserve.
Consolidated and Separate Financial Statements 31 December, 2013
Page 84

ZENITH BANK PLC
Notes To The Financial StatementsFor The Year Ended 31 December 2013
Group Group Bank BankIn millions of Naira 2013 2012 2013 2012
Advances under finance lease
Gross investment 19,381 23,342 19,058 22,478
Less: Unearned income (5,983) (6,568) (5,917) (6,038)
Net Investment 13,398 16,774 13,141 16,440
The net investment is analysed as follows: No later than 1 year 2,177 281 2,062 281 Later than 1 year and no later than 5 years 11,221 16,493 11,079 16,159
13,398 16,774 13,141 16,440
The nature of security in respect of loans and advances is as follows:
Secured against real estate 177,379 164,620 152,379 140,789
Secured by shares of quoted companies 32,482 11,217 17,482 8,666
Cash collateral, lien over fixed and floating assets,e.t.c 838,422 788,155 788,422 728,208
Unsecured 227,839 50,534 190,095 39,128
1,276,122 1,014,526 1,148,378 916,791
19
Reconciliation of gross investment to minimum lease rental payments
Gross investment 19,381 23,342 19,058 22,478
Less: Unearned income (5,983) (6,568) (5,917) (6,038)
Net Investment 13,398 16,774 13,141 16,440
Impaiment on leases (139) (84) (139) (84)
Present value of minimum lease payments 13,259 16,690 13,002 16,356
21 Investment securities
(a) Analysis of investments
Debt securities (measured at amortised cost) 290,191 289,938 201,280 247,500
2,280 - 589 -
10,654 9,405 10,654 9,405
303,125 299,343 212,523 256,905
Classified as:Current 110,290 116,186 103,633 105,875Non- current 192,835 183,157 108,890 151,030
303,125 299,343 212,523 256,905
(b)
Unquoted securities 10,654 9,405 10,654 9,405
10,654 9,405 10,654 9,405
The Group has elected to present the fair value gains and losses on the above equity instruments in other comprehensive income asthese investments are not held for trading purposes but rather for strategic purposes.
Equity securities measured at fair value through
other comprehensive income
Equity securities (measured at fair value through other comprehensive income)
Debt securities (measured at fair value through profit or loss)
Consolidated and Separate Financial Statements 31 December, 2013
Page 85

ZENITH BANK PLC
Notes To The Financial StatementsFor The Year Ended 31 December 2013
In millions of Naira
Group
Debt securities at
fair value through profit
and loss
Debt securities at amortised
cost
Equity securities at fair value
through other comprehensive
income Total
At 1 January 2013 - 289,938 9,405 299,343 Exchange differences 71 (1,318) - (1,247)
Additions 172,320 109,387 700 282,407
Disposals (sale and redemption) (170,178) (112,101) - (282,279)
64 - - 64
- - 549 549 Interest accrued 166 35,947 - 36,113 Coupon received (163) (31,662) - (31,825)
At 31 December 2013 2,280 290,191 10,654 303,125
At 1 January 2012 - 298,841 9,390 308,231Exchange differences on monetary assets - (274) - (274)Additions 220,000 61,479 - 281,479Disposals (sale and redemption) (220,411) (69,000) - (289,411)
411 - - 411
- - 15 15
Interest accrued 65 27,274 - 27,339Coupon received (65) (28,382) - (28,447)
At 31 December 2012 - 289,938 9,405 299,343
The movement in investment securities may be summarised as follows:
Gains from changes in fair value recognised in profit or loss (Note10)
Gains from changes in fair value recognised in other comprehensive income
Gains from changes in fair value recognised in profit or loss (Note10)Gains from changes in fair value recognised in other comprehensive income
Consolidated and Separate Financial Statements 31 December, 2013
Page 86

ZENITH BANK PLC
Notes To The Financial StatementsFor The Year Ended 31 December 2013
In millions of Naira
Bank
Debt securities at
fair value through profit
and loss
Debt securities at amortised
cost
Equity securities at fair value
through other comprehensive
income Total
At 1 January 2013 - 247,500 9,405 256,905Exchange differences - - - - Additions 169,217 53,408 700 223,325Disposals (sale and redemption) (168,670) (99,329) - (267,999)
39 - - 39
- - 549 549 Interest accrued 166 26,322 - 26,488Coupon received (163) (26,621) - (26,784)
At 31 December 2013 589 201,280 10,654 212,523
At 1 January 2012 - 257,660 9,390 267,050Exchange differences on monetary assets - - - - Additions 220,000 33,688 - 253,688Disposals (sale and redemption) (220,079) (44,118) - (264,197)
79 - - 79
- - 15 15
Interest accrued 65 26,521 - 26,586
Coupon received (65) (26,251) - (26,316)
At 31 December 2012 - 247,500 9,405 256,905
Group Group Bank Bank22 Investment in subsidiaries Ownership interest 2013 2012 2013 2012
%
a. 99.0000% - - 1,980 1,980
98.0722% - - 6,444 6,444
100.0000% - - 13,307 13,307
99.9928% - - 1,606 1,606
99.9624% - - 1,038 1,038
- - 24,375 24,375
Zenith Bank (UK) Limited
Zenith Bank (Sierra Leone) Limited
Zenith Bank (Gambia) Limited
Zenith Pensions Custodian Limited
Zenith Bank (Ghana) Limited
The movement in investment securities may be summarised as follows:
Gains from changes in fair value recognised in profit or loss (Note10)
Gains from changes in fair value recognised in other comprehensive income
Gains from changes in fair value recognised in profit or loss (Note10)Gains from changes in fair value recognised in other comprehensive income
Consolidated and Separate Financial Statements 31 December, 2013
Page 87
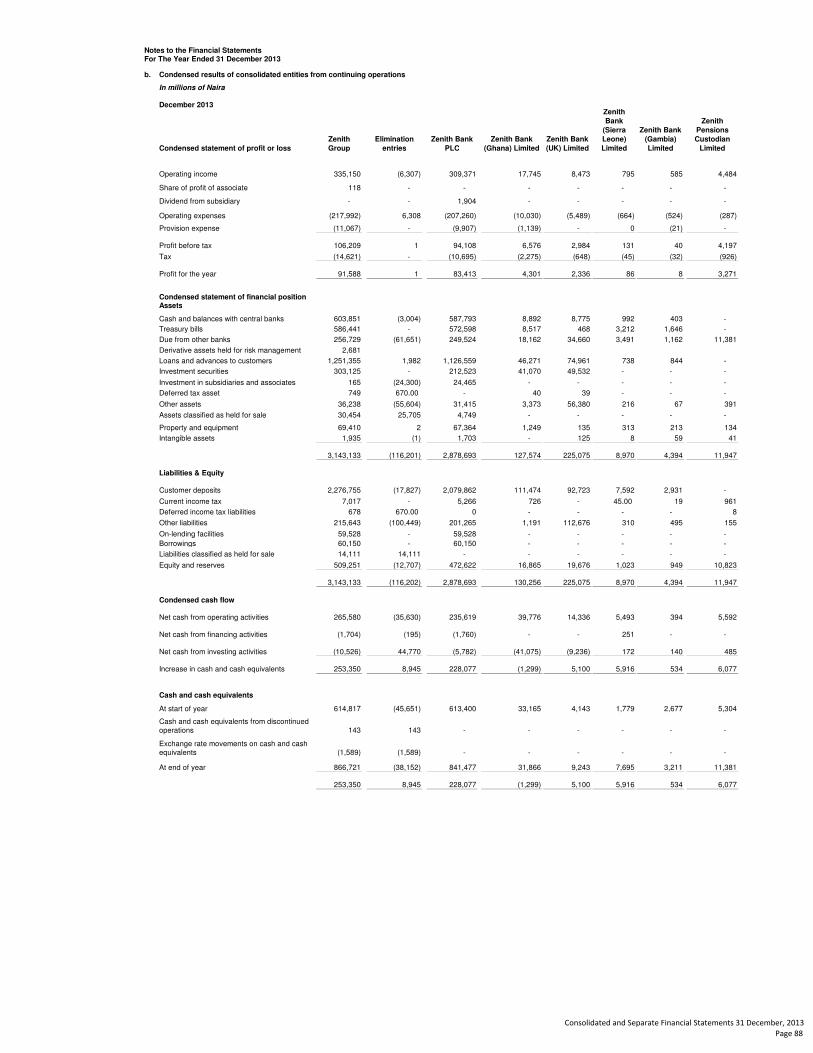
Notes to the Financial StatementsFor The Year Ended 31 December 2013
b. Condensed results of consolidated entities from continuing operations
In millions of Naira
December 2013
Condensed statement of profit or loss
Zenith
Group
Elimination
entries
Zenith Bank
PLC
Zenith Bank
(Ghana) Limited
Zenith Bank
(UK) Limited
Zenith
Bank
(Sierra
Leone)
Limited
Zenith Bank
(Gambia)
Limited
Zenith
Pensions
Custodian
Limited
Operating income 335,150 (6,307) 309,371 17,745 8,473 795 585 4,484
Share of profit of associate 118 - - - - - - -
Dividend from subsidiary - - 1,904 - - - - -
Operating expenses (217,992) 6,308 (207,260) (10,030) (5,489) (664) (524) (287)
Provision expense (11,067) - (9,907) (1,139) - 0 (21) -
Profit before tax 106,209 1 94,108 6,576 2,984 131 40 4,197
Tax (14,621) - (10,695) (2,275) (648) (45) (32) (926)
Profit for the year 91,588 1 83,413 4,301 2,336 86 8 3,271
Condensed statement of financial positionAssets
Cash and balances with central banks 603,851 (3,004) 587,793 8,892 8,775 992 403 -
Treasury bills 586,441 - 572,598 8,517 468 3,212 1,646 -
Due from other banks 256,729 (61,651) 249,524 18,162 34,660 3,491 1,162 11,381
Derivative assets held for risk management 2,681
Loans and advances to customers 1,251,355 1,982 1,126,559 46,271 74,961 738 844 -
Investment securities 303,125 - 212,523 41,070 49,532 - - -
Investment in subsidiaries and associates 165 (24,300) 24,465 - - - - -
Deferred tax asset 749 670.00 - 40 39 - - -
Other assets 36,238 (55,604) 31,415 3,373 56,380 216 67 391
Assets classified as held for sale 30,454 25,705 4,749 - - - - -
Property and equipment 69,410 2 67,364 1,249 135 313 213 134
Intangible assets 1,935 (1) 1,703 - 125 8 59 41
3,143,133 (116,201) 2,878,693 127,574 225,075 8,970 4,394 11,947
Liabilities & Equity
Customer deposits 2,276,755 (17,827) 2,079,862 111,474 92,723 7,592 2,931 -
Current income tax 7,017 - 5,266 726 - 45.00 19 961
Deferred income tax liabilities 678 670.00 0 - - - - 8
Other liabilities 215,643 (100,449) 201,265 1,191 112,676 310 495 155
On-lending facilities 59,528 - 59,528 - - - - -
Borrowings 60,150 - 60,150 - - - - -
Liabilities classified as held for sale 14,111 14,111 - - - - - -
Equity and reserves 509,251 (12,707) 472,622 16,865 19,676 1,023 949 10,823
3,143,133 (116,202) 2,878,693 130,256 225,075 8,970 4,394 11,947
Condensed cash flow
Net cash from operating activities 265,580 (35,630) 235,619 39,776 14,336 5,493 394 5,592
Net cash from financing activities (1,704) (195) (1,760) - - 251 - -
Net cash from investing activities (10,526) 44,770 (5,782) (41,075) (9,236) 172 140 485
Increase in cash and cash equivalents 253,350 8,945 228,077 (1,299) 5,100 5,916 534 6,077
Cash and cash equivalents
At start of year 614,817 (45,651) 613,400 33,165 4,143 1,779 2,677 5,304
143 143 - - - - - -
(1,589) (1,589) - - - - - -
At end of year 866,721 (38,152) 841,477 31,866 9,243 7,695 3,211 11,381
253,350 8,945 228,077 (1,299) 5,100 5,916 534 6,077
Exchange rate movements on cash and cash equivalents
Cash and cash equivalents from discontinued operations
Consolidated and Separate Financial Statements 31 December, 2013
Page 88
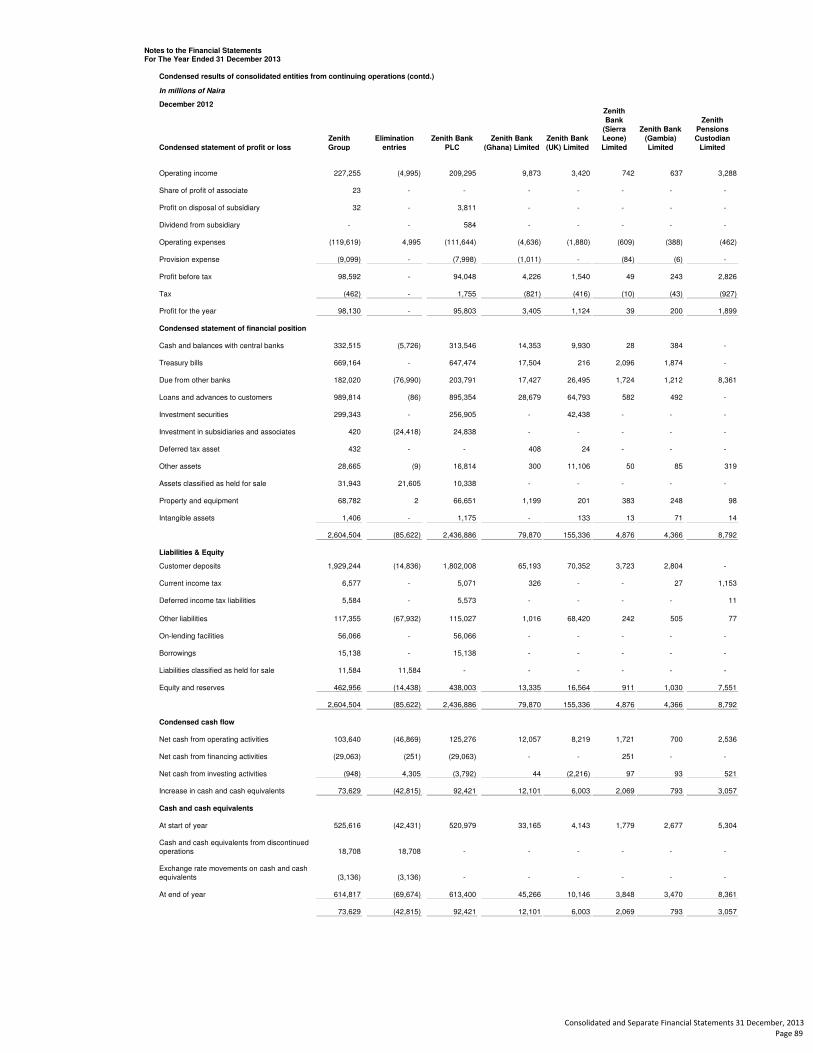
Notes to the Financial StatementsFor The Year Ended 31 December 2013
Condensed results of consolidated entities from continuing operations (contd.)
In millions of Naira
December 2012
Condensed statement of profit or loss
Zenith
Group
Elimination
entries
Zenith Bank
PLC
Zenith Bank
(Ghana) Limited
Zenith Bank
(UK) Limited
Zenith
Bank
(Sierra
Leone)
Limited
Zenith Bank
(Gambia)
Limited
Zenith
Pensions
Custodian
Limited
Operating income 227,255 (4,995) 209,295 9,873 3,420 742 637 3,288
Share of profit of associate 23 - - - - - - -
Profit on disposal of subsidiary 32 - 3,811 - - - - -
Dividend from subsidiary - - 584 - - - - -
Operating expenses (119,619) 4,995 (111,644) (4,636) (1,880) (609) (388) (462)
Provision expense (9,099) - (7,998) (1,011) - (84) (6) -
Profit before tax 98,592 - 94,048 4,226 1,540 49 243 2,826
Tax (462) - 1,755 (821) (416) (10) (43) (927)
Profit for the year 98,130 - 95,803 3,405 1,124 39 200 1,899
Condensed statement of financial position
Cash and balances with central banks 332,515 (5,726) 313,546 14,353 9,930 28 384 -
Treasury bills 669,164 - 647,474 17,504 216 2,096 1,874 -
Due from other banks 182,020 (76,990) 203,791 17,427 26,495 1,724 1,212 8,361
Loans and advances to customers 989,814 (86) 895,354 28,679 64,793 582 492 -
Investment securities 299,343 - 256,905 - 42,438 - - -
Investment in subsidiaries and associates 420 (24,418) 24,838 - - - - -
Deferred tax asset 432 - - 408 24 - - -
Other assets 28,665 (9) 16,814 300 11,106 50 85 319
Assets classified as held for sale 31,943 21,605 10,338 - - - - -
Property and equipment 68,782 2 66,651 1,199 201 383 248 98
Intangible assets 1,406 - 1,175 - 133 13 71 14
2,604,504 (85,622) 2,436,886 79,870 155,336 4,876 4,366 8,792
Liabilities & Equity
Customer deposits 1,929,244 (14,836) 1,802,008 65,193 70,352 3,723 2,804 -
Current income tax 6,577 - 5,071 326 - - 27 1,153
Deferred income tax liabilities 5,584 - 5,573 - - - - 11
Other liabilities 117,355 (67,932) 115,027 1,016 68,420 242 505 77
On-lending facilities 56,066 - 56,066 - - - - -
Borrowings 15,138 - 15,138 - - - - -
Liabilities classified as held for sale 11,584 11,584 - - - - - -
Equity and reserves 462,956 (14,438) 438,003 13,335 16,564 911 1,030 7,551
2,604,504 (85,622) 2,436,886 79,870 155,336 4,876 4,366 8,792
Condensed cash flow
Net cash from operating activities 103,640 (46,869) 125,276 12,057 8,219 1,721 700 2,536
Net cash from financing activities (29,063) (251) (29,063) - - 251 - -
Net cash from investing activities (948) 4,305 (3,792) 44 (2,216) 97 93 521
Increase in cash and cash equivalents 73,629 (42,815) 92,421 12,101 6,003 2,069 793 3,057
Cash and cash equivalents
At start of year 525,616 (42,431) 520,979 33,165 4,143 1,779 2,677 5,304
18,708 18,708 - - - - - -
(3,136) (3,136) - - - - - -
At end of year 614,817 (69,674) 613,400 45,266 10,146 3,848 3,470 8,361
73,629 (42,815) 92,421 12,101 6,003 2,069 793 3,057
Cash and cash equivalents from discontinued operations
Exchange rate movements on cash and cash equivalents
Consolidated and Separate Financial Statements 31 December, 2013
Page 89

ZENITH BANK PLC
Notes To The Financial StatementsFor The Year Ended 31 December 2013
c.
i
ii
iii
iv
v
vi
vii
viii
ix
x
xi
23 Investments in associates
Group Group Bank BankIn millions of Naira 2013 2012 2013 2012
Gross investment 1,822 1,822 1,822 1,822Share of profit/(loss) b/f (43) (66) - -
118 23 - - Disposals (cumulative) (510) (508) (510) (508)
(1,222) (851) (1,222) (851)
165 420 90 463
Classified as:
Current - - - -
Non- current 165 420 90 463
165 420 90 463
The aggregate amounts of assets, liabilities, revenue and profits of associates are shown below;2013 2012
In millions of NairaTotal assets 12,355 8,704Total liabilities 7,599 4,490Total revenue 15,874 11,611Profit before tax 2,551 475
There were no published price quotations for any associates of the Group. Furthermore, there are no significant restrictions on the ability of associates to transfer funds to the Group in the form of cash dividends or repayment of loans and advances.
Balance at end of the year
Summarised financial information of associates
Zenith Pensions Custodian Limited provides pension funds custodial services to Licensed Pension Fund Administrators (PFAs) andClosed Pension Funds Administrators under the Pension (Reform) Act, 2004. It was incorporated on 1 March 2005. The name waschanged from "Zenith Pensions Limited" to "Zenith Pensions Custodian Limited" on September 20, 2005. It was licensed by the NationalPension Commission as a custodian of pension funds and assets on 7 December 2005 and commenced operations in December 2005.
Zenith Bank (Ghana) Limited provides corporate and retail banking services. It was incorporated on April 15, 2005 and commencedoperations on September 16, 2005.
The Group's investments under the Small and Medium Enterprises Equity Investment Scheme ("SMEEIS") is in compliance with thePolicy Guidelines for 2001 Fiscal Year (Monetary Policy Circular No. 35). The Group generally holds 20 percent or more of the votingpower of the investee and is therefore presumed to have significant influence over the investee. In instances where the Group holdsless than 20 percent of the voting power of the investee, the Group concluded that it has significant influence due to the Group'srepresentation on the board of the relevant investee, with such board generally limited to a small number of board members.
Zenith Bank (UK) Limited provides a range of commercial, wholesale, investment and retail banking in the United Kingdom. It wasincorporated on 17 February 2006 and commenced operations on 30 March 2007.
Zenith Bank (Sierra Leone) Limited provides corporate and retail Banking services. It was incorporated in Sierra Leone on 17September 2007 and granted an operating license by the Bank of Sierra Leone on 10 September 2008. It commenced bankingoperations on 15 September 2008.
Zenith Bank (The Gambia) Limited provides corporate and retail banking services. It was incorporated in The Gambia on 24 October2008 and granted an operating license by the Central Bank of The Gambia on 30 December 2009. It commenced banking operations on18 January 2010.
Diminution in investment (cumulative)
Zenith Life Assurance Company Limited provides group life and individual life policy cover. It was incorporated 30 March 2001 . Itsname was changed from "Zenith Life Insurance Company Limited" to "Zenith Life Assurance Company Limited" on April 25, 2005. Thecompany commenced operations in April 2006. The carrying amount of investment in Zenith Life Assurance Company Limited in 2012 isincluded in 'assets classified as held for sale' ( see Note 26).
Zenith Capital Limited provides investment banking services, including corporate finance and advisory, project finance, capital markets,syndication, asset management and principal investment. It was incorporated on 11 November 2005 and commenced operations inOctober 2006. On 21 November 2006, Its name was changed from "Zenith Capital Markets Limited" to "Zenith Capital Limited". Thecarrying amount of investment in Zenith Capital Limited in 2012 is included in 'assets classified as held for sale' ( see Note 26).
Zenith Medicare Limited provides health insurance and managed care services. It was incorporated on May 31, 2005 and commencedoperations on January 1, 2006. Its name was changed from "Zenith Assurance Medicare Limited" to Zenith Medicare Limited" onSeptember 28, 2006. The carrying amount of investment in Zenith Medicare Limited in 2012 is included in 'assets classified as held forsale'( see Note 26).
Zenith Trustees Limited provides trust services and non-pension fund custodial services. It was incorporated in Nigeria on July 5, 2004and commenced operations in May 2006. The carrying amount of investment in Zenith Trustees Limited in 2012 is included in 'assetsclassified as held for sale'( see Note 26).
Zenith General Insurance Company Limited provides marine, motor, accident, fire and other non-life insurance services. It wasincorporated on 8 January 1970 as Picadilly Insurance Company Limited and it traded in this name until 2003 when it was acquired byZenith Bank PLC . The name was changed to Zenith General Insurance Company Limited on April 16, 2004. The carrying amount ofinvestment in Zenith General Insurance Company Limited in 2012 is included in 'assets classified as held for sale'( see Note 26).
Share of profit: current year
Apart from Zenith Pensions Custodian Limited, all other subsidiaries consolidated as continuing operations are incorporated outsideNigeria.
Consolidated and Separate Financial Statements 31 December, 2013
Page 90

ZENITH BANK PLC
Notes To The Financial StatementsFor The Year Ended 31 December 2013
In millions of Naira
24 Deferred taxRecognised Recognised
Group 01 Jan 2013 in profit or loss in OCI 31 Dec 2013
Movements in temporary differences during the year:Property and equipment 9,995 (9,998) - (3)Other assets 11 - - 11Allowances for loan losses (5,312) 5,312 - - Equity securities at fair value 890 - (890) - Foreign currency translation difference - - (90) (90)
Effective Portion of change in fair value of cash flow hedge - - 760 7605,584 (4,686) (220) 678
Foreign currency translation difference (116)
Tax loss carried forward (Deferred tax asset) (432) (317) - (749)
Reversal of timing difference (Note 13) (5,119)
Recognised Recognised 01 Jan 2012 in profit or loss in OCI 31 Dec 2012
Movements in temporary differences during the year:Property and equipment 6,586 3,409 - 9,995 Other assets 580 (569) - 11 Allowances for loan losses 3,072 (8,384) - (5,312)Equity securities at fair value 504 381 5 890
10,742 (5,163) 5 5,584
Foreign exchange differences - Tax loss carried forward (Deferred tax asset) (186) (246) - (432)
Originating timing difference (Note 13) (5,595)
Recognised Recognised Bank 01 Jan 2013 in profit or loss in OCI 31 Dec 2013
Movements in temporary differences during the year:Property and equipment 9,995 (9,995) - - Allowances for loan losses (5,312) 5,312 - - Equity securities at fair value 890 - (890) -
5,573 (4,683) (890) -
Recognised Recognised 1 Jan 2012 in profit or loss in OCI 31 Dec 2012
Movements in temporary differences during the year:Property and equipment 6,050 3,945 - 9,995Other assets 579 (579) - - Allowances for loan losses 3,073 (8,385) - (5,312)Treasury bills and bonds (FVTPL) 145 (145) - - Equity securities at fair value 885 - 5 890
10,732 (5,164) 5 5,573
Group Group Bank BankIn millions of Naira 2013 2012 2013 2012
Property, plant and equipment 5,552 - 5,552 - Equity securities at fair value 1,055 - 1,055 - Unutilized Capital allowances (7,611) - (7,611) - Collective impairment (6,257) - (6,257) - Tax losses (38) - (38) -
(7,299) - (7,299) -
During the year, deferred tax liabilities amounting to N5.57 billion (N4.6 billion initially recognized in profit or loss and N0.89 billion initiallyrecognized in OCI) were reversed as the Group had deferred tax assets as at the reporting date.
In 2013, the Bank had deferred tax assets amounting to N7.3 billion, which have not been recognized due to uncertainties relating to the timing of future taxable profits, mainly arising from the Bank's investment in Government bonds and securities (See note 13 c(i)). These were in respect of the following items .
Deferred income tax assets are recognised for tax loss carry-forwards only to the extent that the realisation of the related tax benefit isprobable.
Consolidated and Separate Financial Statements 31 December, 2013
Page 91

ZENITH BANK PLC
Notes To The Financial StatementsFor The Year Ended 31 December 2013 Group Group Bank Bank
2013 2012 2013 2012In millions of Naira
25 Other assets
Prepayments 14,265 13,971 13,064 13,467
Other receivables 26,610 19,331 22,988 7,984
Gross other assets 40,875 33,302 36,052 21,451Less: Specific impairment (4,637) (4,637) (4,637) (4,637)
36,238 28,665 31,415 16,814
Classified as:Current 40,875 33,287 36,052 21,451Non- current - 15 - -
40,875 33,302 36,052 21,451
Movement in specific impairment:At start of year 4,637 3,357 4,637 3,357Specific impairment - 1,280 - 1,280
At end of the year 4,637 4,637 4,637 4,637
26 Assets classified as held for sale
- - 4,749 10,338 Cash and balances with central banks 500 500 - - Treasury bills 11,076 7,696 - - Due from other banks 11,875 15,398 - - Loans and advances 59 484 - - Reinsurance assets and insurance receivables 1,112 499 - - Investment securities 2,915 5,520 - - Deferred tax assets 1 1,065 - - Other assets 1,861 261 - - Property and equipment 1,026 474 - - Intangible assets 29 46 - -
30,454 31,943 4,749 10,338
Investment in subsidiaries (see Note 22(c))
In line with regulatory directives on the scope of banking operations in Nigeria, the Bank has elected to discontinue its non-core bankingoperations with the exception of Pension Custodianship. Accordingly, non-core banking subsidiaries which have not been disposed ofhave been accounted for as discontinued operations in line with IFRS 5. These non-core banking subsidiaries are the Insuranceoperations (Zenith General Insurance Company Limited, Zenith Life Assurance Company Limited, and Zenith Medicare Limited) and thecapital market operations (Zenith Capital Limited, Zenith Securities Limited and Zenith Trustees Limited).
For the insurance operations (in which the group holds 80% stake), discussion with the potential buyers is in an advanced stage andsale agreements and shareholders' agreement has already been signed with two different potential investors interested in acquiringdifferent stakes. Prior to entering into a firm sale and purchase agreement with these investors, several investors have undertaken duediligence exercises on the company and made purchase offers. The only two potential investors whose offers were acceptable to thegroup, placed an additional condition of carrying out a revised due diligence based on the audited financial statements of the companiesas at 31 December 2013. Subsequent to year end, the potential investors have concluded the revised due diligence and one of theinvestors has made payment for 45% stake in the insurance sub group. The sale of the remaining 35% is expected to be concludedbefore the end of the first half of 2014.
For the subsidiaries within the capital market operations, a restructuring of their balance sheets was concluded in December 2013. Therestructuring resulted in reduction in the share capital of Zenith Securities Limited and Zenith Capital Limited by N2.9 billion and N2.7billion respectively, amounting to the total reduction in investment in subsidiaries by N5.6 billion. Having concluded the restructuringexercise, the potential investors have commenced a due diligence review based on the 2013 financial statements. In March 2014, thesale of the subsidiaries was concluded.
Consolidated and Separate Financial Statements 31 December, 2013
Page 92

Notes to the Financial StatementsFor The Year Ended 31 December 2013
In millions of Naira
27 Property and equipmentFurniture,
(a) Group Leasehold Leasehold fittings & Computer Motor Work inland Buildings improvement equipment equipment vehicles progress Total
CostAt start of the year 16,484 18,219 12,955 34,523 20,934 13,805 17,529 134,449 Exchange difference - (32) (119) (137) (157) (110) (69) (624) Additions 349 1,403 625 3,646 1,623 2,599 527 10,772 Reclassifications (363) 1,172 59 42 41 108 (1,118) (59) Disposals - - (14) (38) (18) (1,138) - (1,208)
At end of the year 16,470 20,762 13,506 38,036 22,423 15,264 16,869 143,330
Accumulated depreciation At start of the year 1,235 2,656 9,665 23,352 18,478 10,281 - 65,667 Exchange difference - (2) (76) (103) (125) (66) - (372) Charge for the year 163 374 1,313 4,298 1,888 1,730 - 9,766 Reclassifications (46) 48 (4) 13 (10) (1) - - Disposals - - (14) (37) (18) (1,072) - (1,141)
At end of the year 1,352 3,076 10,884 27,523 20,213 10,872 - 73,920
Net book amountAt 31 December 2013 15,118 17,686 2,622 10,513 2,210 4,392 16,869 69,410
At 31 December 2012 15,249 15,563 3,290 11,171 2,456 3,524 17,529 68,782
There were no impairment losses on any class of property and equipment during the year (2012 : nil)
Consolidated and Separate Financial Statements 31 December, 2013
Page 93

Notes to the Financial StatementsFor The Year Ended 31 December 2013
In millions of Naira
27 Property and equipmentFurniture,
(b) BANK Leasehold fittings & Computer Motor Work inLand Buildings improvement equipment equipment vehicles progress Total
Cost At start of the year 16,484 18,130 11,177 33,284 19,937 13,012 17,188 129,212 Additions 349 1,257 468 3,517 1,476 2,359 400 9,826 Reclassifications (363) 1,032 58 41 (1) 108 (934) (59) Disposals - - (14) (38) (18) (1,029) - (1,099)
At end of the year 16,470 20,419 11,689 36,804 21,394 14,450 16,654 137,880
Accumulated depreciation At start of the year 1,235 2,645 8,687 22,512 17,691 9,791 - 62,561 Charge for the year 163 369 1,072 4,106 1,730 1,575 - 9,015 Reclassifications (46) 48 (4) 13 (10) (1) - - Disposals - - (14) (37) (17) (992) - (1,060)
At end of the year 1,352 3,062 9,741 26,594 19,394 10,373 - 70,516
Net book amount
At 31 December 2013 15,118 17,357 1,948 10,210 2,000 4,077 16,654 67,364
At 31 December 2012 15,249 15,485 2,490 10,772 2,246 3,221 17,188 66,651
There were no impairment losses on any class of property and equipment during the year (2012 : nil)
Consolidated and Separate Financial Statements 31 December, 2013
Page 94

ZENITH BANK PLC
Notes to the Financial Statements
For The Year Ended 31 December 2013
In millions of Naira Group Group Bank Bank2013 2012 2013 2012
28 Intangible assets
Computer software
Cost
At start of the year 3,661 1,969 2,981 1,843Exchange difference 18 (17) - - Reclasification 59 59
Additions 1,421 1,709 1,313 1,138
At end of the year 5,159 3,661 4,353 2,981
Accumulated depreciation
At start of the year 2,255 1,199 1,806 1,182Exchange difference 18 (3) - - Charge for the year 951 1,059 844 624
At end of year 3,224 2,255 2,650 1,806
Carrying amount
At end of the year 1,935 1,406 1,703 1,175
There were no impairment losses on intangible assets during the year (2012 : nil)
29 Customers' deposits
Demand 1,293,778 1,171,216 1,229,706 1,140,494Savings 192,281 152,464 174,184 140,973Term 439,466 336,927 419,751 328,965Deposit from banks 64,335 48,580 - - Domiciliary 286,895 220,057 256,221 191,576
2,276,755 1,929,244 2,079,862 1,802,008
Classified as:
Current 2,276,755 1,913,046 2,079,862 1,802,008Non- current - 16,198 - -
2,276,755 1,929,244 2,079,862 1,802,008
30 Other liabilities
32,276 38,450 32,276 38,442Settlement payables 14,094 2,875 13,841 2,760Managers' cheques 13,063 14,996 12,659 14,733Due to banks for clean letters of credit 98,743 36,300 98,743 36,300
2,963 2,581 2,927 2,559
389 434 349 402Tax collections 1,336 1,295 1,289 1,255
19,272 7,884 19,272 7,884Other payables 33,507 12,540 19,909 10,692
215,643 117,355 201,265 115,027
Classified as:
Current 194,512 93,999 183,283 75,929Non- current 21,131 23,356 17,982 39,098
215,643 117,355 201,265 115,027
Customer deposits for letters of credit
Customers' funds for purchases
Sales and other collections
Deferred income on financial guarantee contracts
Consolidated and Separate Financial Statements 31 December, 2013
Page 95

ZENITH BANK PLC
Notes to the Financial Statements
For The Year Ended 31 December 2013
In millions of Naira Group Group Bank Bank2013 2012 2013 2012
31 On-lending facilities
This comprises:
29,905 23,955 29,905 23,955
14,417 14,670 14,417 14,670
15,206 17,441 15,206 17,441
59,528 56,066 59,528 56,066
Classified as:
Current 36,673 26,151 36,673 26,151Non- current 22,855 29,915 22,855 29,915
59,528 56,066 59,528 56,066
(i)
(ii)
(iii)
The Central Bank of Nigeria (CBN) / Bank of Industry (BOI) - SME / Manufacturing Intervention Fund represents an intervention creditgranted to the Bank for the purpose of refinancing / restructuring existing loans to Small and Medium Scale Enterprises (SMEs) andManufacturing Companies. The total facility is secured by Nigerian Government Securities. The maximum tenor for term loan under theprogramme is 15 years while the tenor for working capital is one year, renewable annually subject to a maximum tenor of five years. Amanagement fee of 1% per annum deductible at source in the first year, and quarterly in arrears thereafter, is paid by the Bank underthe Intervention programme and the Bank is under obligation to on-lend to customers at an all-in interest rate of 7% per annum. TheBank is the primary obligor to CBN / BOI and assumes the risk of default.
The Central Bank of Nigeria (CBN) / Bank of Industry (BOI) - Power & Aviation Intervention Fund represents a credit line for thepurpose of granting new loans and refinancing / restructuring existing loans to companies in the power and aviation industries. Thefacility is secured by Irrevocable Standing Payment Order (ISPO). The maximum tenor for term loan under the programme is 15 yearswhile the tenor for working capital is one year, renewable annually subject to a maximum tenor of five years. The facility attracts aninterest of 1% per annum payable quarterly in arrears and the Bank is under obligation to on-lend to customers at an all-in interest rateof 7% per annum.
Central Bank of Nigeria (CBN) Commercial Agriculture Credit Scheme Loan (See (i)) below
Bank of Industry (BOI) Intervention Loan (See (ii)) below
Central Bank of Nigeria (CBN) / Bank of Industry(BOI) - Power & Aviation intervention Funds (See (iii)) below
The fund received under the Central Bank of Nigeria (CBN) Commercial Agriculture Credit Scheme represents a credit line granted tothe Bank for the purpose of providing concessionary funding to the agricultural sector. The facility is secured by Nigerian GovernmentSecurities and has a tenor of 7 years with effect from 2009 to expire by September 2016. The facility attracts an interest of 0% perannum and the Bank is under obligation to on-lend to customers at an all-in interest rate of not more than 9% per annum. Based on thestructure of the facility, the Bank assumes the default risk of all amounts lent to the Bank's customers.
There was no undisbursed on-lending facility in 2013. Included in on-lending facilities in 2012 were amount totalling N1.9 billion received but not yet disbursed.
Consolidated and Separate Financial Statements 31 December, 2013
Page 96

ZENITH BANK PLC
Notes to the Financial Statements
For The Year Ended 31 December 2013
In millions of Naira Group Group Bank Bank2013 2012 2013 2012
32 Borrowings
Borrowings comprise:
Due to FMO - - - - Due to ADB (See Note(i)) 7,445 11,957 7,445 11,957Due to KEXIM(See Note(ii)) 3,440 313 3,440 313Due to EIB 4,331 - 4,331 - Due to HSBC - - - -
13,264 2,183 13,264 2,183
15,876 - 15,876 -
15,794 15,794
- 685 - 685
60,150 15,138 60,150 15,138
Classified as:
Current - 7,061 - 7,061Non- current 60,150 8,077 60,150 8,077
60,150 15,138 60,150 15,138
(i)
(ii)
(iii)
(iv)
(v)
(vi)
Group Group Bank Bank2013 2012 2013 2012
33 Liabilities classified as held for sale
Claims payable 2,084 425 - - Current income tax 1,405 1,782 - - Deferred income tax liabilities 295 552 - - Other payables 6,274 5,407 - - Liabilities on insurance contracts 4,053 3,418 - -
14,111 11,584 - -
34 Share capital Group Group Bank Bank
Authorised
20,000 20,000 20,000 20,000
Issued and fully paid
15,698 15,698 15,698 15,698
There was no movement in the share capital account during the year.
40,000,000,000 ordinary shares of 50k each (2012: 40,000,000,000)
31,396,493,786 ordinary shares of 50k each (2012: 31,396,493,786)
The Group has not had any defaults of principal, interest or other breaches with respect to their liabilities during the period (2012: nil).
The amount due to African Development Bank (AfDB) of N7.48 billion (US $45.83 million) represents the outstanding balances from twodollar term loan facilities of the sums of US $100 million and US $50 million granted by AfDB in May 2007 and March 2010respectively. The facilities are repayable over 7 years and 5 years respectively. Interest is payable half-yearly at the rate of LIBOR +2.2% per annum and LIBOR + 4.5% per annum respectively. The outstanding balance of US $8.33 million from the first facility willmature in 2 months while the outstanding balance of US $37.5 million from the second facility will mature in 1 year and 2 months.
The amount of N3.44 billion (US $21.5 million) represents the outstanding balances from two short term loan facilities of US $30 millionand US $18 million granted by The Export-Import Bank of Korea (KEXIM) in February 2013 and November 2013 respectively. Thefacilities are priced at LIBOR + 1.5% per annum and LIBOR + 1.6% per annum with outstanding balances of US $5 million and US$16.5 million respectively. Final repayments on these facilities are due in February 2014 and November 2014 respectively.
The amount of N13.37 billion (US $83.33 million) represents the outstanding balances from three dollar term loan facilities of US $25million, US $25 million and US $50 million granted by Promotion et Participation pour la Coopération économique (PROPARCO) inFebruary 2010, February 2013 and December 2013 respectively.Interest is payable semi-annualy at LIBOR + 3.3% p.a, LIBOR +3.76% p.a and LIBOR + 3.71% p.a with outstanding balances of US $8.33 million, US $25 million and US $50 million respectively. Final repayments on these facilities are due in April 2015, April 2020 and April 2021 respectively.
The amount of N16.01 billion (US $100 million) represents the balance of a 3-year dollar term loan facility granted by StandardChartered Bank in June 2013. The facilty will mature in June 2016 and interest is payable quarterly at LIBOR + 3.50% p.a.
The business of the entities classified as held for sale are discussed in Note 22(c).
The amount of N16.03 billion (US $100 million) represents the balance of a 3-year dollar term loan facility granted by Citibank inDecember 2013. The facilty will mature in December 2016 and interest is payable quarterly at LIBOR + 3.50% p.a.
The amount of N4.38 billion (US $27.32 million) represents the first tranche of disbursement (received in December 2013) from theEUR60 million (US $80 million) mid-cap loan granted by the European Investment Bank (EIB) . Interest is payable at the rate of LIBOR+ 2.74% p.a and the facility will mature in July 2019.
Due to PROPARCO (See Note(iii))
Due to Private Exporters Funding Corporation(See Note (vi))
Due to SCB (See Note(iv))
Due to CITIBANK (See Note(v))
Consolidated and Separate Financial Statements 31 December, 2013
Page 97

ZENITH BANK PLC
Notes to the Financial Statements
For The Year Ended 31 December 2013
Group Group Bank BankIn millions of Naira 2013 2012 2013 2012
35 Share premium, retained earnings and other reserves
(a) There was no movement in the Share premium account during the current and prior year.
At end of the year 255,047 255,047 255,047 255,047
The nature and purpose of the reserves in equity are as follows:
(b) Share premium: Premiums from the issue of shares are reported in share premium.
(f) Revaluation reserve: Comprises fair value movements on equity instruments.
36 Pension contribution
In accordance with the provisions of the Pensions Reform Act 2004, the bank and its subsidiaries commenced a contributory pensionscheme in January 2005. For entities operating in Nigeria, the contribution by employees and the employing entities are 2.5% and12.5% respectively of the employees' basic salary, housing and transport allowances. Entities operating outside Nigeria contribute inline with the relevant pension laws in their jurisdictions. The contribution by the group and the bank during the period were N 2.80
billion and N 2.50 billion respectively (2012: N 3.04 billion and N 2.84 billion).
(e) SMIEIS reserve: The SMIEIS reserve is maintained to comply with the Central Bank of Nigeria (CBN) requirement that all licensed banks set aside a portion of the profit after tax in a fund to be used to finance equity investments in qualifying small and medium scale enterprises. Under the terms of the guideline (amended by CBN letter dated 11 July 2006), the contributions will be 10% of profit after tax and shall continue after the first 5 years but banks’ contributions shall thereafter reduce to 5% of profit after tax. The small and medium scale industries equity investment scheme reserves are non-distributable. Transfer to this reserve is no longer required.
and financial position of entities within the group that have a functional currency other than Naira.(g) Foreign Currency translation reserve: Comprises exchange differences resulting from the translation to Naira of the results
(h) Statutory Reserve for Credit Risk: The Nigerian banking regulators requires the bank to create a reserve for the difference between the cumulative impairment charge determined in line with the principles of IFRS and the charge determined in line with the prudential guidelines issued by the Central Bank of Nigeria (CBN). This reserve is not available for distribution to shareholders.
reclassified to the other reserves noted below.
(d) Statutory reserve: Nigerian banking regulations require the Bank to make an annual appropriation to a statutory reserve. Asstipulated by section 16(1) of the Bank and Other Financial Institutions Act of 1991 (amended), an appropriation of 30% of profit aftertax is made if the statutory reserve is less than the paid-up share capital and 15% of profit after tax if the statutory reserve is greaterthan the paid-up share capital.
(c) Retained earnings: Retained earnings comprise the undistributed profits from previous years which have not been
Consolidated and Separate Financial Statements 31 December, 2013
Page 98

ZENITH BANK PLC
Notes to the Financial Statements
For The Year Ended 31 December 2013 Group Group Bank Bank2013 2012 2013 2012
N'million N'million N'million N'million37 Personnel Expenses
Salaries and wages 47,974 44,840 45,328 42,410Other staff costs 9,175 4,551 9,035 4,536
2,803 3,036 2,501 2,841
59,952 52,427 56,864 49,787
(a)
Number Number Number Number
Executive directors 8 13 4 6Management 468 435 455 409Non-management 6,825 7,431 6,156 6,749
7,301 7,879 6,615 7,164
Number Number Number Number
N300,001 - N2,000,000 841 1,212 769 1,157N2,000,001 - N2,800,000 324 199 - - N2,800,001 - N4,000,000 1,138 1,569 956 1,406N4,000,001 - N6,000,000 1,677 2,853 1,636 2,668N6,000,001 - N8,000,000 1,223 606 1,205 569N8,000,001 - N9,000,000 681 394 670 381N9,000,001 - and above 1,415 1,033 1,375 977
7,299 7,866 6,611 7,158
(b) Directors' emoluments N'million N'million N'million N'million
The remuneration paid to directors are as follows:
Fees and sitting allowances 233 224 165 103 Executive compensation 421 496 258 172 Retirement benefit costs 21 6 6 6
675 726 429 281
The chairman 23 16 23 16
The highest paid director 26 16 26 16
Number Number Number Number
N5,500,001 and above 15 13 7 6
The number of directors who received fees and other emoluments (excluding pension contributions and reimbursable expenses) in the following ranges was:
The average number of persons employed during the period by category:
Compensation for the staff (excluding executive directors) are as follows:
Pension contribution (Note 36)
The number of employees of the bank, other than directors, who earned salaries and emoluments (excluding pension and reimbursable expenses) are in the following ranges:
Fees and other emoluments disclosed above include amounts paid to:
Consolidated and Separate Financial Statements 31 December, 2013
Page 99

ZENITH BANK PLC
Notes to the Financial Statements
For The Year Ended 31 December 2013
38 Group subsidiaries and related party transactions
Parent:
Zenith Bank Plc (incorporated in Nigeria) is the ultimate parent company of the Group.
Subsidiaries:
Effective Nominal share
Entity holding capital held
% N'million
Foreign / banking subsidiaries:
Zenith Bank (Ghana) Limited 98.07% 6,444 Zenith Bank (UK) Limited 100.00% 13,307 Zenith Bank (Sierra Leone) Limited 99.99% 1,606 Zenith Bank (Gambia ) Limited 99.96% 1,038
Domestic / non-banking subsidiaries:
Zenith General Insurance Limited 80.12% 3,978 Zenith Life Assurance Limited (Indirect) 81.61% 1,632 Zenith Securities Limited 99.98% 70 Zenith Capital Limited 99.99% 550 Zenith Pension Custodians Limited 99.00% 1,980 Zenith Trustees Limited (Indirect) 49.99% 60 Zenith Medicare Limited (Indirect) 80.12% 380
Significant restrictions
Non controlling interest in subsidiaries
Key management personnel
Key management compensation
Group Group Bank BankIn millions of Naira 2013 2012 2013 2012
Salaries and other short-term benefits 534 534 258 275Retirement benefit cost 10 8 6 6
Loans and advances
At start of the year 1,159 1,429 1,090 1,357Granted during the year 83 57 83 57Repayment during the year (354) (327) (352) (324)
At end of of the year 888 1,159 821 1,090
Interest earned 26 50 25 48
Interest
Name of company Relationship Loans Deposits received Interest paid
Visafone Communication Limited
Common significant shareholder 2,640 21 396 21
Quantum Fund Management
Common significant shareholder 7,978 82 957 1
At end of of the year 10,618 103 1,353 22
Transactions between Zenith Bank Plc and its subsidiaries which are eliminated on consolidation are not separately disclosed in theconsolidated financial statements. The Group's effective interests and investments in subsidiaries as at 31 December 2013 are shownbelow.
Key management personnel is defined as the Group's executive management, including their close members of family and any entityover which they exercise control. Close members of family are those family members who may be expected to influence, or beinfluenced by that individual in their dealings with the Group.
Loans to key management personnel represent mortgage loans which are given under terms that are no more favourable than thosegiven to other staff. No impairment has been recognised in respect of loans granted to key management (2012: Nil). Mortgage loansamounting to N888 million (2012: N1,159 million) and N821 million (2012: N1,090 million) for the Group and Bank respectively aresecured by the underlying assets. All other loans are unsecured.
2013
The Group does not have significant restrictions on its ability to access or use its assets and settle its liabilities other than thoseresulting from the supervisory frameworks within which banking subsidiaries operate. The supervisory frameworks require bankingsubsidiaries to keep certain levels of regulatory capital and liquid assets, limit their exposure to other parts of the Group and complywith other ratios. See notes 3.4, 3.5 and 4.4.3 for disclosures on liquidity, capital adequacy, and credit risk reserve requirementsrespectively. The carrying amounts of banking subsidiaries' assets and liabilities are N371.77 billion and N333.18 billion respectively(2012: N244.45 billion and N212.61 billion respectively).
The Group does not have any subsidiary that has material non controlling interest.
Consolidated and Separate Financial Statements 31 December, 2013
Page 100
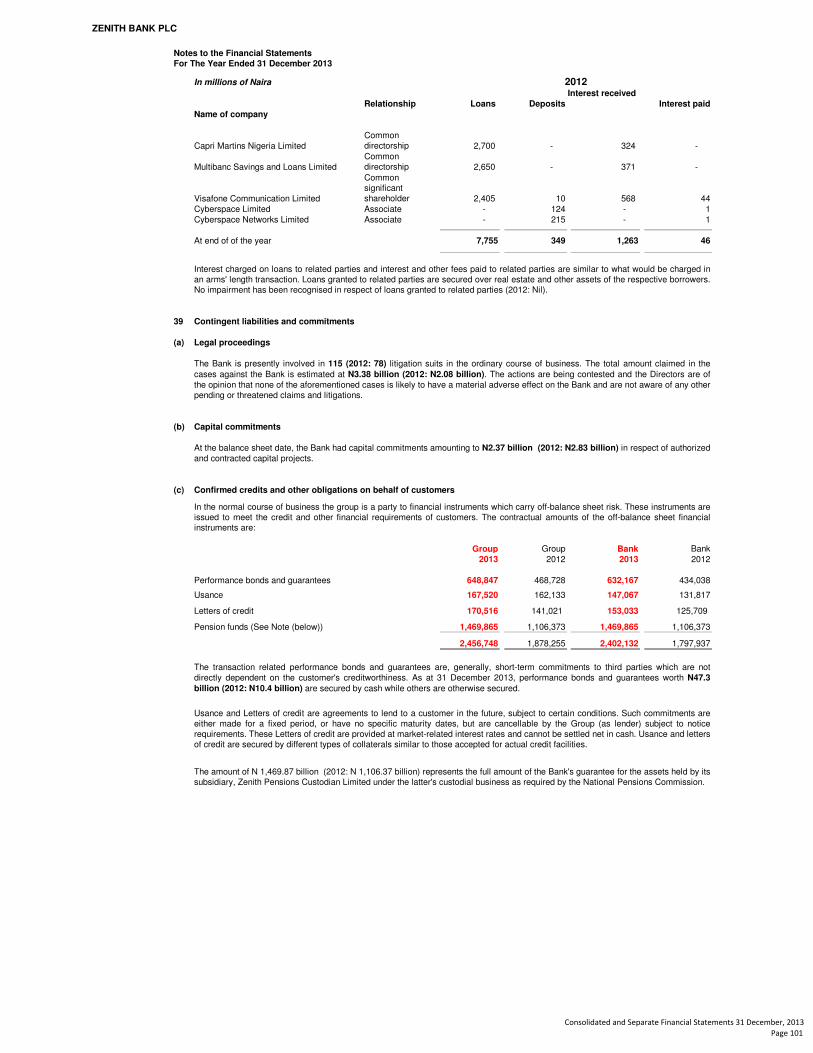
ZENITH BANK PLC
Notes to the Financial Statements
For The Year Ended 31 December 2013
In millions of Naira
Interest received
Relationship Loans Deposits Interest paid
Name of company
Capri Martins Nigeria LimitedCommon directorship 2,700 - 324 -
Multibanc Savings and Loans LimitedCommon directorship 2,650 - 371 -
Visafone Communication Limited
Common significant shareholder 2,405 10 568 44
Cyberspace Limited Associate - 124 - 1Cyberspace Networks Limited Associate - 215 - 1
At end of of the year 7,755 349 1,263 46
39 Contingent liabilities and commitments
(a) Legal proceedings
(b) Capital commitments
(c) Confirmed credits and other obligations on behalf of customers
Group Group Bank Bank2013 2012 2013 2012
Performance bonds and guarantees 648,847 468,728 632,167 434,038
Usance 167,520 162,133 147,067 131,817
Letters of credit 170,516 141,021 153,033 125,709
Pension funds (See Note (below)) 1,469,865 1,106,373 1,469,865 1,106,373
2,456,748 1,878,255 2,402,132 1,797,937
The Bank is presently involved in 115 (2012: 78) litigation suits in the ordinary course of business. The total amount claimed in the
cases against the Bank is estimated at N3.38 billion (2012: N2.08 billion). The actions are being contested and the Directors are ofthe opinion that none of the aforementioned cases is likely to have a material adverse effect on the Bank and are not aware of any otherpending or threatened claims and litigations.
At the balance sheet date, the Bank had capital commitments amounting to N2.37 billion (2012: N2.83 billion) in respect of authorizedand contracted capital projects.
In the normal course of business the group is a party to financial instruments which carry off-balance sheet risk. These instruments areissued to meet the credit and other financial requirements of customers. The contractual amounts of the off-balance sheet financialinstruments are:
The transaction related performance bonds and guarantees are, generally, short-term commitments to third parties which are notdirectly dependent on the customer's creditworthiness. As at 31 December 2013, performance bonds and guarantees worth N47.3
billion (2012: N10.4 billion) are secured by cash while others are otherwise secured.
Usance and Letters of credit are agreements to lend to a customer in the future, subject to certain conditions. Such commitments areeither made for a fixed period, or have no specific maturity dates, but are cancellable by the Group (as lender) subject to noticerequirements. These Letters of credit are provided at market-related interest rates and cannot be settled net in cash. Usance and lettersof credit are secured by different types of collaterals similar to those accepted for actual credit facilities.
The amount of N 1,469.87 billion (2012: N 1,106.37 billion) represents the full amount of the Bank's guarantee for the assets held by itssubsidiary, Zenith Pensions Custodian Limited under the latter's custodial business as required by the National Pensions Commission.
2012
Interest charged on loans to related parties and interest and other fees paid to related parties are similar to what would be charged inan arms' length transaction. Loans granted to related parties are secured over real estate and other assets of the respective borrowers.No impairment has been recognised in respect of loans granted to related parties (2012: Nil).
Consolidated and Separate Financial Statements 31 December, 2013
Page 101
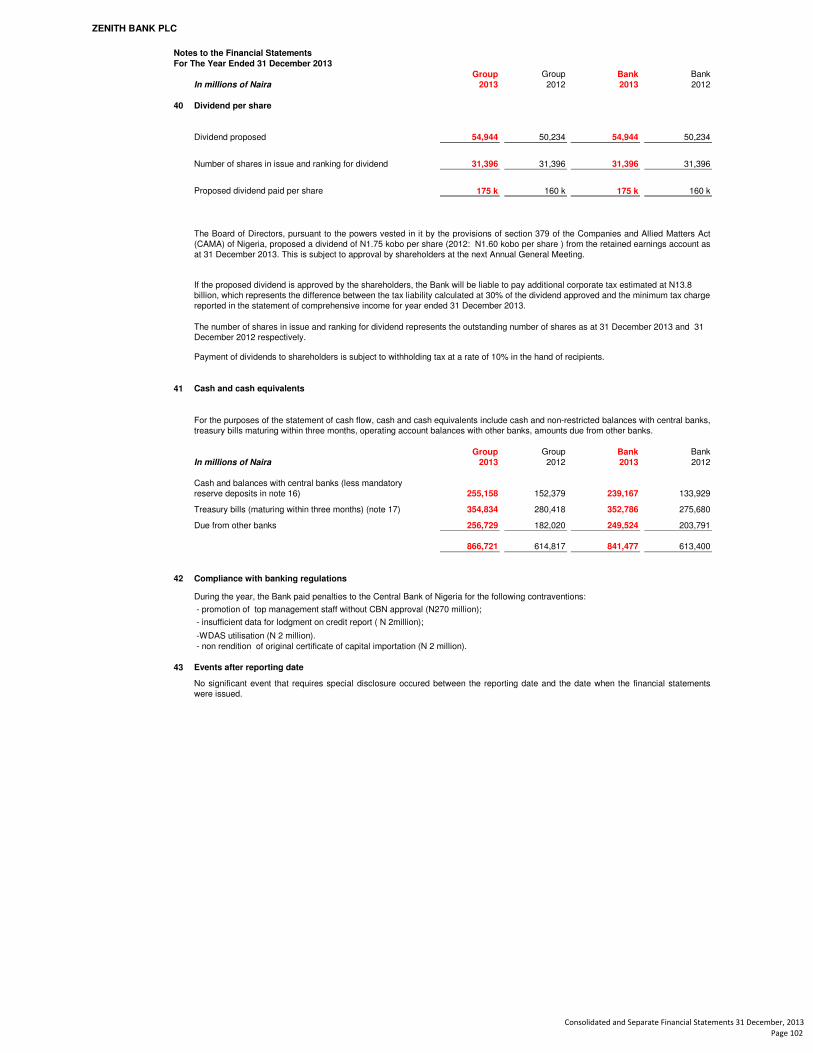
ZENITH BANK PLC
Notes to the Financial Statements
For The Year Ended 31 December 2013
Group Group Bank BankIn millions of Naira 2013 2012 2013 2012
40 Dividend per share
Dividend proposed 54,944 50,234 54,944 50,234
Number of shares in issue and ranking for dividend 31,396 31,396 31,396 31,396
Proposed dividend paid per share 175 k 160 k 175 k 160 k
Payment of dividends to shareholders is subject to withholding tax at a rate of 10% in the hand of recipients.
41 Cash and cash equivalents
Group Group Bank BankIn millions of Naira 2013 2012 2013 2012
255,158 152,379 239,167 133,929
Treasury bills (maturing within three months) (note 17) 354,834 280,418 352,786 275,680
Due from other banks 256,729 182,020 249,524 203,791
866,721 614,817 841,477 613,400
42 Compliance with banking regulations
43 Events after reporting date
For the purposes of the statement of cash flow, cash and cash equivalents include cash and non-restricted balances with central banks,treasury bills maturing within three months, operating account balances with other banks, amounts due from other banks.
No significant event that requires special disclosure occured between the reporting date and the date when the financial statementswere issued.
During the year, the Bank paid penalties to the Central Bank of Nigeria for the following contraventions:
- promotion of top management staff without CBN approval (N270 million);
- insufficient data for lodgment on credit report ( N 2million);
-WDAS utilisation (N 2 million). - non rendition of original certificate of capital importation (N 2 million).
Cash and balances with central banks (less mandatory reserve deposits in note 16)
The Board of Directors, pursuant to the powers vested in it by the provisions of section 379 of the Companies and Allied Matters Act(CAMA) of Nigeria, proposed a dividend of N1.75 kobo per share (2012: N1.60 kobo per share ) from the retained earnings account asat 31 December 2013. This is subject to approval by shareholders at the next Annual General Meeting.
The number of shares in issue and ranking for dividend represents the outstanding number of shares as at 31 December 2013 and 31 December 2012 respectively.
If the proposed dividend is approved by the shareholders, the Bank will be liable to pay additional corporate tax estimated at N13.8 billion, which represents the difference between the tax liability calculated at 30% of the dividend approved and the minimum tax charge reported in the statement of comprehensive income for year ended 31 December 2013.
Consolidated and Separate Financial Statements 31 December, 2013
Page 102

Other information
In millions of Naira
44 Value Added Statement (Group) December December2013 2,012
Group % Group %
Gross income 351,470 307,082
Interest expense
- Local (60,791) (59,636)
- Foreign (10,005) (4,925)280,674 242,521
Impairment charge for credit losses (11,176) (9,445)
269,498 233,076Bought-in materials and services
- Local (84,117) (68,747)
- Foreign (4,115) (3,663)
Value added 181,266 100 160,666 100
Distribution
Employees Salaries and benefits 59,952 33 47,200 29
Government Income tax 15,279 8 1,419 1
Retained in the Group Asset replacement (depreciation) 10,717 6 11,366 7
To pay proposed dividend 54,943 30 50,234 31
40,375 23 50,447 32
181,266 100 160,666 100
These statements represent the distribution of the wealth created through the use of the group's assets through its own andits employees' efforts.
Profit for the year (including statutory, small scale industry, contingency reserves and non-controlling interest)
Consolidated and Separate Financial Statements 31 December, 2013
Page 103

Other information
In millions of Naira
Value Added Statement (Bank)December December
2013 2012Bank % Bank %
Gross income 311,275 279,042
Interest expense
- Local (67,013) (64,628)
- Foreign (1,458) (724)242,804 213,690
Diminution in asset values (9,907) (7,998)
232,897 205,692
Bought-in materials and services
- Local (70,356) (56,323)
- Foreign (1,710) (632)
Value added 160,831 100 148,737 100
Distribution
Employees Salaries and benefits 56,864 35 44,565 30
Government Income tax 10,694 7 (1,755) (1)
Retained in the Bank
Asset replacement (depreciation) 9,859 6 10,124 7
To pay proposed dividend 54,943 34 50,234 34
28,471 18 45,569 30
160,831 100 148,737 100
These statements represent the distribution of the wealth created through the use of the bank's assets through its own andits employees' efforts.
Profit for the year (including statutory, and small scale industry reserves)
Consolidated and Separate Financial Statements 31 December, 2013
Page 104

Other information
In millions of NairaIFRS IFRS IFRS IFRS IFRS
45 FIVE-YEAR FINANCIAL SUMMARY 2013 2012 2011 2010 2009GROUP
AssetsCash and balances with central banks 603,851 332,515 223,187 141,724 126,779Treasury bills 586,441 669,164 510,738 298,858 231,530Due from other banks 256,729 182,020 234,521 399,478 341,830Derivative assets held for risk management 2,681Loans and advances 1,251,355 989,814 893,834 754,024 707,602Reinsurance assets and insurance receivables - - - 1,121 1,594Investment securities 303,125 299,343 308,231 211,804 158,922Investments in associates 165 420 1,756 2,443 2,443Deferred tax assets 749 432 186 1,657 966Other assets 36,238 28,665 25,510 20,457 22,353Assets classified as held for sale 30,454 31,943 52,482 - - Investment property - - 7,114 7,342 424Property and equipment 69,410 68,782 68,366 66,585 71,564Intangible assets 1,935 1,406 770 827 712
Total assets 3,143,133 2,604,504 2,326,695 1,906,320 1,666,719
LiabilitiesCustomers deposits 2,276,755 1,929,244 1,655,458 1,319,762 1,178,188Claims payable - - - 218 198Current income tax 7,017 6,577 13,348 3,735 7,407Deferred income tax liabilities 678 5,584 10,742 10,348 5,900Other liabilities 215,643 117,355 152,836 143,373 90,572Liabilities on insurance contracts - - - 2,287 2,161On-lending facilities 59,528 56,066 49,370 26,049 - Borrowings 60,150 15,138 21,070 28,358 36,402Liabilities classified as held for sale 14,111 11,584 29,603 - -
Total Liabilities 2,633,882 2,141,548 1,932,427 1,534,130 1,320,828
Net assets 509,251 462,956 394,268 372,190 345,891
EQUITY
Share capital 15,698 15,698 15,698 15,698 12,559Share premium 255,047 255,047 255,047 255,047 255,047Retained earnings 161,144 130,153 75,072 64,826 51,170Other reserves 73,347 58,786 45,765 34,202 24,800
Attributable to equity holders of the parent 505,236 459,684 391,582 369,773 343,576
Non-controlling Interest 4,015 3,272 2,686 2,417 2,315
Total shareholders' equity 509,251 462,956 394,268 372,190 345,891
STATEMENT OF COMPREHENSIVE INCOME
Gross earnings 351,470 307,082 243,948 193,286 279,307Share of profit / (loss) of associates 118 23 45 27 78 Interest expense (70,796) (64,561) (34,906) (35,719) (83,957) Operating and direct expenses (159,019) (130,999) (124,256) (102,503) (118,322) Impairment charge for credit losses (11,176) (9,445) (17,391) (4,977) (34,802)
Profit before tax 110,597 102,100 67,440 50,114 42,304
Income tax (15,279) (1,419) (18,736) (12,291) (16,255)
Profit after tax 95,318 100,681 48,704 37,823 26,049
Other comprehensive income:
Foreign currency translation differences (2,070) (2,424) (421) (507) 461Fair value movements on equity instruments 324 297 705 210 1,365
Related tax 890 (91) (211) (63) (530)
2,771 - - - -
Related tax (760) - - - -
1,155 (2,218) 73 (360) 1,296
Total comprehensive income 96,473 98,463 48,776 37,463 27,345
Effective portion of changes in fair value of cash flow hedges
Consolidated and Separate Financial Statements 31 December, 2013
Page 105

Other information
In millions of Naira IFRS IFRS IFRS IFRS IFRS
FIVE-YEAR FINANCIAL SUMMARY 2013 2012 2011 2010 2009BANK
ASSETS Cash and balances with central banks 587,793 313,546 211,098 130,604 115,044Treasury bills 572,598 647,474 494,253 287,981 222,787Due from other banks 249,524 203,791 246,364 374,604 290,025Loans and advances 1,126,559 895,354 827,035 707,586 677,760Investment securities 212,523 256,905 267,050 - 144,280Investment in subsidiaries 24,375 24,375 19,345 172,180 36,096Investments in associates 90 463 1,822 37,134 2,509Deferred tax assets - - - 2,509 - Other assets 31,415 16,814 17,616 - 21,593Assets classified as held for sale 4,749 10,338 10,838 15,402 - Investment property - - 7,114 6,895 - Property and equipment 67,364 66,651 65,877 63,000 68,106Intangible assets 1,703 1,175 661 784 712
Total assets 2,878,693 2,436,886 2,169,073 1,798,679 1,578,912
LIABILITIESCustomers deposits 2,079,862 1,802,008 1,577,290 1,290,014 1,114,271Current income tax 5,266 5,071 11,934 1,010 5,718Deferred income tax liabilities - 5,573 10,732 9,869 6,264Other liabilities 201,265 115,027 126,660 86,470 80,497On-lending facilities 59,528 56,066 49,370 26,049 - Borrowings 60,150 15,138 21,070 28,358 36,402
Total Liabilities 2,406,071 1,998,883 1,797,056 1,441,770 1,243,152
Net Assets 472,622 438,003 372,017 356,909 335,760
EQUITY
Share capital 15,698 15,698 15,698 15,698 12,559Share premium 255,047 255,047 255,047 255,047 255,047Retained earnings 126,678 106,010 55,028 51,769 43,365Other reserves 75,199 61,248 46,244 34,395 24,789
Total shareholders' equity 472,622 438,003 372,017 356,909 335,760
STATEMENT OF COMPREHENSIVE INCOME
Gross Earnings 311,275 279,042 214,980 168,415 255,264Interest expense (68,471) (65,352) (33,407) (34,522) (82,836)Operating and direct expenses (138,789) (111,644) (108,529) (89,107) (103,338)Impairment charge for credit losses (9,907) (7,998) (15,900) (3,317) (32,217)
Profit before tax 94,108 94,048 57,144 41,469 36,873
Income tax (10,694) 1,755 (15,843) (9,164) (14,940)
Profit after tax 83,414 95,803 41,301 32,305 21,933
Other comprehensive income:
Fair value movements on equity instruments 549 15 705 210 2,012Tax effect of equity instruments at fair value 890 (5) (211) (63) (604)
1,439 10 494 147 1,408
Total comprehensive income 84,853 95,813 41,795 32,452 23,341
Consolidated and Separate Financial Statements 31 December, 2013
Page 106