
ZEBRAMIP CPT HPT SHORT.ppt - NEWMOA · Vi dl td i ECDdt f tMIP j t AView model was created using...
51
ZEBRA ENVIRONMENTAL MIP/EC ZEBRA ENVIRONMENTAL •DIRECT SENSING •SAMPLING •INSTALLATION •INJECTIONS
Transcript of ZEBRAMIP CPT HPT SHORT.ppt - NEWMOA · Vi dl td i ECDdt f tMIP j t AView model was created using...

ZEBRA ENVIRONMENTAL MIP/EC
ZEBRA ENVIRONMENTAL
•DIRECT SENSING
•SAMPLING
•INSTALLATION
•INJECTIONS

ZEBRA ENVIRONMENTAL MIP/EC
What is the Membrane Interface Probe?
The Membrane Interface Probe (MIP) is rapid, high-resolution field screening technology that provides information about relative concentrations of VOCs intechnology that provides information about relative concentrations of VOCs in the subsurface, and the Electrical Conductivity of the soil.
The MIP uses a thin film fluorocarbon polymerThe MIP uses a thin film fluorocarbon polymer membrane approx. 6.35mm in diameter which stays in direct contact with the soil during MIP logging.
Th thi fil b i i t d i t•The thin film membrane is impregnated into a stainless steel screen which serves as a rigid support for the fluorocarbon polymer.•The down-hole, permeable membrane serves as an interface to a detector at the surface.•Volatiles in the subsurface are getting transferred across the membrane and partition into a stream of carrier gas where they are swept to the detector. The membrane is heated in order to facilitate VOC transfer and self cleaningto facilitate VOC transfer and self-cleaning.

THE SYSTEM
ZEBRA ENVIRONMENTAL MIP/EC
THE SYSTEM

Fl I i ti D t t
ZEBRA ENVIRONMENTAL MIP/EC
Flame Ionization DetectorAir/H2
• Organic analytes are pyrolyzed in i / flFlame an air/H2 flame
• Ions are produced in the plasma d th flaround the flame
– proportional to number of carbons presentp
• Positive voltage is applied to collector; negative to the flame b dbody
• Ions migrate to collector producing a current (signal)a current (signal)
Rubinson and Rubinson (2000)

ZEBRA ENVIRONMENTAL MIP/EC
Photoionization Detector
• An UV source ionizes all the molecules in the column effluent
• Ions produced are collectedcollected resulting in a current flowcurrent flow
El C D
ZEBRA ENVIRONMENTAL MIP/EC
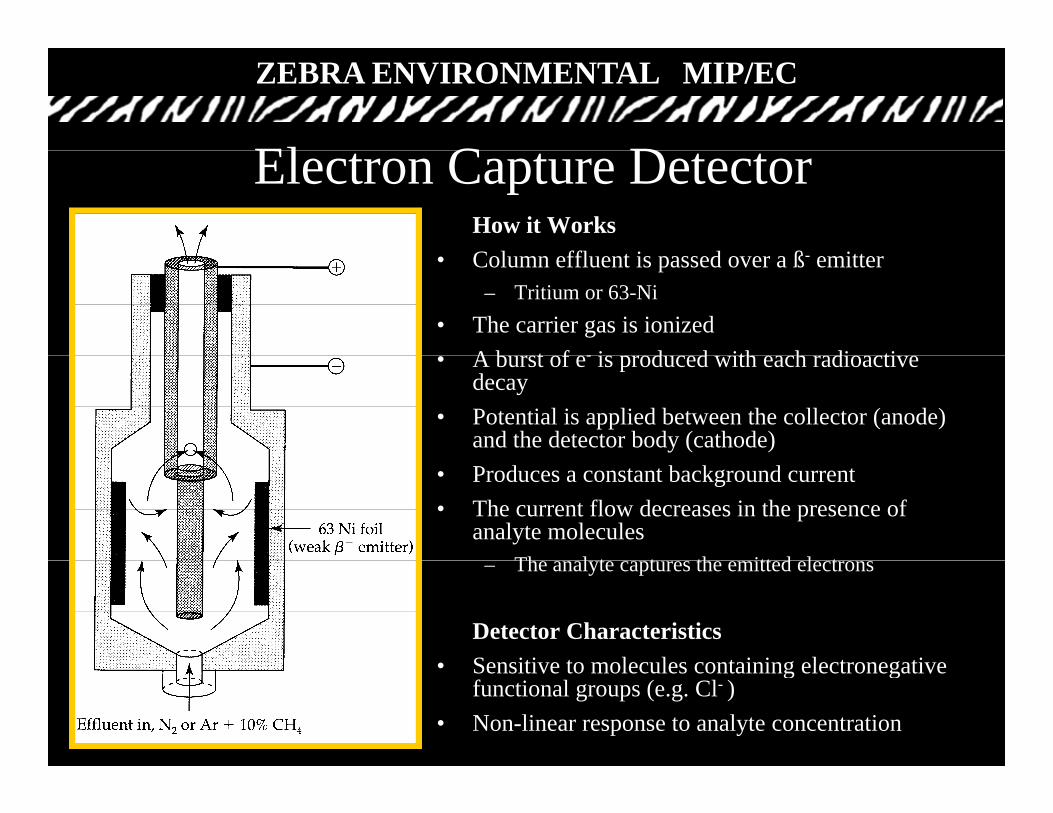
Electron Capture DetectorHow it WorksC l ffl i d ß i• Column effluent is passed over a ß- emitter
– Tritium or 63-Ni• The carrier gas is ionized
A b t f i d d ith h di ti• A burst of e- is produced with each radioactive decay
• Potential is applied between the collector (anode) and the detector body (cathode)
• Produces a constant background current• The current flow decreases in the presence of
analyte moleculesTh l t t th itt d l t– The analyte captures the emitted electrons
Detector Characteristics• Sensitive to molecules containing electronegative• Sensitive to molecules containing electronegative
functional groups (e.g. Cl- )• Non-linear response to analyte concentration

MIP DIRECT SENSING
MIP Detection Limits
MIP DETECTORSMIP DETECTORS
Contaminates Detection Limit Carrier GasContaminates Detection Limit Carrier Gas
PID BTEX 1 PPM Nitrogen, Helium
FID Methane, Butane NA Nitrogen, Helium
ECD Chlorinateds 250PPB Nitrogen

THE MIP SYSTEM SIDE
ZEBRA ENVIRONMENTAL MIP/EC
THE MIP SYSTEM SIDE
Rods
GeneratorGenerator

P d ti t 150’ t 300’ d
ZEBRA ENVIRONMENTAL MIP/EC
Production rates: 150’ to 300’ per day.
The production rate of the MIP is affected by :
• the number of logging locations• the depth of loggingp gg g• subsurface conditions• access restrictions• access restrictions• probe hole abandonment requirements• weather
MIP DIRECT SENSING
MIP LOGGINGMIP LOGGING

MIP DIRECT SENSING
Pre Log Response

MIP DIRECT SENSING
Example of a Microsoft Excel Spreadsheet graphically displaying FID/PID/ECD and Conductivity Logs.

MIP DIRECT SENSING
Post Log Response

Th G t
ZEBRA ENVIRONMENTAL MIP/EC
The Gator

ZEBRA ENVIRONMENTAL MIP/EC
Gator In Action

ZEBRA ENVIRONMENTAL CPT/MIP

ZEBRA ENVIRONMENTAL CPT/MIP
Cone Penetration Testing (CPT)

ZEBRA ENVIRONMENTAL CPT/MIP
CPT/MIPCPT is (Cone Penetration Testing) commonly used to ( g) ydetermine the subsurface stratigraphy in-situ and to estimate geotechnical parameters of the materials present in the subsurface.
•Efficiency of technology (lightweight, mobile)Efficiency of technology (lightweight, mobile) •Innovative cone penetration technique •Repeatable penetration results•Cost savings over more traditional boring and sampling methods

CPT/MIP
ZEBRA ENVIRONMENTAL CPT/MIP
CPT/MIP

ZEBRA ENVIRONMENTAL CPT/MIP
CPT/MIP Unit

ZEBRA ENVIRONMENTAL CPT/MIP
CPT/MIP Anchoring

ZEBRA ENVIRONMENTAL CPT/MIP
Sl
Tip Pressure
Sleeve Friction
LithologyDescription FrictionDescription Friction
Ratio
Pore Pressure
CPT Response Graph

ZEBRA ENVIRONMENTAL CPT/MIP

ZEBRA ENVIRONMENTAL DATA INTEGRATION
SHAREPOINT WEBSITE FOR DATA SHARING

ZEBRA ENVIRONMENTAL DATA INTEGRATION
Installed MW overlay ECD Background Slice
S li E DSampling Event DataLithologyOverlay
ECD Graph Overlay
Cross-section from a 2D ECD Fence Slice.

ZEBRA ENVIRONMENTAL DATA INTEGRATION
Using 3D modeling software, we can generate true 3D Solid Models. This Plan Vi d l t d i ECD d t f t MIP j t AView model was created using ECD data from a recent MIP project . Any orientation can be displayed and cross-sections or fence diagrams can be created.

ZEBRA ENVIRONMENTAL DATA INTEGRATION
3D ECD Fence Model

ZEBRA ENVIRONMENTAL DATA INTEGRATION
3D ECD Solid Plume Model

ZEBRA ENVIRONMENTAL
New HPT

ZEBRA ENVIRONMENTAL HPT
New direct push technologies
•HPT Logging•Rhode Island•Rhode Island

Hydraulic Profiling Components
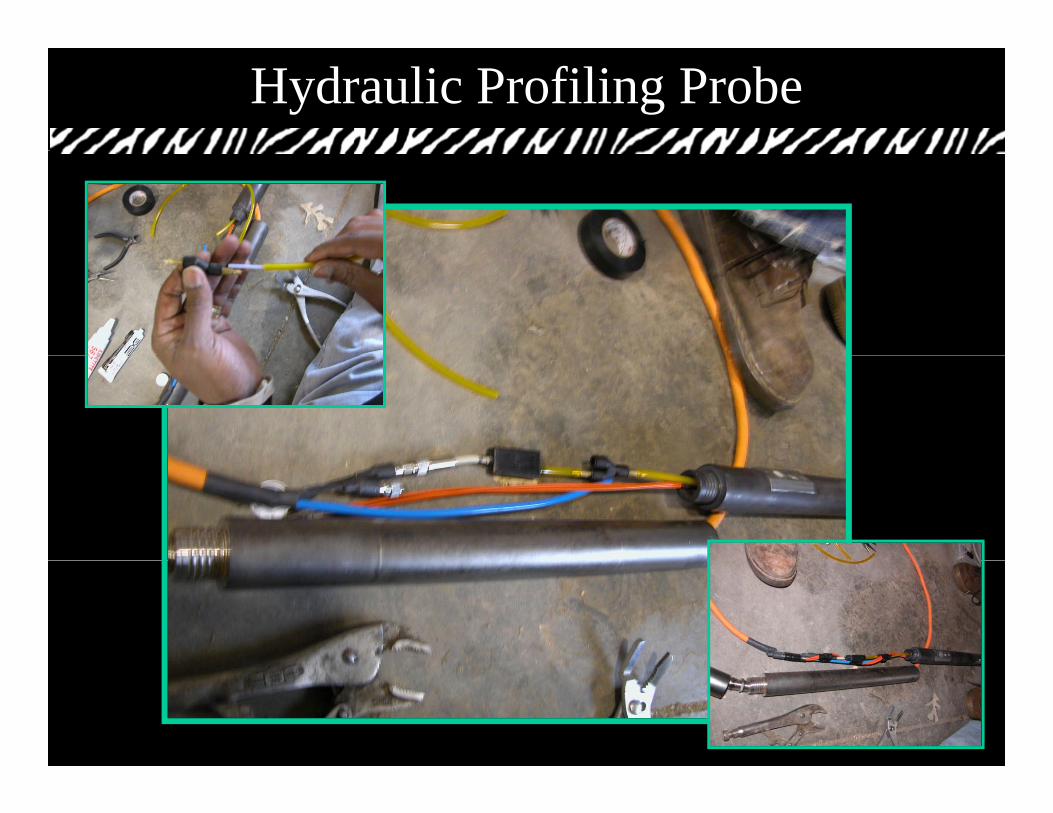
Hydraulic Profiling Probe

Hydraulic Profiling Tool (HPT)

Hydraulic Profiling Tool (HPT)
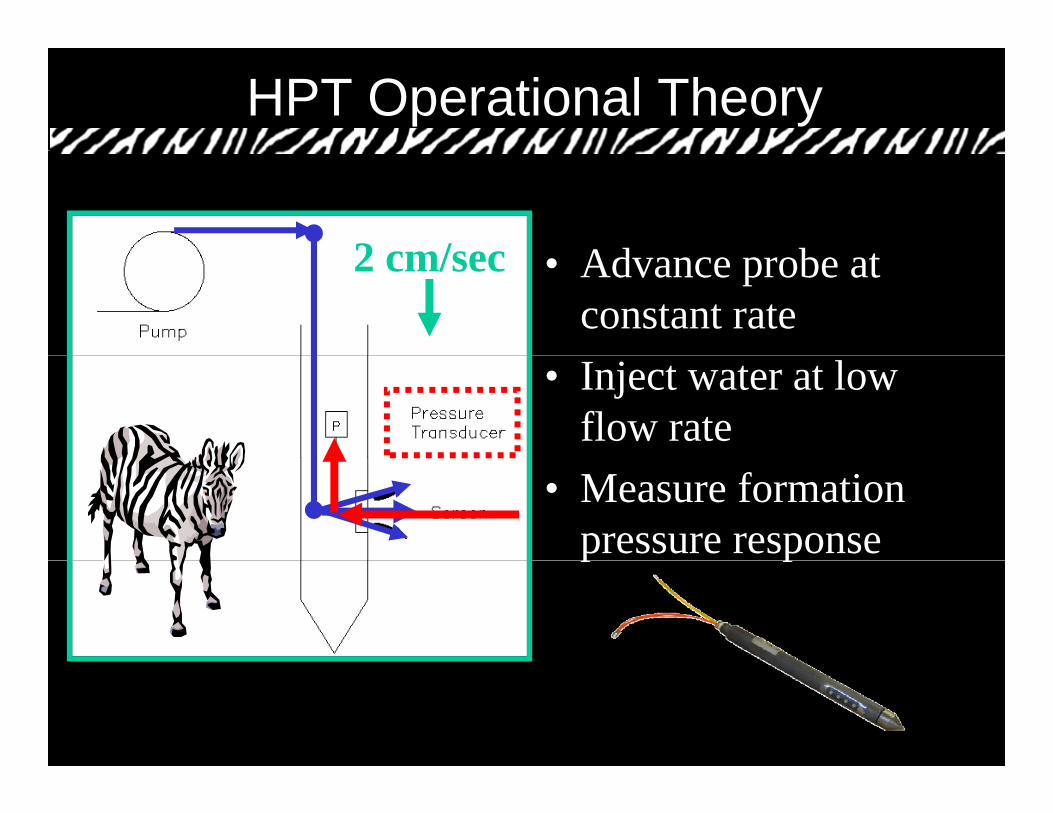
HPT Operational Theory
Ad b t2 cm/sec • Advance probe at constant rate
2 cm/sec
• Inject water at low flow rate
• Measure formation pressure responsep p

HPT Conductivity KDHE1 - 5th and Pine - Salina, KS - 4/6/06
100 120
60
70
80
90
uctiv
ity
80
100
(psi
)
30
40
50
60
ectri
cal C
ondu
(mS/
m)
40
60
HPT
Pre
ssur
e
0
10
20
30
Ele
0
20
H
0 5 10 15 20 25 30 35 40 45 50 55 60 65 70
Depth (ft)Electrical Conductivity (mS/m) HPT Pressure (psi)

HPT PressureKDHE2 - 5th and Pine - Salina, KS - 4/7/06
100 120
60
70
80
90
uctiv
ity
80
100
(psi
)
30
40
50
60
ctric
al C
ondu
(mS/
m)
40
60
HPT
Pre
ssur
e
0
10
20Elec
0
20
H
0 5 10 15 20 25 30 35 40 45 50 55 60 65 70
Depth (ft)Electrical Conductivity (mS/m) HPT Pressure (psi)

Dissipation Test
SWL = Depth – Static Pressure
Dissipation Test
52ft – 21psi = 31ft
Fl 0Depth
52ft
Flow = 0ROP = 0
21psiStatic Pressure

Static Water Level KDHE3 - 5th and Pine - Salina, KS - 4/11/06
100 120
7080
90
vity
(mS/
m)
80
100
(psi
)
30
405060
cal C
ondu
ctiv
40
60
PT P
ress
ure
010
2030
Elec
tric
0
20
HP
0 5 10 15 20 25 30 35 40 45 50 55 60 65 70Depth (ft)
Electrical Conductivity (mS/m) HPT Pressure (psi)
SWL = Depth – Static Pressure

HPT SOLUTIONS
DPT InjectionInjection WellsMW Wells31 ft
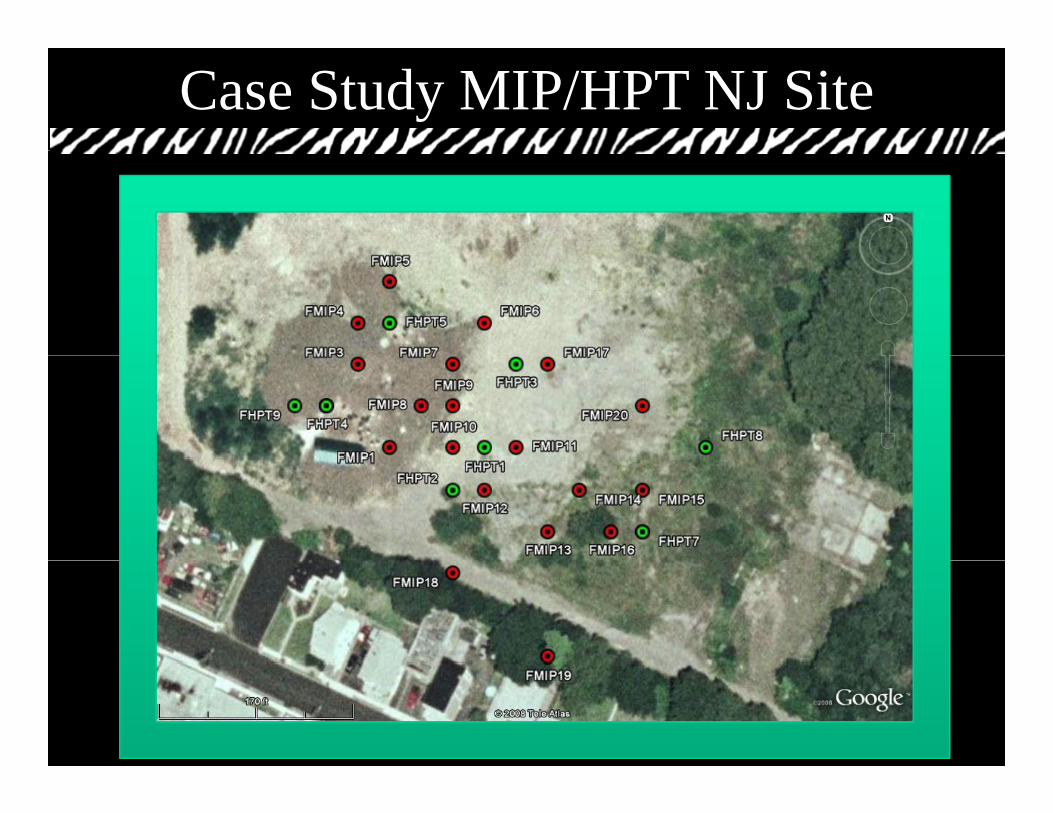
Case Study MIP/HPT NJ Site

Case Study MIP/HPT NJ Site
MIP LOG

Case Study MIP/HPT NJ Site
HPT LOG

Case Study MIP/HPT NJ Site

Case Study MIP/HPT NJ Site

Case Study - HPT VA Site
HPT VA SITE

Case Study - HPT VA Site
Flow – ZeroFlow Zero
Pressure – High
EC SandEC – Sand
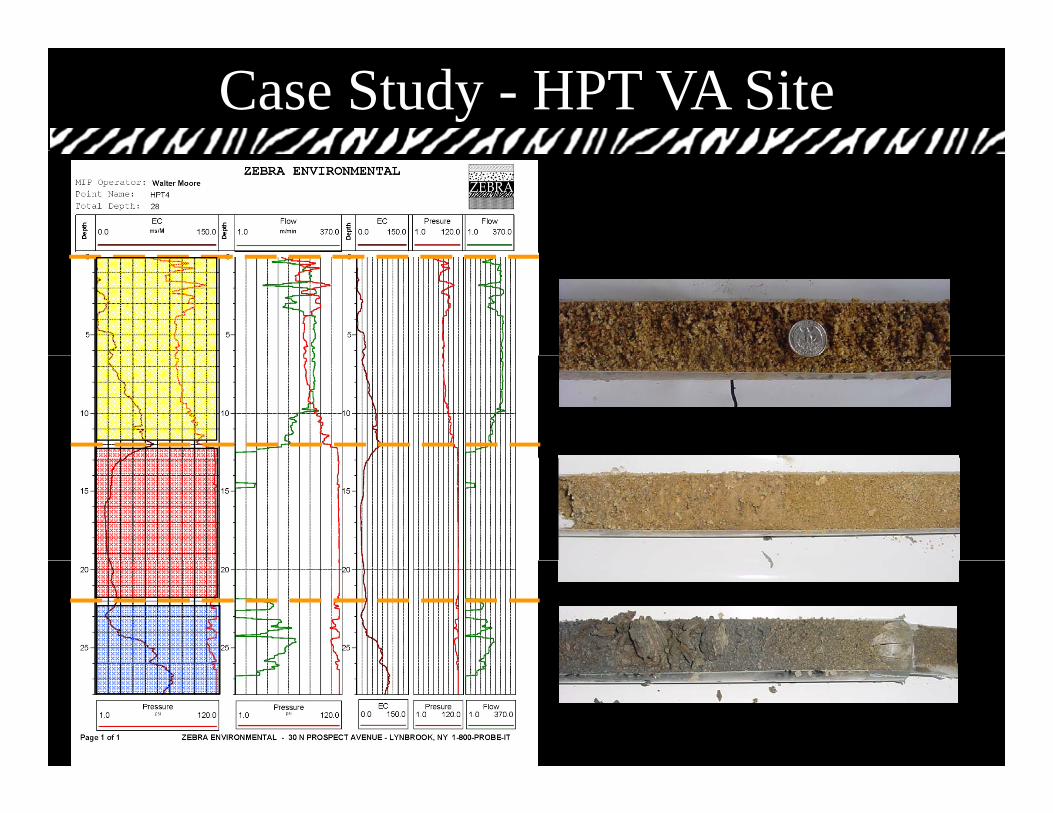
Case Study - HPT VA Site

Case Study - HPT VA Site
Different Radius of Influenceof Influence

Example – Tampa Bay Site

For more information about the
MIP DIRECT SENSING
1-800-PROBE-IT
For more information about the Membrane Interface Probe:
www.TeamZEBRA.com
ZEBRA Environmental Corporation 2007


![Educ Reform short.ppt [Read-Only] · -0.2 0.0 0.2 Mean Z score Clear goals ... physical chemistry ethics pharmacognosy phytochemistry drug design immunology ... MCQ / Exams From UG](https://static.fdocuments.us/doc/165x107/5b183c6c7f8b9a2d258b9b24/educ-reform-shortppt-read-only-02-00-02-mean-z-score-clear-goals-.jpg)

![PathophysiologyPathophysiology of of the Ed i S … · PathophysiologyPathophysiology of of the Ed i S tEndocrine System ... Struma ovarii. 21 ... Endocrine 2012 [Eng] short.ppt [Compatibility](https://static.fdocuments.us/doc/165x107/5b7b84c37f8b9a184a8ccb0a/pathophysiologypathophysiology-of-of-the-ed-i-s-pathophysiologypathophysiology.jpg)


![Marinov - Endocrine 2016 [Eng] short.ppt · Struma ovarii. 21 The adrenal glands ... Microsoft PowerPoint - Marinov - Endocrine 2016 [Eng] short.ppt [Compatibility Mode] Author: User](https://static.fdocuments.us/doc/165x107/5b7b84c37f8b9a184a8ccafa/marinov-endocrine-2016-eng-short-struma-ovarii-21-the-adrenal-glands-.jpg)
