Zanchettin, Piercarlo (2005) Essays on competition...
130
Zanchettin, Piercarlo (2005) Essays on competition, innovation and growth. PhD thesis, University of Nottingham. Access from the University of Nottingham repository: http://eprints.nottingham.ac.uk/11842/1/415617.pdf Copyright and reuse: The Nottingham ePrints service makes this work by researchers of the University of Nottingham available open access under the following conditions. This article is made available under the University of Nottingham End User licence and may be reused according to the conditions of the licence. For more details see: http://eprints.nottingham.ac.uk/end_user_agreement.pdf For more information, please contact [email protected]
Transcript of Zanchettin, Piercarlo (2005) Essays on competition...

Zanchettin, Piercarlo (2005) Essays on competition, innovation and growth. PhD thesis, University of Nottingham.
Access from the University of Nottingham repository: http://eprints.nottingham.ac.uk/11842/1/415617.pdf
Copyright and reuse:
The Nottingham ePrints service makes this work by researchers of the University of Nottingham available open access under the following conditions.
This article is made available under the University of Nottingham End User licence and may be reused according to the conditions of the licence. For more details see: http://eprints.nottingham.ac.uk/end_user_agreement.pdf
For more information, please contact [email protected]

ESSAYS ON COMPETITION, INNOVATION AND GROWTH
By
PIERCARLO ZANCHETTIN
Thesis submitted to the School of Economics
University of Nottingham
for the degree of Doctor of Philosophy
May 2005 ; 1.0 Gil,
Abstract
The thesis collects four essays in the fields of competition and innovation economics. In chapter 1, we review the recent growth literature that analyses the effects of product
market competition on growth. Contrary to the negative effect predicted by the early
endogenous growth models, this literature emphasises that product market competition
may foster innovation and growth. We argue that a common characteristic of this literature
is a decrease in the intensity of technological competition relative to the early models, which
seems to support the positive link between product market competition and growth.
In chapter 2, we study the effect of product market competition on growth in an endoge-
nous growth model that maintains the intensity of R&D competition of the early models.
We extend the early models by accounting for the possibility that many asymmetric firms
(i. e. successive innovators) are simultaneously active in each industry. We show that an in-
crease in competitive pressure exerts two positive effects on the incentive to innovate, which
contrast the negative effect due to lower prices: the productive efficiency effect and the front
loading of profits. We demonstrate circumstances in which the productive efficiency effect
dominates the price effect, leading to a positive link between competition and growth.
In chapter 3, we reconsider the comparison between Bertrand and Cournot competition
in a differentiated duopoly with asymmetric costs. Our main finding is that, with high
degrees of cost asymmetry and/or low degrees of product differentiation, the efficient firm's
and the industry profits are higher under Bertrand competition. This contrasts with Singh
and Vives (1984) seminal result that, with substitute goods, equlibrium profits are always
higher with Cournot competition.
In chapter 4, we study vertical integration and product innovation as interdependent
strategic choices of vertically related firms. Our main finding is that, although product dif-
ferentiation allows to soften product market competition and to avoid market foreclosure,
the downstream market may prefer less product differentiation to prevent vertical integra-
tion. Therefore, less product innovation can be a possible social cost of a lenient antitrust
policy.

Acknowledgements
I am grateful to my supervisors, Marta Aloi and Martin Sefton, for their guidance and
support over the last four years of my academic career. I am also particularly thankful to
my co-authors, Vincenzo Denicolö and Arijit Mukherjee, for having broadened my interests
and knowledge of economics. Special thanks go to Joanna Poyago Theotoky and Claudio
Zoli for their useful comments and suggestions. I am in debt with the School of Economics of
Nottingham University for having hosted me and financed my studies. Finally, my greatest
thanks go to Simona, for her love, patience and support over these long four years. Any
fault or imprecision in the thesis is my own responsibility.
11

Author's declaration.
Chapter 2 has been published in the 2004 University of Leicester Discussion Paper Series
in Economics. It has been presented at the 2002 EARIE annual conference (Madrid), and
at the 2003 GEP Postgraduate Conference (Nottingham).
Chapter 3 has been presented at the 2004 EARIE annual conference (Berlin), and at the
2004 ATINER international conference on Industrial Organization and Law and Economics
(Porto Carras, Greece). A previous version has been published in the 2003 University of
Nottingham Discussion Paper Series in Economics.
Chapter 2 is joint work with Vincenzo Denicolö. Chapter 4 is joint work with Arijit
Mukherjee. Each author has equally contributed with me in elaborating each of these
chapters.
111

TABLE OF CONTENTS
Introduction
Chapter 1
Competition, innovation and growth: a critical survey of the literature
1. Introduction
2. The "standard" model
3. The multi-sector version of the standard model
4. Agency costs models
5. Models with research and development
6. Models with tacit knowledge ("internal" accumulation of knowledge)
6.1. The step-by-step models
6.2. The quality-variety models
7. Conclusions
Chapter Pion
eid growth in a Neo-Schumpeterian model
1. Introduction
2. Related literature
2.1. The industrial organization literature
2.2. The growth literature
3. The incentive to innovate with sequential innovations
4. Intensity of competition and incentive to innovate
4.1. Preliminaries
4.2. Bertrand and Cournot competition
4.3. A reduced-form model
4.4. The productive efficiency effect
4.5. Competition and industry profits
4.6. Competition and the distribution of profits
1
6
6
7
11
13
15
16
17
21
22
24
24
27
27
29
30
33
34
34
35
37
39
42
iv

5. A growth model 43
5.1. Preferences and technology 44
5.2. Technical progress 45
5.3. Steady State 45
5.4. Equilibrium in the product market 46
5.5. Equilibrium in the research industry 48
5.6. Competition and growth 49
6. Concluding remarks 52
6.1. Persistent leadership 53
6.2. Patent licensing 53
6.3. Welfare 54
6.4. Alternative measures of the intensity of competition 54
Appendix 57
Chapter 3
Differentiated duopoly with asymmetric costs: new results from a seminal model 62
1. Introduction 62
2. The model 65
2.1. The relevant parameter space 66
2.2. Cournot competition 68
5.3. Bertrand competition 68
3. Comparison of Bertrand and Cournot equilibria 70
4. Product differentiation and the market leader's profit 75
5. Conclusions 77
Appendix 80
Chapter 4
Vertical integration and product innovation 85
1. Introduction 85
V

2. The model 88
3. The market stage 91
3.1. Vertical integration and market foreclosure 94
4. The vertical integration game 95
5. Vertical integration and product innovation 100
6. A new welfare loss from vertical integration 111
7. Conclusions 112
Appendix 114
Bibliography 116
vi

Introduction
The thesis consists of a collection of essays in the fields of competition and innovation
economics. Although each chapter presents an autonomous contribution to the topic, the
content of the first three chapters arises from the same line of research, focusing on the
effect of product market competition on innovation and growth. ' The fourth chapter con-
centrates on vertical integration as an alternative source of competition that can affect
product innovation in vertically related markets.
The first chapter revisits the recent growth literature which analyses the effects exerted by
the intensity of competition in innovative good markets on economic growth. Contrary to
the conclusions of early neo-schumpeterian models ("standard" models in the sequel), this
literature emphasises that product market competition may foster growth by enhancing
the pace of technical progress. These works aim at reconciling the endogenous growth
theory with the available empirical evidence, suggesting a positive relationship between the
intensity competition and the intensity of innovation at firm and industry levels.
The survey starts by considering how the issue is addressed in the standard models,
whose main conclusion is that tougher competition is detrimental to growth since it erodes
the innovator's prospective monopoly rents. In these models, the combination of intense
technological competition (i. e. free-entry patent races with leapfrogging of the technological
leader) and drastic innovations leads to a monopoly in the product market at each stage
of the technical progress. As a consequence, an explicit analysis of different modes or
degrees of competition in the product market is inhibited, and the argument for a negative
relationship between competition and growth rests on the assumption that profit erosion is
the dominant effect of a more intense competition in the product market.
Next, we group the subsequent works according to the main variation they introduce on
the "standard setting": agency costs in the decision process of the innovative firms and
' Although chapter 3 deals with a classical problem of oligopoly theory (i. e. the comparison between price
and quantity competition in a differentiated duopoly), the issue springs directly from our findings along the
line of research above.
1

deterministic R&D technology (agency cost models); separation of research from develop-
ment activities and flexibility issues in the implementation of new technologies (research
and development models); tacit knowledge and internal accumulation of the new knowledge
within the innovative firm (step-by-step and quality-variety models).
We concentrate on the image of the innovative process offered by each group of models
relative to the highly competitive environment in the R&D activities provided by the stan-
dard models. Our main conclusion is that, in all groups of models reviewed, a reduction in
the intensity of technological competition supports the positive relationship between prod-
uct market competition and growth. Hence, an explicit analysis of the effect of product
market competition on growth within the framework of intense technological competition
which characterises the standard models is an issue left open by this literature.
The model we present in chapter 2 aims at filling this gap in the literature. We analyses
the relationship between competition and growth without making any special assumption on
the innovative process relative to the standard models. We employ a standard leapfrogging
model, with profit maximising firms and immediate disclosure of the knowledge embodied
in new technologies and protected by patents.
The basic idea of the model is to assume non-drastic innovations to create the scope for
oligopolistic competition in the product market among successive innovators, and model
the notion of higher competition by a switch from Cournot to Bertrand competition. We
also consider a more general (reduced-form) model of product market competition which
encompasses Bertrand and Cournot equilibria as special cases, and yields a continuous index
of the intensity of competition. Our model extends the early endogenous growth models by accounting for the possibil-
ity that in each period many asymmetric firms are simultaneously active in the market,
what makes it possible an explicit analysis of the effects of the intensity of competition on
growth. Furthermore, by assuming that innovation is sequential and cumulative, we also
extend previous works in industrial organization which analyse the effects of product market
competition in a single innovation framework.
Our main findings are that a rise in the intensity of competition fosters innovation and
2

growth when innovations are large and/or competition is initially strong. Therefore, we ar-
gue that the conclusion drawn by the standard models crucially depends upon the assump-
tion that the erosion of the innovator's rents is always the dominant effect of competition.
Indeed, by reducing the equilibrium prices, a more intense competition exerts a downward
pressure on industry profits, and hence on the innovator's prospective rents. However, when
competition involves asymmetric firms (due to cumulative innovation and intellectual prop-
erty rights) which remain active in the product market for more than one period (due to
non-drastic innovations), two qualitatively new effects arise. First, more competition re-
duces the market share of the less productive firms, which reduces the total industry costs
and counteracts the negative effect on industry profits exerted by lower prices. Second, in
more competitive markets, a larger fraction of each innovator's rents accrues in the early
stages of the innovative firm's life cycle. Both effects strengthen the incentive to innovate,
and prevail on the opposite effect due the decrease in prices when the degree of asymmetry
among firms is high (due to large innovations) and/or the intensity of competition in the
market is initially high.
Although achieved in a macro-growth setting, the findings of chapter 2 highlight the
following microeconomic result: in a homogeneous duopoly with linear-asymmetric cost
functions, industry profits are higher under Bertrand than under Cournot competition when
the efficiency gap between the two firms is sufficiently high. In contrast, a basic result in
the oligopoly theory by Singh and Vives (1984) states that, in a differentiated duopoly with
linear-asymmetric cost functions, both firms earn higher profits under Cournot than under
Bertrand competition when products are substitutes.
In chapter 3 we re-consider the comparison between price and quantity competition in the
Singh and Vives (1984) model. We find that the Singh and Vives's result is conditional on
a parametric restriction along the dimension of cost asymmetry. Removing this restriction,
our result of chapter 2 generalises to the standard model of a differentiated duopoly with
linear demand and cost functions. More precisely, the equilibrium profit of the efficient
firm and the industry profit are higher under Bertrand than under Cournot competition
when the cost asymmetry is sufficiently high and/or the degree of product differentiation is
3

sufficiently low.
The intuition of this result is based on the composition of the price and the selection
effects associated with a switch from Cournot to Bertrand competition. The equilibrium
prices are lower under Bertrand competition (price effect), and this works towards lower
profits for both firms under this form of competition. However, also the market share of
the inefficient firm is lower under Bertrand competition (selection effect), and this works on
the efficient firm's profit in the opposite direction relative to the price effect. Moreover, the
price effect weakens while the selection effect gets stronger when either the degree of cost
asymmetry increases (given any degree of product differentiation) or products are closer
substitutes (for a sufficient degree of cost asymmetry). As a result, the efficient firm earns
higher profits under price than under quantity competition when its efficiency advantage
over the rival is sufficiently high and products are close substitutes. Finally, the selection
effect entails more productive efficiency under price than under quantity competition, which
explains the reversal of the industry profit ranking.
Whilst the previous chapters focus on product market competition, in the final chapter we
concentrate on another source of competition that can affect product innovation in vertically
related markets, i. e. the competitive threat of vertical integration. We consider product
innovation in the downstream market as a strategic device of downstream firms facing
a threat of vertical integration and market foreclosure by an upstream monopolist. We
examine how product innovation affects the upstream firm's incentive to vertically integrate
and foreclose the downstream market, and how the possibility of vertical integration impacts
on the downstream firms' incentive to innovate.
The chapter is therefore related with two streams of literature: the literature on vertical
integration, and the literature on product innovation. Our main innovation relative to the
first literature is that we consider product innovation as a non-productive strategic deci-
sion of the downstream firms, showing its impact on the incentives for vertical integration
and market foreclosure. Our main innovation relative to the second literature is that, be-
sides product market competition, we account for another source of competition capable of
affecting product innovation.
4

In our model, product innovation takes the form of horizontal product differentiation,
which allows to soften competition in the final product market. Furthermore, we show
that, by differentiating products, the downstream firms can eliminate market foreclosure
in the eventuality of vertical integration. However, product innovation may foster the
upstream firm's incentive to vertically integrate, which helps him to extract more rent
from the downstream firms. In fact, we prove that both high and low degrees of product
differentiation in the downstream market strengthen the upstream monopolist's incentive
to vertical integrate. With strongly differentiated products, the gain from integration is
higher because double marginalisation is avoided in a wider market. On the other hand,
poorly differentiated products make the gain from integration higher since the integrated
firm can better exploit its competitive advantage over the un-integrated downstream firm.
As a consequence, the downstream firms have a strategic incentive to target intermediate
degrees of product differentiation in order to prevent vertical integration.
We show circumstances in which the strategic incentive to prevent vertical integration
prevails over the gain from softening product market competition, and refrains the down-
stream firms from investing in socially valuable innovations leading to higher degrees of
product differentiation. We therefore point out that less product innovation in the final
product market can be a possible social cost of a lenient antitrust policy which allows
vertical integration.
5

Chapter 1 Competition, innovation, and growth: a critical survey of the
literature
1. INTRODUCTION
Modern growth theory identifies the technical progress driven by private incentives to in-
novate as the main engine for growth in developed economies. The capacity of the economic
and institutional systems to promote private innovative activities has come to the spotlight
of both theoretical and empirical literature.
Besides the legal protection of the intellectual property rights, recent literature has fo-
cused on the relationship between the intensity of product market competition, on one hand, and the pace of the innovative process and growth, on the other hand. In particular,
whilst earlier neo-schumpeterian models of endogenous growth ("standard models" in the
sequel) tend to conclude that product market competition is detrimental to growth since
it erodes innovators' prospective monopoly rents, recent theoretical works emphasise that
more intense competition may stimulate innovation and growth. '
This chapter offers a critical survey of this literature. Starting from the "standard" neo-
schumpeterian models (sections 2 and 3), we group the subsequent contributions according
to the main variations they introduce on the setting of the standard models. We focus on
the image of the innovative process offered by each class of models relative to the highly
competitive environment of the R&D activities which characterises the standard models.
This offers the reading key of the survey. In each class of models under study, a reduc-
tion in the intensity of technological competition supports the result that a more intense
competition in the product market can be beneficial to growth. 'The attention of the theoretical literature towards a positive link between competition and growth has
been stimulated by empirical evidence suggesting that firms tend to intensify their innovative activities
in more competitive environments (see Blundell, Griffiths and van Reenen, 1995 and 1999; Nickell, 1996;
Aghion, Blundell, Bloom and Griffiths, 2001).
6

Chapter 1
Competition, innovation, and growth: a critical survey of the literature
1. INTRODUCTION
Modern growth theory identifies the technical progress driven by private incentives to in-
novate as the main engine for growth in developed economies. The capacity of the economic
and institutional systems to promote private innovative activities has come to the spotlight
of both theoretical and empirical literature.
Besides the legal protection of the intellectual property rights, recent literature has fo-
cused on the relationship between the intensity of product market competition, on one
hand, and the pace of the innovative process and growth, on the other hand. In particular,
whilst earlier neo-schumpeterian models of endogenous growth ("standard models" in the
sequel) tend to conclude that product market competition is detrimental to growth since
it erodes innovators' prospective monopoly rents, recent theoretical works emphasise that
more intense competition may stimulate innovation and growth. '
This chapter offers a critical survey of this literature. Starting from the "standard" neo-
schumpeterian models (sections 2 and 3), we group the subsequent contributions according
to the main variations they introduce on the setting of the standard models. We focus on
the image of the innovative process offered by each class of models relative to the highly
competitive environment of the R&D activities which characterises the standard models.
This offers the reading key of the survey. In each class of models under study, a reduc-
tion in the intensity of technological competition supports the result that a more intense
competition in the product market can be beneficial to growth. 'The attention of the theoretical literature towards a positive link between competition and growth has
been stimulated by empirical evidence suggesting that firms tend to intensify their innovative activities
in more competitive environments (see Blundell, Griffiths and van Reenen, 1995 and 1999; Nickell, 1996;
Aghion, Blundell, Bloom and Griffiths, 2001).
6
Technological competition is formalized according to the tournament model of patent
races with free entry. At each stage of the technical progress, a stochastic R&D technology
links the instantaneous probability that the next innovation arrives (i. e. the hazard rate)
to the aggregate investment in R&D, according to an increasing function. The aggregate
investment results from the individual R&D efforts within a race to be first in innovat-
ing. Each patent race is a simultaneous game without information or cost advantages to
any competitors (i. e. the current technological leader competes with the rivals on equal
grounds). Since there is free-entry in the R&D game, the capital market is perfect, and the
relevant information on the previous discoveries is disclosed by the patent system, everyone
can attempt to innovate the most advanced technology.
Each successful innovator gains an efficiency advantage over previous innovators in the
product market. The size of the efficiency advantage depends on the size of the innovative
step. Most of the standard models assume that innovations are drastic, meaning that
the size of each innovative step allows the successful innovator to monopolise the product
market. To fix ideas, consider the innovative process as a progressive and constant increase
in the productivity of an intermediate good used in the production of a final good. All
generations of the intermediate good are perfect substitutes in the production of the final
good, the only difference being the amount of identical productive services incorporated
in different vintages. Then, innovations are drastic if the increase in productive services
incorporated in any new vintage of intermediate good (relative to the previous vintage) is
sufficiently high to allow any successful innovator to engage in monopoly pricing without
the fear to be displaced by his most efficient competitor in the market (i. e. the previous
innovator).
In the framework depicted above, the innovative process exhibits two main characteristics:
. at each stage of the technical progress, the current technological leader does not
conduct research in equilibrium; only outsiders invest in R&D, and so the current
imitation, but no protection whatsoever from the occurrence of successive innovations. A more articulate
analysis of the patent system within a growth model with quality ladders has been recentely provided by
O'Donoghue and Zweimuller (2004).
8

leader is systematically replaced by an outsider (leapfrogging pattern of the technical
progress)
" each successful innovator exploits his (drastic) productive advantage over the previous
technological leader and monopolizes the product market (drastic innovations).
Both the disclosure of the knowledge embodied in the new discoveries (patent system)
and the high intensity of technological competition (free-entry patent races) support the
process of creative destruction of monopolies. This, in turn, fosters the pace of technical
progress and the economic growth.
Indeed, the current technological leader (i. e. the current monopolist in the product
market) has a weaker incentive to innovate than outsiders. By discovering a new technology,
the leader would only gain an increase in his monopoly profit, while an outsider would gain
the monopoly profit starting from the initial position of zero-profit (such a difference between
the monopolist's and the outsiders' incentive to innovate is known as Arrow's replacement
effect, see Arrow (1962)). Further, since the arrival of a new innovation is uncertain and the
leader does not have first-mover advantages, the threat exerted by the outsiders' investment
is not sufficiently reflected in the leader's incentive to innovate. As a result, the replacement
effect settles the outcome of the R&D game: an outsider wins the patent race at each stage
of the innovative process, gets the technological leadership and becomes the new monopolist
of the product market. Moreover, the aggregate R&D investment is set in equilibrium by
the outsiders' incentives to innovate, which are stronger than the incentive of the current leader. Therefore, the innovative process is fostered by the intense technological competition
which characterises the standard models. On the contrary, since the monopoly profit is the
outsiders' prize in each patent race, a lower level of monopoly profit would reduce the
aggregate R&D investment and the rate of growth (appropriability effect). Notice that the assumption of drastic innovations implies that only one firm (i. e. the
technological leader) is active in the product market at each stage of the technical progress.
Similarly, the standard models which allow for non-drastic innovations assume Bertrand
competition in the product market. Then, since different vintages of the innovative good
9

are perfect substitutes, a limit-pricing equilibrium arises: the technological leader (i. e. the
latest innovator) drives its competitors out of the market and earns a unit-profit equal to the
difference in quality between his vintage and the previous one (i. e. the size of the innovative
step). 3 Again, the technological leader is the only firm active in the product market in each
period.
As a consequence, in the standard models the schumpeterian trade-off between product
market competition and growth is guessed from the negative impact a reduction of the
leader's profit would exert on the incentive to innovate. More precisely, the intensity of
competition in the product market is measured by the inverse of the elasticity of demand,
which equals the mark-up the technological leader charges when innovations are drastic. A
more elastic demand reduces the monopoly profit associated with a new innovation, and
hence the outsiders' reward from innovating. Similarly, a more elastic demand reduces
the technological leader's profit in the limit-pricing equilibrium arising with non-drastic innovations and price competition. In this case, the equilibrium price is unaffected (since
it equals the size of the innovative step) but the equilibrium quantity decreases. In both
cases, the effect of product market competition on growth, assessed through a comparative
static exercise on the elasticity of demand, turns out to be negative. This way of proceeding leaves room to several questions. First, the elasticity of demand is
linked to structural (taste and/or preference) parameters. Therefore the effect on profits ex-
erted by a change in the elasticity of demand incorporates structural changes in the economy
which are difficult to associate with different degrees of competition in the product market.
Second, a framework in which only one firm is active in the market can not accommodate
an explicit analysis of the effects on growth exerted by different modes and/or degree of
competition in the product market. Indeed, the argument of the standard models rests on 3In the case of process innovations, the assumptions of non-drastic innovation and price competition in
the product market lead to a limit-pricing equilibrium in which the most efficient firm (i. e. the last innovator)
prices at the marginal cost of the closest rival (i. e. the innovator at the previous stage of the innovative
process), getting a unit-profit equal to the difference between the marginal cost of the closest rival and his
marginal cost (i. e. the size of the innovative step).
10
the assumption that profit erosion, and the consequent appropriability effect which under-
mines the incentives to innovate, are the main effects of more competition in the product
market. However, in a dynamic setting in which technical progress and intellectual prop-
erty rights generate asymmetries between firms, other effects associated with the intensity
of competition may become relevant, first of all the selection effect of competition against
the less efficient firms. In order to capture these effects, an explicit formalisation of product
market competition among successive innovators should be embedded in the framework of
intense technological competition which characterises the standard model. 4
3. THE MULTI-SECTOR VERSION OF THE STANDARD MODEL
In the multi-sector versions of the standard model (for instance, Caballero and Jaffe,
1993) innovations operate on a continuum of intermediate goods (sectors or industries in
the sequel) employed to produce a final good. The measure of sectors is fixed (i. e. the
variety of innovative goods is exogenous). Each innovation improves the quality of the
specific variety of intermediate good it targets. However, the R&D activity entails inter-
industry spillover: each innovation can be used directly only in the industry targeted by
the innovator, but it allows successive innovators in other sectors to discover slightly better
technologies. In each industry, the innovative process exhibits the leapfrogging pattern we have described above for the one-sector model. A successful innovator (outsider) replaces
the previous technological leader and becomes the local monopolist in the industry targeted
by his innovation.
Like in the one-sector version, also in the multi-sector version of the standard model an
increase in the "intensity of product market competition" (that is, a higher elasticity of
substitution among the different varieties of intermediate good in the production of the
final good) diminishes the equilibrium investment in R&D and the rate of growth. In the
multi-sector models, however, the negative link between competition and growth arises from
the composition of three effects, one of them working in the opposite direction relative to
4An attempt along these lines is the model we present in the next chapter.
11

the overall effect:
" the (negative) appropriability effect, related (as in the one-sector version) to the re-
duction of the monopoly profit the successful innovator expects to gain in the specific
industry targeted by its innovation (i. e. the direct effect of a higher elasticity of
demand on the monopoly profit of the industry targeted by the innovator);
"a (positive) productivity (or efficiency) effect, due to the successful innovator's in-
creased ability to exploit his efficiency advantage inter-sectorially (i. e. in the compe-
tition with the local monopolists of the other sectors) when the different varieties of
intermediate goods are closer substitutes; 5
" an "additional" (negative) obsolescence effect which operates via the same channel as
the efficiency effect: if the varieties of intermediate goods are closer substitutes, the
occurrence of an innovation in one industry exerts a negative impact on the profits of
the local monopolist in another industry. As a consequence, the incentive to innovate
in the second industry is weakened. 6
In these models, the productivity effect works in the direction of a positive relation between
product market competition and growth. However this effect is always dominated by the
other two effects, the appropriability and the obsolescence effects, which work in the opposite
direction. 'Using the degree of substitutability among different varieties of innovative goods as a proxy for the
intensity of competition in the product market, the interpretation of the productivity effect is that the
successful innovator in one sector can compete more freely with the local monopolists of other sectors. Since
a new innovation increases the productivity of his variety relative to other varieties, the successful innovator
gains from a freer competition. This, at its turn, increases the expected profit from innovating in that sector.
(see Aghion and Howitt, 1998). 6"Additional" relative to the main obsolescence effect which characterises the neo-schumpeterian model
of growth: the successive innovator interrupts the flow of profits to the current innovator taking his position
as the monopolist in the product market.
12

4. AGENCY COSTS MODELS
This class of models (Aghion, Dewatripont and Rey, 1997 and 1999) embeds two funda-
mental changes in the structure of the multi-sectorial standard model. First, in these models the R&D technology is deterministic at the innovative firms' level.
Firms adopt innovations by paying a sunk cost instead of investing in a risky technol-
ogy. This is upheld either by assuming that each firm employs a continuum of researchers
engaged in uncorrelated risky projects, or simply by assuming that firms adopt new tech-
nologies already discovered. In any case, the highly competitive environment in the R&D
activity that characterises the standard model is replaced by a process of adoption of new
technologies which weakens the consequences of new discoveries on the market position of
the firms active in the product market. Indeed, within the multi-sectorial framework dis-
cussed in the previous section, each firm is a local monopolist in the sector of his variety of
the intermediate good. However, the arrival of an innovation in one sector of the interme-
diate good market does not cause the replacement of the current monopolist in this sector. Rather, the new technology is at the disposal of the current monopolist, which has only to
decide the optimal adoption timing.?
Second, these models introduce agency costs in the decision process of the innovative
firms. The separation between ownership and control shifts the decision to adopt the new
technologies to the managers. Managers decide according to their own preferences, which depend positively on the private benefits associated with the control of the firm, and nega-
tively on the private costs related to the adoption of new technologies (for instance, training
costs or non-monetary costs from reorganizing the firm in order to implement the new tech-
nologies). The presence of fixed operating costs, together with the gradual decline of profits as the
adoption of new technologies is delayed (obsolescence effect), imply that the firm could go
'In the following we refer to the firms active in the product market as "the innovative firms". These firms
are innovative in the sense that they adopt the new technologies, rather than in the sense of being involved
in R&D competition.
13

bankrupt if the decision to adopt new technologies is postponed too much. 8 Then, if we
assume that managers have lexicographic preferences, they will postpone the adoption of
new technologies until the critical moment that precedes bankruptcy. In general, even with
less extreme assumptions on managers' preferences, the managerial firm will postpone the
adoption of new technologies relative to a profit-maximising firm. This has a negative effect
on the aggregate growth performance of the economy since the rate of growth decreases
with the average delay in adopting new technologies.
Turning to the effect of product market competition on growth, the measure of the in-
tensity of competition is the same as in the multi-sectorial version of the standard model,
that is the degree of substitutability among different varieties of the intermediate good in
the production of the final good. However, in the models under study, an increase in the
"parameter of competition" has a beneficial effect on growth. The reason is that a higher
degree of substitutability among varieties strengthens the obsolescence effect. Therefore,
for any given adoption-strategy of the new technologies, the profit flow of the managerial firm worsens. This anticipates the critical instant of bankruptcy, forcing the managers to
speed-up the adoption of new technologies.
In other words, a more intense competition in the product market operates as a disci-
pline device on the managers' slackness. The decrease in the free-cash flow available to the
managers tightens the constraint conditioning the managers' behaviour (i. e the risk of bank-
ruptcy and the consequent loss of the benefits of control), inducing them to choose a strategy
closer to the profit-maximising one (that is, a faster adoption of the new technologies).
It is worth emphasising how the image of the technical progress offered by this class
of models is distant from that of an innovative process driven by intense technological
competition offered by the standard model. The (risky) activity of research, stimulated
by the prospective of acquiring strategic advantages over the rivals, is replaced with an
adoption process of new technologies forced by the threat of accumulating efficiency gaps 8The decline of profit as a firm delays the adoption of new technologies is due to the obsolescence effect
discussed in the previous section: the firm will gradually lose competitiveness relative to the rivals that are
adopting new technologies in other sectors.
14

leading to the failure of the firm. In other words, the positive effect on growth of a more
intense competition in the product market is obtained by reducing drastically the intensity
of technological competition.
5. MODELS WITH RESEARCH AND DEVELOPMENT
The main characteristic of these models (Aghion and Howitt, 1996 and 1998) consists
in the parting of the research activity from the activity of development of new technolo-
gies: the first is oriented towards discovering new technological paradigms (Multi-Purpose-
Technologies), while the second is concerned with the development and implementation of
the new inventions.
Skilled workers can move between the research and the development sectors, as well as
within the development sector across product lines generated by discoveries of different
vintages. The degree of mobility of skilled workers, both within the development sector and
between the two sectors, depends on the degree of specificity of the investment (in training
and qualification) required to perform the development activity on a particular product
line. The higher the degree of developers' mobility across product lines, the higher the
speed with which the economy implements new technological paradigms. This strengthens
the incentive to invest in research, which augments the pace of technological progress and
the rate of growth.
The impact of product market competition on growth is assessed by using the degree
of substitutability among the different product lines as the measure of the intensity of
competition. A higher substitutability of products fosters both the investment in less specific
activities (research in particular) and the incentive to reduce the degree of specificity in
developers' training and qualification. As a consequence, skilled workers are more mobile
among different product lines.
As in the agency costs models, also in the research and development models the image
of the technical progress is distant from that of a process driven by intense technological
competition aimed at gaining strategic advantages in the product market. Rather, these
15

models focus on the adequate degree of flexibility of the economic systems required to
implement the new technologies. Flexibility favours research and technical progress, and
depends, in turn, on the institutional framework being able to promote private incentives
towards a lower degree of specificity in the innovative activities and higher mobility of the
skilled labour (i. e. lower switching costs).
6. MODELS WITH TACIT KNOWLEDGE ("INTERNAL"
ACCUMULATION OF KNOWLEDGE)
In the standard neo-schumpeterian models reviewed in sections 2 and 3, the knowledge
incorporated in each innovation is immediately disclosed. The new knowledge is perfectly
codifiable, and the patent protection of intellectual property rights requires that the infor-
mation incorporated in the new technologies is disclosed and verifiable. Therefore, the new
knowledge can be utilised by any potential innovator racing for future discoveries on equal
grounds with the current innovator.
By contrast, the main characteristic of the models we review in this section is that the
knowledge incorporated in the new technologies remains to a great extent private infor-
mation of the innovative firm. This characteristic of the innovative process, in turn, is
motivated by the assumptions that innovations incorporate tacit knowledge which can be
utilised only by the innovator and/or that the protection of the intellectual property rights
is based on trade secrecy rather than on the patent system. Clearly these assumptions lower the intensity of technological competition relative to the
framework employed in the standard models (i. e. free-entry patent-races without any in-
formation or cost advantages for the current technological leader). However, this class of
models maintains the image of the technical progress as a process driven by technologi-
cal competition between innovative firms aimed at gaining competitive advantages in the
product market. As a consequence, these models provide an explicit comparison among
different models of competition in order to assess the effects of product market competition
on growth.
16

In what follows we present two distinct groups of models based on the internal accumu-
lation of knowledge: the step-by-step models (Aghion, Harris and Vickers, 1997; Aghion,
Harris, Howitt and Vickers, 2001; Encaoua and Ulph, 2000); the quality-variety models (Smulders, Van de Klundert, 1995, Van de Klundert, Smulders, 1997; Peretto, 1996,1999).
6.2. The step-by-step models
The step-by-step models are multi-sectors models with process innovations on the pro-
duction cost of intermediate goods. There are two firms active in each sector (the current
technological leader and the technological follower) competing in the market of their variety
of intermediate good. The two firms are also engaged in technological competition to ob-
tain process innovations which reduce the marginal cost of their variety. The technological
leader can exploit the tacit knowledge incorporated in the more advanced technology. This
enables him to target innovations which directly improve the leading technology. On the
contrary, the technological follower must first engage in R&D in order to disclose the knowl-
edge embodied in the more advanced technology before being able to innovate the leading
technology. In each sector the innovative contest is restricted to the two firms active in the
market, and evolves as a step-by-step run-up.
The product market of each variety is formalized as a duopoly with firms asymmetric in
costs. The intensity of the product market competition is measured both via the comparison
between different models of strategic interaction (i. e. Cournot competition versus Bertrand
competition) and via the inverse of the elasticity of demand (which derives from the elasticity
of substitution among different varieties of the intermediate good in the production of the
final good)
The main results obtained by this class of models can be summarised as follows.
First, a more intense competition in the product market increases the incentive to in-
novate (i. e. the R&D investments) of both firms when they are "neck-and-neck" in their
technological contest. This is denoted by the authors as the escape from competition effect,
to emphasise that the incentive to gain a technological lead gets stronger when firms are
symmetric (i. e. no one has a competitive advantage over the rival) and therefore they exert
17

each other an intense competitive pressure in the product market. Then, a higher intensity
of competition in the product market fosters the incentive to escape from the competitive
pressure of the rival. Second, a higher intensity of competition in the product market tends to reduce firms'
incentive to innovate (especially for the technological follower) when they are distanced in
the technological race. As we will see below in more details, this result is closely related to
the appropriability effect we have discussed for the standard models. Finally, an increase in the degree of product market competition tends to reduce the
frequency of the sectors in the economy where firms are "neck-and-neck" with respect to
the frequency of the sectors where firms are "distanced" in the technological race. This
follows directly from the first two results, that is from the positive (resp. negative) effect
that product market competition exerts on the firms' incentive to innovate starting from
(and in order to exit) the "neck-and-neck" (resp. the "distanced") state. Such a composition
effect, in turn, works in the direction of a lower rate of growth, since the frequency of the
sectors where the incentives to innovate are stronger decreases.
The intuition for the first two results is based on the different structure of the incentives
to innovate in the two alternative states of the technological race: the "neck-and-neck" and
the "distanced" states. In the "neck-and-neck" state, the profit effect (i. e. the difference
between a firm's expected profit from innovating and its current profit in the product
market) has a weak impact on the incentives to innovate, while the competitive threat
exerted by the rival (i. e. the difference between the profit of the winner and the profit
of the loser in the technological race) exerts a stronger impact. 9A higher intensity of
competition in the product market strengthens the competitive threat component of the
incentive to innovate. On the other hand, in the "distanced" state, the structure of the
incentives to innovate is more affected by the profit effect, which is weakened by a higher
degree of product market competition.
From the three results above it follows that the overall effect on growth of a more intense
9 We are referring here to the classification of the incentives to innovate in a simultaneous R&D game
introduced by Beath, Katsoulacos and Ulph, 1989.
18
competition in every sectors of the economy is ambiguous. 10 Indeed, the innovative
process accelerates in the industries where firms are "neck-and-neck" but it slows down in
the industries where firms are distanced. In the steady state, the aggregate effect depends on
the equilibrium distribution of the sectors of the economy over the two states of technological
competition. In turn, the equilibrium distribution must respect a stability condition in
terms of entries into and exists from the two states. Finally, the entry- and exit- flows are
affected by the intensity of the incentives to innovate in order to change the initial state,
and therefore, by the initial degree of product market competition.
Therefore, the overall effect on growth of a general increase in the intensity of competition
turns out to depend, critically, on the initial intensity of competition. If the initial intensity
of competition is low, the distribution of the industries over the two technological states is
concentrated on the "neck-and-neck" state. In this case, the escape from competition effect
is widely diffused in the economy, while the composition effect is weak. Therefore a general
increase in the intensity of competition exerts a positive effect on growth. On the contrary,
if the initial intensity of competition is high, the economy is mostly populated by industries
lying in the "distanced" state. In this case the escape from competition effect operates only
in a few sectors, while the composition effect is strong. Hence a more intense competition
has a negative effect on growth.
The escape from competition effect is the crucial result which allows the step-by-step
models to obtain a positive impact on growth from a higher intensity of product market
competition. The following example helps to clarify the way in which the escape from
competition effect operates.
Suppose that the tacit knowledge embedded in the leading technology (that is, the trade
1°A general increase of the degree of competition in all sectors may result, for instance, from a lenient
antitrust policy or a less effective protection of the intellectual property rights. In formal terms, the models
under study assess the effect of the intensity of competition on growth either by the (usual) comparative
exercise on the elasticity of demand or by comparing the equilibrium rate of growth under alternative models
of competition in the product market (i. e. Bertrand vs Cournot competition). Finally, a parameter capturing
the intensity of imitation of the innovations is employed in order to assess the effect exerted on growth by
the legal protection of the intellectual property rights.
19

secrecy on the more advanced technology) remains private information of the leader only
for one innovative step. In other words, the gap between the technological leader and
the technological follower equals one innovative step in the industries where firms are dis-
tanced. Moreover, suppose that innovations are drastic, and therefore the technological
leader monopolises the product market. Let us compare now the structure of the incentives
to innovate (from both the "neck-and-neck" and the "distanced" states) under Cournot and
under Bertrand competition.
To begin with, the following table describes the product market equilibrium, both in
the "neck-and-neck" and in the "distanced" states, under the two alternative forms of
competition.
Bertrand Cournot
"neck-and-neck" *7ri = 72 =0 7'1 = 72 = 7rC >0 "distanced" IrTL = lrM ; IrTF =0 IrTL = 7CM; IrTF =0
If firms are "neck-and-neck" (and, therefore, they are symmetric in costs) they earn zero
profits under Bertrand competition (i. e. r1 = 7r2 = 0), while they earn the same positive
profit under Cournot competition (i. e. 7r1 = 72 = lrc > 0). If firms are "distanced", the
technological leader obtains the monopoly profits (i. e. ItTL = rM) while the follower earns
zero profits (7rTF = 0) irrespective of the form of competition.
Now, in the "neck-and-neck" state, the comparison between the incentives to innovate
under the two forms of competition can be formalised as follows:
Bertrand lrh1- 0 for both firms
Cournot 7rM - lrc for both firms
In other words, starting form the "neck-and-neck" state, the value of gaining the techno-
logical leadership equals the entire monopoly profit under Bertrand competition, while it
equals the difference between the monopoly profit and the current (positive) profit under
Cournot. Hence the incentive to innovate is stronger under Bertrand competition.
20
On the contrary, the follower's incentive to innovate from the "distanced" state is stronger
under Cournot than under Bertrand competition. Indeed, the follower's prize from catching-
up with the leader is nil under Bertrand, since he would earn zero profit in the symmetric
post-innovation equilibrium (i. e. in the "neck-and-neck" state following his eventual inno-
vation). On the other hand, by catching-up with the leader under Cournot competition,
the follower can increases his profit from zero (in the initial "distanced" state) to the pos-
itive level 7rc (in the "neck-and-neck" state following his eventual innovation). This is
summarised below:
Bertrand = TL =? TF =0
Cournot TL =? TF = lrc
In what regards the technological leader's incentive to innovate from the "distanced" state,
we cannot reach defined conclusions unless we fully specify the R&D game between the two
firms. Looking only at the "stand-alone" incentive, the technological leader has no reason
to invest in R&D since he is already the monopolist in the market. 11 However, the leader's
incentive to innovate increases with the degree of "internalisation" of the competitive threat
exerted by the follower.
6.2. The quality-variety models
The other group of models which assume internal accumulation of the knowledge embod-
ied in the new technologies endogenises both the quality and the variety (sectors) of the
innovative goods. More precisely, in these models innovations intervene on the quality of
goods (vertical innovations), whilst the variety is determined in equilibrium by the degree of
competition in the product market. The innovative firms incur fixed R&D costs 12, which "For simplicity, we are abstracting here from the leader's incentive to innovate in order to increase his
monopoly profit by using a more efficient technology (i. e. the efficiency effect associated with a further
innovation by the incumbent monopolist). "More precisely, sunk-costs are incurred both to innovate vertically on the quality of a given variety and
to introduce a new variety in the market. Hence firms face sunk-costs of entry at the innovative stage of
the game, when they choose both whether to introduce a own variety in the market and the quality level
targeted for that variety. Notice that the entry-cost is endogenous, depending on the innovative strategies
21

have to be covered with operating profit, and sell the innovative goods in an imperfect
competitive market.
The number of firms (i. e. the varieties of the innovative good), the degree of concentration in the product market and the equilibrium level of investment in R&D are determined in
a similar way as in the "two stage" model of Sutton (1991). In the first stage of the game firms decide their innovation strategy (strategic investment in R&D) and whether or not to
enter the market. In the second stage firms compete in the product market according to
alternative models of oligopolistic competition. In this framework, a higher competition in the product market reduces profit margins
(for any given degree of market concentration), which, in turn, diminishes the equilibrium
number of firms (i. e. varieties of the innovative good) according to the free-entry condition.
As a result, the market share of each firm active in the market augments, which induces
a positive effect on the incentives to innovate vertically on the quality of the existing vari-
eties. The reason is that the competitive advantage offered by each innovation can now be
exploited on a larger market. In other words, the strategic investment in R&D promises a
relative efficiency advantage with respect to competitors which serve a larger market share,
and therefore, a higher profit perspective.
7. CONCLUSIONS
Two main conclusions arise from our review of the literature. First, the negative effect
of product market competition on growth due to the appropriability effect is inferred in the
standard models without an explicit analysis of different modes and/or degrees of compe-
tition in the product market. The combination of intense technological competition and
drastic innovations (or price competition with non-drastic innovations) leads to only one
firm being active in each industry at each stage of the technical progress. Then the argument
for a negative effect of product market competition on growth is based on the assumption
followed by all firms (and therefore, on the product market equilibrium arising in the subsequent stage of
the game).
22

that profit erosion is the dominant effect associated with a more intense competition, which
undermines the incentives to innovate.
Second, in all subsequent works analysed, the reversal of the effect of product market
competition on growth predicted by the "standard" models is obtained in a framework
characterised by less intense technological competition. This allows to soften the effect that
the arrival of new innovations exerts on the position occupied in the product market by the
firms involved in the innovative process.
An open issue in this literature is that of a more complete analysis of the relationship
between product market competition and growth within the framework of intense techno-
logical competition which characterises the standard models. An attempt along this line is
provided in the next chapter.
23

Chapter 2
Competition and growth in a Neo-Schumpeterian Model
1. INTRODUCTION
It has often been claimed that competition is good for innovation and growth. Indeed,
what empirical evidence is available suggests an increasing, or inverted U-shaped, relation-
ship between competition and growth. 1 However, there is no straightforward theoretical ex-
planation for such a positive link. Quite to the contrary, early models of endogenous growth
tend to conclude that tougher competition erodes the innovator's prospective monopoly
rents and is therefore detrimental to growth.
This chapter aims to reconcile the Schumpeterian view that the search for monopoly rents
is the primary engine of growth and empirical evidence that competition is good for growth.
We argue that the conclusion drawn by early endogenous-growth models crucially depends
upon the simplifying assumption that at every point in time the technological leader is the
only active firm in each industry. In more highly structured models, which allow for two or
more firms to be simultaneously active in the same industry, two qualitatively new effects
arise - the front loading of profits and the productive efficiency effect - that can generate
a positive relationship between product market competition, innovation and growth.
Any definition of competition involves the idea that more intense competition reduces the
equilibrium price, thus exerting downward pressure on the innovator's prospective rents (we
call this effect the price effect). However, in more competitive markets, a larger fraction
of these rents accrues in the early stages of the innovative firm's life cycle (this we call
the front loading of profits following Segal and Whinston (2003)) and low-cost firms have
a larger portion of the market, which reduces total industry costs (productive efficiency
effect). We find circumstances in which the productive efficiency effect dominates the price
effect, namely, when the size of innovations is large and/or competition is strong. In these
'See Nickell (1996), Blundell, Griffiths and van Reenen (1996) and Aghion et al. (2002).
24

circumstances, the front loading of profits and the fact that the productive efficiency effect dominates the price effect compound to make the equilibrium rate of growth increase with
the intensity of competition.
As a modeling strategy, we depart from standard quality ladder models of endogenous
growth only to the extent that is necessary to allow for several firms to be simultaneously
active in each industry. We therefore stick to the standard assumption that innovative
technological knowledge is proprietary; this implies that firms are asymmetric in that they
have access to different technologies. In early quality ladder models, the fact that only the
technological leader is active in the product market rests on the assumption that either innovations are drastic (Aghion and Howitt (1992)), 2 or else firms compete a lä Bertrand
(Grossman and Helpman (1991)). To allow for a richer market structure, we focus on
the case of non drastic innovations, contrasting Bertrand with Cournot competition. With
asymmetric firms, the number of active firms and their respective market shares will depend
on the intensity of competition, Bertrand or Cournot, and the size of innovations. (In fact
we use a more general reduced-form model which encompasses the Bertrand and Cournot
equilibria as special cases and yields a continuous index of the intensity of competition. )
Our model possesses a steady state in which m+1 firms are simultaneously active, i. e.,
the latest innovator and m past innovators, where m is endogenously determined (with
Bertrand competition, m= 0). An innovator, that does not conduct any further research,
will nonetheless remain active, and reap positive profits, for m+1 periods (a period is
the random time interval between two innovations, as in Aghion and Howitt (1992)). As
new innovations arrive, the original innovator's market share shrinks but he will exit the
market only after m+1 successive innovations have occurred. Consequently, the value
of an innovation, and hence the incentive to innovate, is a weighted average of all active
firms' profits, where the weights reflect the expected length of time periods, discounting,
and growth. In a stationary environment with no discounting each innovator would get
total industry profits over time periods, irrespective of the mode of competition. 'An innovation is drastic if the innovator is unconstrained by outside competition and can therefore
engage in monopoly pricing.
25

We show that a rise in competitive pressure makes profits accrue sooner to the innovator:
for example, with Cournot competition each innovator collects its rents over various time
periods, whereas with Bertrand competition all of the rents are obtained in the one period
starting when the innovation is achieved. In a stationary environment with no discounting,
such a front loading of profits would have no effect on the incentive to innovate. In our
model, however, delayed profits increase over time periods as the economy grows and firms
discount future rents. The transversality condition implies that discounting prevails over
growth, and so the front loading of profits raises the incentive to innovate implying that
competition tends to be positively associated with growth.
The intensity of competition affects the incentive to innovate also via its effect on total
industry profits. We decompose the effect of product market competition on industry
profits into a price effect and a productive efficiency effect. The price effect is the change in
industry profits that would obtain if all active firms shared the same technology. This effect
is negative, i. e. more intense competition would lead to lower industry profits if firms were
symmetric. With asymmetric firms, however, a rise in the intensity of competition raises
the market shares of low-cost firms, and lowers those of high-cost firms. For example, under
Bertrand competition all of the output is produced by the most efficient firm - the latest
innovator; whereas under Cournot competition high-cost firms produce a positive share of
total output. Therefore, a rise in competitive pressure improves the productive efficiency
of the industry which is good for industry profits.
We identify two circumstances in which the productive efficiency effect outweighs the
price effect. First, when innovations are almost drastic, the equilibrium price is close to
the monopoly price irrespective of the mode of competition. In this case, the price effect
is second order. However, with Cournot competition the high-cost firm holds a positive
market share (when innovations are almost drastic, only two firms are active in each pe-
riod); the productive efficiency effect is therefore first order. Thus, with large innovations
industry profits are greater under Bertrand competition than under Cournot competition.
(In fact, with large innovations industry profits are monotonically increasing in the intensity
of competition). Second, we show that in the vicinity of the Bertrand equilibrium the pro-
26

ductive efficiency effect is remarkably large: indeed, a unit decrease in the equilibrium price
lowers the industry average cost by as much as one! Therefore, independently of the size of
innovations, when competition is strong a further increase in the intensity of competition
must increase industry profits.
The rest of the chapter is organized as follows. In Section 2, we discuss the related literature. In Section 3, we analyze the value of an innovation when innovation is sequential but innovators are not immediately displaced by the occurrence of the next innovation. We
show that the incentive to innovate depends both on industry profits, and the distribution of
profits across active firms. Section 4 studies how the intensity of product market competition impacts on the incentive to innovate. In Section 5, the insights obtained in Sections 3 and
4 are embedded in a simple general equilibrium endogenous growth model. Finally, Section
6 offers some concluding remarks.
2. RELATED LITERATURE
Our chapter is related to two different literatures: the industrial organization literature
that examines the effect of product market competition on the incentive to innovate, and
the recent endogenous growth literature that tries to reconcile theory and evidence on the
relationship between competition and growth.
2.1. The industrial organization literature. - The debate on the effect of competition on the incentive to innovate goes back to Schum-
peter (1943) and Arrow (1962). Schumpeter (1943) claims that there exists a positive
correlation between innovation and market power. He argues that for a variety of reasons a
monopoly may likely develop and employ a more advanced technology than a competitive
industry. This claim has been countered by Arrow (1962), who argues that the incentive to
innovate is higher in competitive industries, because a monopolist's post-innovation profits
replace his pre-innovation profits, whereas this replacement effect vanishes under compe-
tition. Moving to the case of oligopoly, Delbono and Denicol6 (1990) find that Bertrand
duopolists have greater incentives to innovate than Cournot duopolists when the product
27

is homogenous. However, Bester and Petrakis (1993) and Bonanno and Haworth (1998)
show that this result can be reversed with horizontal and vertical product differentiation,
respectively, and Symeonidis (2003) shows that the same is true when the products are
both horizontally and vertically differentiated. Qiu (1997) develops a model in which the
incentive to innovate is greater with Cournot competition even if the product is homoge-
neous. Boone (2000,2001) generalizes these findings and shows that the relation between
competition and incentives to innovate is generally non monotone. In short, the indus-
trial organization literature on the effect of product market competition on the value of
an innovation is largely inconclusive. 3 In part, these conflicting results are due to different
assumptions on the nature of technical progress (tournament or non-tournament) and on
who conducts the research (incumbents or outside firms). The remaining ambiguity rests
on the fact that in more highly competitive industries the technological leader has a larger
market share, and this market share effect may or may not outweigh the negative effect of
more intense competition on the equilibrium price.
All of these papers focus on a single innovation framework and therefore identify the
incentive to innovate with the (increase in the) profits of the technological leader. We depart
from this literature by modeling an infinite sequence of innovations. In our framework the
incentive to innovate cannot be equated to the leader's profits, but is a weighted average
of all active firms' profits. As such, the positive effect of more intense competition on the
leader's market share does not translate mechanically into higher incentives to innovate,
but operates only via the productive efficiency effect and the front loading of profits. Our
contribution is to show that these indirect effects may nevertheless be substantial.
Segal and Whinston (2003) independently study a model of successive innovations in
which each innovator stays active for two periods. Our analysis has many elements in
common with theirs, including the front loading of profits. However, their model differs
from ours in many respects; for example, they use a rectangular demand function, a fixed
timing of innovations, and an exogenously given number of firms (m = 1). Moreover, they
3Equally inconclusive is the related literature on the effects of product market competition on managerial
incentives: see Raith (2003).
28

do not compare Bertrand and Cournot competition, but focus on various practices that
may or may not be anti-competitive. Notwithstanding these differences, our conclusions
and theirs complement and reinforce each other.
2.2. The growth literature. -
A small endogenous growth literature tries to reconcile theory and empirical evidence on
the relationship between competition and growth. One strand of this literature introduces
agency issues into the picture (Aghion, Dewatripont and Rey (1999)). In these models, non-
profit maximizing managers delay the adoption of new technologies until profits fall below
a threshold level. The effect of tougher competition is to reduce profits thereby speeding
up the adoption process.
In the non-tournament models of van de Klundert and Smulders (1997) and Peretto
(1999), tougher competition reduces the equilibrium number of varieties and increases the
size of active firms, which raises their incentive to innovate. These papers posit a posi-
tive, deterministic relationship between the level of R&D investment and the size of the
innovation. In a related contribution, d'Aspremont, Dos Santos Ferreira and Gerard-Varet
(2002) consider the case in which R&D investment affects the probability of success rather
than the size of innovations, but still many firms can innovate simultaneously. Thus, in
each period there are some firms which have successfully innovated, and others that have
access only to the prior art (which is in the public domain). They compare the Cournot
and Bertrand equilibria, and also analyze an intermediate case in which all successful in-
novators co-operatively engage in limit pricing. They show that growth is fastest in this
intermediate case, and conclude that the relationship between competition and growth is
inverted U-shaped.
Aghion et al. (2001) develop a general equilibrium model of step-by-step technical
progress in which two firms produce horizontally differentiated products, and show that
more competition (as measured by an increase in the degree of product substitutability)
may be beneficial to growth. 4 In step-by-step models, firms' incentive to innovate is great- 'In a simplified version of the model, Aghion, Harris and Vickers (1997) parametrize the intensity of
29

est when they are neck-and-neck (which can never occur in leapfrogging models). In such
a state, the incentive to gain a technological lead is greater when competition is intense;
however, with fierce competition the fraction of industries in which firms are neck-and-neck
tends to be lower. The interaction of these effects can generate an increasing, or inverted
U-shaped, relationship between competition and growth. Encaoua and Ulph (2000) argue
that introducing into this model the possibility of leapfrogging strengthens the positive
effect of competition on growth.
The main difference between these papers and ours is that we do not make any special
assumption: we use the standard leapfrogging model with profit-maximizing firms and
tournament technical progress. The novelty of our analysis lies in that we allow for several
firms to be simultaneously active - which requires that innovations are non-drastic and
competition is Cournot rather than Bertrand.
3. THE INCENTIVE TO INNOVATE WITH SEQUENTIAL INNOVATIONS
In this section we analyze the key determinants of the incentive to innovate in a model
of repeated innovations. We extend previous work in industrial organization by assuming
that innovation is sequential and cumulative, and earlier endogenous growth models by
accounting for the possibility that in each period many firms are simultaneously active.
Throughout, the following assumptions will be maintained. Innovative activity happens
at a rate determined by R&D efforts. In each period k, where k-1 is the number of past
innovations, there is a patent race for innovation k. (Time is continuous but can be divided
into periods, where a period is the random time interval between two innovations. ) Patent
races come in a sequence in the sense that only after one innovation is achieved can the race
for the next one begin. The size of innovations is exogenous but the timing of innovations
is a probabilistic function of the amount invested in R&D by research firms; specifically,
the R&D effort determines the expected time of successful completion of the R&D project
according to a Poisson discovery process with a hazard rate zk. We assume that incumbents
competition also as a switch from Cournot to Bertrand competition.
30

do no research; research is conducted by outsiders, and so in each period the current leader
is systematically replaced. 5 As discussed at greater length in Denicold (2001), this pattern
of leapfrogging is indeed an equilibrium of a simultaneous moves R&D game with free entry
if the size of innovations is not too small. 6
To fix ideas, suppose that there is perfect, infinitely-lived patent protection, so that
nobody can imitate the innovation without infringing the patent.? Because innovative
technological knowledge is proprietary, in period k only the (k - i)th innovator, who holds
a patent on the (k - i)th innovation, can practice it. 8 Under the assumption that all innovations are obtained by outsiders, nobody holds multiple patents. In period k, innovator
k -1 is the technological leader, but we allow for m past innovators to be active. Let 7ri, k be
the flow of profit earned by innovator k-1-i in period k. Thus, iro, k is the technological
leader's profit; 7rl, k is the profit of the second most efficient firm (i. e., innovator k- 2); and
so on. Later m and zk will be determined endogenously (for example, m=0 with Bertrand
SThe possibility that incumbents invest in R&D so that technological leadership may persist over time
periods will be discussed in the concluding section. 6This result is well known in the literature for the case of drastic innovations, where the Arrow replacement
effect leads a monopolist incumbent not to invest in R&D at equilibrium (the aggregate R&D investment is
set by the outsiders' zero-profits condition). With non-drastic innovations, incumbents have the additional
incentive to cumulate multiple patents in order to improve their relative position in the market (eventually
gaining an unconstrained monopoly). Although such an efficiency effect strengthens incumbents' incentive
to invest, the Arrow replacement effect continues to prevail if the size of innovations is not too small (see
Denicolb (2001) for the case of non-drastic innovation and Bertrand competition, Zanchettin (2001) for the
case of non-drastic innovation and Cournot competition). Therefore, the assumption that incumbents do
not invest is not restrictive for most of our results below, which apply when innovations are non-drastic but
sufficiently large. 'In practice, there are various means of protecting innovative technological knowledge, including patents,
copyrights, secrecy, lead time etc. Typically the protection an innovator enjoys declines over time, but for
simplicity we abstract from this additional source of dynamics.
°We follow the vast majority of endogenous growth models in ruling out patent licensing. The standard
justification for this assumption is that licensing agreements between successive innovators would have
anti-competitive effects and thus would be prohibited by antitrust authorities. When licensing improves
productive efficiency, however, such a justification loses some of its strength. After developing our results,
we discuss licensing agreements more fully in the concluding section.
31

competition), but for the moment we take them as given.
To determine the expected value of innovation k, E(Vk), one must take into account that
the kth innovator's rents will not be terminated by the occurrence of the (k+1)th innovation:
although competition from the (k + 1)th innovator will reduce all past innovators' market
shares and profits, only the least efficient among active firms will be driven out of the market
when a new innovation occurs. Thus, E(Vk) is determined by the following asset condition:
rE(Vk) = 7ro, k+1 - Zk+1 [E(Vk) - E(Vk )]
where r is the interest rate. This equation says that securities issued by the leader pay the
flow profit iro, k+i in period k+1, less the expected capital loss zk+1 [E(Vk) - E(V, )] that
will be incurred when the next innovation is achieved. Such a capital loss is the difference
between the value of being leader and that of being the second most efficient firm in the
market, i. e. E(Vt) - E(Vk ), where E(V, ) is the value of innovation k after h periods, i. e.
in period k+h. The value of being the second most efficient firm in the market, E(V, ), is
in turn determined by the asset condition
rE(V, ) _ lrl, k+2 - Zk+2 [E(Vk) - E(V2)]
,
and so on. Eventually, after m+1 innovations, the kth innovator will exit the market, so
that E(Vk +1) = 0. Consequently, we have
rE(V, )_ 7Cm, k+m+1 - zk+m+1E(Vk ).
These m+1 equations can be solved recursively yielding
E(Vk) _ 7rO, k+1
+ zk-1 71, k+2
r+ zk+1 (r + zk+1) (r + zk+2) +
...
zk+i lrm, k+m+1 +
{_L (r + zk+i) (r + zk+m+1)
_m li, k+i+1 i
zk+h (1) (r + zk+i+1)
h=l (r + zk+h)
l
When m=0, this expression reduces to the standard formula
E(Vk) _ _o, k+i
(r + zk+l
32

that is, the value of the kth innovation is the discounted value of the innovator's profits,
where the interest rate is augmented by the factor zk+l that captures the expected duration
of the innovator's leadership. More generally, equation (1) says that the value of the kth
innovation is the expected present value of all future profits that the innovator will get
in the m+1 periods for which he will be active in the product market. In each period,
the discount factor is augmented to keep into account the probability that the current
flow of profits is terminated by the occurrence of the next innovation. Moreover, because
innovation is cumulative future profits are weighted by the factors ,. +zk+h ' which can be
interpreted as the "discounting-adjusted probabilities" that future innovations are achieved:
with a Poisson discovery process, each future innovation eventually occurs with probability
one, but since there is discounting, a delayed success counts less than instant success. Thus,
i r+z/ý+/` is the "discounting-adjusted probability" that innovation k+i occurs and period
k+i+1 profits start accruing to the kth innovator.
More intuition on the determinants of the incentive to innovate can be gained by focusing
on the case of a stationary environment in which Zk and 1ri, k are constant across periods. In
the limiting case in which z tends to zero, the value of the innovation will then depend only
on the technological leader's profit, 7ro. This limiting case effectively corresponds to a single
innovation framework, like that envisaged in the early industrial organization literature. In
the polar case in which r tends to 0, the value of the innovation would depend only on m
the sum total of firms' profits, II =E 7i. In general, both industry profits and the profit i=o
distribution across firms matter.
4. INTENSITY OF COMPETITION AND INCENTIVE TO INNOVATE
In this section we analyze the effect of an increase in the intensity of competition on
the incentive to innovate. Building on the result of the previous section, we focus on
how competition affects industry profits and their distribution across firms. We identify the
front loading of profits, the price effect, and the productive efficiency effect associated with a
change in competitive pressure. We also demonstrate circumstances in which the productive
33

efficiency effect dominates the price effect. To underscore that our results are independent
of the details of the particular growth model that we develop below, the analysis is cast in
a partial equilibrium framework.
4.1 Preliminaries. -
Consider an industry comprising s+1 asymmetric firms, indexed by i=0,1, ..., s, pro-
ducing a homogeneous product. Let firms' marginal cost be constant at c; per unit, and
label firms so that co < cl < ... < c3. Thus, firm 0 is the technological leader (e. g. the
latest innovator), firm 1 is the leader's most efficient competitor (e. g. the penultimate inno-
vator) and so on. The number of firms that are active in equilibrium, m+1, is determined
endogenously; firm m is the least efficient amongst active firms. Let demand be given by
X(p), where p is price, X is output, and X(. ) is a strictly decreasing and twice differ-
entiable function on [0, p] and is zero on [P, oo). It follows that inverse demand, p(X), is
decreasing and twice differentiable on [0, X(0)]. For simplicity, we assume that the following
regularity condition holds: 2p'(X) +p"(X)X <0 on [0, X(0)]. This assumption of decreas-
ing marginal revenue simplifies the exposition (in particular, it implies that the function
II(X) = [p(X) - t]X is strictly concave for any constant t' < p) but is not needed for most
of our results. The individual firm's profit function is 7ri = [p(X) - c. +]x;, where x; is the
individual firm's output. To keep the analysis interesting, assume that cl is lower than the
monopoly price associated with co, pM(co) = argmax[p-co]X(p). If this assumption failed,
firm 0 could engage in monopoly pricing without fear of being displaced by its competitors.
4.2. Bertrand and Cournot competition. - Initially we parametrize the degree of competition by a switch from Cournot to Bertrand
competition. With Bertrand competition, the outcome is a limit-pricing equilibrium in
which price equals the marginal cost of the second most efficient firm and all of the output
is produced by the low-cost firm: pB = c1, MB = 0, and xö = XB = X(cl). In a Cournot
34

equilibrium, the first-order conditions are9
p'(XC)xC + pc = Cj z= 0'... ' m (2)
where XC = xc and mc is the greatest integer such that pG' c,,,, holds. For future M
i=o reference, note that
xc pC_c;
that is, in the Cournot equilibrium, the ratio of any two active firms' market shares equals
the ratio of their respective price-cost margins. This relationship trivially holds also in the
Bertrand equilibrium. However, in the Cournot equilibrium high-cost firms hold positive
market shares, which means that the Cournot equilibrium exhibits productive inefficiency.
This productive inefficiency is important to explain why industry profits can be larger under
Bertrand competition, even if the Bertrand equilibrium price is lower than the Cournot
price.
It is indeed well known that with Cournot competition both the equilibrium price and the
number of active firms are higher than under Bertrand competition: pC > pB and mc > 1.
Therefore, a switch from Cournot to Bertrand competition is associated with an increase in
the intensity of competition. To facilitate the comparison we now present a general solution
that encompasses the Bertrand and Cournot equilibria as special cases. This will also allow
us to obtain a continuous index of the intensity of competition.
4.3. A reduced-form model.
The intensity of competition can be measured in many different ways, but any definition
of competition involves the idea that more intense competition reduces the equilibrium price
of a homogeneous product. Accordingly, we use a reduced form specification in which the
intensity of competition is simply identified with the (inverse of the) equilibrium price. 10
Thus, let p range from the Cournot equilibrium price pC to the Bertrand equilibrium price
9With constant marginal costs, the assumption 2p(X) + p"(X)X <0 ensures that the second order
conditions are satisfied and the Cournot equilibrium is unique. "Previous work on competition and growth has often measured the intensity of competition by the inverse
of the elasticity of demand, which determines the size of the innovator's mark-up: see Aghion and Howitt
35

pB = cl as product market competition increases. Industry output is X (p). To pin down
the industry equilibrium, assume that the ratio of any two firms' market shares equals the
ratio of their respective price-cost margins without making any more specific assumption
on the nature of product market competition:
xi _p-G, iii
xi p- ci
The number of active firms, m(p) is determined as a function of p as the largest integer
such that p>c,,,, (it is understood that xi =0 when p< c�). The active firms' equilibrium m(p)
outputs and profits are then uniquely determined by the adding up condition E xi =X (p).
=o To show existence and uniqueness of the solution, note that for any given p, m(p) is
uniquely determined. Equations (3) provide m(p) independent conditions. Together with
the adding up condition, they comprise a system of m(p) +1 linearly independent equations
in the m(p) +1 unknowns xo, ..., x,,,,, the solution of which exists and is unique. It is easy
to show that individual outputs are
_p- ci X(p)
xý P-c [m(p)+1]
(4)
vn(P)
where c=> [m(p) + 1] is the unweighted average of the marginal costs of active firms.
i=O Clearly, because (3) holds both at the Bertrand and Cournot equilibria, these equilibria
are reproduced for p= pB and p= pc, respectively. For intermediate values of the price,
our solution can be interpreted as a reduced form of a more highly structured model where
firms can collude partially (Cabral (1995)), or can choose both capacities and prices (Maggi
(1996), Boccard and Wauthy (2000)), or compete dynamically in quantity under convex
adjustment costs (Dockner (1992)). In fact, our solution coincides with the conjectural
variations equilibrium under the assumption that the conjectural variations parameter is
(1998). Our reduced-form model allows us to obtain a continuous measure of the intensity of competition
that disentangles the effects of a change in the degree of competition from those associated with changes in
structural (taste and/or technology) parameters that ultimately determine the elasticity of demand.
36

the same for all firms. " Alternatively, and perhaps more prudently, the solution can be
thought of as an analytical tool that helps compare the Bertrand and Cournot equilibria.
4.4. The productive efficiency effect. -
Consider now an increase in the intensity of competition, i. e. a fall in the equilibrium
price. If the number of active firms and their respective markets shares stayed constant, the
fall in the equilibrium price will unambiguously reduce industry profits II = 7ri. This -o
is the price effect. The reason why the price effect is negative is that industry profits are
II = [p(X) - c]X, where E= Ei' =o
x ci is the industry average cost, i. e. weighted average
of firms' marginal costs. With constant market shares, c is constant; since II(X) is quasi-
concave, any fall in price must then reduce industry profits if the price is lower than the
monopoly price. However, the number of active firms and their market shares change with
the equilibrium price. As a consequence, c changes with the intensity of competition, and
the associated change in industry costs and profits is the productive efficiency effect.
Formally, the change in industry profits associated with a change in the intensity of
competition is12
=X+(p-c) Tp
-pX (5)
price effect productive efficiency effect
We now show that an increase in the intensity of competition improves the productive
efficiency of the industry; a fall in the equilibrium price, that is to say, lowers the industry
average cost.
"To see this, note that in a conjectural variations equilibrium, the first-order conditions (2) become
(1 + O; )P (X )x1 +P = ci i=0,..., m
where 4t is the conjectural variations parameter of firm i. Provided that Oi is the same for all firms, it is
immediate that (3) holds at equilibrium. 12Because m(p) jumps up at certain critical points cl, c2, ..., CM as p increases, variables like outputs, profits
etc. are piecewise differentiable. Consequently, caution should be used in differentiating those variables with
respect to p. Any such derivative calculated at c3, where ci is the critical value of p at which m jumps up
from j-1 to j, must be interpreted as the right derivative under the conventional assumption x,, (cA) = 0.
37

Lemma 1 The productive efficiency effect is positive.
Proof. Simple algebra (the details are in the Appendix) shows that
dX _ (Ci _
ýxi _X
(p)ýc 6)2
>0 (6) p- i=o p [m(P) -+' 11(p _
where o is the variance of active firms' marginal costs.
The intuition behind Lemma 1 is that a rise in competitive pressure raises the market
shares of low-cost firms and lowers the market shares of high-cost firms. This reduces the
total cost at which any given industry output is produced. An immediate corollary of
Lemma 1 is that a switch from Cournot to Bertrand competition improves the productive
efficiency of the industry. This is obvious, because with Bertrand competition all of the
output is produced by the low-cost firm, whereas under Cournot competition high-cost
firms have positive market shares.
Before proceeding, we pause here to show that an increase in price is positively associated
with an (inverse) index of the intensity of competition that is commonly used in empirical
work, namely, the industry average price-cost margin (p - c). 13
Lemma 2A rise in price p (weakly) raises the industry average price-cost margin (p - c).
Proof. See the Appendix.
With this preliminary result in place, we are now ready to state the main results of this
section.
13To measure the intensity of competition, Nickell (1996) and others also use indices of market concentra-
tion. In our model, however, an increase in price is negatively associated with market concentration. More
precisely, let Lx x be the Lorenz curve of the output distribution, showing the proportion i=s-h+1
of industry output produced by any given percentage of the population of firms, starting from the smallest
firm. Proceeding as in the proof of Proposition 3 below, it can be shown that a rise in price shifts the Lorenz
curve Lx up. This implies that as the price increase, market concentration falls according to any of the most
commonly used measures of market concentration, like C,,, the sum of the market shares of the largest n
firms, or the Herfindhal index.
38

4.5. Competition and industry profits. -
We start focusing on the effect of product market competition on industry profits. In
particular, we look for circumstances in which the productive efficiency effect dominates the
price effect so that more intense competition raises industry profits. As is clear from equation (6), if firms were symmetric (o = 0) the productive efficiency
effect would vanish. However, with asymmetric firms, Qc > 0, the productive efficiency
effect is first order. When the price effect is second order, it must therefore be dominated
by the productive efficiency effect. But the price effect will, indeed, be second order when
the price is close to the monopoly price. This observation leads us to the following result.
Proposition 1 When the marginal cost of the second most efficient firm cl is close to the
monopoly price pM(co), industry profits are greater under Bertrand competition than under
Cournot competition.
Proof. The proof is in the Appendix. Here we sketch the proof of a more general claim,
i. e. that when cl is close to pM(co), industry profits are monotonically increasing in the
intensity of competition. To prove this claim, note that when cl is just below pM(co), p
must be close to pM(co); 14 moreover, xi must be close to zero and so c must be close to co.
Using (6), equation (5) therefore reduces to
dff 2 ap =X ýM(cO)1 [t'M(c0)
- Co] p-X [JM(co)] 2[pM( )- C]2
=0
1
U2 _ -X (p"(Clo)]
2ýnr(ýo) - 6]2 <0
Thus, industry profits monotonically decrease with price.
The intuition is that at cl = pM(co) both Bertrand and Cournot competition yield the
monopoly solution. Starting from Cl = pM(co), consider now the effect of decreasing cl.
With Bertrand competition, the presence of firm 1 now constrains the low-cost firm (i. e.,
firm 0) that must price at p= cl, but when Cl is close to the monopoly price the effect
14Remember that p ranges from pB = cl to p°, which cannot exceed pM(co).
39
of competition on the low-cost firm's profit is second order - the profit function is flat at
p= pM(co). With Cournot competition a fall in cl reduces the equilibrium price less than
under Bertrand competition, but now it also increases the high-cost firm's market share.
Since cl > co, with Cournot competition the negative effect on industry profits of a fall in
cl is first order, whence the result follows.
Proposition 1 might suggest that the productive efficiency effect is small and can prevail
over the price effect only if the latter is negligible. Quite to the contrary, the productive
efficiency effect can be surprisingly large: a unit increase in the equilibrium price can raise
the average industry cost by as much as one! (Lemma 2 ensures that 'c cannot increase by
more than one). This is indeed what happens in the vicinity of the Bertrand equilibrium -
the equilibrium which most quality ladder models of endogenous growth with non-drastic
innovations focus on. Consequently, starting at Bertrand competition, a small decrease in
the intensity of competition will unambiguously lead to a fall in industry profits.
Proposition 2 Starting at the Bertrand equilibrium price, a small increase in price lowers
industry profits.
Proof. From (5) and (6) we get
=X+(p-c) dX
-X2 0,2 2
(p-^)2
When p is slightly increased starting at p= pB = cl, only two firms, 0 and 1, will be active.
Consequently, Qý = (Cl - c)2 + (co - c)2 = 2(c1 - a)2 = 2(p - c)2, whence we get
I P=Pa = (P- C) d- < 0.0
Proposition 2 effectively shows that starting at the Bertrand equilibrium price, a small
increase in price leaves the industry average price-cost margin (p - c) unchanged. The
intuitive reason is that when p= cl, a unit increase in price raises the market share of firm
1 (the high-cost firm) from zero to cllco, and this causes a unit increase in E. Because the
industry average price-cost margin (p - e) is unchanged, a rise in price must necessarily
lower industry profit.
40
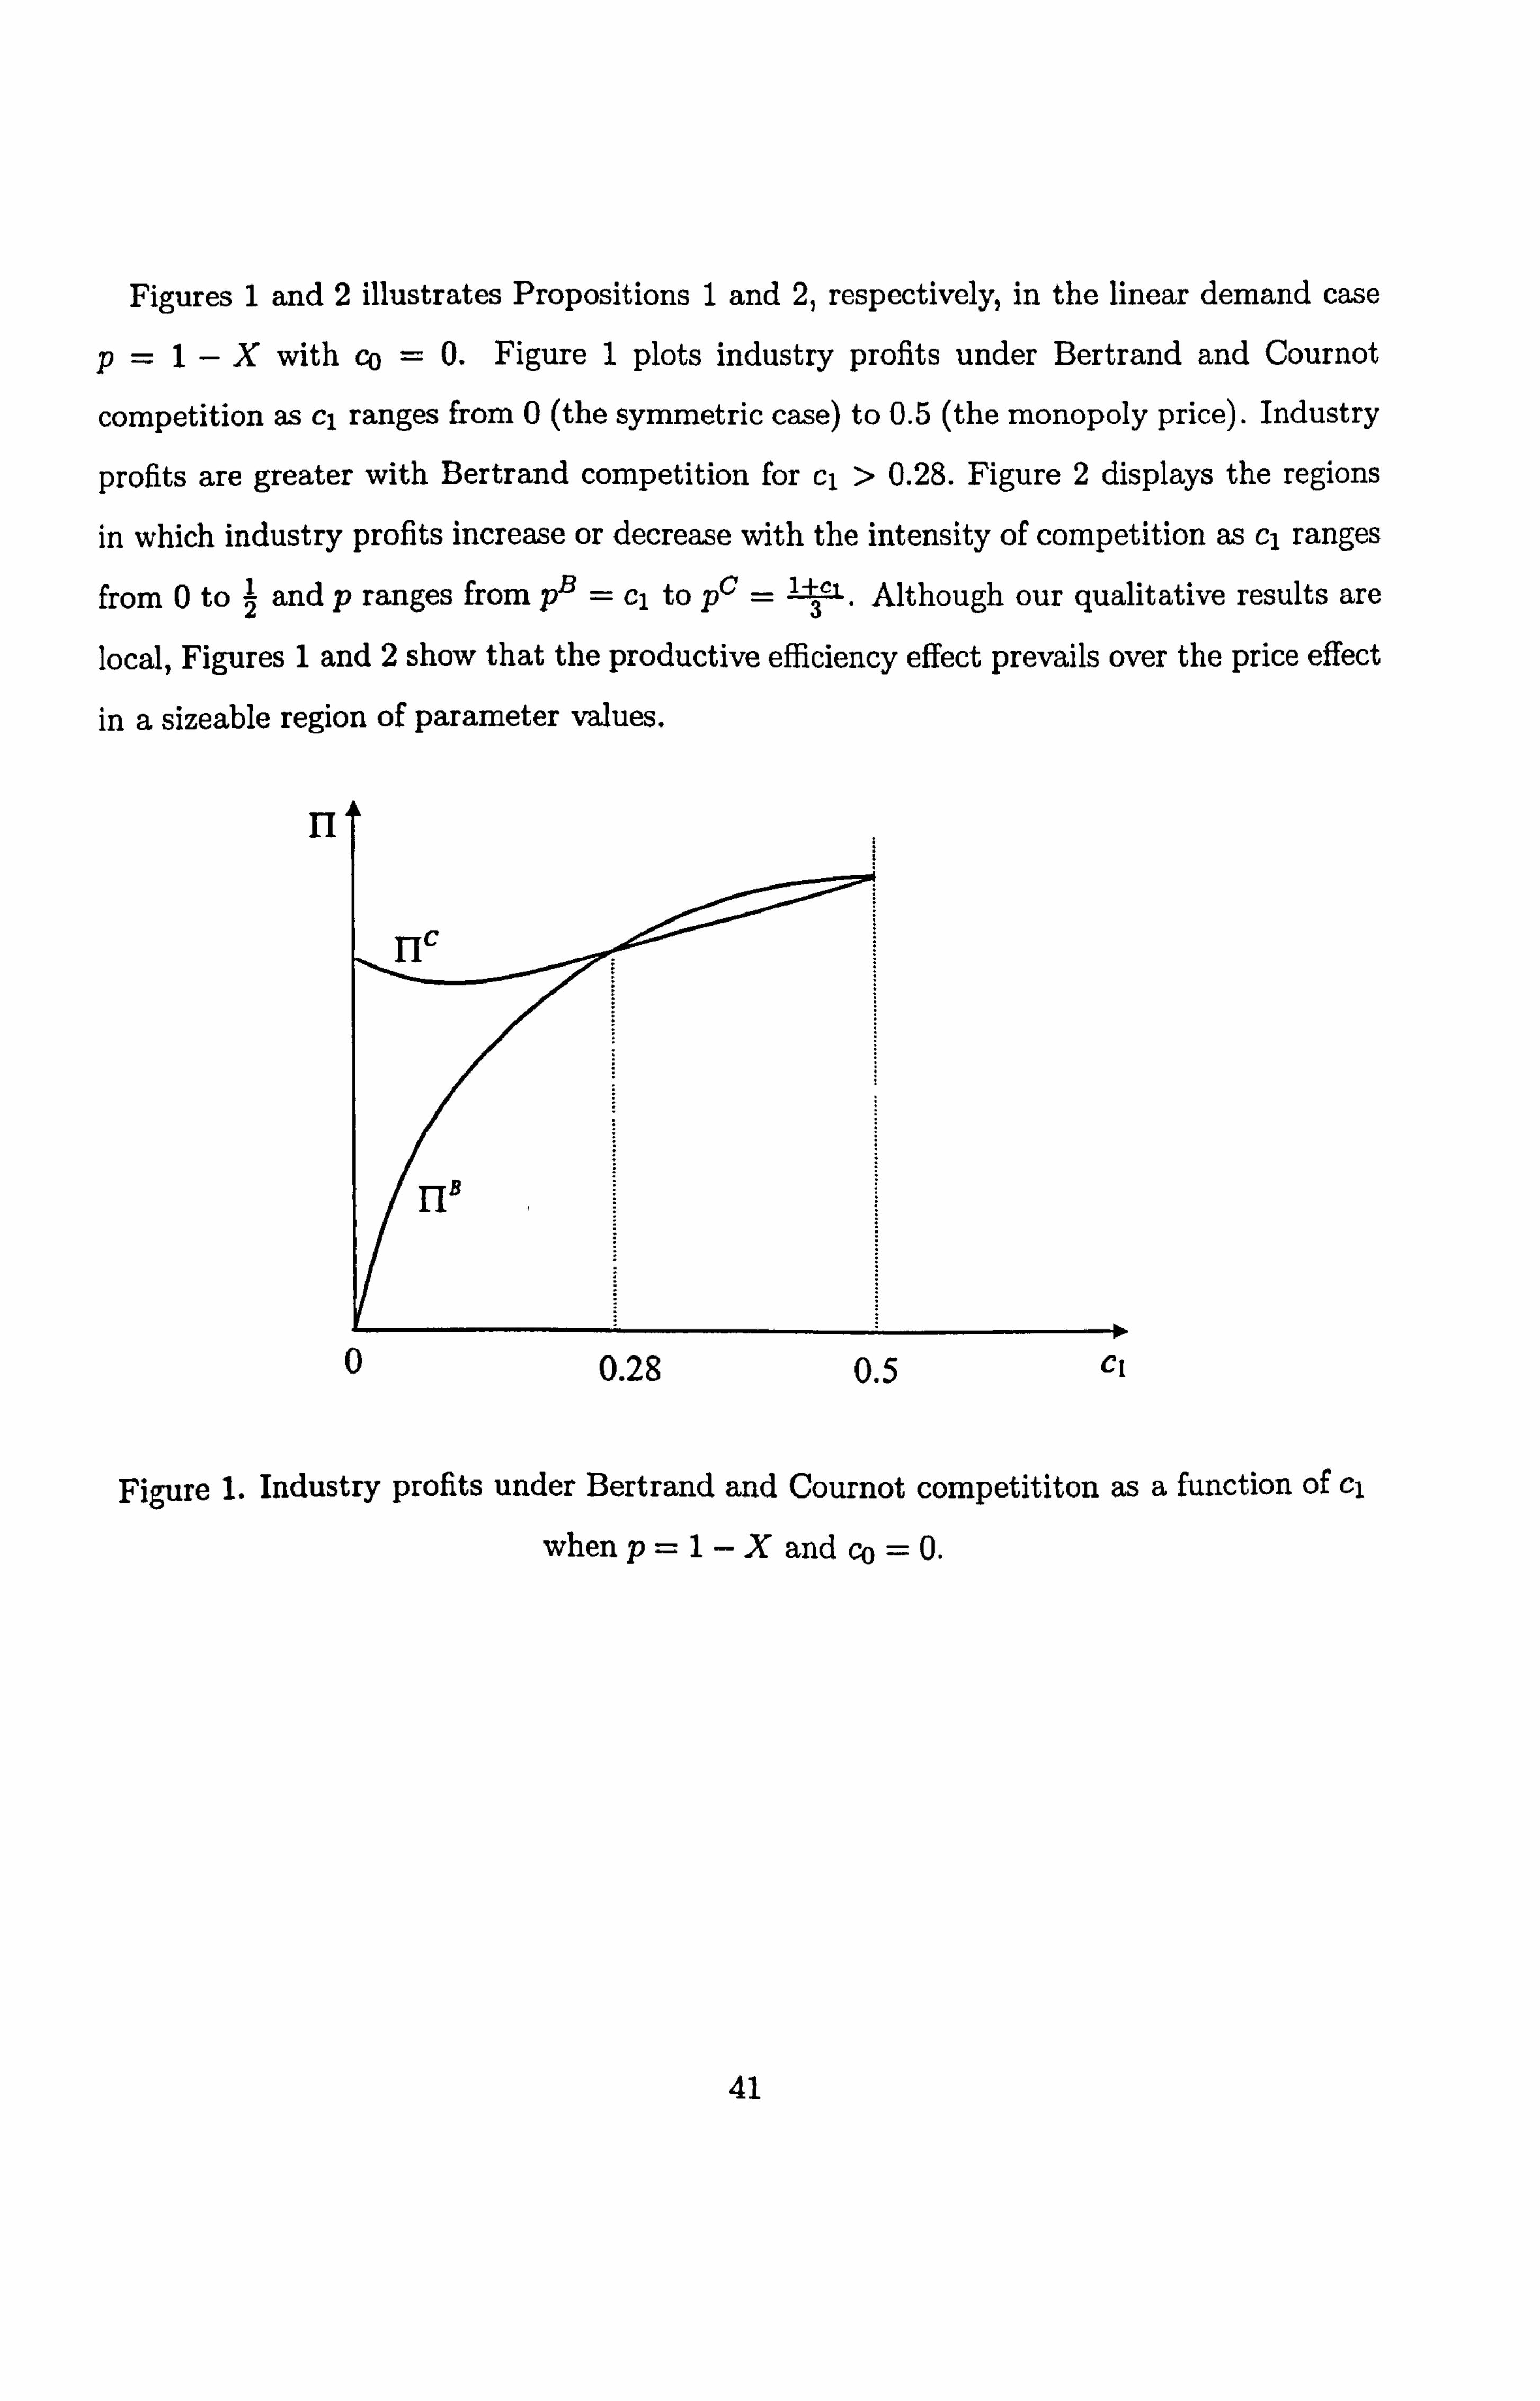
Figures 1 and 2 illustrates Propositions 1 and 2, respectively, in the linear demand case
p=1-X with co = 0. Figure 1 plots industry profits under Bertrand and Cournot
competition as cl ranges from 0 (the symmetric case) to 0.5 (the monopoly price). Industry
profits are greater with Bertrand competition for cl > 0.28. Figure 2 displays the regions
in which industry profits increase or decrease with the intensity of competition as cl ranges
from 0 to 2 and p ranges from pB = cl to pC =. Although our qualitative results are
local, Figures 1 and 2 show that the productive efficiency effect prevails over the price effect
in a sizeable region of parameter values.
II
Figure 1. Industry profits under Bertrand and Cournot competititon as a function of cl
when p= 1-X and co = 0.
41
0 0.28 0.5 Cl

dFI n
P
Figure 2. The effect of an increase in the equilibrium price on industry profits as a
function of cland p when X=1-p and co = 0.
4.6. Competition and the distribution of profits. -
Product market competition affects not only the sum total of all firms' profits, but also
the other key determinant of the incentive to innovate, namely, the distribution of profits
across active firms. Accordingly, we now focus on how a rise in the intensity of competition
affects the profit distribution, for any given level of industry profits.
Let the profit distribution be the s+ 1-dimensional vector 11 = (iro, 7r1, ..., ir, ). Because
co < cl < ... < c� we have iro > 7r1 > ... > 7r8, with strict inequalities whenever profits
are strictly positive. The Lorenz curve of the profit distribution is Ln(8+1) s=s-h+1
where II is industry profits. It shows the proportion of industry profits earned by any given
percentage of the population of firms, starting from the least profitable firm.
Our next result is that the profit distribution becomes more unequal according to the
Lorenz dominance criterion as competition becomes more intense. That is to say, the Lorenz
curve of the profit distribution shifts down as the intensity of competition increases. Lorenz
42
0 0.28 0.5 Cl

dominance implies that profit inequality would increase as the intensity of competition
increases according to a wide set of inequality measures.
Proposition 3 If there are at least two active firms, an increase in the intensity of competi-
tion makes the profit distribution more unequal according to the Lorenz dominance criterion.
Proof. See the Appendix.
Proposition 3 follows from the simple fact that low-cost firms gain, and high-cost firms lose
in relative terms when the market becomes more competitive. The reason is twofold: first,
the market shares of low-cost firms tend to increase with the intensity of competition, and
second, when the equilibrium price falls, the percentage decrease in the price-cost margin
is larger for high-cost firms.
In the dynamic model of successive innovations to be developed presently, each innovator
will be active, and reap positive profits, for m+1 periods: in the first period after his
innovation is achieved, he is the technological leader, in the second period he is the second
most efficient firm, in the third period he is the third most efficient amongst active firms,
and so on. Over time periods, the innovator reaps total industry profits irrespective of the
intensity of competition. However, the Lorenz dominance result means that as the intensity
of competition increases the innovator will get a larger proportion of his prospective rents
in the first i periods for which he is active, for all i=1,... m (over m+1 periods he always
get 100 per cent of industry profits). This is the front loading of profits associated with
more intense competition. Proposition 4 below shows that the front loading of profits tends
to increase the incentive to innovate, for any given level of industry profits.
5. A GROWTH MODEL
We now embed the insights from the previous sections in a simple growth model. To
eschew distracting assumptions, we use a one-sector version of the text-book model of
Barro and Sala-i-Martin (1995, ch. 7), but the main results are more general and can be
43
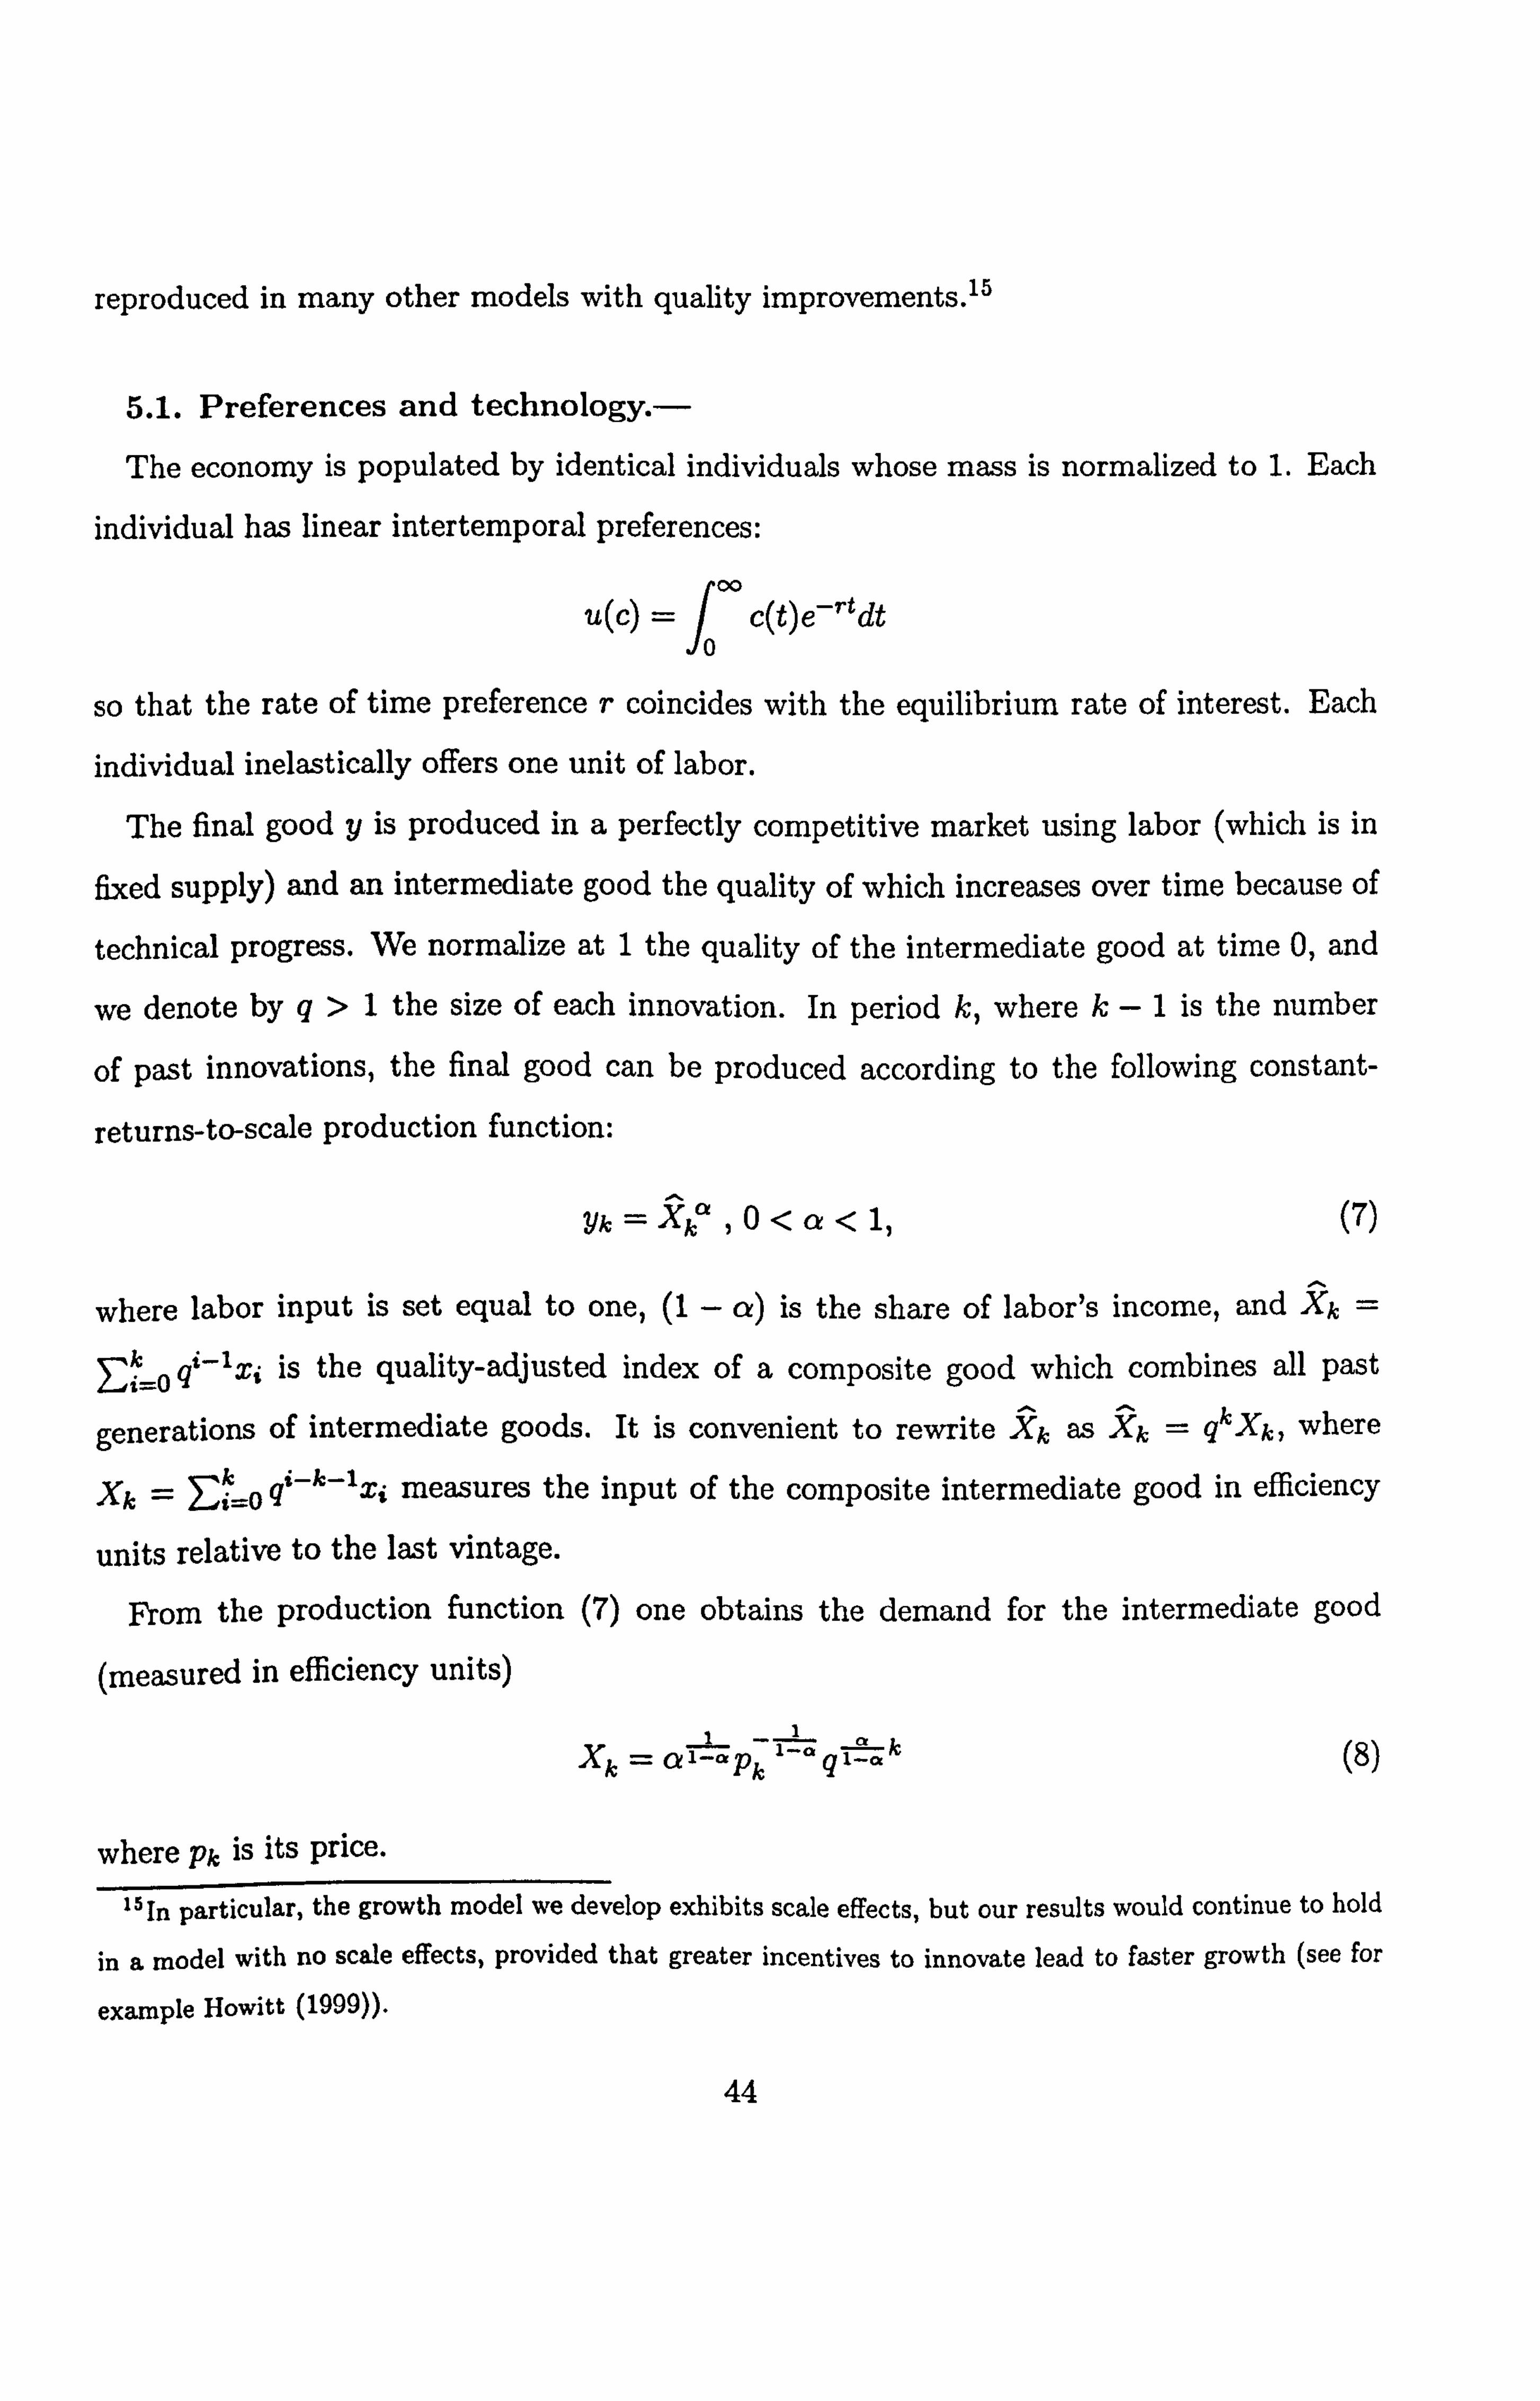
reproduced in many other models with quality improvements. 15
5.1. Preferences and technology. - The economy is populated by identical individuals whose mass is normalized to 1. Each
individual has linear intertemporal preferences:
u( c) 1000
c(t)e-tdt
so that the rate of time preference r coincides with the equilibrium rate of interest. Each
individual inelastically offers one unit of labor.
The final good y is produced in a perfectly competitive market using labor (which is in
fixed supply) and an intermediate good the quality of which increases over time because of
technical progress. We normalize at 1 the quality of the intermediate good at time 0, and
we denote by q>1 the size of each innovation. In period k, where k-1 is the number
of past innovations, the final good can be produced according to the following constant-
returns-to-scale production function:
yk=Xk , 0<a<1, (7)
where labor input is set equal to one, (1 - a) is the share of labor's income, and Xk =
I: k o qt-lx; is the quality-adjusted index of a composite good which combines all past
generations of intermediate goods. It is convenient to rewrite Xk as Xk = gkXk, where
Xk k -k-lxi measures the input of the composite intermediate good in efficiency , i_o q' y
units relative to the last vintage.
From the production function (7) one obtains the demand for the intermediate good
(measured in efficiency units) I
Xk =al C Pk 1aq 1=a k
where Pk is its price.
(8)
15In particular, the growth model we develop exhibits scale effects, but our results would continue to hold
in a model with no scale effects, provided that greater incentives to innovate lead to faster growth (see for
example Howitt (1999)).
44

The final good may be consumed, used to produce intermediate goods, or used in research.
Independently of its quality, the intermediate good is produced using the final good with a
constant marginal rate of transformation that is normalized to 1.
5.2. Technical progress. -
In each period there is a patent race. Incumbents do no research, and there is free entry
by risk-neutral outsiders. In period k, each firm i participating in the race decides its R&D
effort ntk to obtain the kth innovation. The R&D effort determines the expected time of
successful completion of the R&D project according to a Poisson discovery process with a
hazard rate equal to Aknik, with . 'k > 0. The projects of different firms are independent, so
that the aggregate instantaneous probability of success is simply the sum of the individual
probabilities. Let nk = Ei nvk denote aggregate R&D investment in period k. Then, the
innovation occurs according to a Poisson process with hazard rate 4 : -- Aknk. ls
If innovations were drastic, the technological leader would be unconstrained by outside
competition and could engage in monopoly pricing, and so the model's equilibrium would
be independent of the mode of competition in the product market. We therefore assume
that innovations are non-drastic, which in the current setting means that
1 q<-
a
5.3. Steady state. - In a steady-growth equilibrium the price of the (latest vintage of the) intermediate good,
in terms of the consumption good, will be constant. This implies that Xkwill grow at rate
q 1T , and from (7) it then follows immediately that yk will also grow at rate q1 as .
This is
the growth factor between periods, and we denote it by g-q 1-0%X . In a steady state, output,
consumption, the input of intermediate goods, profits, and R&D investment will all grow
at rate g between periods.
In order to guarantee the existence of a steady state with positive growth, following Barro
16Our results immediately extend to the case where xk = Aknk , with 0<ß <_ 1. The case ß<1 may
reflect the presence of external diseconomies in research.
45

and Sala-i-Martin (1995, p. 250) we assume that Ak _ Ag-k. Because in a steady state nk
grows at rate g across periods, under this assumption the hazard rate zk = Aknk can be
constant across periods.
Finally, note that the following transversality condition must hold (see Barro and Sala-i-
Martin, 1995, p. 248):
r> z(g - 1).
If this condition is violated, consumers have an incentive to postpone consumption indefi-
nitely.
5.4. Equilibrium in the product market. - To proceed, remember that only the kth innovator, who holds a patent on his vintage
of the good, can produce the intermediate good of vintage k. Independently of its quality,
the intermediate good is produced using the final good on a one-to-one basis. However, in
period k it takes qi-' units of the intermediate good of vintage k-i to make one unit of
the intermediate good k in efficiency units. Innovator k- i's unit cost of producing the
intermediate good, measured in period k efficiency units, is therefore q'-1. Thus we can
proceed as if the intermediate good was homogeneous but firms had different production
costs, i. e. 1 for the latest innovator, q for the penultimate innovator, q2 for the third latest
innovator and so on.
Given the demand function (8), the Cournot equilibrium price can then be easily calcu-
lated as
pc 1+q+q2+... +q" (9)
mC -}- a
46

where me is the largest integer such that 17
1+q+g2-+... +qm mm+l
m+a q
Individual outputs can be obtained by substituting (9) into (4). Clearly, in each period low-cost firms hold larger market shares than high-cost firms. However, when innovations
are non-drastic different vintages of the intermediate good will be simultaneously produced,
even if older vintages are less productive.
In contrast, the Bertrand equilibrium is a limit-pricing equilibrium where the leader prices
at pB =q and drives its competitors out of the market. At this limit-pricing equilibrium,
there is no productive inefficiency. The corresponding profits are 7rB =0 for i>1, and:
BB11k 7rp k= IIk = (q - ]. ) q 1-a CY 1-a g.
Such a Bertrand equilibrium is standard in the endogenous growth literature. The next
Lemma confirms that a switch from Cournot to Bertrand captures the notion of tougher
competition.
Lemma 3 The equilibrium price under Cournot competition is greater than under Bertrand
competition.
17It can be shown that me is constant across periods. With m° +1 active firms in period k, the Cournot
equilibrium price is c
Pk = 1+q+g2+... +qm
mk+a
and so mA, is the largest integer such that
1+q+ q2 me +... +q mk+1
mk+a >4
Because all the parameters in this inequality are constant, mk must be constant across periods.
47

Proof. We have
C_ 1+q+q2+... +qm p
m+cr
> aq +q +q+2 +... +... + qm because innovations are non-drastic (aq < 1)
>a aq
because q>1 m-}-
=q
pB
Like in Section 4, we also use a more general reduced-form solution that encompasses the
Bertrand and Cournot equilibria as special cases. In this solution, p ranges from pB =q to
pc, and the corresponding individual outputs are given by (4). The equilibrium number of
active firms other than the latest innovator, m(p), is the largest integer such that m(p) <
IOS2 a'
5.5. Equilibrium in the research industry,
To complete the derivation of the model's equilibrium, we next focus on the research
sector. The expected discounted profit of an outside firm that invests npk units of the final
good in period k to obtain innovation k, as of the start of the race and given that aggregate
investment in R&D is nk, is AkntkE(Vk) - ntk
r+nk%\k
where E(Vk) is the expected value of the kth innovation, and is given by (1). At equilibrium,
outsiders' expected net profit must be equal to zero:
AkE(Vk) =1 (io)
In a steady state, z is constant and profits grow at rate g between periods: 7rti, k _ 7rtigk,
where irs = lri, o" Equation (1) then reduces to:
m E(Vk)=Ez
ig' +l 7r` (11) z)i+l i_O
(r +
48

Equilibrium in the research industry is then determined by inserting (11) into the free-
entry condition (10)
H(z) (12)
where H(z) = Esm=o zi ýr+
i+i7'} Equation (12) determines the equilibrium hazard rate, z*,
and hence the economy's rate of growth. To see this, note that the growth factor between
periods, g, is constant. This means that the equilibrium rate of growth is entirely determined
by the expected length of each period, which in turn depends on the speed of technical
progress: with an exponential distribution of the timing of success, the expected waiting
time for each innovation is z. Consequently, an increase in z is associated with faster
growth.
Lemma 4 Assume that I> jý. Then a unique, strictly positive equilibrium hazard rate
z' exists.
Proof. See the Appendix.
Condition '° >ä ensures that research is sufficiently profitable that some research is
conducted at equilibrium. It is easy to show that the steady state level of research, z*, is an
increasing function of the productivity of R&D effort A. For any other arbitrary parameter
a that influences z', the sign of azä equals the sign of ää . Using this fact, it is immediate
to show that z` is a decreasing function of the rate of time preference r and an increasing
function the step size between innovations q. It is also clear that the economy's rate of
growth increases with the incentives to innovate.
Our next task is to analyze the impact of a switch from Cournot to Bertrand competition,
or, more generally, a rise in competitive pressure, on the economy's rate of growth.
5.6. Competition and growth. -
Proposition 4 If industry profits are weakly increasing in the intensity of competition, an
increase in the intensity of competition raises the equilibrium rate of growth.
49

Proof. Let p and p' denote two price levels, with p< pý. The move from p' top corresponds
to an increase in the intensity of competition. By assumption, 11(p) > II(p'). Proposition 3
then implies that hh
E 7ri(p)ý
E1ri(P')
i=0 i=0
(13)
for all h, with a strict inequality for at least one h. We also know that m(p) < m(p'). We
must show that H(p) > H(p'), i. e.
m(p) gz *n(n') gz ti 7'i (P) [(r+z)J >E 7rt(p') Lr+zj
i=O t-o This can be rewritten as
m(p) h 9z
h-1 9z
h l : ý.
Eri(P) (r+z)) -
((r+z))
> m&) h
zirp') gz
h-1
- gz
h E E` [Gr+z))
((r+z))
i=01 i=O
where the terms inside square brackets are positive by the transversality condition. By
inequality (13), each term inside curly brackets on the left hand side is at least as large
as the corresponding term on the right hand side, with at least one strict inequality. This
completes the proof of the Proposition.
The intuition is as follows. We have shown in section 3 that the value of an innovation is
a weighted average of all active firms' profits, >Q wsir , where the weights wi reflect the
expected length of time periods, discounting, and growth. In a steady state, the expected
length of time periods is constant. The transversality condition implies that discounting
prevails over growth, and so the weights are decreasing in i: wo > wi > ... > w�,. The
Lorenz dominance result (Proposition 3) shows that a rise in competitive pressure shifts
profits from the least profitable firms to the most profitable ones. With declining weights,
such a front loading of profits implies that the incentive to innovate Eio wt7rs increases
with the intensity of competition, provided that industry profits do not fall. And in a neo-
Schumpeterian model an increase in the incentive to innovate must cause an increase in the
economy's rate of growth.
50

Corollary 1 If innovations are sufficiently large (i. e., if the size of the i, nnovation, s, q, is
('/O ( to 1. then the rate of growth under Bertrand competition is higher than the rate of
growth iir /c, Cournot competition.
Proof. Follows from Propositions 1 and 1.
It ( sui be shown that as q falls, eventually ii' (q) < 11"(q). By Proposition 4, this means
that the rate of growth can (but need not) be greater with Cournot competition if the size
of innovations is sufficiently small. Numerical calculations show that the interval in which
aggregate profits are greater under Bertrand competition, and thus more competition is
surel., associated with faster growth, can be quite large. Figure 3 illustrates.
U.
0
Figure 3. Industry profits under Bertrand and Cournot competition as a function of the
elasticity of demand ( and the size of innovations q.
Stok('Y (1995) notes tlrat if irrnov<itions occur every few years, a reasonable range for q is
1.02 to 1.0-ß: if innovations ()(kirr only a couple of times per century, then a reasonable range
51
I (I

for q is 1.25 to 1.50. Barro and Sala-i-Martin (1995) note that reasonable values for a, the
share of capital income, range from 0.30 if capital is interpreted as physical capital to 0.70 if
capital includes human capital. The shaded area in figure 3 corresponds to the "reasonable"
range qE [1.02,1.50] and aE [0.30,0.70]. Over this range, more intense competition may
well be associated with faster growth.
Corollary 2 If the intensity of competition is sufficiently high (i. e., p is close to the
Bertrand equilibrium price q), a further increase in the intensity of competition leads to
faster growth.
Proof. Follows from Propositions 2 and 4.
In fact, the relationship between competition and growth is monotonically increasing
when the size of innovations is large. For smaller innovations, numerical calculations show
that industry profits first increase and then decrease as p increases. Consequently, unless the
front loading of profits is sufficiently strong to outweigh the effect of tougher competition on
total industry profits, the rate of growth first decreases and then increases as the intensity
of competition increases. 18
6. CONCLUDING REMARKS
In this chapter, we have re-considered the relationship between competition and growth in
a standard neo-Schumpeterian model with improvements in the quality of products. Focus-
ing on the case of non-drastic innovations, we have modeled the notion of lower competition
by a switch from Bertrand to Cournot competition, and more generally by a decrease in
the equilibrium price.
We have shown that competition is good for growth either if the size of (non-drastic)
innovations is large, or if the intensity of competition is high, or both. This result follows
"These results hold provided that only two firms are active in the Cournot equilibrium. When innovations
are still smaller, such that three firms are active under Cournot competition, the relationship between
competition and growth can exhibit two local maxima.
52

from two qualitatively new effects - the front loading of profits and the productive efficiency
effect - that arise when innovators are not immediately displaced by the occurrence of the
next innovation so that two or more asymmetric firms are simultaneously active in the same
industry.
We conclude with a brief discussion of repeated innovation by incumbents, patent licens-
ing, welfare, and alternative measures of the intensity of competition.
6.1. Persistent leadership. -
In our model, incumbents do no research and are systematically replaced by outsiders.
However, there is ample evidence that incumbents account for much of the research done,
and the resulting pattern of persistent leadership is well documented in many industries.
The literature that try to explain this pattern of persistent leadership recognizes that in
standard quality ladder models leapfrogging is indeed an equilibrium of a simultaneous
moves R&D game if the size of innovations is not too small (e. g. Denicol6 (2001). In
this case, the assumption that incumbents do not research is not restrictive. However, the
standard model can be adapted to make room for the persistence of leadership in various
ways. If, for example, it is assumed that incumbents have a first-mover advantage in the
patent race starting after the latest innovation, the outcome is a pre-emption equilibrium
in which all research is done by incumbents. However, the amount of research is still
determined by the outsiders' zero-profit condition, and thus the incentive to innovate is
driven by the same qualitative effects as in the leapfrogging equilibrium.
6.2. Patent licensing. -
We have followed the vast majority of endogenous growth models in ruling out patent li-
censing. The standard justification for this assumption is that licensing agreements between
successive innovators would have anti-competitive effects and thus would be prohibited by
antitrust authorities. In our model, however, patent licensing agreements could be arranged
so as to improve productive efficiency with no anticompetitive effects, and so ruling them
out is more restrictive an assumption than in the early models.
53

If patent licensing was ubiquitous, all of the output would be produced with the most
efficient technology and so the productive efficiency effect would vanish. However, a vari-
ety of transaction costs impede licensing agreements. As an example, royalty licensing is
possible only if the output is verifiable; when individual output is not verifiable, and only
fixed-fee licensing is feasible, licensing will occur at equilibrium only if the size of inno-
vations is sufficiently small. As another example, incomplete information over the size of
the innovation can lead parties to introduce inefficient terms in the licensing agreements.
In addition, innovative technological knowledge can be difficult to codify and transmit to
others. These transaction costs may likely result in an equilibrium outcome in which some
active firms do not use the latest generation technology. To the extent that the product
market equilibrium exhibits some productive inefficiency, our qualitative results are likely
to hold even if we allow for some licensing agreements.
6.3. Welfare. - Although a detailed welfare analysis is outside the scope of this chapter, a few remarks
are in order. Our analysis shows that an increase in the intensity of competition has two
effects on social welfare, a static effect and a dynamic effect. The static effect is unambigu-
ously positive. Indeed, for any given state of the technology, the price of the intermediate
good is lower and output is greater with tougher competition. Further, if competition is
Bertrand, only the most efficient firm is active in the intermediate good industry and so
only the highest quality good is produced in equilibrium, ensuring that productive efficiency
is achieved. The dynamic effect, that operates via the incentive to innovate and the rate
of growth, is more complex. As we have seen, competition can be growth-enhancing or
growth-reducing. In addition, the equilibrium rate of growth can exceed the socially opti-
mal rate, which means that faster growth is not necessarily socially beneficial. Therefore,
the overall welfare effect of tougher competition is generally ambiguous.
6.4. Alternative measures of the intensity of competition. - One of the novelties of our analysis relative to most of the previous growth literature is
54

that we have not used the elasticity of demand as a proxy of the intensity of competition.
Instead, we have formalized the intensity of competition in two ways: a switch from Cournot
to Bertrand competition, and a more general reduced form that uses directly (the inverse of)
the equilibrium price. Both measures convey the idea of more competition as a higher degree
of rivalry among firms in an oligopolistic setting, and highlight two main effects of tougher
competition: the price effect and the selection effect. As noted before, the selection effect
implies that our measures of the intensity of competition are positively related with market
concentration, but negatively associated the industry average price-cost margin. Therefore,
our formalization of the intensity of competition is appropriate to measure market power
due to a less competitive behavior by oligopolistic firms, whilst it does not capture anti-
competitive practices like entry barriers. 19 However, to the extent that the removal of
such barriers allows more efficient entrants (i. e. current innovators) to better exploit their
efficiency advantage in the product market, the main effects which drive our results (i. e.
the front loading of profit, the selection, and the productive efficiency effects) will continue
to work. Therefore, our qualitative results are likely to hold in such a setting.
An alternative way to formalize the intensity of competition would be to assume that prod-
ucts are differentiated, and cumulative process innovation generates asymmetries among
firms which compete in price. The (inverse of the) degree of product differentiation would
be the measure of the intensity of competition. For instance, suppose that there are two
differentiated products in the market, and each successful innovator (let us stick on the
assumption that innovations come from outsiders) not only disposes of a more efficient tech-
nology but can also alter consumers' perception of the degree of substitutability between
his product and the rivals' (for instance, through comparative advertising). For simplicity,
concentrate on the case in which the innovation size is sufficiently high such that at most
two firms can be active for any degree of product differentiation. Then, as shown in Chapter
3 below, the profit of the technological leader (i. e. the current innovator) is non-monotonic
"Indeed, in our model, the number of active firms in the market arises endogenously from the intensity
of competition and the degree of asymmetry among firms (as a result of cummulative innovations and
intellectual property rights).
55

in the degree of product substitutability when cost asymmetry (i. e. the innovation size) is
sufficiently high, whilst the profit of the technological follower (i. e. the previous innovator)
always decreases with product substitutability. Provided that the current innovator can
change only marginally the perceived degree of substitutability starting from an high initial
level, he would choose to further decrease product differentiation. Again, the selection effect
here is the driving force of more intense competition (i. e. less product differentiation in this
case). Furthermore, from the intertemporal prospective, the front loading of profit would
operate as in our model. Finally, more competition would entail more productive efficiency,
as the technological leader would serve a large fraction of the market. To the extent that
the productive efficiency effect would sufficiently contrast the price effect, a positive re-
lation between competition, innovation and growth would arise as in our model. On the
contrary, if the current innovator can marginally change the perceived degree of product
substitutability starting from a low initial level, he would prefer to further increase product
differentiation. Therefore, as in our model, when the intensity of competition is initially
high and innovations are large, a positive relation between competition, innovation and
growth is likely to arise. When the initial intensity of competition is low and innovations
are small, the relationship between competition and growth tends to be negative.
56

APPENDIX
Omitted details in the proof of Lemma 1. - To prove the first equality in (6), i. e.
dc m dxi w p- pX =ýýý-c) dp
note that
dc dm xi dp dpEXci
ºý d- m dX
_0 CiX dp -
Ei'=0 cixi dp
X2 m dx dX mx"
_ ýi=0 C-i dp - dp i=0 X
X m dx;
_ mit dx; Ei=0 Ci dp ýi=O
dp X
whence the result follows immediately. Next, note that
From (4) we get
'r` dxi '" dxi dX (ci i=0
dp i-0
dp TP
dxti xi dX c; -c1
Substituting into the above expression we get
"` dr; dX m x; dX 'n ct -c1 dX
i_O dp dp
_o X dp
i_o (p c) ým(1n) + dp
-X (P) 'n
- [m(p) + l] 6p c)2 F_ Ci (Ci i=O
because the first and third term on the right hand side cancel out. But Ej o c; (ci - c) is
the variance of active firms' marginal costs, a, and so the second equality in (6) is obtained.
57

Proof of Lemma 2. -
From (6) we have
d (p - C) =1-
--P) (G - 6)2 I i=l dp [m(p) + 1] (p - 6)2
_ i- `ö) [(p - 6) 2- (cj - 6) 2] >0 [m(p) + 1] (p - 6)2
where the inequality follows because p>c, (p).
Proof of Proposition 1. - When cl = pM(co) we have pB = pC = pM(co) and xi = xB = 0; consequently, JIB = IIC
Starting from cl = pý1(co), let us consider the effect of a small decrease in cl, such that xi
becomes positive. Because IIB(ci) = (cl - co)X(ci), we have
dlIB
-dc- = X(cl) + (cl - ca)X'(ci)
and so dd B=0 at cl = pM(co). On the other hand, when cl is just below pM(co), exactly
two firms will be active in the Cournot equilibrium. Thus, IIC(ci) = (pc - co)xö + (PC -
cl)xc and so differentiating we get
drIC dpcXc - xc + (PC - co)dx° + (pc - ci)dxl dci dcl 1 dcl dcl
At cl = pM(co), the second and fourth term vanish, and so
dI1C 1 C1=PM(CO) dc1
XC+ (PC - CO) cl
From the first order conditions (3) one obtains
da _ _p'(X)
+ p"(X)xo dpc dcl [p'(X )]2 dcl .
At cl = pM(co) we have xo = XC and thus
dHC IM dpCxC
- (PC - co)p'(X cr),,.,
ý+pl (X c)X c dpc
dcl ci=p (co)- Z-1 IY
(XC)l2 dcl
58

But (pc - co) = -p'(X)xo and so the derivative reduces to
dIIC I 2p'(XC) + pý! (XC)XC dpC dci cy=p'"(ýo)- p'(XC) dcl
The fraction 2pý(XC)+X lX CIXc is positive given the assumption of decreasing marginal rev-
enue. Clearly, under our assumption of constant marginal costs and decreasing marginal
revenue we have d>0.20 It follows that
dHc dcl
Icl=pM(co)> 0.
This means that IIC(cl) raises more steeply than IIB(cl) in a left neighborhood of pM(co).
By continuity, it follows that IIB(ci) > IIG(ci) in a left neighborhood of pM(co).
Proof of Proposition 3. -
Let p and p' denote two price levels, with p< p'. The move from p' to p corresponds to
an increase in the intensity of competition. We must show that Ln(pl sl)
< Ln(a'i (s+l
for all h, with at least one strict inequality. Note that (3) implies
7ri
__ýp_CI 2
0) 1,
whenever firms i and j are active at equilibrium. Differentiating we get
di _2(p-G;
) dp-c')3(c'-ci)
whence it immediately follows that
iri(p) it (p')
73 (p) 7rj (p') for all i, j=0,1, ..., m with j>i. (Al)
Inequalities (Al) imply lro(p) Eo(p') n(p) > HO')
20As is well known, under Cournot competition and constant asymmetric marginal costs, the price is the
same as if all firms shared the same cost c. It is also well known that in a symmetric model with decreasing
marginal revenue, Cournot equilibrium price increases with the marginal cost. These two facts immediately
dj, C > 0. dcl imply that
59

provided that there are at least two active firms at p', whence it follows that
T3 (P) + ir8-i (p) + ... + iri (p) <
7'8 (p') + ir9-i (p') + ... + iri (p') n(p) HO')
i. e., Ln(p)(S+i) < LnW)(s+i).
Clearly, (Al) also implies Lu ,)
(3+1) < Lf(ý, ) (+1). Now suppose to the contrary that
there exists i such that Lf(, ) (s+l) > Ln(j,, ) (s ), and let h be the minimum value of i for
which inequality Ln(p) (s+l) > Ln(,, ') (8+1) holds, so that
irs(p) +ir8-i(p) +... +lrs-h(p) irs(p') +ir8-1(p') +... +Ire-h(p') n(P) n(p')
and ir8 (p) + 78-i (p) +. + 7rs-h-1(p) < irs (p') + i's-l(PI) + ... + 7rs-h-i (p')
II(P) - II(Y) These inequalities imply
7r8-h-i (P) <
Ire-h-1(pß) (A2) II(p) H(/)
and that there exists at least one j>s-h-1 such that
7rj (p) Ij (p') (A3)
II(p) n(PI)
Combining (A2) and (A3) we get
1rs-h-1 (p) 7rs-h-1(p') ltj (P) 7ri(p')
but this violates (Al). This contradiction establishes the result.
Proof of Lemma 4. - First of all, we show that H(z) is monotonically decreasing in z. Differentiating H(z) we
get:
Hý(z) =dM zi+i+l7ri
_- (2 + 1)zzgt(74 - 9lr4+1)
_
(rl2 + 1)zmgm+lým Wz-
t_o (r + z)=+i -
. _o (r + z)z+2 (r + z)m+2
A sufficient condition for the derivative to be negative is that 7ri > g7ri+l. We know from
the proof of Proposition 3 that the ratio p decreases with p. Moreover, because
7ri _2 p q1 ) (A4) 7ri+l p- qi+T
60

and q' is a convex function of i, we have
7ri <
! i+l
7i+l 7i+2
for all i and for all p. Consequently, it suffices to show that pro(p) > glrl(p) when p equals
the monopoly price which always exceeds the Cournot equilibrium price pC. From (A4)
we have
7ro(«)_ «-1 2
11 1
(a) a-Q
Therefore, we must prove that
1-a 2 >9-q1=
aq) 4 1-
or
(1 - a)2 > glack (1 - aq)2
At q=1, the weak inequality is satisfied as an equality. To conclude the proof, it suffices
to show that the derivative with respect to q of the right hand side of the above inequality
is negative. Differentiating we get
q iql-a(1-aq)2] =-1 aa(1-aq)g1-0-1[(q- 1)+q(1-a)] <o.
This completes the proof that H'(z) < 0, which implies that the equilibrium, if it exists,
is unique. To show existence, note that H(0) =>ä and limzýý H(z) = 0. Because
H(z) is continuous, an equilibrium exists.
61

Chapter 3
Differentiated duopoly with asymmetric costs: new results from a seminal model
1. INTRODUCTION
In a seminal paper, Singh and Vives (1984) show that, in a differentiated duopoly, quantity
competition entails higher prices and profits than price competition, whereas quantities
and social welfare are higher under price competition. ' To obtain these results, however,
they effectively restrict the space of parameter values by assuming positive primary outputs
for both firms (i. e. when both prices are set at marginal costs, both firms sell positive
outputs). As noted by Amir and Jin (2001), the assumption of positive primary outputs is
crucial for the Singh and Vives's ranking of the equilibrium quantities under the two forms
of competition. 2
In this chapter, we re-consider the comparison of price and quantity competition in the
Singh and Vives model allowing for a wider range of cost asymmetry between firms. The
analysis reveals that price competition always leads to lower prices and larger social welfare.
However, for high degrees of cost asymmetry and low degrees of product differentiation,
the efficient firm's and the industry profits are higher under price than under quantity
competition. Therefore, Singh and Vives's ranking of profits is reversed in a significant
region of the relevant parameter space. 1 These results hold irrespective of the nature of the goods (substitutes or complements), except that with
complementary goods, the ranking of profits is reversed. 2This fact is apparent in the special case of a homogeneous duopoly with linear cost functions, where the
assumption of positive primary outputs restricts attention to symmetric costs. With cost asymmetry, the
inefficient firm is active in the Cournot equilibrium (provided that the efficiency gap between the two firms is
not drastic) but is inactive in the limit-pricing equilibrium arising under Bertrand competition. Therefore,
the Singh and Vives's ranking of the equilibrium quantities clearly does not hold. Amir and Jin (2001)
nevertheless maintain the positive primary output assumption, and focus on the case when firms produce a
mixture of complementary and substitute goods.
62

The intuition behind our results is as follows. When firms are asymmetric in costs,
price competition not only entails lower prices (price effect) but also a stronger selective
effect against the market share of the less efficient firm (selection effect) than quantity
competition does. While the price effect works towards lower profits under Bertrand than
under Cournot competition for both firms, the selection effect works in the opposite direction
on the efficient firm's profits. Moreover, the price effect weakens while the selection effect
gets stronger when either the degree of cost asymmetry increases or products are closer
substitutes. As a result, the efficient firm earns higher profits under price than under
quantity competition when its efficiency advantage over the rival is sufficiently high and
products are close substitutes. Moreover, the selection effect entails greater productive
efficiency under price than under quantity competition: a larger fraction of total production
is allocated to the efficient firm, so that the industry average cost is lower (productive
efficiency effect) . When cost asymmetry and product substitutability are sufficiently strong,
the productive efficiency effect prevails on the price effect, explaining the reversal of the
industry profit ranking between the two forms of competition.
In the homogeneous goods case, the inversion of the ranking of the efficient firm's profit
under the two modes of competition has been noted before by Acharyya and Marjit (1998)
and Boone (2001). The present chapter generalizes these result, showing that both indus-
try profit and the efficient firm's profit can be higher under Bertrand than under Cournot
competition in a differentiated duopoly with asymmetric costs. More generally, we show
how cost asymmetry and product differentiation together affect the ranking of the equilib-
rium profits under the two modes of competition. Our results are also related to Hackner
(2000). Allowing for both vertical and horizontal product differentiation and symmetric
costs, Hackner shows that the "high-quality firms" may earn higher profit with price than
with quantity competition when there are more than two competitors in the market. In
our chapter we show that the Singh and Vives's ranking of profits is sensitive to cost asym-
metry and horizontal differentiation, irrespective of the number of competitors. 3 Moreover,
3Hackner's formalization of vertical differentiation can be easily reinterpreted as cost asymmetry within
the Singh and Vives model. Therefore, our results show that the crucial factors for the reversal of the
63
we provide a clear intuition of the effects driving the ranking reversal of both industry and leader profits, which can also explain Hackner's result. 4
Finally, our characterization of Bertrand and Cournot equilibria over the entire relevant
parameter space highlights two additional results on the behaviour of the equilibrium profits
when firms are asymmetric in costs. Namely, under both forms of competition, while the
inefficient firm's profits always decrease as products become closer substitutes, the efficient
firm's profits are non-monotonic in the degree of products differentiation. Therefore, the
efficient firm may have a local incentive to reduce the degree of product differentiation.
This contrasts with the standard result that arises with symmetric costs, that is, Bertrand
and Cournot duopolists always gain from product differentiation (see, among others, Shy
(1995), pp. 138-140).
The rest of the chapter is organized as follows. Section 2 describes the model, and
characterizes Bertrand and Cournot equilibria over the relevant parameter space. Section
3 compares the two forms of competition and presents the main results of the chapter.
Section 4 collects additional results on the effect of cost asymmetry on firms' incentive to
differentiate products under both forms of competition. Section 5 provides some concluding
remarks. All proofs are relegated to an appendix.
leader's profit ranking are the degree of asymmetry among firms (either in costs or in product quality) and
the degree of product differentiation, and not the number of competitors in the market. Notice that Hackner
assumes that all firms are active in the market under both forms of competition. On the contrary, we extend
the parameter region of the model to include also the limit-pricing equilibrium that arises under Bertrand
competition with strong firms asymmetry and weak product differentiation. This may explain the difference
between Hackner's result and ours. 4Indeed, Hackner's interpretation of his result is not clear. Having shown that, when the quality differ-
ences are large, the high-quality firms may gain higher profit under Betrand, he concludes that, in such a
case, the high quality firms become insulated from the competition of the low-quality segment, so that price
competition may not hurt firm profits more than quantity competition. This explanation, however, cannot
account for the reversal of the profit ranking. Quite to the contrary, we show that, when products are are
not strongly differentiated, a high cost (or quality) advantage makes the leader "willing to compete tougher"
in the market (i. e. to compete in price rather than in quantity), since the selection effect associated with
price competition prevails on the price effect, leading to higher profits for the leader.
64

2. THE MODEL
We consider the following version of the Singh and Vives (1984) model. 5 On the demand
side of the market, the representative consumer's utility is a symmetric-quadratic function
of two products, ql and q2, and a linear function of a numeraire good, m,
U=a (qi + q2) -21 (qi + q2 + 2'Ygiq2) +m.
The parameter "y measures the degree of product differentiation. We consider the case of
substitute goods: 0< ry < 1. ry =0 and -y =1 set the maximum (independent goods) and
the minimum (homogeneous goods) degree of differentiation, respectively. This utility function generates the linear system of inverse demand functions
pi =a-q- -Y4'ß [i, i 1,2; i 54 j), (1)
whose inversion (by imposing -y < 1) leads to the direct demand system
4i=1 172
[(1 - ry) a- pi + ypj] [i,. 7 = 1,2; i0 j]. (2)
System (2) gives the direct demand functions provided that prices lead to positive de-
mands for both goods. Discarding the trivial case with zero-demand for both goods, the
region of prices where the demand for good i is zero while the demand for good i is positive,
Rj, is identified by
Pi, Pj ?0 Rj = (1 _, Y) ce - pj + 7'pi. << 0 (3)
or-Pi >0
Inside region Rj, the demand function of good i becomes qj =a- p2.
On the supply side of the market, products ql and q2 are produced and supplied by firm
1 and firm 2, respectively. Both firms face linear cost functions, but firm 1 is more efficient
5This specification differs from Singh and Vives (1984) in that we assume symmetric demand functions.
While this assumption allows us to concentrate on cost asymmetry, it is not restrictive since the relevant
measure of firms' asymmetry under both modes of competition can equally reflect cost and demand asymme-
tries (see equation 4 below). Without loss of generality, we normalize to one the coefficients of the squared
terms in the utility function (i. e. the "own quantity slopes" of the inverse demand functions).
65

than firm 2. We set firm 1's marginal cost at cl, where 0< cl <a to avoid the trivial case
in which neither firm has an incentive to produce. Firm 2's marginal cost, c2, will lie in the
range c2 E [cl, a]. We measure the degree of cost asymmetry between the two firms by the
ratio: a- C2
x= , a- Cl (4)
where xE [0,1]. As we will see below, this is the relevant measure of firms' asymmetry in
order to characterize the market equilibrium under both Bertrand and Cournot competition.
Clearly, x decreases as the efficiency gap between the two firms increases. For x=1 (i. e.
c2 = cl), there is no cost asymmetry. For x=0 (i. e. ci < c2 = a), firm 2 is not active in the
market irrespective of the form of competition and the degree of products differentiation.
2.1. The relevant parameter space. -
Firm 1 and firm 2 compete either in prices or in quantities. However, the mode of
competition matters only in a portion of the parameter space. First, when ry = 0, both
firms are monopolists on independent segments of the market. 6 Second, for any 0< ry < 1,
if the efficiency gap between the two firms is sufficiently high, then firm 1 can engage in
monopoly pricing without bearing any competitive pressure from firm 2, which is driven
out of the market irrespective of the form of competition. This is the case when
x< xM (ry) =2 (5)
Equation (5) identifies an increasing monopoly frontier, xM (ry), in the space S= {0 <-
,y<1; 0<x< 1} (see Figure 1). Namely, when products are closer substitutes, a lower
efficiency advantage suffices for firm 1 to monopolize the market irrespective of the form of
competition. 7
61n this case, we get: pr =« a°' , qM = 921, and aM = (i) 2, where p; ý, q1 and irr are firm
i's monopoly price, quantity and profits, respectively (i = 1,2). For c2 > cl, we clearly have: pM < p2 ,
giý>q2 , andirr>7r2 T0n the contrary, the less efficient firm can never engage in monopoly pricing unless ry = 0. Indeed, for
r= (0,1) and x> xM(-y), even firm 2 can price above its marginal cost and face positive demand if the rival
prices at pM" Since pz > pM and cz > cl, the symmetry of the demand system ensures that the same is
66
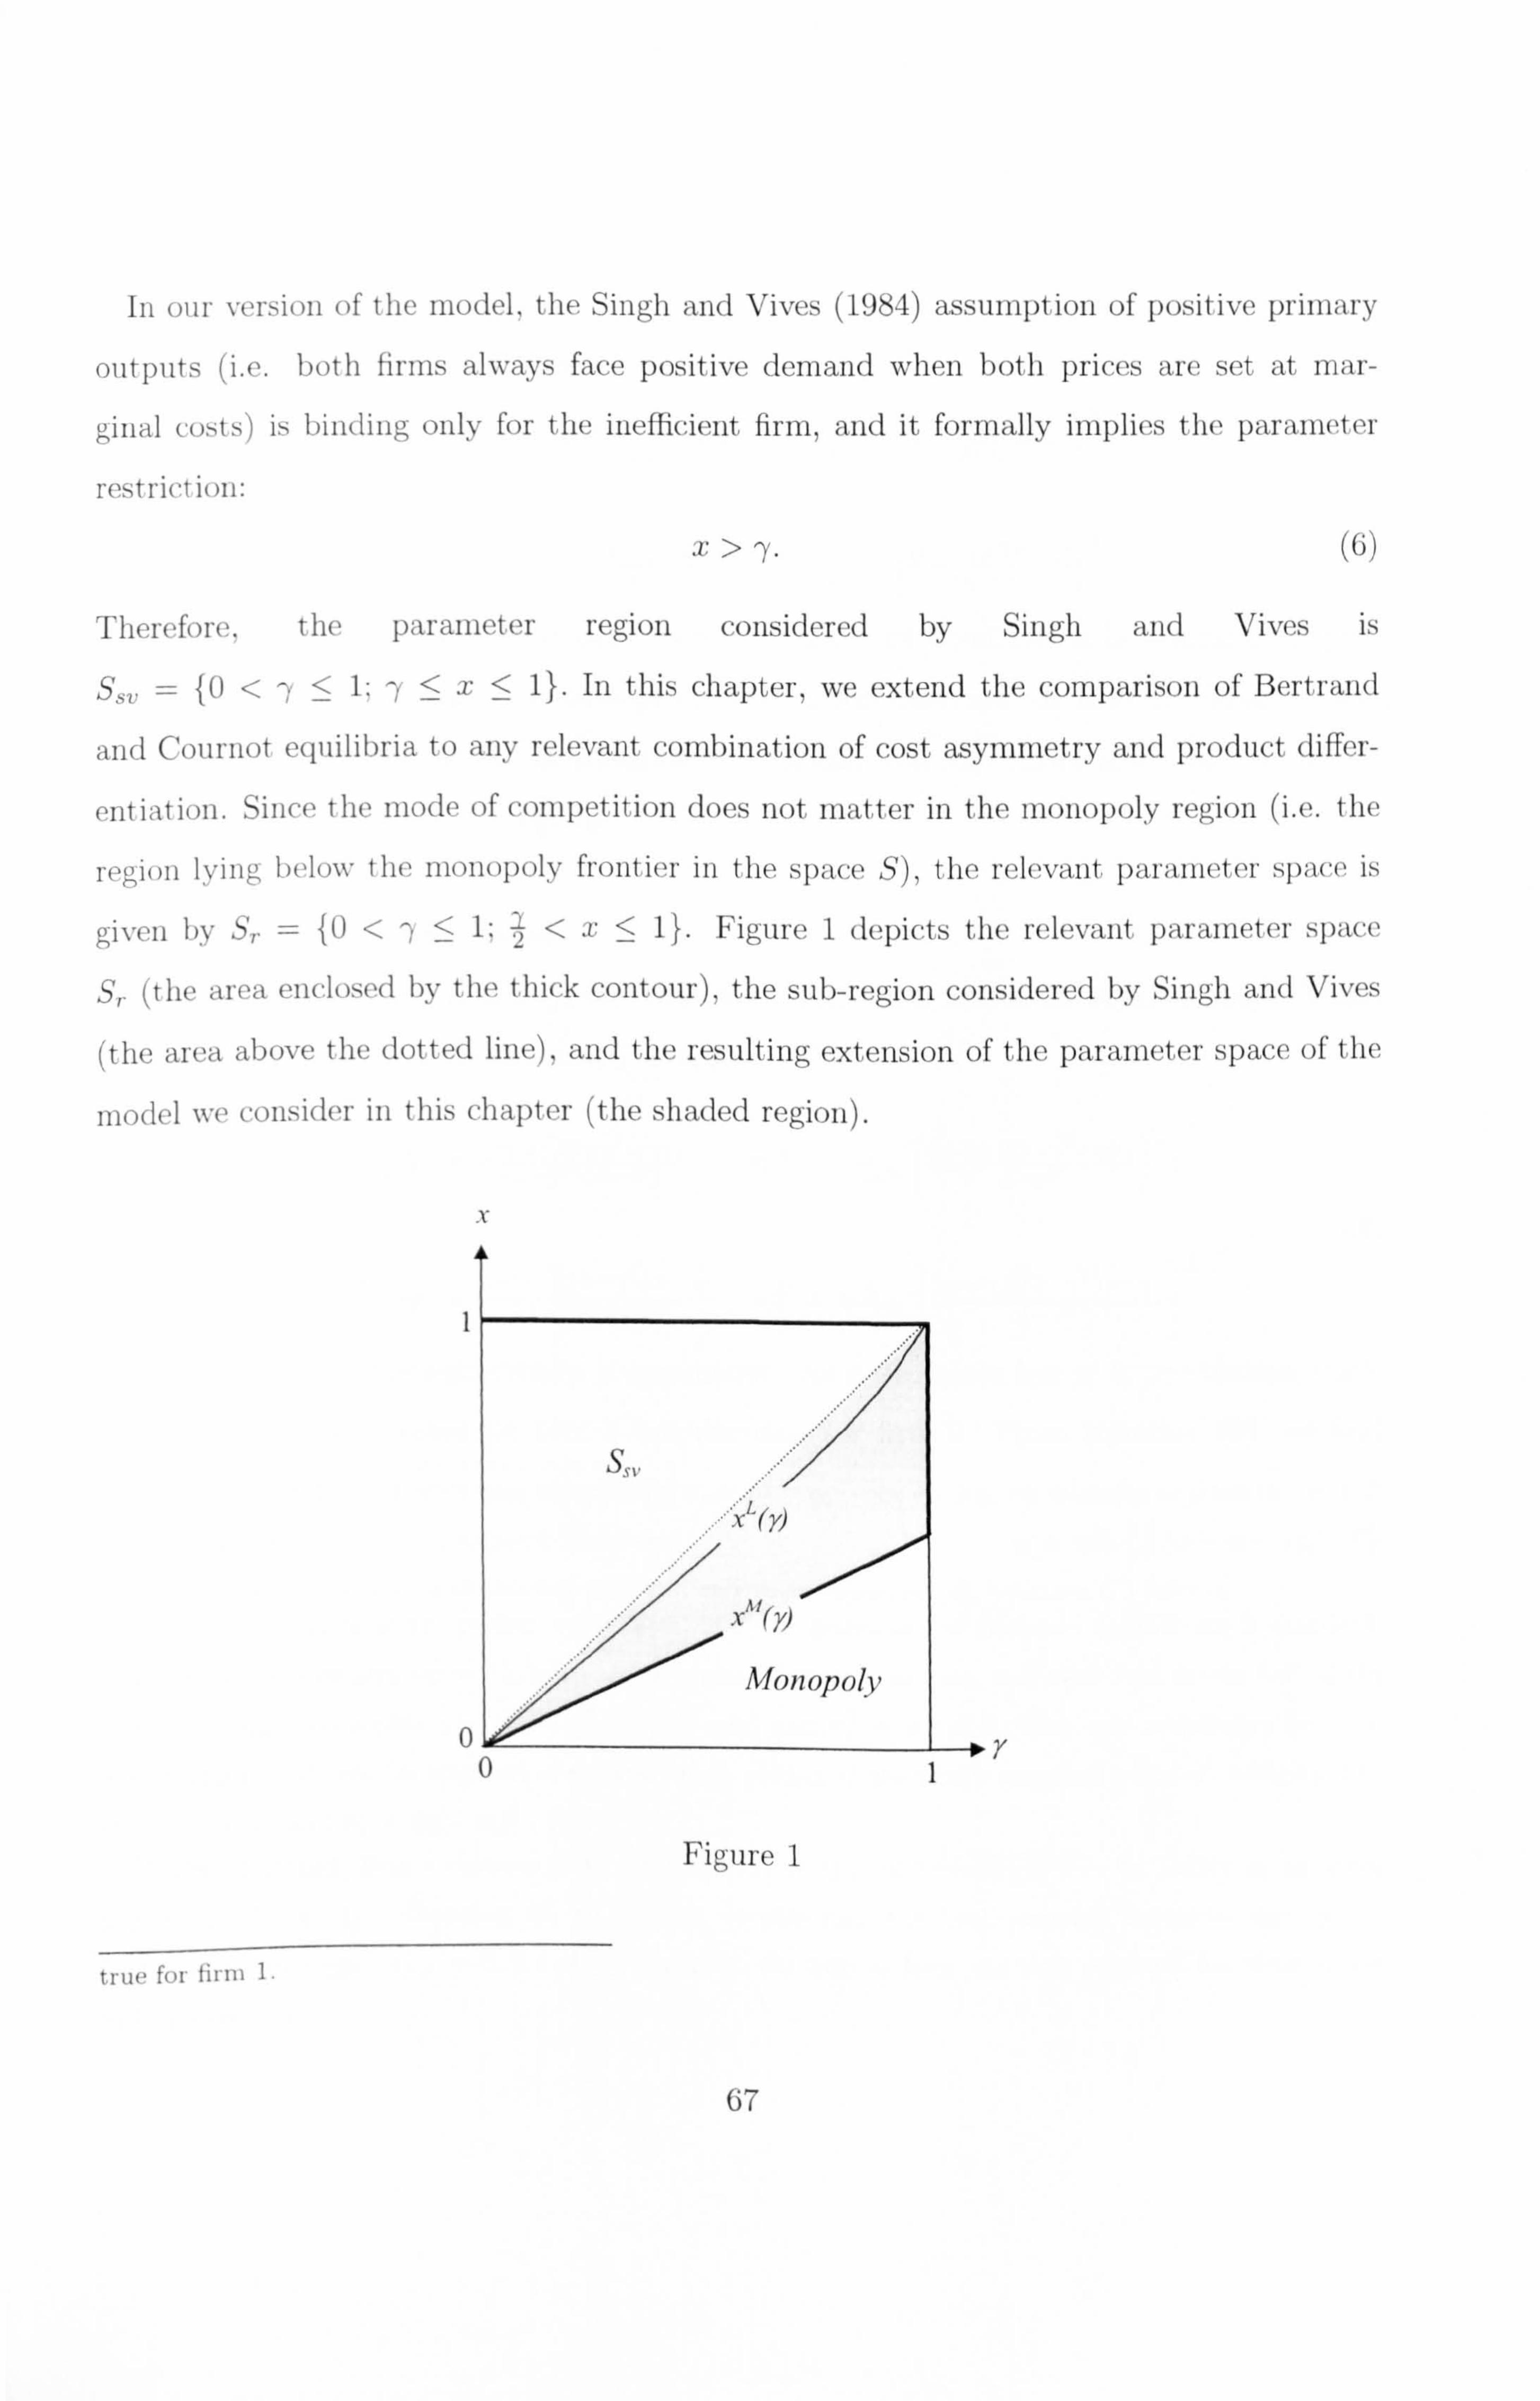
In our version of the model, the Singh and Vives (1984) assumption of positive priinairy
outputs (i. e. both firms always face positive demand when both prices are set at mar-
(, iual costs) is binding only for the inefficient firne, and it formally implies the paraineter
restrict i( )I1
> ry. (6)
Therefore, the parameter region considered by Singh and Vives is
SSZ = {0 < -, < 1: 1<x< 1}. In this chapter, we extend the comparison of Bertrand
and Cournot equilibria to any relevant combination of cost asymmetry and product differ-
entiation. Since the mode of competition does not matter in the monopoly region (i. e. the
region lying below the monopoly frontier in the space S), the relevant pari nieter space is
given by Sr = {U <; <1: z< .r< 1}. Figure 1 depicts the relevant parameter space
Sr (the area enclosed by the thick contour), the sub-region considered by Singh and Vives
(the area above the (lotted line), and the resulting extension of the parameter space of the
model wie consider in this chapter (the shaded region).
l
Y U
Figure 1
tru( fin firnt I
I
67

2.2. Cournot competition. -
Solving the model under Cournot competition, we get: $
C= C_ c-ci 2- x C_ a-ci 2- 2 ql pl Cl = 4-7) ' 7r1
q2 = p2 - C2 - (a-cl )(2x--y).
irC _ a-cl 2x-ry 2
4-7) 2
(7)
From equation (7), as x decreases below 1 (where the equilibrium is symmetric), pro-
duction, unit-profit and profits increase for firm 1 but decrease for firm 2. However, the
inefficient firm remains active in Cournot equilibrium over the entire space Sr (i. e., given
ryE(0,1], g2 >0foranyXE (2,1]).
2.3. Bertrand competition. -
Assume that ry < 1, and suppose that both firms are active in equilibrium. 9 Then,
Bertrand equilibrium is characterized as follows: 10
B cl a - -cl 2- 2- x Qý - 1--y B-1 r(a-ci)(2-72-'1x)12
ý1 -1 , f2 L4-, y2
BB c2 (a-ci) 2-rye x-ry q2 _= 1-ry) 4-ry )
B-1 [(_c1)[(2_2)x_112
- 4-y
(8)
Again, for x=1 the equilibrium is symmetric. As x decreases below 1, production, unit-
profit and profits increase for firm 1 but decrease for firm 2. From equation (8), we find
IUnder Cournot, firm i chooses qi to maximize it = (a - qi - yqj - c; ) q;, by taking qj as given (i, j=1,2;
i# j). This leads to the best response functions: q; = max {2 (a - c; - ryq,, ) ; 0}
(i, j=1,2; i# j). Assuming an interior solution, and using equation (4), equation (7) follows. 9For ry = 1, products are perfect substitutes, and the derivation of Bertrand equilibrium is standard.
With no cost asymmetry (x = 1), both prices equal the marginal cost, and each firm serves half of the
market making zero-profits, i. e. qB = qB = (a - cl) and aB = zr$ = 0. With cost asymmetry (x < 1),
the efficient firm drives the rival out of the market by pricing at the rival's marginal cost, i. e., using eq. (4),
qi =(a-ci)xand7ri =(a-cl)2x(1-x).
"Under Bertrand, firm i chooses pi to maximize ai = (pi - c%) by taking pj as given
(z, j=1,2; i Focusing on an interior equilibrium, the best response functions are: p, =
((1- ry) a+c; + rypj], (i, j=1,2; i0 j). Equation (8) follows from the best response functions above
and equation (4).
68

that, for any yE (0,1), the inefficient firm is active in Bertrand equilibrium (i. e. qB > 0)
provided that
x>XL (ry)=2 y2.
(9)
Equation (9) defines a limit-pricing frontier, xL (ry), which is increasing in ry, meaning that
any efficiency advantage of firm 1 exerts a stronger effect on the rival's market share when
products are closer substitutes (see Figure 1). Moreover, it lies above the monopoly frontier,
meaning that, for any degree of products differentiation (but ry = 0), price competition has
a stronger selective effect against the market share of the inefficient firm than quantity
competition. Finally, by comparing (6) and (9), it is easy to see that the assumption of
positive primary outputs is stronger than the condition for an interior equilibrium under
price competition. "
For xM (ry) <x< xL (y), the following limit-pricing equilibrium arises under Bertrand
competition: 12
Pi -c1=ry[(a-c1)('Y-x)]; 9'i =7(a-ci)x;
1ri =I [(c_ci)2(.
y_x)x];
P2 - C2 = 92 = 7º2 = 0.
(io)
"Indeed, Indeed, condition (6) identifies a lower bound for x which lies above the limit-pricing frontier for any
yE (0,1) (i. e. the dotted line in Figure 1). 12That is, the efficient firm prices good 1 at the maximum level leaving the rival zero-demand for any
price of good 2 higher than the rival's marginal cost. Formally, given ry and x<1, the best response
function of the efficient firm follows the expression given in footnote 9 until prices reach the boundary of
the region R2, where the demand for good 2 is zero. It kinks thereafter and continues along the boundary,
i. e., from eq. (3), pl = ry [p2 - (1 ry) a). Moreover, the best response function of the inefficient firm,
pZ =z ((1- y) a+ c2 + "yp, ], shifts outwards as c2 increases (x decreases). When the efficiency gap is
sufficiently high (i. e. x< x' (7)), it crosses the best response function of the efficient firm along the
boundary of region R2. Equation (10) follows from the best response functions above and equation (4).
69

3. COMPARISON OF BERTRAND AND COURNOT EQUILIBRIA
Let us denote with SA the region of the relevant parameter space where both firms
are active under Bertrand competition (the area above the limit-pricing frontier in Figure
1), and with SL the region where Bertrand competition entails a limit-pricing equilibrium
(the area between the limit-pricing and the monopoly frontiers). Singh and Vives (1984)
restrict their attention to a portion of region SA. In this section we extend the comparison of
Bertrand and Cournot equilibria over the entire space Sr = SA + SL. We start by comparing
the equilibrium prices and quantities.
Lemma 1 (prices) The equilibrium prices of both firms are higher under Cournot than
under Bertrand competition over the entire space Sr.
Lemma 2 (quantities) The efficient firm produces more under Bertrand than under Cournot
competition over the entire space S,.. For the inefficient firm, Bertrand production exceeds
Cournot production if x>7 (i. e. the same as condition (6)).
Lemma 1 confirms the Singh and Vives's ranking of Bertrand and Cournot equilibrium
prices over the entire space S,.. Namely, under price competition firms perceive a more elas-
tic demand than under quantity competition, and this refrains them from increasing prices.
Lemma 2 emphasizes the more selective effect of price competition against the market share
of the inefficient firm. While the efficient firm always produces more under Bertrand com-
petition, the inefficient firm produces less under Bertrand than under Cournot competition
when the cost asymmetry is sufficiently strong and/or products are close substitutes, inside
region SA, as well as over the entire region SL. 13
Turning to the comparison of the equilibrium profits, we first show that the Singh and
Vives's ranking holds over the entire region SA.
13More precisely, Lemma 2 shows that the portion of region SA where both firms produce more under
Bertrand than under Cournot coincides with the parameter region considered by Singh and Vives (i. e. S,,,
in Figure 1).
70

Proposition 1 (Singh and Vives 1984) If both firms are active under Bertrand compe-
tition, they both earn higher profits under Cournot than under Bertrand competition.
Consider now region SL. Obviously, in this region the inefficient firm's profits are always
higher with quantity competition (i. e. positive rather than zero). On the contrary, we prove
now that the efficient firm's and the industry profits are higher under Bertrand than under
Cournot competition in a significant portion of region SL.
Proposition 2 (efficient firm's profits) For any degree of product differentiation (but 44 0), there exists a critical level of cost asymmetry inside region SL, x(ry) = 8_4--,
such that the efficient firm's profits are higher (resp. lower) with Bertrand than with Cournot
competition when x< i(y) (resp. x> x(-y)).
Proposition 3 (industry profits) For any degree of product differentiation (but y= 0),
there exists a critical level of cost asymmetry inside region SL, x(ey) = 8_ 4
+7 , such that
industry profits are higher (resp. lower) with Bertrand than with Cournot competition when
x< ? ('Y) resp. X> i(ry)). 14
Figure 3 shows the two loci, 2(-y) and i(-y), and the portions of region SL where the
efficient firm's and the industry profits are higher with Bertrand competition. "Notice that the critical levels i(y) (Proposition 2) and x(y) (Proposition 3) are both monotonically
increasing in ry, taking values x`(0) _ iý(O) =0 and x(1) < ! ý(1) < 1. Therefore, by Proposition 2, for
any x< z(1), we can always identify a critical degree of product differentiation inside region SL, namely
: fi(x) =x 1(-y), such that the efficient firm earns higher profit under Bertrand for y> ry(x). Similarly, by
Proposition 3, given any x< z(1), 7(x) = Y-'(-y) sets a critical degree of product differentiation inside
region SL, such that industry profits are higher under Bertrand for ry > `ry(x).
71

x
1
0 Figure 3
I'
) K)
The interpretation of these results relies on the comparison of the effects on prices and
market shares exerted by the two forms of competition over regions SA and SL. On one hand,
both firms face lower prices with Bertrand competition over the relevant space of the model,
and this tends to make their profits lower under Bertrand than under Cournot competition
(price effect). On the other hand, when firms are asymmetric in costs, price competition
tends to reduce more the market share of the less efficient firm than quantity competition
does. Obviously this tends to make the efficient firm's profits higher, and the inefficient
firm's profits lower, under Bertrand than under Cournot competition (selection effect). Both
effects work in the same direction for the inefficient firm, while they operate in opposite
directions for the efficient firm. Moreover, the price effect weakens, whilst the selection
effect gets stronger, when either the efficiency gap between the two firms increases or the
degree of product differentiation decreases. 15 Accordingly, the price effect dominates the
"The selection effect reaches its maximum intensity on the limit-pricing frontier, where the market share
of the inefficient firm is zero under Bertrand but still positive under Cournot. On the other hand, the price
effect vanishes on the monopoly frontier, where the prices are identical under the two modes of competition
(i. e., the monopoly price, p 1, for the efficient firm, and the marginal cost, c2, for the inefficient firm).
72

selection effect (i. e. the efficient firm gets higher profits under Cournot) for mild degrees of
cost asymmetry and/or strongly differentiated products (Proposition 1), whilst the selection
effect prevails on the price effect (i. e. the efficient firm earns higher profits under Bertrand)
when the degree of cost asymmetry is sufficiently high and/or products are close substitutes
(Proposition 2). Finally, while the price effect works towards lower industry profits under
Bertrand than under Cournot, the stronger selective mode of price competition relocates
production from the inefficient to the efficient firm, working towards higher industry profits
under Bertrand (productive efficiency effect). The productive efficiency effect dominates
the price effect (i. e. industry profits are higher under Bertrand) for high degrees of cost
asymmetry and/or low degrees of product differentiation (Proposition 3).
The dominance of the selection and productive- efficiency effects over the price effect close
to the monopoly frontier can be easily perceived by the following argument. Consider a slight
reduction of the efficiency gap (i. e. a small increase in x) or a slight increase in product
differentiation (i. e. a small decrease in ry) starting from the monopoly frontier. Under
Bertrand competition, the efficient firm is now forced by outside competition to price below
the monopoly level. However, since the equilibrium price falls just below the monopoly price,
the negative effect on its profits is only second order. In contrast, the inefficient firm holds
a (slightly) positive market share under Cournot competition. Whilst the efficient firm's
price decreases less than under Bertrand, the reduction in the market share of the efficient
firm causes a first order negative effect on its profits. As a consequence, the efficient firm's
profits are greater under Bertrand. Furthermore, being close to the monopoly frontier, the
inefficient firm is forced to price at a level almost equal to its marginal cost under Cournot,
so that the positive effect on its profits is second order as well. Therefore, industry profits
are also greater under Bertrand.
73

3.1. Welfare. - We conclude this section with the welfare comparison of Bertrand and Cournot equilibria
over the relevant space Sr. From the utility function, total surplus equals
TS=(a-cl)gi+(a-c2)g2- [(q1+q2)2
-(1 _7)1 2] (11)
while consumer surplus is given by the difference between total surplus and industry profits.
Clearly, total surplus increases with quantities (as far as the marginal utility of both goods
exceeds the respective marginal cost), while consumer surplus always decreases with prices.
As shown by Lemma 2, Singh and Vives restrict attention to the portion of region SA where
both firms produce more under Bertrand than under Cournot competition. Since prices are
lower under Bertrand, they can easily conclude that both total surplus and consumer surplus
are larger under Bertrand competition. Looking at the other portions of the relevant space,
since prices are lower under Bertrand everywhere (see Lemma 1), the Singh and Vives's
ranking of consumer surplus holds over the entire space Sr. This implies immediately
that total surplus is also larger under Bertrand over the portion of region SL where price
competition entails higher industry profits (see Proposition 3). However, the ranking of
total surplus is not immediate either over the portion of region SA where the inefficient firm
produces more under Cournot, or over the portion of region SL where industry profits are
higher under Cournot. ls Nevertheless, the following proposition shows that the Singh and
Vives's ranking of total surplus extends over the entire space Sr.
Proposition 4 (welfare) Total surplus is higher under Bertrand than under Cournot com-
petition over the entire space Sr.
Summarizing, while consumers always gain from a switch from Cournot to Bertrand com-
petition, for low degrees of cost asymmetry (and/or high degrees of product differentiation)
both firms lose since the price effect dominates the productive efficiency effect. The total
"Notice that, with imperfect substitute goods and asymmetric costs, the comparison of equilibrium prices
is not conclusive for the ranking of total surplus, since lower equilibrium prices do not necessarily imply higher
equilibrium quantities for both goods.
74

surplus rises because the increase in consumer surplus exceeds the decrease in industry prof-
its. In contrast, when the cost asymmetry is high (and/or products are close substitutes),
a switch from Cournot to Bertrand competition increases both consumer surplus and in-
dustry profits, since now the overall effect on industry profits reflects the dominance of the
productive efficiency effect over the price effect.
4. PRODUCT DIFFERENTIATION AND THE MARKET LEADER'S
PROFIT
Our characterization of Bertrand and Cournot equilibria over the entire space Sr reveals
immediately that, in the presence of cost asymmetry, the efficient firm's profits may be
non-monotonic in the degree of product differentiation under both forms of competition.
In fact, for sufficiently high degrees of cost asymmetry (i. e. low values of x), the efficient
firm earns the monopoly profits either for ry =0 or along the monopoly frontier. Since the
profit functions are continuous under both forms of competition, in both cases the efficient
firm's profits must be non-monotonic in ry for high levels of cost asymmetry. In contrast,
the standard result with symmetric costs is that, under both forms of competition, profits
always decrease as products become less differentiated (see Shy (1995), pp. 138-140).
The following two lemma provide a complete characterization of the behavior of firms'
equilibrium profits with respect to the degree of product differentiation, under the two forms
of competition.
Lemma 3 Under Cournot competition, for any xE (0,1], the inefficient firm's profits
always decrease as ry increases from 0 to min{ryM(x), 1}, where ryM(x) = xM-' ('y). On
the contrary, there exist a threshold level xc E (xM(1), 1) and a critical locus ryc(x) E
(0, min{i, M(x), 1}), such that the efficient firm's profits increase with -y if x< xC and
.y> yc(x), and decrease with y otherwise.
Lemma 4 Under Bertrand competition, for any xE (0,1], the inefficient firm's profits
always decrease as ry increases from 0 to yL(x) = XL-1 (y). On the contrary, for any
75

xE (0,1), there exists a critical value ryB(x) E (0, 'yL(x)), such that the efficient firm's profits
decrease with 'y from 0 to 7B (x), while they increase with ry from yB(x) to min{. yM(x), 1}.
As a consequence of Lemma 3 and 4, the conventional result that Bertrand and Cournot
duopolists always gain from product differentiation should be amended in the presence of
cost asymmetries. Indeed, when the degree of cost asymmetry is sufficiently high and/or
products are initially close substitutes, the efficient firm may have a local incentive to reduce
the degree of product differentiation. This is more likely to happen with Bertrand than with
Cournot competition, since, under Bertrand, the efficient firm's profits are non-monotonic
in -y for any positive degree of cost asymmetry (Lemma 4), while a sufficient degree of cost
asymmetry is required under Cournot (Lemma 3).
The intuition behind these results is as follows. A higher degree of product substitutability
lowers the demand functions of both goods, as consumers value less any bundle of the two
products in terms of the numeraire good. If firms are symmetric in costs, this leads to a new
symmetric equilibrium in which firms earn lower profits under both forms of competition.
However, in the presence of cost asymmetry, the demand function of the inefficient firm is
shifted down more since consumers substitute the higher priced good for the lower priced
one. 17 Under Cournot competition the efficient firm benefits from the larger reduction of the
rival's production, which counteracts the negative effect exerted by the increase in y on its
inverse demand function. For sufficiently high degrees of cost asymmetry, the positive effect
will eventually prevail when products become sufficiently close substitutes. Under Bertrand
competition, the larger decrease in the rival's demand function allows the efficient firm to
capture more of the rival's demand at any given price. This counteracts the negative effect
due to the adverse shift in its demand function. Now, for any degree of cost asymmetry,
the positive effect will eventually prevail when products are sufficiently close substitutes. "By equation (2), given an initial pair of prices, the negative shift in the demand function of each firm is
inversely related to the rival's price.
76

5. CONCLUSIONS
In this chapter we have re-considered the comparison of Bertrand and Cournot competi-
tion within the standard model of a horizontally differentiated duopoly with linear demand
and cost functions. Our main innovation with respect to Singh and Vives (1984) has been
to enlarge the parameter space by allowing for any relevant combination of cost asymme-
try and product differentiation. Our main result, that the efficient firm's and industry
profits are higher under Bertrand competition for high degrees of cost asymmetry and/or
low degrees of product differentiation, contrasts with the Singh and Vives's ranking of the
equilibrium profits under the two forms of competition.
The intuition for this result relies on the stronger selective mode of price competition
(selection effect), which also entails greater productive efficiency (productive efficiency ef-
fect). The selection and the productive efficiency effects work towards higher profits for
the efficient firm and for the industry under Bertrand than under Cournot competition,
contrasting the opposite effect due to the lower equilibrium prices arising under Bertrand
(price effect). With high degrees of cost asymmetry and/or low degrees of product dif-
ferentiation, the selection and the productive efficiency effects dominate the price effect,
inverting the standard ranking of profits under the two forms of competition. We have also
shown that, because of cost asymmetry, the efficient firm's profits may be non-monotonic
in the degree of product differentiation under both modes of competition, so that a local
incentive towards less differentiation may arise.
Our results have immediate applications in several strands of literature. Firstly, the IO
literature that analyses the effect of product market competition on firms' incentive to in-
novate. 18 Both the inversion of the profits ranking between the two modes of competition,
and the leader's local incentive towards less product differentiation, can significantly affect
firms' incentive to innovate in multi-stage models with product or process innovation at
the early stages. For instance, as shown in chapter 2, in a single innovation setting, firms'
"Among others, Delbono and Denicold (1990); Bester and Petrakis (1993); Qiu (1998); Aghion and
Shankerman (2000); Boone (2000).
77

incentive to innovate is positively related to the technological leader post-innovation profit,
whereas with cumulative innovations, the incentive to innovate is linked to industry profits. Our result on the reversal of both leader's and industry profits ranking as a function of the
degree of cost asymmetry (i. e. the size of innovations) and degree of product differentiation
can generate interesting results in both settings. Similarly, the leader's local incentive to-
wards less differentiation has immediate implications in a setting where process innovations
generate asymmetry among firms and the degree of differentiation is endogenous, as we have briefly suggested in the conclusion of the previous chapter.
A second area of application is the literature that endogenises the strategic variable and
the timing of competition in oligopolistic games (e. g. Singh and Vives (1984), Hamilton
and Slutsky (1990)). For instance, using their ranking of profits between the two modes
of competition, Singh and Vives (1984) show that both firms would select to quantity
competition as a dominant strategy in a two stage game where they simultaneously choose
the strategic variable at the first stage, and then compete in the market according to
the resulting combination of strategic variables. The reversal of the efficient firm's profit
ranking immediately implies that quantity is not a strictly dominant strategy for that firm
when cost asymmetry and product substitutability are sufficiently high. Whether price
competition can arise in equilibrium is not immediately clear, depending on the ranking
of profits associated with the mixed profiles of strategic variables (i. e. price for one firm,
quantity for the other). This issue is left for future research.
Finally, the reversal of the efficient firm's profit can find interesting applications in the
literature on tacit collusion under the two modes of competition (e. g. Deneckere (1983),
Majerus (1988), Lambertini (1997)). More specifically, modelling the demand side of the
market as in Singh and Vives (1984) but assuming symmetric firms, Deneckere (1983) proves
that collusion is more (resp. less) sustainable in a Bertrand supergame than in a Cournot
supergame when products are weakly (resp. strongly) differentiated. Allowing for cost
asymmetry in this setting, is likely to generates different results. Indeed, the reason why, in
Deneckere, collusion is more sustainable with Bertrand when products are close substitutes
is closely related to the standard ranking of profits between the two forms of competition.
78

Although the short-run deviation profit is higher under Bertrand than under Cournot, the
long-run punishment is more severe under Bertrand (i. e. both firms earn lower profits
in Bertrand than in Cournot one-shot game), and this second effect prevails. Now, as a
consequence of our result, a sufficient degree of cost asymmetry reverses the ranking of the
efficient firm's punishments from deviating under the two modes of competition. Further,
with cost asymmetry, the condition for collusion sustainability is likely to reflect more the
incentive to deviate of the efficient firm than that of the inefficient firm. On this basis, we
guess that the Denekere's result with close substitutes may reverse along the dimension of
cost asymmetry. Also the proof of this conjecture is left for future research.
79

APPENDIX
Proof of Lemma 1. - Using equations (7) and (8), over region SA we get:
C- Bz Pi Pi =ý (a - cl)
z (a - cl) x. P2 C-PB=
743, j! 7
Both expressions are positive for 7, xE (0,1] (and hence, everywhere over region SA). Turning to
region SL, for the inefficient firm we clearly have p2 > p2 = c2. For the efficient firm, equations
(7) and (10) yield:
Ct (2 - y2) (a - Cl) Pi -Pi -y (4 - y2)
[2x - -y].
This expression is positive for yE (0,1] and x>2= xM (y) (that is, everywhere over region SL).
Proof of Lemma 2. -
From equations (7) and (8), over region SA we get:
BC2 _-_l 1- x 41 - 91 - (1-. y2)(4-, y2) [Y
q2 -q2 1_-y)(4 17) [x -')'] .
The first expression is positive for ry, xE (0,1). From the second expression we find immediately
that, for any 7E (0,1), qB - q2 0Xcv. For x=1 and ry -+ 1, the model approaches
a standard homogeneous duopoly with linear-symmetric cost functions (i. e. c2 = cl), and both
expressions converge to the positive limit 'Y 2 Cr-°1 (1 . Turning to region SL, for the inefficient
firm we clearly have q2 > q2 = 0. For the efficient firm, equations (7) and (10) yield:
-c qL -41 -y2 (4 a
-72ý [2x-ry].
This expression is positive for ry E (0,1] and x>2= xM (y) (that is, everywhere over region SL).
80
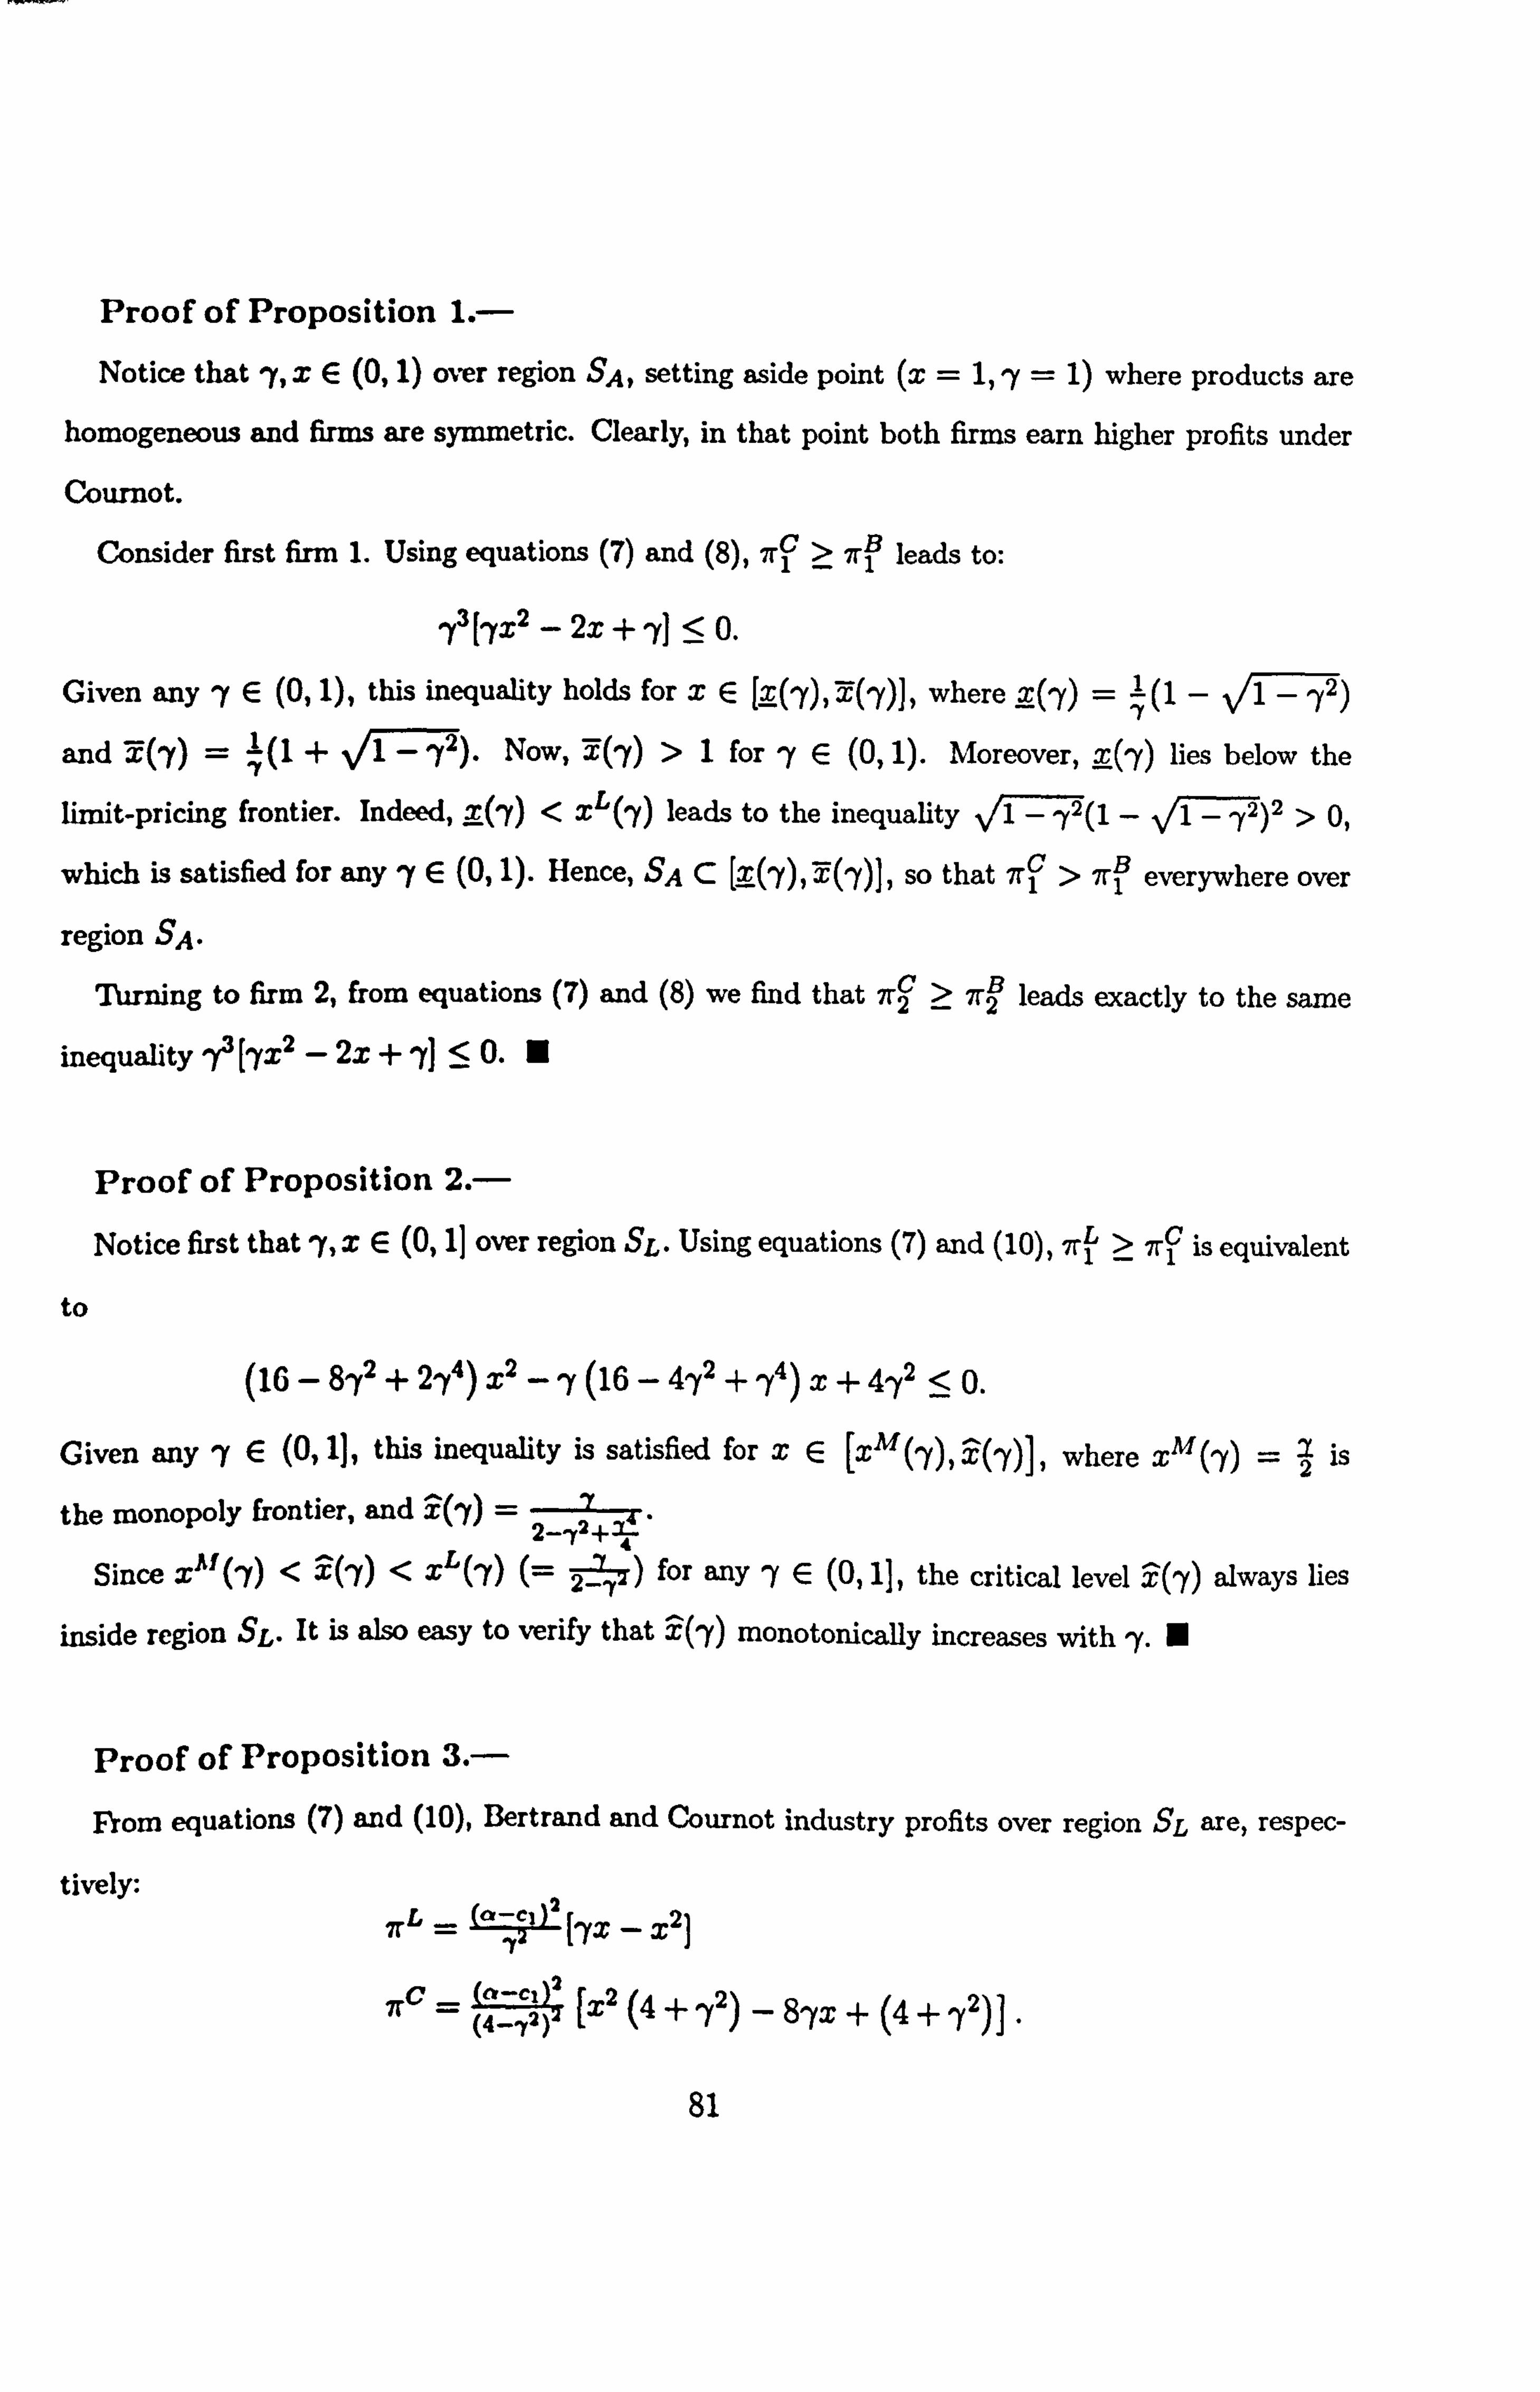
Proof of Proposition 1. - Notice that ry, xE (0,1) over region SA, setting aside point (x = 1, 'y = 1) where products are
homogeneous and firms are symmetric. Clearly, in that point both firms earn higher profits under
Cournot.
Consider first firm 1. Using equations (7) and (8), 7r > 7B leads to:
<_0. 73['x2-2x+ry]
Given any 'y E (0,1), this inequality holds for xE [x(ry), Y(-Y)], where x(-y) =y (1 -1- y2)
and ! (, y) = (1 +1 -'y2). Now, 7(-f) >1 for ry E (0,1). Moreover, x('y) lies below the
limit-pricing frontier. Indeed, T(ry) < xL(ry) leads to the inequality 1- ry2(1 -1- 72)2 > 0,
which is satisfied for any -f E (0,1). Hence, SA C [d(ry), x(y)], so that 7ri > 7r, everywhere over
region SA.
Turning to firm 2, from equations (7) and (8) we find that 7r2 > ir2 leads exactly to the same
inequality ? [7x2 - 2x + ry] <- 0.
Proof of Proposition 2. - Notice first that ry, xE (0,11 over region SL. Using equations (7) and (10), iri > -7rC is equivalent
to
(16-8ry2+2y4)x2-y(16-4y2+y4)x+4y2 <0.
Given any ry E (0,1], this inequality is satisfied for xE [xM(ry), x('y)], where xM(y) =2 is
the monopoly frontier, and X(Y) 2--y2+'14
Since x-"(-Y) < x(ry) < xL(ry) (= -) for any -f E (0,1], the critical level x(ry) always lies
inside region SL. It is also easy to verify that i(1) monotonically increases with 'y.
Proof of Proposition 3. -
From equations (7) and (10), Bertrand and Cournot industry profits over region SL are, respec-
tively: 7rG =aY; A
[1'x - 22ý
s 7r c=
(4 . 2) [x2 (4 + rye) - 87x + (4 + rye) ].
81

Using these expressions, 7rL > 7rC is equivalent to
0. [16-4y2+2y4]x2-y(16+y4)x+y2(4+y2) :5
Solving in x, we find this inequality satisfied for xE [xM (-y) ,x
(ry)] , where XM (ry) =2 is
the monopoly frontier, and 4+
It is easy to verify that xM (y) <x (ry) < XL (y) for any ry E (0,1], so that (may) always lies
inside region SL. Also, i (ry) is monotonically increasing in 'y.
Proof of Proposition 4. - Consider first region SA. Notice that ry, xE (0,1) over region SA, setting aside point (x =
1, ry = 1). In this point, products are homogeneous and firms are symmetric, and the welfare
comparison between Bertrand and Cournot equilibria is standard.
From equations (7) and (11), the total surplus in Cournot equilibrium is:
TSC _ ()2 [(6 - 2ry2)x2 -
(8, y - y3) X+ (6 - 2ry2)]
Similarly, from equations (8) and (11), in Bertrand equilibrium we have
2 (6 - 21'y2 + 12 ßy4 - 76)x2 - (8'y + 3'15 - 11,13) x+
TSB = (1-7
4-1) +(6 -
21, y2 +2 "y4 - 76)
Imposing TSB >T SC, implies
(2. y2 - 2ry4 - 276)x2 - (6 y3 - 7-y5 + -, 7) x+ (2, y2 - 3, y4 -I y6) > 0.
The discriminant of the inequality above,
A= ry4 (60y2 + 55 y6 - 85ry4 + ylO - 15ry$ -- 16) ,
is negative for any ry E (0,1), whilst 2-y2 - 2ry6
- Zy4 > 0. This suffices to prove that the
inequality is always satisfied for ry, xE (0,1).
Consider now region SL. The total surplus under Cournot competition is still given by the
expression above. Under Bertrand competition, equations (10) and (11) yield
TSL a cia [7'x-2x2 ,
Imposing TSB >_ T SC, implies
82

-(8+2ry2)x2+16ryx- 2ry2(12-rye) > 0.
Given any "y E (0,1], this inequality is satisfied for xE [xM (, y) , XTS (y) ], where xM (ry) =2 is the
monopoly frontier, and xTS (ry) =24s- It is easy to verify that xTS (, y) > XL (y) (_ 2-77)-
This means that SL C [xM (ry) , xTS ('y)], so that TSL > TSC over region SL.
Proof of Lemma 3. -
From equation (7), we get:
ö"Z =
2(a-cl) " /4 +2+ (4_, r2)
[-( ) 4x-y]
$ýrC _
2(a-cl) 77 = (a-rye)
[-x(4 + rye) + 4-y] . 14
C From the first expression, is strictly negative as far as i2 >0 (it equals zero on the monopoly
c frontier, where 7r2 = 0). From the second expression,
a'=0 is equivalent to x4 xC(ry).
It is easy to verify that xC(y) is monotonically increasing in ry, taking values xc(0) =0 and
xC(1) =5<1. Moreover, xC(ry) > xM(ry) =2 for any ry E (0,1) (i. e. xc(y) always lies inside
the relevant space Sr). This suffices to prove that, for any xE (0,5 ), the efficient firm's profits
decrease as ry rises from 0 to ryC(x) = xC (ry), while they increase as 'y rises from yc(x) to the
minimum between 1 and ryM(x) = xM-1('y).
Proof of Lemma 4. -
We start with firm 1's profits over region SA. From equation (8), we get:
251B _2a
c) 2-ry2-ryx &p (4-1'2) (1-72)
[-t (4 - 2ry2 + y4ý -x (4 -I- rye - 2y4)ý . B
The first term of this expression is strictly positive for x, ^/ E (0,1). Then, `j' c0 is equiva-07
ry 4-2ry2+ry4 xB (may). It is easy to verify that xB (ry) is monotonically increasing lent to x 14+. y -27 )
in ry, taking the values xB(0) =0 and x8(1 = 1. Moreover, xB(ry) > xL(ry) _ for any
ry E (0,1) (i. e. xB(ry) always lies inside region SA). This suffices to prove that, for any xE (0,1),
the efficient firm's profits decrease as ry rises from 0 to -yB(x) = xB-' (ry), while they increase as ry
rises from yB (x) to yL (x) = XL-1 (y)
83

Turning to region SL, from equation (10) we obtain:
1*1 a- 12 3 [x(2x - y)],
which is positive for any x> xM(y) =2 (that is, everywhere over region SL).
Consider now firm 2's profits over region SA. From equation (8), we get
8_ 2(a-c) (2-'Y2)x-7 fx (4 -2 ry4)) . a7 (4-1s) (1-71) ry
` ry2 + ry4) -
ý4 + rye -2
The first term of this expression is positive for 1<x< xL(ry) = (i. e. over region SA). 24
Then, &" <0 is equivalent to x< 7ý 2 +y)
= x71. Since xB(ry) E [0,1], its reciprocal is
always greater than 1 (it equals 1 only for ry = 1), and the inequality above is always satisfied.
84

Chapter 4
Vertical integration and product innovation
1. INTRODUCTION
One of the most controversial issues in industrial organization is market foreclosure
through vertical integration. ' Though one major advantage of vertical integration is to elim-
inate the problem of double marginalization, the major criticism against vertical integration
is market foreclosure, which has generated a significant amount of literature to examine the
competitive structure of the upstream and downstream industries and welfare. 2 However,
'Vertical foreclosure refers to restrictions in supply (demand) of an essential input an integrated firm
would apply to its downstream (upstream) competitors, extending in this way its market power in a related
market. The negative consequence in terms of welfare would arise from a reduction in consumers' welfare
due to higher prices and lower quantities of the final goods. 2Contrary to the benign view of the so-called Chicago school (e. g. Bork (1978)), denying vertical foreclo-
sure as an equilibrium consequence of vertical mergers, subsequent works have proved vertical foreclosure in
different models of vertical integration. Salinger (1988) shows that a vertical merger in a successive oligopoly
with quantity competition, causes the integrated firm to withdraw from the intermediate good market. The
increased concentration raises the intermediate good price and hence the production cost of the integrated
firm's downstream rivals, whose market shares fall. However, due to the avoidance of double marginalisation,
the effect on the final good price is ambiguous. Riordan (1998) models a vertical merger between an upstream
supplier and a dominant downstream firm. In this model, vertical integration always leads to higher prices
for both the intermediate and the final products. Ordover, Saloner and Salop (1990) consider a successive
duopoly model in which an integrating downstream firm is required to outbid the rival for the acquisition of
an upstream supplier, and the two unintegrated firms (one upstream and one downstream) may react to the
threat of foreclosure by vertically integrating as well. Vertical foreclosure arises in equilibrium provided that
the increase in the input price following a vertical merger increases the joint-profit of the two unintegrated
firms (whilst the individual profit of the unintegrated downstream firm always decreases), what can arise in
the case of differentiated product price competition. Finally, in the recent literature following the incomplete
contracts approach of Hart and Tirole (1990), market foreclosure is strictly linked to vertical integration,
the latter being a means to solve the upstream firm's commitment problem of not expanding input sales in
the downstream market after a contract has been signed with some costumers at monopolistic conditions.
85
surprisingly enough the previous literature on vertical integration has mainly concentrated
on the productive activities of the firms, paying less attention to the non-productive activ-
ities of the firms and particularly, for the downstream firms. 3
In this chapter, we consider product innovation in the downstream market as a strategic
device of downstream firms facing a threat of vertical integration and market foreclosure
by an upstream monopolist. We examine how horizontal product differentiation in the
downstream market affects the incentive for vertical integration and market foreclosure,
and how the possibility of vertical integration affects the downstream firms' incentives to
differentiate products.
We use a simple model in which, without vertical integration, an upstream monopolist
charges a linear price on the sole input required by two downstream firms in order to produce
the final product. In the downstream market, firms compete in quantities. In this setting,
vertical integration of the upstream firm with one of the two downstream firms eliminates
double marginalisation in a segment of the final product market, giving the integrated firm
a competitive advantage over the downstream rival. Moreover, by setting the input price,
the integrated firm affects the downstream rival's costs, and it may choose to foreclose the
market (i. e. monopolise the final product market).
The vertical structure of the market (i. e. vertical integration vs no-vertical integration)
is endogenously determined by an integration game modeled as a sale-auction between the
downstream firms. If the gain from vertical integrating exceeds a fixed integration cost,
the upstream firm calls for offers by the downstream firms in order to integrate one of
them. Then, competition between the downstream firms in the integration game allows the
See Rey and Tirole (2004) for a comprehensive survey of this literature. 30ne exception is Baake, Ulrich and Norman (2004). They consider capital investment as a non-
productive strategic decision of the upstream firm in the Hart and Tirole (1990) model. They show that
banning vertical integration has the social cost of a sub-optimal level of capital investment, leading to
productive inefficiency in the market. In contrast, vertical integration assures the efficient level of capital in-
vestment but output is monopolistically restricted. In this chapter, we take a different perspective by giving
the downstream firms a non-productive strategic variable (i. e product innovation) in a vertical integration
game.
86

upstream firm to appropriate more than the full surplus from integration, and reap most of
the profit created in the final product market. 4 Therefore, vertical integration is a threat to
the downstream firms at the initial stage of the game, when they can invest to differentiate
products.
Besides the usual effect of softening competition in the downstream market, product
innovation exerts two more effects in our model. Product differentiation eliminates market
foreclosure under vertical integration, and it affects the possibility of vertical integration.
The elimination of market foreclosure encourages innovation in the downstream market.
However, the trade-off between the benefits from eliminating market foreclosure and soft-
ening product market competition, on one hand, and the loss from vertical integration,
on the other hand, makes the impact of vertical integration on innovation ambiguous. In
fact, we show that whether vertical integration is more likely for higher or lower degrees
of product differentiation is ambiguous and depends on the cost of integration. If the cost
of integration is very small, vertical integration occurs always. If the cost of integration is
moderate, vertical integration occurs for very small and very large degrees of product dif-
ferentiation. If the cost of integration is sufficiently large, but not large enough to prevent 4Relative to the recent literature on vertical integration following Hart and Tirole (1990), our model
relocates upstream firm's bargaining power from the bargaining game for the essential input to the vertical
integration game. In the Hart and Tirole model (ex-post monopolisation variant), the upstream monopolist
reaps all the industry profit by making take-or-leave-it offers of non-linear tariffs for the essential input to
the downstream firms. Vertical integration (and vertical foreclosure) solves the upstream firm's commitment
problem of not selling more input to other downstream firms at the disadvantage of those who bought the
good at monopoly conditions at the first place (without vertical integration, the downstream firms refuse
to buy at monopoly conditions in anticipation of the upstream firm's myopic incentive to sell more ex-
post). Therefore, vertical integration consents the upstream firm to realise a higher industry profit (i. e. the
monopoly profit), not a higher share in the industry profit at the disadvantage of the downstream firms.
In our model, the upstream firm sells the input at a linear price, so that, without vertical integration, the
downstream firms gain positive profits. On the other hand, the upstream firm extracts profits from the
downstream firms through vertical integration, by putting them in competition to be integrated. Obviously
this requires that the downstream firms cannot commit to a collusive behaviour when facing the call for
integration offers from the upstream firm.
87

vertical integration, then vertical integration occurs for very large degrees product differ-
entiation. Therefore, while higher product differentiation softens competition in the final
goods market, it may also create the threat of vertical integration, which helps the upstream
firm to extract more rent from the downstream firms. As a consequence, there are situations
where the downstream market prefers relatively lower degrees of product differentiation to
prevent vertical integration. So, instead of market foreclosure, we show a new possible cost
of vertical integration, i. e., lower product innovation.
The rest of the chapter is organised as follows. In Section 2, we present the model, which
consists of a three-stages game with the following timing: innovation stage (first stage),
integration stage (second stage), market stage (final stage). In Section 3, we solve the
market stage under the two alternative market structures (vertical integration vs. no-vertical
integration), and we discuss the effect of product differentiation on market foreclosure.
Section 4 analyses the vertical integration game, and shows how the vertical integration
outcome depends on product differentiation and integration costs. In Section 5, we study
the effects of vertical integration on product innovation. In Section 6 we point out that
the possibility of vertical integration can cause the social cost of less product innovation.
Finally, Section 7 provides some concluding remarks.
2. THE MODEL
We consider an economy with upstream and downstream markets. In the upstream
market, a monopolist (firm U) produces the sole input needed by two downstream firms
(firms Dl and D2) in order to produce their final products. We assume that the upstream
monopolist produces the essential input at zero-costs. The downstream firms share the
same production technology, which requires one unit of input in order to produce one unit
of final product.
Although the downstream firms use the same production technology, their final product
can be differentiated at the outset by investing in R&D. More precisely, on the demand side
of the downstream market, the degree of product substitutability perceived by consumers,
88

'y, leads to the inverse demand system:
pi=a -Ali -'Yqi (i, j=1,2; i j), (1)
where ry E [0,11.5 With ry = 0, consumers perceive products 1 and 2 as independent goods,
while ry =1 corresponds to consumers' perception of perfect substitutes.
The perceived degree of product substitutability depends on the downstream firms' R&D
effort. We set aside any strategic consideration related to R&D competition between the
downstream firms. The strategic effects involved in R&D competition for product differ-
entiation within the same duopoly model we adopt here for the downstream market, are
already analyzed by Lambertini and Rossini (1998). Due to the positive externality exerted by the R&D investment of each firm on the rival's profit, a simultaneous R&D game can lead to a prisoner dilemma equilibrium. Therefore, final products can remain homogeneous
even if product differentiation would increase both firms' profits.
Since R&D competition strongly complicates our model without qualitatively affecting
the nature of the effects of vertical integration on product innovation (and so, our main
conclusions), we adopt the simplifying assumption that only one firm can invest in R&D.
By paying a fixed R&D cost k, the innovative firm can reduce the perceived degree of
product substitutability from ry =1 (perfect substitutes goods) to -y = ry E [0,1). Without
the R&D investment, products 1 and 2 are perceived as perfect substitutes by consumers.
Notice that, whilst this assumption can be justified by only one downstream firm having
the capability to alter consumers' perception of product substitutability, an alternative
interpretation of our model is that the downstream firms can cooperate at the R&D stage
of the game. Under this interpretation, firms solve the incentive problem arising from the
symmetric effect of product differentiation on the demand of both goods by reaching an
agreement on the joint R&D effort. Clearly, with cooperation, the joint R&D effort will
depend on the joint gain arising from product differentiation, whereas one firm's R&D effort 5The demand side of the downstream market is a simplified version of Singh and Vives (1984). The
inverse demand sistem (1) is generated by the utility function: U= a(ql + q2) -2 (ql + q2 + 2^yglq2) + m,
where m is a numeraire good.
89

depends only on its individual gain. However, since the downstream firms turn out to be
symmetric in any respect at the innovative stage of the model, the assessment of the effect
exerted by vertical integration on product differentiation is qualitatively the same. 6
After the R&D decision is taken, the vertical integration game takes place. The upstream
firm may call for (simultaneous and independent) price-offers by the downstream firms in
order to integrate one of them. On the basis of the offers received, the upstream firm decides
whether or not to integrate the downstream firm asking for the lowest price (in the case
of tie, we assume that both downstream firms have fifty percent probability of merging
with the upstream firm). We further assume that vertical integration involves a fixed cost,
denoted by E. 7
The outcome of the integration game sets the structure of the markets. If vertical in-
tegration does not occur, the upstream monopolist supplies the essential resource to the
downstream firms charging a linear price wv,. 8 The input price acts as the marginal cost 'As we will see below, the downstream firms share identical profit expectations under any subsequent
evolution of the game (i. e. vertical integration vs. no-vertical integration). Hence, the identity of the
innovative firm is irrelevant. Moreover, the joint gain the two firms derive from product differentiation is
always twice the individual gain of the innovative firm. Therefore, the joint incentive to differentiate products
if the downstream firms can cooperate in R&D - as measured by the highest joint-R&D cost they are willing
to pay in order to obtain any given degree of product differentiation - is always twice the innovative firm's
incentive. Hence, our results apply immediately to the case of R&D cooperation by simply scaling-up the
measure of the incentive to invest in R&D.
7See Hart and Tirole (1990) for the interpretation of the cost of vertical integration. Also similarly to
Hart and Tirole (1990), we assume away the possibility of merger between the downstream firms. Hence, if
vertical integration occurs, firm U can integrate with one downstream firm only. This can be justified by
the cost of integrating both downstream firms being prohibitive. 8Our assumption of linear pricing for the input is similar to Choi (1991), Gerstner and Hess (1995),
Colangelo (1995), Economides (1998), Villas-Boas (1998), Tyagi (1999), Rao and Srinivasan (2001) and
others. A similar assumption can also be found in the literature on `access pricing' (e. g., Armstrong et
al. (1996), Armstrong and Vickers (1998), De Fraja and Price (1999)) and on `channel coordination' (e. g.,
Gerstner and Hess (1995)). The assumption of linear pricing may be justified by the arguments given by
Rao and Srinivasan (2001) in the context of franchising. If the upstream and the downstream firms are
in ongoing relationship where the demand and cost conditions vary over time, the uniform pricing of the
upstream product is optimal if significant costs are involved in re-writing the contracts between the upstream
90

of production for both downstream firms, which finally compete ä la Cournot in the down-
stream market. If vertical integration occurs, the downstream market is populated by a
vertically integrated firm (firm V), and an independent firm (firm I). The integrated firm
disposes of the essential resource at zero-cost, and sets optimally the price of the input
supplied to the rival, w,,. Finally, the two firms compete ä la Cournot in the downstream
market.
Summarising, the model consists of three stages. In stage 1, the R&D decision is taken by
the innovative (downstream) firm, and the degree of product differentiation is determined.
In stage 2, the vertical integration game takes place, and the market structure is determined.
In stage 3, the price of the essential resource is set by firm U (or firm V, under vertical
integration), and Cournot competition takes place in the downstream market. Production
and profits are finally determined. Our solution concept is perfect subgame equilibrium,
therefore we solve the game by backward induction starting from the market stage.
3. THE MARKET STAGE
At the market stage, the degree of product differentiation, y, and the market structure
(i. e. vertical integration vs. no-vertical integration) are already determined.
We start with the market equilibrium without vertical integration. Given the input price,
wu, the downstream firms (Dl and D2) face the same marginal cost. Hence, Cournot com-
petition leads to a symmetric equilibrium in the downstream market, where the downstream
firms produce DDa-w,, 9i (wu) = q2 (W-) =2
-}- y
and earn profits 2
7D('ß") _ 7r2 2+-y
The upstream monopolist faces the demand function for the essential input 2(-w1, so that
and downstream firms.
91

he sets the input price, wu, to maximize
lr 2 (a -wu) v(wu) = Wu 2+7
This leads to the input price:
wü = 2. (2)
Finally, firms' equilibrium profits without vertical integration are:
z (a)2 1 7r1°Z= 2+, y
3
_ (a)2 2
ýU - 22+ry (4)
We turn now to the market equilibrium under vertical integration. The integrated firm
produces its final product at zero-cost, and charges the linear price w� on the input sold to
the independent firm. Given w,,, Cournot competition leads to an asymmetric equilibrium
in the downstream market, where the independent firm (I) and the integrated firm (V)
produce, respectively:
41(w�) =a (2 - ry)
2 2w�
4V(wv) =a (2 - -y) + ywv
4-ry 4 -rye
The corresponding profits are:
1- 1a(2-ry)-2w�]2 (w9) L4-, y2
J
for the independent firm, and
7rv(wv) (a(2-'Y)+ywv12+wva(2-y) -2wv L 4-y2 J 4-y2
for the integrated firm, where the second term of the integrated firm's profit comes from its
sales of the essential input to the rival. The input price, w, is set by the integrated firm
to maximise 7rv(w�), leading to:
a (2 - -y) (27 +4- rye) (5) w" 2 (8 - 3ry2)
92
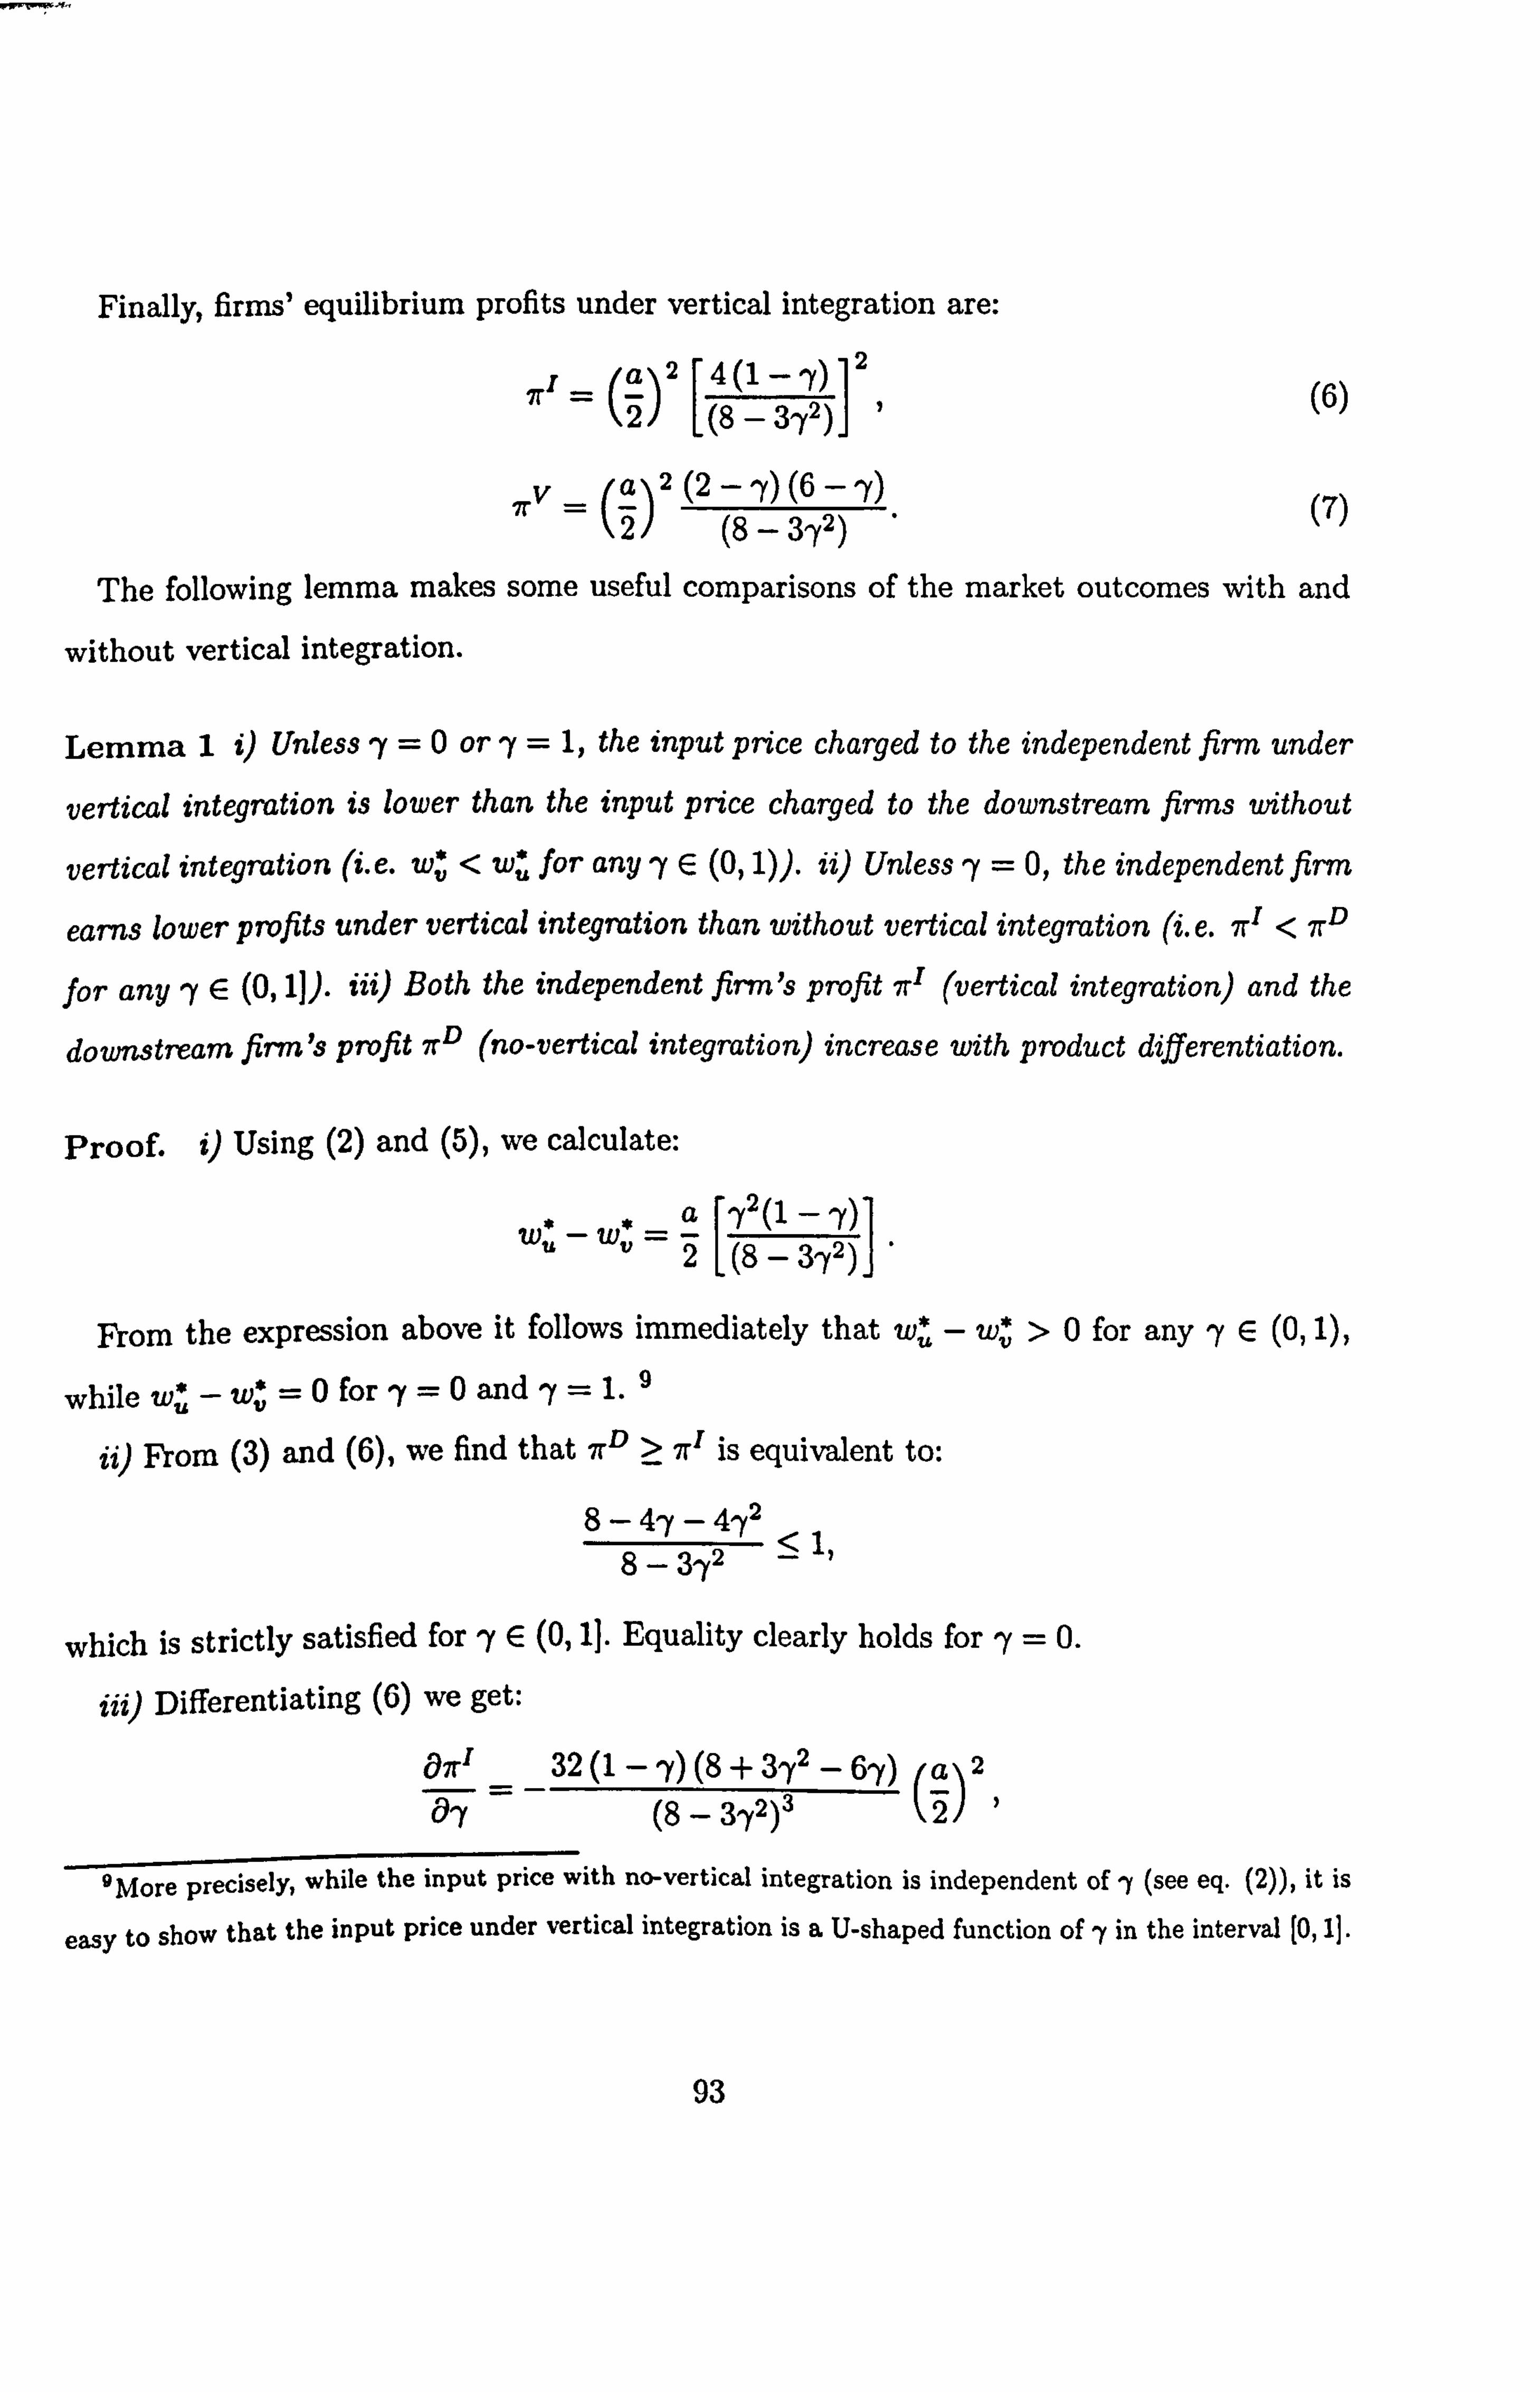
Finally, firms' equilibrium profits under vertical integration are:
= (a)214(1_.. Y) 6
2()
(8 - 3-f2)
]
irv - (a)2(2-_-Y)(6_'Y) 7 (8 - 3ry2)
()
The following lemma makes some useful comparisons of the market outcomes with and
without vertical integration.
Lemma 1 i) Unless y=0 or y=1, the input price charged to the independent firm under
vertical integration is lower than the input price charged to the downstream firms without
vertical integration (i. e. w, *, < wü for any ry E (0,1)). ii) Unless ry = 0, the independent firm
earns lower profits under vertical integration than without vertical integration (i. e. 7rI < irD
for any ry E (0,1]). iii) Both the independent firm's profit 7rl (vertical integration) and the
downstream firm's profit itD (no-vertical integration) increase with product differentiation.
Proof. i) Using (2) and (5), we calculate:
u- w�. a 'Y2(1 - -y) w2
[(8-3ry2),
From the expression above it follows immediately that wü - w, *, >0 for any ry E (0,1),
ry=l. 9 while wü-w, `, =0for ry=0and
ii) From (3) and (6), we find that 7° > irI is equivalent to:
8-4ry-4.2 8-3y2
which is strictly satisfied for yE (0,11. Equality clearly holds for ry = 0.
iii) Differentiating (6) we get:
äßr 32(1-y)(8+2-6y) l(a)2 ay (8 - 3, y2)3 J
sMore precisely, while the input price with no-vertical integration is independent of ry (see eq. (2)), it is
easy to show that the input price under vertical integration is a U-shaped function of ry in the interval [0,11.
93

which is strictly negative for It E (0,1) (it equals zero for ry = 1). Similarly, from (3) we
obtain: äirD
=2 (a)2 ay (2+y)3 2
which is strictly negative for ry E [0,11.
3.1. Vertical integration and market foreclosure. -
Before proceeding to the previous stages of the game, we pause here to discuss the effect
of product differentiation on the possibility of market foreclosure under vertical integration.
Market foreclosure occurs if only the vertically integrated firm is active in the downstream
market, i. e. q'(wv) = 0.
Proposition 1 Vertical integration leads to market foreclosure only when products are per- fect substitutes (i. e. for ry = 1). In contrast, market foreclosure never occurs under vertical
integration when products are differentiated (i. e. for any ry E [0,1)).
Proof. From the expression of ql (w�), the independent firm is inactive in equilibrium
if w;, >a2. Using equation (5), we find that w;, < 22 for any ly E [0,1), while
wv °2 for -y = 1. That is, market foreclosure occurs only for ry = 1. In contrast, the
independent firm remains active in the market for any yE [0,1).
The interpretation of proposition 1 is as follows. The integrated firm has a strategic incen-
tive to raise the input price charged to the independent firm, since its price and production
in the downstream market increase with the rival's marginal cost. On the other hand, its
sales of the essential input decrease. Intuitively, the strategic incentive is stronger the higher
the degree of product substitutability (it actually vanishes if products are independent, i. e.
for ry = 0). According to proposition 1, only when products are perfect substitutes the
strategic incentive is strong enough to induce the integrated firm to foreclose the market
and stop supplying the essential input to the rival. 10
'°To see this, suppose that products are perfect substitutes, and that the integrated firm engages in
monopoly pricing in the product market while charging the rival the minimum input price such that rival's
94

Proposition 1 has an interesting implication for the previous stages of the game. Since
product differentiation allows to avoid market foreclosure, it also guarantees both down-
stream firms positive profits under vertical integration. On one hand, the independent
firm can assure a positive profit only if products are differentiated. On the other hand,
by allowing the independent firm to gain a positive profit, product differentiation helps
the downstream firm that vertically integrates to extract a positive profit from vertical
integration even if the upstream firm has full bargaining power.
4. THE VERTICAL INTEGRATION GAME
Having solved the final market stage under the two alternative market structures, we are
now in the position to examine the incentive for vertical integration. Recall that, at the
vertical integration stage, the degree of product differentiation is already determined. We
start by noting that there is a positive surplus to gain from vertical integration provided
that the integrated firm's profits, net of the fixed cost of integration, exceed the joint profits
of the two firms involved in the merger (i. e. the upstream monopolist and one downstream
firm) without vertical integration. Let us denote with S= 1rt' - (7rU + 7rD) the surplus
from vertical integration before the integration cost, so that the profitability condition for
production is zero. Notice that, with perfect substitutes, such a critical input price coincides with the
monopoly price the integrated firm is charging in the product market (i. e. the monopoly price arising from
the demand system (1) with ry = 1, and zero-marginal cost). Consider now a small decrease in the input
price below the critical level. We can distinguish three effects on the integrated firm's profits. First, the
equilibrium price of the final product decreases. However, the negative effect on the integrated firm's profit is
only second order, since the product price falls just below the monopoly price. Second, the independent firm
enters the market with a (slightly) positive production, reducing the integrated firm's production of the final
good by a corresponding amount. Third, the integrated firm's sales of input increase by the same amount
of the independent firm's production of the final good. Therefore, the integrated firm's sales of input equal
the reduction in its sales of the final product, but the price of the input lies below the monopoly price of the
final product. This means that the second (negative) effect dominates the third (positive) effect, and the
integrated firm's profit decreases. The basic difference with differentiated products is that, when products
are imperfect substitutes, the critical level of the input price lies above the integrated firm's monopoly price.
Then, the second effect is dominated by the third effect, and the integrated firm's profit increases.
95

vertical integration is:
S>E (8)
When condition (8) holds, each downstream firm has always an incentive to make a price-
offer to be vertically integrated. If firm D2 does not make any offer, it is convenient for
firm Dl to make an offer between 7rD and .D+ (S - E). Since a positive surplus is left
to the upstream firm, the offer will be accepted, and the bidder will gain a higher profit
than under the alternative of not making any offer (without any offer, vertical integration
does not occur, and both downstream firms earn 7rD). Alternatively, if firm D2 makes the
offer above, then it is convenient for firm Dl to undercut the rival's offer, since 7rD > 7rI
(see lemma 1). Furthermore, each downstream firm has always an incentive to undercut
any rival's offer O, greater than Irl. By bidding above the rival, a firm ends up being the
independent firm under vertical integration, earning r'. By matching the rival's offer, it
has equal chances of being independent or integrated, with expected profit 2 (OO + irl). It
is then optimal to bid just below the rival, say O, - e, which assures to be integrated with
a profit O, -c (> 2 (Oj + 7CI) > 7r1). Then, the unique Nash equilibrium pair of offers by
the downstream firms is (zrI, ir'). The upstream firm is left with more than the full surplus
from integration, so that it will certainly call for offers at the outset, and vertical integration
occurs. Notice that, due to competition in price-offers to be integrated, the downstream
firm that is finally integrated reaps only its outside option under vertical integration (i. e.
the equilibrium profit of the independent firm).
Assume now that condition (8) does not hold. In this case, since the net surplus from
integration is negative, the upstream firm rejects any price-offer equal to (or greater than)
D. Then, if the upstream firm calls for offers, the unique (relevant) Nash equilibrium
of the game is that both downstream firms make an offer which leaves the upstream firm
with negative surplus (any offer above .D- (E - S) will do), and the upstream firm
rejects. " Then, vertical integration does not occur, and both downstream firms earn profit
IrD. Anticipating this equilibrium outcome, the upstream firm will not call for offers at the
11 Clearly, neither downstream firm has an incentive to deviate, and make a price-offer low enough to be
acceptable by the upstream firm. The deviant would be integrated at a price below 7rD
96

outset. 12
We have proved:
Lemma 2 If the net surplus from integration is positive (i. e. S> E), vertical integration
always occurs, and the downstream firm involved in the merger earns the same profit as the
independent firm, i. e. Irl. If the net surplus from integration is negative (i. e. S< E),
vertical integration never occurs, so that both downstream firms earn profit irD.
In view of the first stage of the model, the following proposition characterises the market
structure that arises after the integration stage as a function of the degree of product
differentiation and the integration cost level. By lemma 2, this amounts to evaluate the
sign of the net surplus from integration, S-E, along the range of product substitutability
7E [0,1]
Proposition 2 a) When the integration cost is small, vertical integration occurs for any
degree of product differentiation. b) When the integration cost is moderately high, vertical
integration occurs only for large or for small (but not for intermediate) degrees of product
differentiation. c) When the integration cost is high (but not prohibitive), vertical integration
occurs only for very large degrees of product differentiation.
Proof. Using equations (3), (4) and (7), the surplus from integration before the integration
cost, S, can be written as:
S (, Y) = (a)2 8- y2 + 2ry3 + . y4 (9)
2 (8-3y2)(2+ Y)2
Inspection of (9) suffices to show that S(7) >0 for any -y E [0,1], taking values S(1) < S(0).
Furthermore, we prove in Appendix 1 that S(-y) is a U-shaped function of ry over the interval
[0,1], reaching a minimum value for' = 0.61037 (see Figure 1 below). From the shape of
12A qualification of this result is in order. When condition (8) does not hold, the pair of offers (irl , 7r1)
still identifies a Nash equilibrium, but firms are playing weakly dominated strategies. We select it away for
this reason.
97

S(-y), the proof of proposition 2 is straightforward. Let us denote with Sm the minimum of
S(-y). Then:
a) if E<S., vertical integration occurs for any ry E [0,1];
b) if Sm <E< S(1), there must be two critical degrees of product differentiation, say
rybl and -1b, (with 'Y6, < rye), such that vertical integration occurs for If < 'Y61 and 'Y > ry62
whilst it does not occur for ry E [rybl, ry, ];
c) if S(1) <E< S(0), there must be one critical degree of product differentiation, say
Itc (< 761)+ such that vertical integration occurs only for -t < -yr.
Finally, if E> S(0) vertical integration never occurs (that is, S(0) identifies a threshold
level above which the integration cost becomes prohibitive).
"j) ý S(T)
Ec A S(1)
Eb
E.
0 Yc Ybl 7b2 1
Figure 1
The interpretation of proposition 2 relies on the U-shaped behaviour of the gross surplus
from integration as the degree of product differentiation decreases (see figure 1). Notice first
that a positive surplus from integration may come from two sources in our model: 1) the
avoidance of double marginalisation in one segment of the final product market (the one of
the downstream firm that is integrated); 2) the efficiency advantage (i. e. the lower marginal
cost in producing the final product) the integrated firm has relative to the independent firm
in the downstream market. 13
13The efficiency advantage allows the integrated firm to expand its equilibrium production of the final
98

Suppose now that products are independent (i. e. ry = 0). In this case, only the first source
of surplus is active, since the two segments of the downstream market are isolated. As the
degree of product differentiation starts decreasing (i. e. ry starts increasing from 0), the total
demand in the product market starts decreasing as well, since consumers value less any
bundle of the two products relative to the numeraire good. 14 The fall in the gross surplus
from integration is then explained by the lower gain from avoiding double marginalisation
in a smaller market, while the second source of surplus (i. e. the efficiency advantage) is
still irrelevant (since products are almost independent). 15 Only when the degree of product
differentiation is sufficiently low, the second source of surplus plays a significant role. Then,
the efficiency advantage of the integrated firm allows it to soften the negative effect exerted
by an increase of ry on the demand for its final product, since consumers tend to substitute
the high priced product of the independent firm for the low priced product of the integrated
firm. Moreover, the integrated firm benefits from the higher reduction of the rival's demand
while playing the Cournot game in the product market. Hence, the integrated firm has
an incentive to increase the rival's cost (by rising the input price) as the degree of product
differentiation further decreases. 16 This means that the second source of surplus strengthens
as the degree of product differentiation decreases. When products are sufficiently close
substitutes, the second source plays a dominant role, inverting the sign of the relationship
between product differentiation and surplus from integration.
good at the rival's expense. Clearly, this also has a negative effect on the component of the integrated firm's
profit related to the sales of the essential input to the independent firm. "'See footnote 5 for the specification of consumers' preferences underlying the demand functions of the
two differentiated products. "This interpretation is also confirmed by the decrease in the input price under vertical integration, WV,
as ry starts increasing from 0 (see the proof of lemma 1). The integrated firm tries to contrast the decrease
of the demand for input by the independent firm (caused by the reduction in the global size of the product
market after the increase in 'y), so that its efficiency advantage over the rival decreases. "This is confirmed by the U-shaped behaviour of the input price w� as the degree of product substi-
tutability increases (see the proof of lemma 1).
99

5. VERTICAL INTEGRATION AND PRODUCT INNOVATION
In this section, we analyse the effects exerted by vertical integration on the incentive to
differentiate products. As mentioned before, we assume that only one firm, say firm D1,
can invest in R&D aimed at product differentiation. 17 By paying a fixed R&D cost k, the
innovative firm can reduce the perceived degree of product substitutability, ry, from 1 to
ry E [0,1). On the contrary, products are perceived as perfect substitutes (ry = 1) if firm Dl
does not invest.
The degree of product differentiation achievable by investing in R&D, 1- ry, sets the
effectiveness of the R&D technology (so that R&D effectiveness is higher the smaller is ry).
Given the effectiveness of the R&D investment, we measure the incentive to differentiate
products by the highest level of the R&D cost the innovative firm is willing to pay in order
to obtain the associated degree of product differentiation, k (ry).
Let 7r(ry) be the prospective profit the innovative firm expects to gain at the market stage
as a function of the degree of product substitutability perceived by consumers. We clearly
have:
(7) _ 7r(7) - ir(1), (10)
where the relevant profit function ir(ry) depends on the subsequent history of the game
associated with any ry. Building upon proposition 2, we must distinguish four cases according
to the level of the integration cost. 17Recall that, at the innovative stage of the model, the downstream firms share identical profit expecta-
tions under any subsequent evolution of the game (i. e. the independent firm's profit 7r' under the vertical
integration history, the downstream firm's profit 7rD under the no-vertical integration history). Hence, the
identity of the innovative firm is irrelevant. Moreover, the joint gain the two firms derive from product
differentiation is always twice the individual gain of the innovative firm. Therefore, the joint incentive to
differentiate products if firms Di and D2 can cooperate in R&D (as measured by the highest joint-R&D
cost they are willing to pay in order to obtain a given degree of product differentiation) is always twice the
innovative firm's incentive when only one firm can invest with no cooperation. The results of this section
immediately extend to the case of R&D cooperation by simply scaling-up the measure of the incentive to
invest in R&D.
100

Small integration cost (case (a) of proposition 2). Vertical integration occurs at the sec-
ond stage of the game for any degree of product substitutability. Therefore, the vertical integration outcome is independent of both the R&D effectiveness and the investment deci-
sion of the innovative firm. Since the innovative firm will end up with the independent firm's
profit under vertical integration (lemma 2), the relevant profit function at the innovative
stage coincides with the independent firm's profit function:
lr('Y) = 7rI ('Y), V 'Y E [0,1],
where r'(-y) is given by equation (6). Notice that, would firm Dl not invest in R&D,
products are perceived as perfect substitutes by consumers, and vertical integration leads
to market foreclosure (proposition 1), so that ir(1) _ ir'(1) = 0. Hence, our measure of the
incentive to differentiate products becomes:
ka (7) _ irI (5), V9E [0,1). (10a)
Since the prospective profit of the innovative firm always coincides with the independent
firm's profit under vertical integration, the incentive towards product differentiation will
basically reflect the following three motives: 1) avoiding market foreclosure; 2) softening
the competitive pressure of a more efficient firm (i. e. the integrated firm); 3) forcing the
integrated firm to charge a lower input price. 18
Moderately high cost of integration (case (b) of proposition 2). Vertical integration occurs
at the second stage of the game only for large and for small, but not for intermediate, degrees
of product substitutability. Consequently, the relevant profit function at the innovative stage
will jump between the independent firm's and the downstream firm's equilibrium profit at
both extremes of the interval of product substitutability where vertical integration does not "Notice also that ka (ry) always increases with the R&D effectiveness, as 7r'(ry) monotonically decreases
with ry (lemma 1).
101

occur. Denoting such an interval with [7b1,7 ] (as in figure 1), we have:
7r"(-Y) for yE (y%, 1]
W(7) _ irD(7) for 7E [7b1,7b2]
r'(y) for 'y E [0, ybl)
where 7r' (7) and -7r1(7) are given by equations (3) and (6), respectively. Like in the previous
case, if the innovative firm does not invest in R&D, then vertical integration and market
foreclosure occur at the final stage of the game, so that ir(1) = 7rI(1) = 0. Hence, our
measure of the incentive to invest in R&D becomes:
7rI(7) for ry E (7b2,11
kb (1) _ 7rD(7) for ry E ['Yb1, 'Yba) (10b)
7rl (3) for ry E [0, rybl )
The outcome of the vertical integration game depends on the investment decision of the
innovative firm if the R&D technology allows it to target the interval [yb1,1'b2]. Hence, its
incentive towards product differentiation may incorporate the additional motive of prevent-
ing vertical integration (recall that, by lemma 1, irD > irI for any ry E (0,1)).
High integration cost (case (c) of proposition 2). Vertical integration will occur only
for very low degrees of product substitutability (that is, for very high degrees of product
differentiation). Therefore, the relevant profit function at the innovative stage jumps from
the downstream firm's to the independent firm's equilibrium profit at the critical degree of
product substitutability below which vertical integration will occur. Denoting the critical
degree by ry,, (as in figure 1), we have:
7rD(7) for yE [-y,, 1] lr(7) _
7r'(7) for yE [0,, y, )
Contrary to the previous cases, vertical integration and market foreclosure will not occur in
the subsequent stages of the game if the innovative firm decides not to invest in R&D, that
is 7r(1) = irD(1) > 0. On the other hand, vertical integration would follow the decision to
102
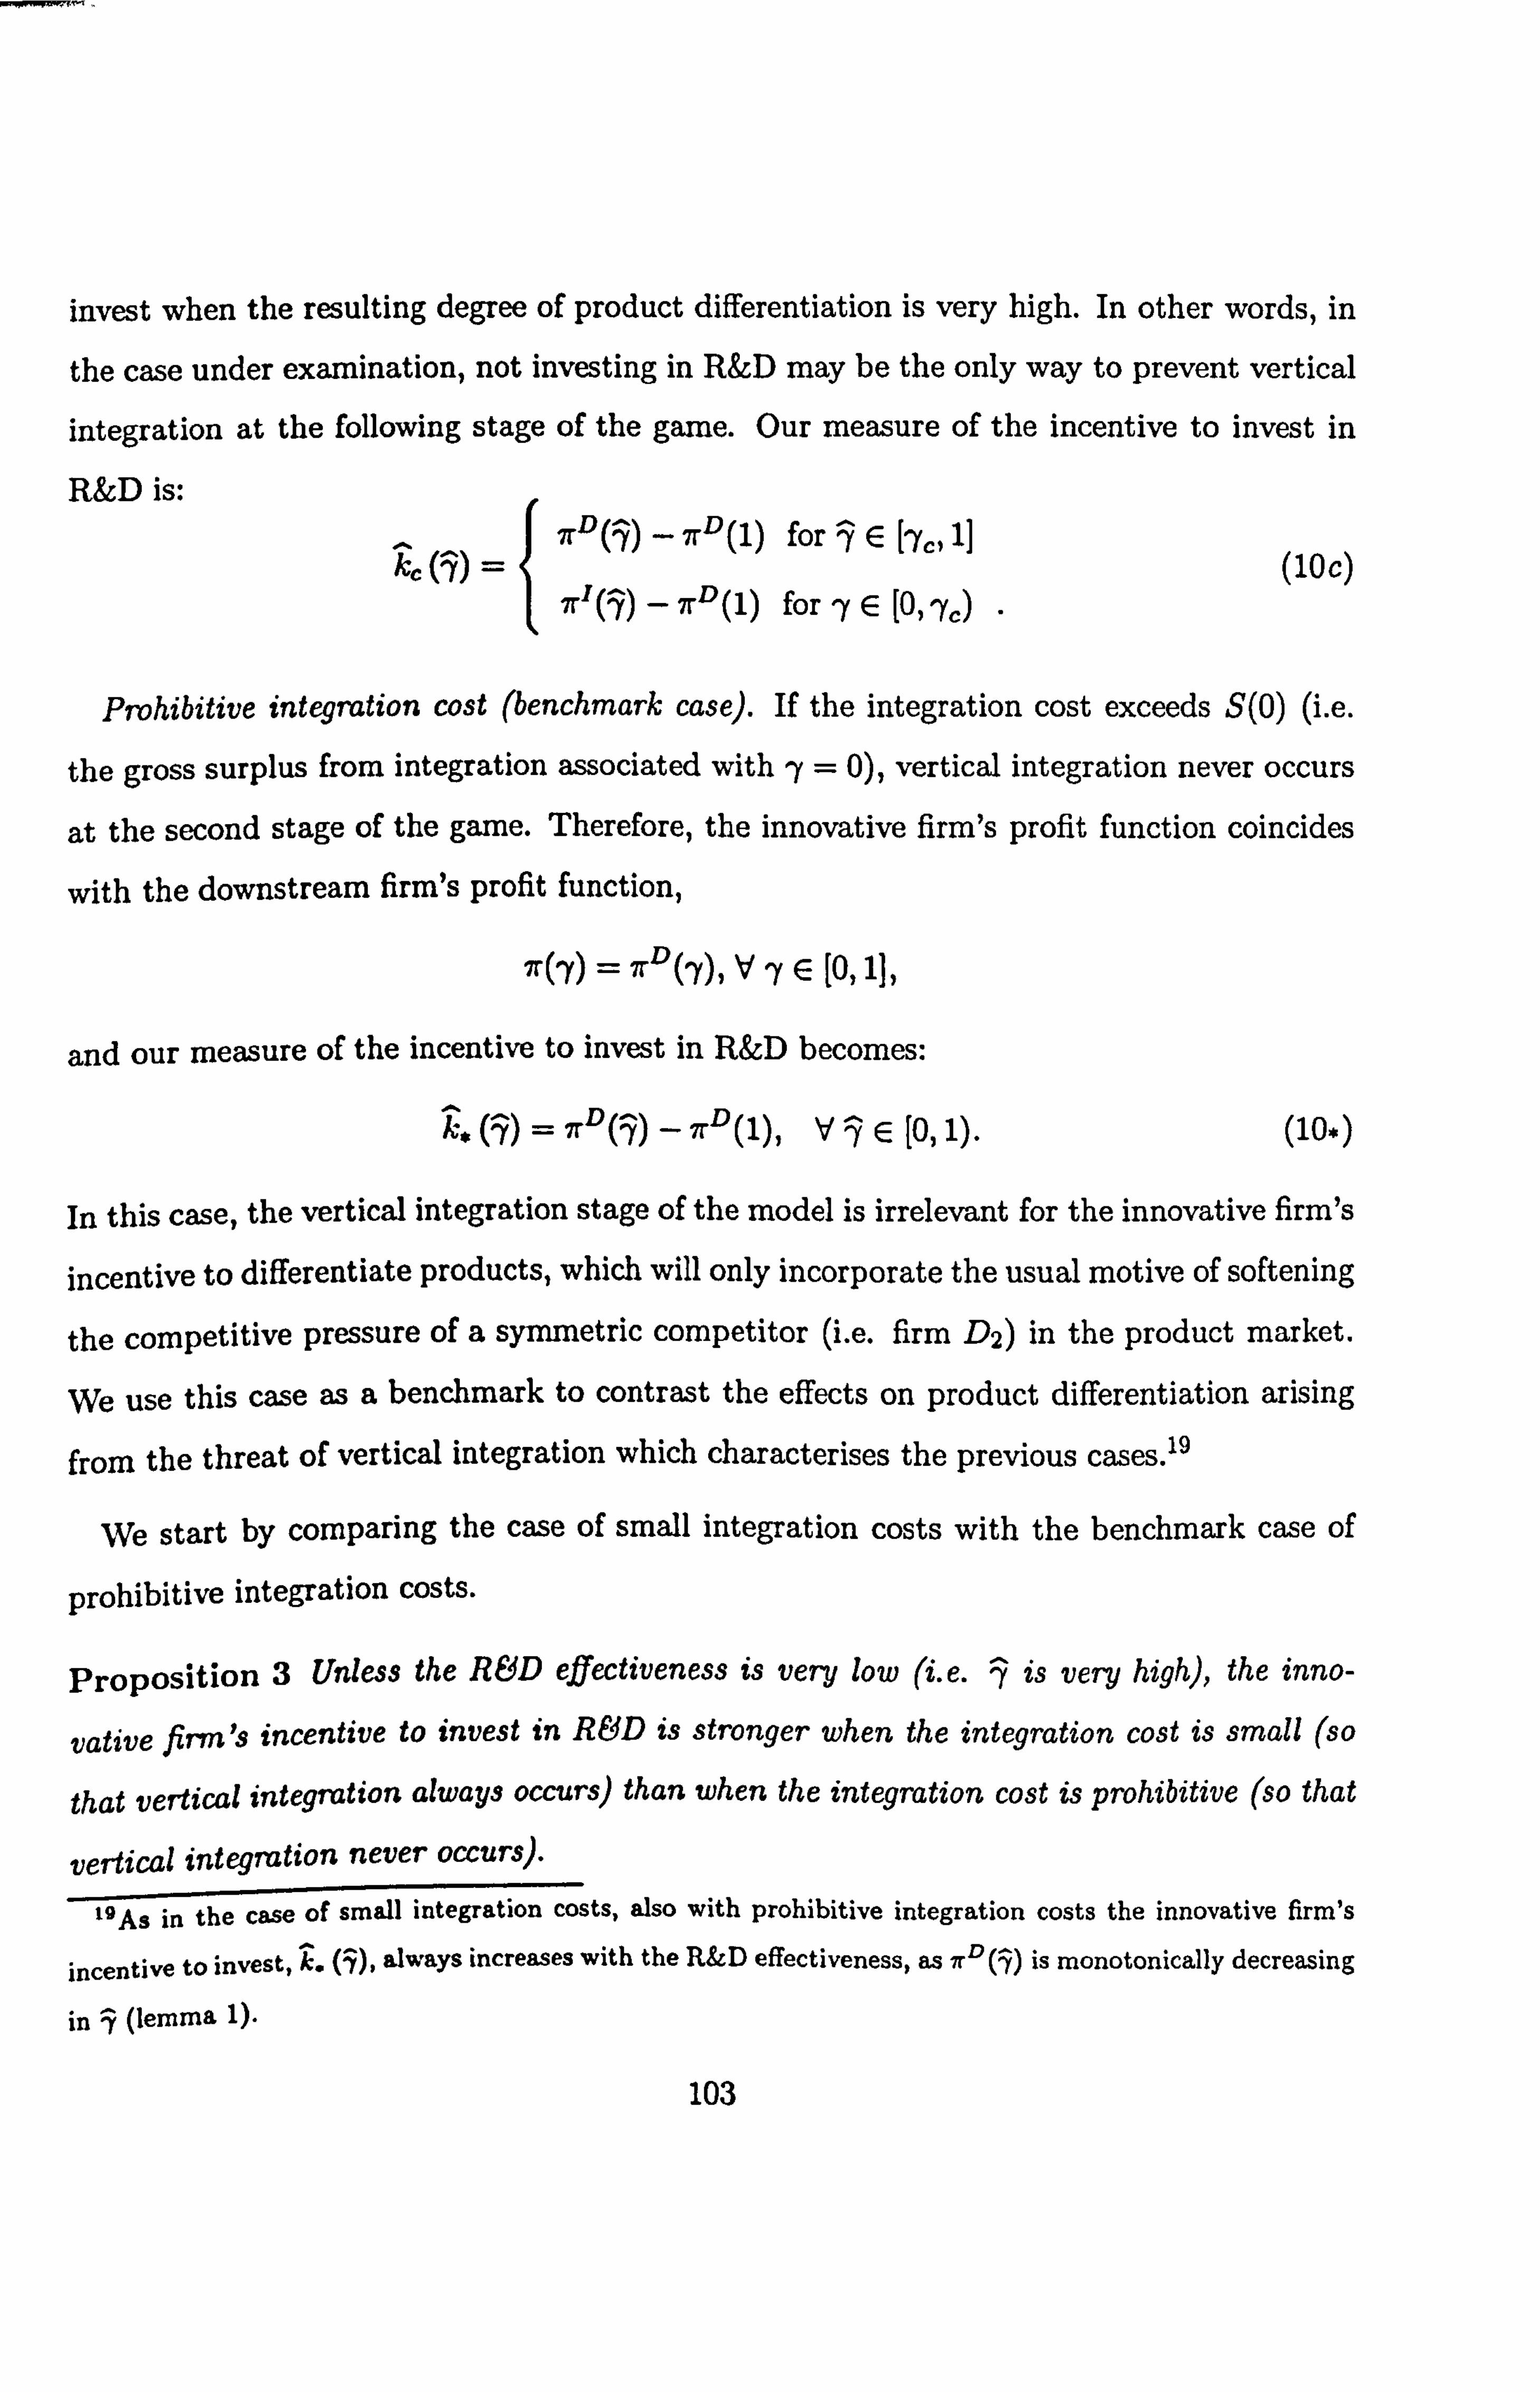
invest when the resulting degree of product differentiation is very high. In other words, in
the case under examination, not investing in R&D may be the only way to prevent vertical
integration at the following stage of the game. Our measure of the incentive to invest in
R&D is:
ýý (7) _ 7rD(7) - 7rD(1) for jE [7c, 1]
(lOc) 7r'( )- 7r'(1) for 7E [0, 'Yc)
Prohibitive integration cost (benchmark case). If the integration cost exceeds S(O) (i. e.
the gross surplus from integration associated with ry = 0), vertical integration never occurs
at the second stage of the game. Therefore, the innovative firm's profit function coincides
with the downstream firm's profit function,
7r('Y) = 7r D('Y), V7E [0,1],
and our measure of the incentive to invest in R&D becomes:
ý"C7)_7D(7)-ýD(1)ý d7E[0,1)" ý10*)
In this case, the vertical integration stage of the model is irrelevant for the innovative firm's
incentive to differentiate products, which will only incorporate the usual motive of softening
the competitive pressure of a symmetric competitor (i. e. firm D2) in the product market.
We use this case as a benchmark to contrast the effects on product differentiation arising
from the threat of vertical integration which characterises the previous cases. 19
We start by comparing the case of small integration costs with the benchmark case of
prohibitive integration costs.
Proposition 3 Unless the R&D effectiveness is very low (i. e. ry is very high), the inno-
vative firm's incentive to invest in ROD is stronger when the integration cost is small (so
that vertical integration always occurs) than when the integration cost is prohibitive (so that
vertical integration never occurs).
19As in the case of small integration costs, also with prohibitive integration costs the innovative firm's
incentive to invest, Z. (7), always increases with the R&D effectiveness, as a°(=y) is monotonically decreasing
in ry (lemma 1).
103

Proof. From (10a) and (10"), ka (ry) > k* (ry) if
7rI('? ) ? 7rD(3) -7rD(1)"
Using equations (3) and (6), the last inequality reduces to:
16(1 _ 9)(6 + 37)2 _ (5 + ry) (8 - 3ry2)2 > 0.
Calculations with Mathematica show that the polinomial on the LHS has only one real root
within the admissible range ry E (0,1), that is ya ^ý 0.81682. Since ýI (0) > 7rD(0) - 7rD(1)
(recall that ir'(0) = 7r°(0), by lemma 1, and 7rD(1) > 0), it must be:
io ý7) >_ (7) for 7e [0,7a),
kQ (ry) < k* (7) for ry E (rya, l].
7
Figure 2a
Figure 2a illustrates proposition 3. The intuition is that, when the R&D effectiveness is
very low, the gain from softening the competitive pressure of a more efficient competitor
104
U Yo 1

(the integrated firm under vertical integration) is smaller than the gain from softening the
competitive pressure of a symmetric competitor (the other downstream firm without vertical
integration). Although a slight degree of product differentiation allows the independent firm
to avoid market foreclosure, the resulting profit is negligible because the efficiency disadvan-
tage relative to the integrated firm remains high when products are poorly differentiated. 20
On the contrary, when the R&D effectiveness is sufficiently high, the gain from softening the
competitive pressure of the integrated firm dominates the gain from softening the competi-
tive pressure of a symmetric competitor. The independent firm's profit is no more negligible
when products are sufficiently differentiated, since both the efficiency disadvantage (up to
a certain degree of differentiation) and its negative impact on the independent firm's profit
sharply decrease with product differentiation. This allows the incentive to avoid market
foreclosure to play a dominant role: under vertical integration, the innovative firm can
guarantee a positive profit only by investing in R&D, whilst, with no-vertical integration,
a positive profit arises also without investing.
Consider now the case of moderately high cost of integration. Clearly, if the innovative
firm cannot target the intermediate degrees of product differentiation where vertical integra-
tion does not occur, a comparison with the benchmark case replicates exactly proposition
3. However, when the crucial interval [-yal, 'yy2] can be targeted, the possibility to prevent
vertical integration by product differentiation strengthens the innovative firm's incentive to
invest relative to both the benchmark case and the case of small costs of integration.
Proposition 4 The innovative firm's incentive to invest in R&D is unambiguously strength-
ened by the possibility to prevent vertical integration via product differentiation which arises
when the integration cost is moderately high and the R&D technology allows to target inter-
mediate degrees of product differentiation.
Proof. Assume that ry E [_%i7b21- From equations (10b) and (10*) we get:
kb (7) - k+ (7) = 7rD('Y) - [7rD('Y) - 7'D(1)1 = 7rD(1) >0.
2D In fact, the independent firm's profit function, irl(ry), is flat at ry = 1.
105

This proves that the incentive to invest in R&D is stronger in the case of moderately high
costs of integration (where vertical integration and market foreclosure can be prevented
only by investing in R&D) than in the benchmark case of prohibitive costs of integration
(where vertical integration never occurs).
Similarly, using equations (106) and (10a), we get:
Z. _ ýD(7) -.
I(7) >0 (by lemma 1),
This proves that the incentive to invest in R&D is stronger under the case of moderately
high costs of integration (where the R&D investment allows to avoid vertical integration)
than under the case of small costs of integration (where vertical integration always occurs).
Figure 2b illustrates proposition 4.
ki
Y)
Y
Figure 2b
We turn now to the case of high integration costs, where vertical integration occurs only
for very high degrees of product differentiation. If the R&D effectiveness is not very high
(i. e. if the achievable degree of product substitutability exceeds the critical level the
incentive to invest identically coincides with that of the benchmark case. On the contrary,
106
0Y bl Y b2 1

if the R&D effectiveness is very high (i. e. ry < rye), the possibility to prevent vertical
integration by not-differentiating products weakens the innovative firm's incentive to invest
relative to both the benchmark case and the case of small integration costs.
Proposition 5 The innovative firm's incentive to invest in R&D is unambiguously weak-
ened by the possibility to prevent vertical integration by not-differentiating products which
arises when the integration cost is high and the R&D effectiveness leads to very high degree
of product differentiation.
Proof. Assume that ry < ry,,. From equations (10c) and (10. ), we get:
ýc ý7ý ' /ý" ýý1'ý _ [7rI () _ 7rD(1), _
[7. D(i) _ 7rD(1)]
= 7rI(ry) - 7rD(7) <0 (by lemma 1).
This proves that the incentive to invest is lower under in the case of high integration costs
(where the R&D investment leads to vertical integration) than under the benchmark case
of prohibitive integration cost (where vertical integration never occurs).
Similarly, from equations (10c) and (10a), we have:
is (7') - k--. (1') = ýýI(1) - ýD(1)] - rI (1) _ -ýD(1) < 0.
This prove that the incentive to invest is lower in the case of high integration costs (where
vertical integration can be avoided only by not-investing in R&D) than in the case of small
integration costs (where vertical integration always occurs).
Figure 2c illustrates proposition 5.
107

Y
Figure 2c
To sum up, a prospective threat of vertical integration may have either positive or neg-
ative effects on the downstream firms' incentive to differentiate products. The nature of
the effects crucially depends on the effect of product differentiation on the upstream firm's
incentive to vertically integrate, as well as on the effectiveness of the R&D technology.
Men vertical integration is an unavoidable outcome because of small integration costs,
product differentiation allows to soften the competitive pressure of the integrated firm in
the product market. This has a greater value than softening the competitive pressure of a
symmetric competitor (what motivates product differentiation in the benchmark case) only
if products can be sufficiently differentiated. With higher integration costs, the incentive to
differentiate products incorporates the strategic motive of preventing vertical integration.
Both strong and weak degrees of product differentiation foster the upstream firm's incentive
to vertically integrate. With strongly differentiated products, the surplus from integration
is high since double marginalisation is avoided in a wider market, whilst, with poorly dif-
ferentiated products, the integrated firm can better exploit its efficiency advantage over
the independent firm. Then, the downstream firms have a strategic interest in targeting
intermediate degrees of product differentiation, to deter the upstream firm from vertically
108
u IC 1

integrating. Finally, very high costs of integration impede vertical integration unless prod-
ucts are strongly diflerentiated21 This gives the downstream firms a strategic motive to
avoid high degrees of differentiation.
The following two examples further clarify our results.
Example 1. - Suppose that the R&D investment allows the innovative firm to obtain (exactly) the
degree of product substitutability ry = '61 (see figure 2b). Given the "point-to-point" nature
of the R&D technology, in equilibrium we will observe either no-differentiation (i. e. 'y = 1)
if the innovative firm does not invest in R&D, or the degree of product differentiation 1--yb,
(i. e. If = 76, ) if the innovative firm invests. Assume that the R&D cost, k1, is sufficiently
high such that &a(rybl) < kl < kb(7bl). Then, inspection of figure 2b, immediately reveals
that we will observe product differentiation in the downstream market only when moderately
high costs of integration give the innovative firm a strategic incentive to invest in R&D in
order to deter vertical integration.
2'In this case, the surplus from integration exceeds the integration cost only when the market size is wide
because products are strongly differentiated.
109

Example 2. -
Suppose that the R&D investment allows the innovative firm to reduce the degree of
product substitutability up to a minimum level rye, with rye slightly lower than ry,, (see
firgure 3). Hence, if the innovative firm decides to invest in R&D, it can select the optimal
degree of product differentiation in the range (0,1 - =y2]. Let the fixed R&D cost, k2, be
sufficiently low such that k2 < Clearly, the innovative firm will choose the degree
of differentiation to maximize k(7) - kz = ir (ry) - it (1) - k2. Then, inspection of figure 3
reveals that, whilst products will be differentiated in all cases, the innovative firm will select
the maximum degree of differentiation, 1- ryz, only in the cases of small and prohibitive
integration costs. On the contrary, the incentive to avoid vertical integration will lead it to
select lower degrees of differentiation in both cases of high and moderately high integration
costs, i. e. 1 -'y,, and 1- rybl, respectively.
k2
V
Figure 3. Optimal degrees of product differentiation (example 2) when integration costs
are: small (a); moderately high (b); high (c); prohibitive (*).
110
72 1

6. A new welfare loss from vertical integration
The previous results suggest that a threat of vertical integration faced by an innovative
firm vertically related to a monopolistic supplier may decrease welfare by discouraging
socially valuable innovations. The simplest way to show this is to reconsider the example
2 above, where the innovative firm can select the optimal degree of product differentiation
up to a maximum level 1- rye. Suppose that the integration cost is high enough to make
the innovative firm's incentive to prevent vertical integration active (i. e. consider either
case b) or case c) in figure 3). As we have seen before, the innovative firm will deter
vertical integration by choosing a lower degree of product differentiation relative to the
benchmark case where the threat of vertical integration is absent. If we re-interpret the
benchmark as the case of a severe antitrust policy which bans vertical mergers, we can
say that a lenient antitrust policy will cause a lower degree of product differentiation in
the case under consideration, whilst the vertical structure of the market is identical in the
two policy regimes (i. e. no-vertical integration). On the other hand, it is easy to prove
that social welfare, measured by the total surplus generated in the market, is higher when
products are more differentiated. Consider first industry profits. Profits in the downstream
market increase with product differentiation (see lemma 1 (point iii)). Similarly, inspection
of equation (4) suffices to see that also the upstream firm's profit increases. Hence, industry
profits are higher with more differentiation. Consider now the consumer surplus. As shown
in Appendix 2, the consumer surplus can be expressed in terms of the equilibrium quantities
as: 22
CS =2 [(q°)2 + (q )2 + 2yq°q°].
Since q° = q° _a in the symmetric equilibrium without vertical integration, we get:
ra 12 CS=(1+ry) l 22+ry)
2=More precisely, the expression above gives the consumer surplus as a function of the consumer's optimal
demands of goods 4i and 92 at given prices.
111

Then, we evaluate: OCS_ 2 ry 87 -
(22) (2+y)2
< 0,
that is, the consumer surplus increases with product differentiation. Intuitively, consumers'
preference for variety and the increase in equilibrium quantities compound to increase con-
sumers' welfare even if equilibrium prices increase. Therefore, in our example, a lenient
antitrust policy would allow the threat of vertical integration to reduce product differenti-
ation, causing a reduction in total surplus and welfare. It is worth noting that, although
more product differentiation and vertical integration would generate a positive surplus for
the integrated firm (and for society), as far as the R&D cost is sunk before the integration
game takes place the upstream firm does not have any credible strategy to induce more
innovation in the downstream market. 23 On the contrary, the upstream firm could solve
the inefficiency if vertical integration could be credibly contracted before the innovation
takes place. Whilst we have highlighted here the possibility that vertical integration leads
to this new form of inefficiency, we leave for future research the study of the upstream firm's
incentives and strategies to prevent it.
7. CONCLUSIONS
In this chapter we have studied vertical integration and product innovation as interdepen-
dent strategic choices of vertically related firms. Our main innovation with respect to the
previous literature on vertical integration is that we have considered product differentiation
as a non-productive strategic decision of the downstream firms, showing its impact on the
incentives for vertical integration and market foreclosure. 24 Our main innovation relative
to the literature on product innovation, is that, besides product market competition, we
have accounted for another source of competition capable of affecting product innovation
23 indeed, any commitment to vertically integrate the innovative firm at more favorable conditions in
exchange of more innovation would be non-credible. 24 previous works have analysed the incentives to vertically integrate and foreclose the downstream market
when the final products are differentiated (e. g. Ordover, Saloner and Salop (1990), Economides (1994),
Colangelo (1995), Hackney (2001)). However, product differentiation is exogenous in all these studies.
112

by innovative firms vertically related to a monopolistic supplier, i. e. the threat of vertical integration. 25 Due to the downstream firms' inability to commit to a cooperative behaviour
if asked for integration offers, the monopolistic supplier can use vertical integration as a
means to reap profits in the downstream market. As a consequence, the incentive to differ-
entiate products in the downstream market incorporates the strategic motive of preventing
vertical integration. Our main finding has been that, although product differentiation al-
lows to soften product market competition and to avoid market foreclosure under vertical
integration, the strategic motive of preventing vertical integration may lead to less innova-
tion in the downstream market. Indeed, the monopolist's incentive to vertically integrate
strengthens with both high and low degrees of product differentiation, so that the down-
stream firms may find it convenient to refrain from adopting (profit and welfare enhancing)
innovations leading to strongly differentiated products. Therefore, instead of market fore-
closure, we have shown a new possible welfare loss from vertical integration, i. e. less product
innovation.
25The literature on product innovation has focused on the effects of product market competition and R&D
competition on the incentive to innovate (see Chapters 1 and 2 for a detailed reference to this literature).
For instance, Lambertini and Rossini (1998) and Lin and Saggi (2002)) focus on R&D and product market
competition in a setting similar to ours, where product innovation entails horizontal differentiation in a linear
differentiated duopoly. A related literature analyses product differentiation in both the upstream and the
downstream market under alternative vertical structures of the industry (e. g. Pepall and Norman (2001),
Belleflamme and Toulemonde (2003), Matsushima (2004)). Also this literature essentially concentrates on
the relationship between product differentiation and the intensity of product market competition. In this
chapter we have pointed out a different source of competition that can affect product innovation when the
innovative firms depend on an upstream monopolist for the supply of an essential resource.
113

APPENDIX
Appendix 1. - We prove that the surplus form integration before the integration cost, S, is a U-shaped
function of the degree of product differentiation over the range ry E [0,1]. From equation
(9), we calculate:
OS (, y) (al2 2 (-64 + 32-y + 96-y2 + 40, (3 - y4 - 3, y5) -U--y - `2) (8 - 3y2)2 (2 +, /)3
Since (8 - 372)2 (2 + 7)3 >0 for ry E [0,1],
sign { O's (ry)
}= sign { -64 + 327 + 9672 + 40, f3 - 74 - 375 }. 111 'Y JJ
Using Mathematica, we find that the polynomial on the RHS has an unique real root within
the admissible range [0,1), that is 1 ^" 0.61037. Since a is continuous over [0,1], and
takes values eS l y=o = -0.25 (2) 2<0 and a II. y=1 = 0.2963 (2) 2>0, then it must 07 2 be negative for 'y < y,,, and positive for ry > y,,.,. Finally, with simple calculations we get:
S(0) =1 (2)2 and S(1) = 45 (2)27 so that S(O) > S(1).
Appendix 2. -
The representative consumer's optimisation problem is:
MaxU=a(41+q2)- 2(4i+g2+2'Y4iq2)+m
s. t. plgl+p242+m=I
where I is the consumer's income in units of the numeraire good (m).
From the first order conditions pi =a- qi - 'yqj (i, i=1,2; i0 j) and the budget
constraint, we get:
m=I- a(qj + q2) + (41 + 422 + 2'Y4142),
where qt denotes the consumer's optimal demand of good i at given prices.
Substituting for m into the utility function, we get:
U=I+2(ql+ 2+2^11Q2)"
114

Finally, the consumer surplus is:
CS =U-I=2 (q1 + 42 + 27419'2).
115

REFERENCES
[1] Acharyya, R. and S. Marjit, 1998, To liberalize or not to liberalize an LDC-market with an
inefficient incumbent, International Review of Economics and Finance, 7,277-296
[2] Aghion, P., R. V. Blundell, N. Bloom and R. Griffiths, 2001, Empirical estimates of the relationship
between product market competition and innovation, mimeo, CEPR/ECARES Workshop on
Product Markets, Financial Markets and the Pace of Innovation in Europe (Bruxelles, may
2001)
[3] Aghion, P., M. Dewatripont and P. Rey, 1997, Corporate governance, competition policy and indus-
trial policy, European Economic Review, 41,771-782
[4] Aghion, P., M. Dewatripont and P. Rey, 1999, Competition, financial discipline and growth, Review
of Economic Studies, 66,825-852
[5] Aghion, P., C. Harris and J. Vickers, 1997, Competition and growth with step-by-step innovation:
An example, European Economic Review, 41,771-782.
[6] Aghion, P., C. Harris, P. Howitt and J. Vickers, 2001, Competition and growth with step-by-step
innovation, Review of Economic Studies, 68,467-492
[71 Aghion, P. and P. Howitt, 1992, A model of growth through creative destruction, Econometrica 60,
323-351
[8] Aghion, P. and P. Howitt, 1996, Research and development in the growth process, Journal of Eco-
nomic Growth, 1,49-73
[9] Aghion, P. and P. Howitt, 1998, Endogenous Growth Theory, Cambridge (Mass. ), MIT Press
[10] Aghion, P. and M. Shankerman, 2000, A model of market enhancing infrastructure, CEPR Discussion
Paper No. 2461
(11] Amir, R. and J. Y. Jin, 2001, Cournot and Bertrand equilibria compared: substitutability, comple-
mentarity and concavity, International Journal of Industrial Organization 19,303-317.
116
[121 Armstrong, M., C. Doyle and J. Vickers, 1996, The access pricing problem: a synthesis, The Journal
of Industrial Economics, 44,131-150
[13] Armstrong, M. and J. Vickers, 1998, The access pricing problem with deregulation: a note, The
Journal of Industrial Economics, 46,115-121
[14] Arrow, K., 1962, Economic welfare and the allocation of resources for invention, in: R. Nelson, ed.,
The rate and direction of innovative activity, Princeton, Princeton University Press
[15] Baake, P., U. Kamecke and H. T. Norman, 2004, Vertical integration with capital precommitment:
monopolization vs. inefficiency, International Journal of Industrial Organization, 22,185-192
[16] Barro, R. J. and X. Sala-i-Martin, 1995, Economic growth, New York, McGraw-Hill
[17] Beath, J., Y. Katsoulacos and D. Ulph, 1989, Strategic R&D policy, The Economic Journal, 99,
74-83
[181 Belleflamme, P. and E. Toulemonde, 2003, Product differentiation in successive vertical oligopolies,
Canadian Journal of Economics, 36,523-545
[19] Bester H. and E. Petrakis, 1993, The incentives for cost reduction in a differentiated industry,
International Journal of Industrial Organization, 11,519-534
[20] Blundell, R., R. Griffith and J. van Reenen, 1995, Dynamic count models of technological innovations,
The Economic Journal, 105,333-344
[211 Blundell, It., R. Griffith and J. van Reenen, 1999, Market Share, Market Value and Innovation in a
Panel of British Manufacturing Firms, The Review of Economic Studies, 66,529-554.
[22) Boccard, N. and X. Wauthy, 2000, Bertrand and Cournot outcomes: further results, Eco-
nomics Letters, 68,279-285
[23] Bonanno G. and B. Haworth, 1998, Intensity of competition and the choice between product and
process innovation, International Journal of Industrial Organization 16,495-510
117

[24] Boone J. , 2000, Competitive Pressure: The Effects on Investments in Product and Process Innova-
tion, Rand Journal of Economics 31,549-569
[25] Boone J., 2001, Intensity of competition and the incentive to innovate, International Journal of
Industrial Organization 19,705-726
[26] Bork, R., 1978, Antitrust Paradox, New York, Basic Books
[27] Bousquet, A., H. Cremer, M. Ivaldi and M. Wolkowicz, 1998, Risk sharing in licensing, International
Journal of Industrial Organization, 16,535-154
[28] Buehler, S. and A. Shmutzler, 2003, Downstream investment in oligopoly, Socioeconomic Institute,
University of Zurich, Working Paper N. 0310
[29] Caballero, R. J. and A. B. Jaffee, 1993, How high are the giants' shoulders: An empirical assessment
of knowledge spillovers and creative destruction in a model of economic growth, in NBER
Macroeconomics Annual, MIT Press, Cambridge (Mass. )
[30] Cabral, L., 1995, Conjectural variations as a reduced form, Economics Letters 49,397-402
[31] Choi, S. C., 1991, Price competition in a channel structure with a common retailer, Marketing
Science, 10,271-296
[32] Colangelo, G., 1995, Vertical vs. Horizontal integration: pre-emptive merging, The Journal of In-
dustrial Economics, 48,323-337
[33] d'Aspremont, C., Dos Santos Ferreira, R. and L. A. Gerard Varet, 2002, Strategic R&D investment,
competition toughness and growth, mimeo, CORE.
[34] De Fraja, G. and C. W. Price, 1999, Regulation and access pricing: comparison of regulated regimes,
Scottish Journal of Political Economy, 46,1-16
[35] Delbono F. and V. Denicolö, 1990, R&D investment in a symmetric and homogeneous oligopoly:
Bertrand vs Cournot, International Journal of Industrial Organization, 8,297-313
[361 Deneckere, R., 1983, Duopoly supergames with product differentiation, Economics Letters, 11,37-42
118

[37] Denicolö V., 2001, Growth with non-drastic innovations and the persistence of leadership, European
Economic Review 45,1399-1413
[38] Dixit, A. K., 1979, A model of duopoly suggesting a theory of entry barriers, Bell Journal of Economics
10,20-32
[39] Dockner, 1992, A dynamic theory of conjectural variations, The Journal of Industrial Eco-
nomics, 40,377-395
[40] Economides, N., 1994, The incentive for vertical integration, Stern School of Business, New York
University, Working Paper EC-94-05
[411 Economides, N., 1998, The incentive for non-price discrimination by an input monopolist, Interna-
tional Journal of Industrial Organization, 16,271-284
(42] Encaoua, D., and D. Ulph, 2000, Catching-up or leapfrogging? The effects of competition on inno-
vation and growth, CNRS, Collection Les Cahiers De 1'Innovation, Cahier no. 00017
[43] Gerstner, E. and H. Hess, 1995, Pull promotions and channel coordination, Marketing Science, 14,
43 - 60
[44] Grossman, G. and E. Helpman, 1991, Innovation and growth in the global economy, Cambridge
(Mass. ), MIT Press
[45) Hackner, J., 2000, A note on price and quantity competition in differentiated oligopolies, Journal of
Economic Theory 93,233-239
[46] Hackner, J., 2001, Vertical integration and competition policy, Department of Economics, University
of Stockholm, Working Paper N. 0101
[47] Hamilton, J. and S. Slutsky, 1990, Endogenous timing in duopoly games: Stackelberg or Cournot
equilibria, Games and Economic Behaviour, 2,29-47
[48] Hart, 0. and J. Tirole, 1990, Vertical integration and market foreclosure, Brookings Papers on
Economic Activity, 205 - 276, and 285-286
119
[49] Howitt, P., 1999, Steady endogenous growth with population and R&D inputs growing, Journal of
Political Economy, 107,715-730
[50] Lambertini, L., 1997, Prisoners' dilemma in duopoly (super) games, Journal of Economic Theory,
77,181-191
[51] Lambertini, L. and G. Rossini, 1998, Product homogeneity as a prisoner's dilemma in a duopoly
with R&D, Economics Letters, 58,297-301.
[52] Lin, P. and K. Saggi, 2002, Product differentiation, process R&D, and the nature of market compe-
tition, European Economic Review, 46,201-211
[53) Maggi, G., 1996, Strategic trade policies with endogenous mode of competition, American Economic
Review 86,237-258
[54] Majerus, D., 1988, Price vs quantity competition in oligopoly supergames, Economics Letters, 27,
293-297
[55] Matsushima, N., 2004, Technology of upstream firms and equilibrium product differentiation, Inter-
national Journal of Industrial Organization, 22,1091-1114
[56] Nickell, S., 1996, Competition and corporate performance, Journal of Political Economy, 104,724-
746
[57] 0' Donoghue, T., and J. Zweimuller, 2004, Patents in a Model of Endogenous Growth, Journal of
Economic Growth, 9,81-123
[581 Ordover, J. A., G. Saloner and S. C. Salop, 1990, Equilibrium vertical foreclosure, American Eco-
nomic Review, 80,127-142
[59] Oz Shy, 2000, Industrial Organization: Theory and Applications, The MIT Press, Cambridge
[601 Pepall, Land G. Norman, 2001, Product differentiation and upstream-downstream relations, Journal
of Economics and Management Strategy, 10,201-233
120

[61] Peretto P., 1996, Sunk Costs, Market Structure, and Growth, International Economic Review 37,
no. 4,895-923
[62] Peretto P., 1999, Cost reduction, entry, and the interdependence of market structure and economic
growth, Journal of Monetary Economics 43,173-195
[63] Qiu L., 1997, On the dynamic efficiency of Bertrand and Cournot equilibria, Journal of Economic
Theory 75,213-229
[64] Raith, M., 2003, Competition, risk and managerial incentives, American Economic Review, 93,
1425-1436
[651 Rey, P. and J. Tirole (2004), A premier on foreclosure, forthcoming in M. Amstrong and R. H.
Porter (Eds. ), Handbook of Industrial Organization, Vol. 3, North-Holland, Amsterdam
[66) Rao, R. and S. Srinivasan, 2001, An analysis of advertising royalty in franchise contracts, Journal
of Marketing Channels, 8,85-118
[67] Riordan, M. H., 1998, Anticompetitive vertical integration by a dominant firm, American Economic
Review, 88,1232-1248
[68] Salinger, M., 1988, Vertical mergers and market foreclosure, The Quarterly Journal of Economics,
103,345-356
[69] Schumpeter, J., 1942, Capitalism, socialism and democracy, London, Allen and Unwin
[70] Segal and Whinston, 2003, Antitrust in innovative industries, mimeo
[71] Segerstrom, P., Anant, C. and E. Dinopoulos, 1990, A Schumpeterian model of the product cycle,
American Economic Review 80,1077-1091
[72] Singh, N. and X. Vives, 1984, Price and quantity competition in a differentiated duopoly, Rand
Journal of Economics 15,546-554
[73] Smulders, S., and T. Van de Klundert, 1995, Imperfect competition, concentration and growth with
firm-specific R&D, European Economic Review, 39,139-160
121

[741 Stokey, N., 1995, R&D and economic growth, Review of Economic Studies, 62,469-489
[75] Sutton, J., 1991, Sunk costs and market structure: price competition, advertising, and the evolution
of concentration, Cambridge (Mass. ), MIT Press
[76] Symeonidis, G., 2003, Comparing Cournot and Bertrand equilibria in a differentiated duopoly with
product R&D, International Journal of Industrial Organization 21,39-55
[77] Tyagi, R. K., 1999, On the effects of downstream entry, Management Science, 45,59-73
[78] Van de Klundert, T. , and S. Smulders, 1997, Growth, competition and welfare, Scandinavian Journal
of Economics, 99,99-118
[79] Vickers, J., 1995, Concepts of competition, Oxford Economic Papers 47,1-23
(80] Villas-Boas, J. M., 1998, Product line design for a distribution channel, Marketing Science, 17,
156-169
[81] Zanchettin, P., 2001, Competizione, Innovazione tecnologica e crescita, University of Siena
Discussion Papers (Quaderni del Dipartimento di Economic Politica), Discussion Paper
N. 327
122 ýBlTING//A