Zambia country strategy 2011-2015iezambia.yolasite.com/resources/CPs/WaterAid/WaterAid Zambia... ·...
59
WaterAid Zambia Country Strategy - 2011-2015 December 2010
Transcript of Zambia country strategy 2011-2015iezambia.yolasite.com/resources/CPs/WaterAid/WaterAid Zambia... ·...

WaterAid Zambia
Country Strategy - 2011-2015
December 2010

2 | P a g e
Contents
LIST OF ABBREVIATIONS ......................................................................................................................... 4
EXECUTIVE SUMMARY .............................................................................................................................. 7
1.0 INTRODUCTION ............................................................................................................................... 9
2.0 LOOKING BACK .................................................................................................................................. 11
2.1 KEY SHIFTS AND PROGRESS OVER THE LAST CS PERIOD ..................................................................... 11
2.2 STRATEGIC OPTIONS FOR THE CS 2006 - 2010 .................................................................................. 12
2.3 FINANCIAL RESOURCES OVER THE PERIOD 2004/05 – 09/10 ............................................................... 12
2.4 PROGRAMME OUTREACH FOR THE PERIOD 2004-10 ............................................................................ 13
2.4.1 Strengths and achievements of the Country Programme .................................................................. 14
2.4.2 Lessons learned ....................................................................................................................................... 15
3.0 SITUATION ANALYSIS ................................................................................................................. 16
3.1 COUNTRY BACKGROUND ...................................................................................................................... 16
3.2 POLITICAL CONTEXT ............................................................................................................................... 17
3.3 ECONOMIC AND SOCIAL DEVELOPMENT ......................................................................................... 18
3.4 Overview of WASH ..................................................................................................................................... 20 3.5 RIGHTS, EQUITY AND INCLUSION ANALYSIS ........................................................................................ 21
4.0 SECTOR REVIEW .......................................................................................................................... 22
4.1 Sector policies and strategies.................................................................................................................... 23
4.3 Sector Coordination .................................................................................................................................... 24
4.4 Sector Financing .......................................................................................................................................... 25
4.5 Institutional arrangements and sector capacity ...................................................................................... 26
4.6 Performance Monitoring and accountability ............................................................................................ 26
4.7 Summary of Sector Blockages and challenges ...................................................................................... 27
5.0 WATERAID ZAMBIA COUNTRY STRATEGY 2011-2015 ............................................................... 30
5.1 OUTLINE OF STRATEGIC ISSUES FOR THE COUNTRY STRATEGY ........................................................... 30
5.1.1 EXTERNAL STRATEGIC ISSUES ........................................................................................................ 30
5.1.2 INTERNAL STRATEGIC ISSUES ......................................................................................................... 31
5.2 STRATEGIC AREAS OF FOCUS AND LINKAGES TO THE GLOBAL STRATEGY .......................................... 33
5.2.1 STRATEGIC AND OPERATIONAL OBJECTIVES FOR THE COUNTRY STRATEGY ..................................... 34
5.2.2 SERVICE DELIVERY......................................................................................................................... 34
5.2.3 Sector Capacity Development ................................................................................................................ 35
5.2.4 Sector Financing ...................................................................................................................................... 36
5.2.5 Influencing Work ...................................................................................................................................... 37
5.2.6 Organizational Development .................................................................................................................. 38 5.3 APPROACHES FOR IMPLEMENTING THE COUNTRY STRATEGY .............................................................. 39
5.3.1 Targeting approaches ............................................................................................................................. 40
5.3.2 Service delivery approaches .................................................................................................................. 40
5.3.3 Private sector participation ..................................................................................................................... 41
5.3.4 Approaches for Sanitation Services ...................................................................................................... 41
6.0 HUMAN RESOURCES ......................................................................................................................... 42

3 | P a g e
6.1 KEY ACTIONS IN WATERAID HUMAN RESOURCES STRATEGY .............................................................. 42
8.0 RISK ANALYSIS ................................................................................................................................... 45
9.0 PLANNING MONITORING AND EVALUATION FRAMEWORK ..................................................... 47
Appendices……………………………......................................……………………………………………………………………56

4 | P a g e
LIST OF ABBREVIATIONS
ADCs Area Development Committees
CBOs Community Based Organisations
CP Country Programme
CPs Cooperating Partners
CUs Commercial Utilities
DAPP Development Agency from People to People
DHID Department of Housing and Infrastructure Development
DTF Devolution Trust Fund
DWA Department of Water Affairs
D-WAHEs District Water, Sanitation and Health Education
EU European Union
FBOs Faith Based Organisations
FNDP Fifth National Development Plan
GDP Gross Domestic Product
HDI Human Development Index
HIV Human Immune Virus
IMS Information Management System
INGO International NGO
KZF Keepers Zambia Foundation
LAs Local Authorities
LCMS Living Conditions Monitoring Survey
LWSC Lusaka Water and Sewerage Company
MDGs Millennium Development Goals
MEWD Ministry of Energy and Water Development
MLGH Ministry of Local Government and Housing
MoFNP Ministry of Finance and National Planning
MoU Memorandum of Understanding
NGO Non-Governmental Organisation
NRWSSP National Rural Water Supply and Sanitation Programme
NWASCO National Water and Sanitation Council
RWSS Rural Water Supply and Sanitation
RWSSU Rural Water Supply and Sanitation Unit
SAPs Structural Adjustment Programmes
SOMAP Sustainable Operations Maintenance Programme
SWASC Southern Water and Sewerage Company
VAREN Vision Africa Regional Network
WASHE Water, Sanitation and Health Education
WATSAN Water and Sanitation
WAZ WaterAid Zambia
GRZ Government of the Republic of Zambia
5 | P a g e
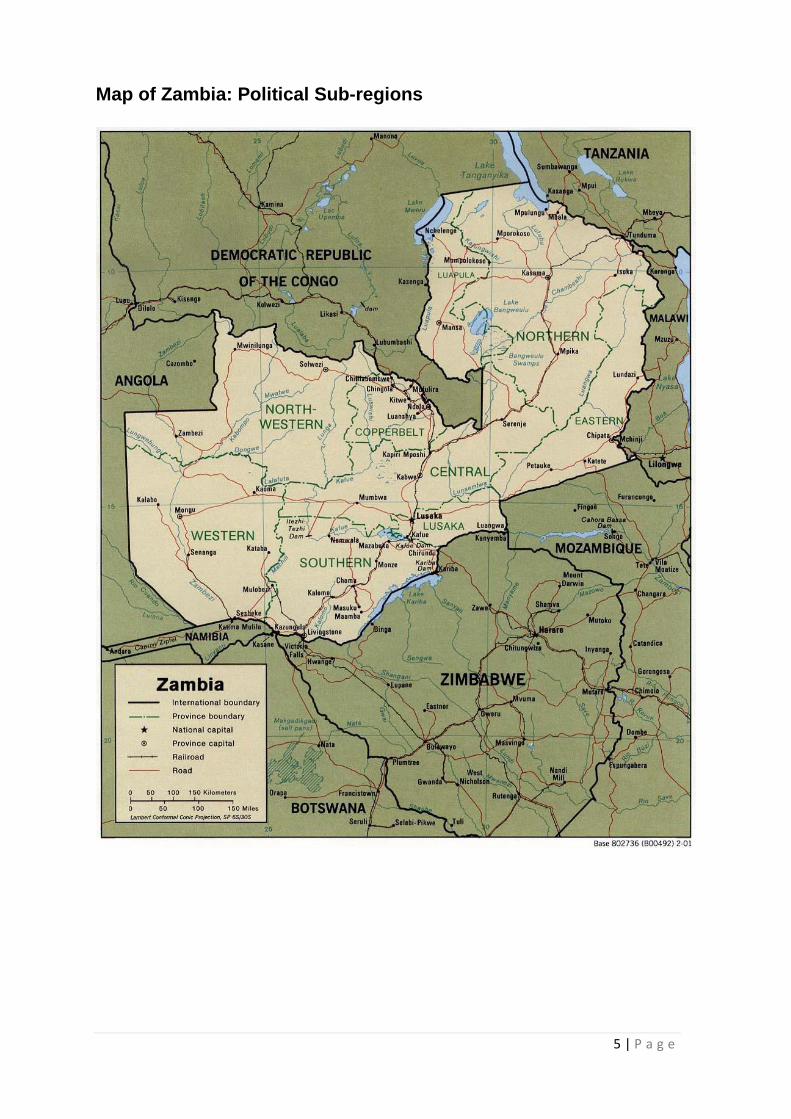
Map of Zambia: Political Sub-regions

6 | P a g e
Map 1: WaterAid in Zambia – Operational and Planned Districts
Lufwanyama
Mwense
Samfya
Kazungula
Lusaka
Milenge
Monze
Livingstone
Nchelenge
Gwembe
Choma
KEY
Operational districts
Proposed districts
7 | P a g e
Executive Summary
Zambia is a landlocked country with an area of 752,614km² and a national population of
9.9 million as at 2000. The population is projected to reach 15.5 million by 2015. Zambia
has a multiparty political dispensation with a National Assembly consisting of 150
democratically elected members. The rural/urban divide shows growing urbanization and
higher rural poverty at 80 percent and urban poverty at 34 percent (LMCS, 2006).
National inflation as at September 2010 stood at 10.4 percent. Poverty in Zambia has
been exacerbated by malaria which accounts for the bulk of deaths, 35 percent in under-
five children (Draft SNDP 2010-2015), and HIV whose prevalence is estimated at 12
percent. Another incidence that has jeopardized people‟s livelihoods has been climate
change which is associated with protracted droughts, flooding and in some cases
dwindling of groundwater resources, especially in the southern parts of the country.
Zambia‟s economy is copper-dependent though agriculture, tourism and manufacturing
are gaining ground. The country is endowed with bountiful natural resources and boasts
of hosting two-thirds of the region‟s water resources stored in rivers, lakes and dams. The
country completed drafting the National Constitution, launched the Sixth National
Development Plan (2011-2015), commenced the national Census 2010 and announced
its national budget for the fiscal year 2011 in which year Presidential and parliamentary
elections are scheduled to take place.
The Zambian government developed the National Rural Water Supply and Sanitation
Programme (NRWSSP) 2006 to 2010. This Programme seeks to increase and improve
access to water supply and sanitation services, and to achieve the Millennium
Development Goals (MDG) for water supply and sanitation. The programme is also based
on service delivery through devolution of responsibility to the Local Authorities (LAs)
under the Rural Water and Sanitation (RWSS) Units as prescribed in the Decentralization
Implementation Plan.
WaterAid in Zambia (WAZ) started implementing its water and sanitation programmes in
Monze in 1994. Currently WaterAid works in Lusaka urban, Monze, Kazungula and
Livingstone in Southern province and Mwense, Milenge and Samfya in Luapula province.
Operations are expected to expand into Gwembe in Southern province and Nchelenge in
Luapula province in 2011-2012.
WaterAid‟s implementation approaches have shifted from direct implementation to
working through NGOs, Government and other Community Based Organizations and the
private sector; and from the focus area approach which scattered interventions across a
number of villages to the model village approach that clustered selected villages and,
ultimately, to the district wide approach which used the district as the unit of agency.
This Country Strategy (CS, 2011-2015) embodies a number of strategic shifts following
various reviews and evaluations of the Zambia Country Programme undertaken between
2004 and 2009. The shifts are mainly around programme delivery, methodology, focus
and strategic alignment to the WaterAid Global Strategy 2009-2015. The CS will be
delivered across five major paradigm shifts from the previous CS (2006-2010) namely: i)
Service delivery, ii) Sector Capacity Development, iii) Sector financing, iv) Influencing
work, and v) Organisational development.
8 | P a g e
This CS is unique and important to WaterAid in Zambia as the period of its
implementation marks the crucial final years of the Millennium Development Goals
(MDGs). WAZ activities implemented through its partners and other stakeholders will be
important milestones towards the attainment of Zambia‟s Local MDG targets on water and
sanitation for the poor and marginalised. The CS will also be implemented within the
framework of the Sixth National Development Plan (SNDP 2011-2015) which also
terminates in 2015. Above all, the Zambia CS is also aligned with WaterAid‟s Global
Strategy (2006-2015). This is significant as this CS will be benchmarked against and
underpinned by the above mentioned key national policy and strategic instruments
guiding WASH activities in Zambia up to 2015.
In this CS, WaterAid‟s country programme budget is expected to grow across its three
dimensions; the Essential, Desirable and Ambitious plans. Water, sanitation and hygiene
promotion activities in rural, urban and small towns, influencing work as well as growth in
organisational effectiveness and HR will premise the growth of the budget for the country
programme in its Essential Plan. The Desirable plan will feature a budget for activities that
WAZ would desire to implement if more funding is available while the Ambitious Plan
projects activities that WAZ would implement if funding is not a limitation. The total
Essential budget for the CS is therefore projected to be ZMK 79,063 million while the
Desirable budget is projected to be ZMK 86,922 million. The Ambitious budget is
projected to be ZMK 109,807 million over the period of this CS.
The planned growth for the country budget over the CS period is therefore premised on
the planned commencement of activities in Gwembe and Nchelenge districts in the first
and second years of the CS period while the organisation will also develop its human
resource capacity and systems to effectively implement the CS. WAZ will implement all its
activities in the CS period under an integrated approach with water, sanitation and
hygiene promotion. All planned work will also be delivered through local organizations and
District Councils and enshrined in Partner Project Agreements (PPAs).
To effectively implement the CS, WAZ will work with a cadre of skilled and experienced
staff with requisite competencies to implement planned activities for the duration of the
CS and beyond. Plans to recruit and retain key staff such as the Senior Programme
Manager (SPM) and Planning Monitoring and Evaluation Officer (PMEO), Programme
Accountant, and two Project Officers will be implemented within the first 2 years of the CS
period. With this cadre of staff (and others foreseen in the CS period) WAZ will be able to
provide effective support to partners to ensure effective delivery of WASH. This human
resource plan is in fulfillment of Aim 4 of WaterAid Global Strategy – “We will further
develop as an effective global organisation recognised as a leader in our field and for
living our values”.

9 | P a g e
1.0 INTRODUCTION
WaterAid was created in 1981 by people and organisations of the British water
industry as a response to the UN Water Decade (1981 - 1990). WaterAid is an
International Non Governmental Organisation dedicated exclusively to the
provision of safe domestic water, sanitation and hygiene education to the world‟s
poorest people. WaterAid currently works in Africa and Asia, with major
programmes in Bangladesh, India, Nepal, Pakistan, Ethiopia, Mozambique,
Tanzania, Uganda, Zambia, Ghana, Nigeria, Mali, Malawi, Madagascar and
Burkina Faso, Timor Leste and Papua New Guinea. In the recent past, WA has
started operations in nine additional countries namely Liberia, Sierra Leone, Niger,
Rwanda, Kenya, Lesotho, Swaziland, and Angola. At a global level WaterAid has
alliances with WaterAid America, WaterAid Sweden and WaterAid Australia. In the
new Global Strategy, WA will evolve into an international alliance to be called
WaterAid International.
WAZ had a once-off intervention in Zambia in 1981 when the organization
provided drought relief efforts through a church based organization, the Gossner
Mission in Sinazongwe in Gwembe district of Southern Province during the severe
drought of 1981-1982. Operations for WAZ commenced thirteen years later in
1994 in Monze district in Southern province where the organization established its
first office, and worked with Monze Diocese and later with Monze District Health
Office. WAZ is currently operating in seven districts namely Monze, Kazungula
and Livingstone in Southern province; Mwense, Samfya and Milenge in Luapula
province and also in Lusaka peri-urban in Lusaka province implementing urban,
peri-urban and rural domestic water supply, sanitation and hygiene promotion
programmes.
Since 2004, WAZ has been implementing its activities through Local Authorities
under the Ministry of Local Government and Housing, NGOs and Faith Based
Organisations (FBOs). WAZ has also established a number of collaborative and
non-funded partnerships across several national and international NGOs,
Cooperating Partners (CPs) and public and private sector entities. From inception,
programme activities of WAZ have been implemented on the basis of multi-year
Country Strategic Plans which have guided the implementation of all WAZ‟s
investments in the country.
In developing this CS WAZ consulted various stakeholders including the
Government of the Republic of Zambia, Cooperating Partners, NGO partners and
other civil society organizations. This was in addition to various internal planning
processes which were conducted with the participation of WaterAid Staff from
Zambia, as well as the WaterAid Regional Office and WaterAid Global staff from
the UK. The process for the development of this CS was also partly informed by
WaterAid Strategic Planning Guidelines developed by WaterAid UK in 2009.
Appendix 1 shows the process leading to the development of this CS.

10 | P a g e
1.1 Structure of the Country Strategy:
i. Looking Back – an overview of WaterAid‟s work and activities in Zambia.
ii. Situation Analysis - an overview of the operating environment with national
and sector contexts.
iii. CS Strategic and Change Objectives demonstrating links to the global
strategy.
iv. Human resources – an outline of the expected human resource capacities
to implement the CS.
v. Financial resources – a projection of multiyear financial requirements for
the CS.
vi. Risk management plan – an outline of key internal and external risks and
mitigation measures.
vii. M&E Framework – a detailed means of measuring the performance of the
CS.
1.2 Strategic areas of focus in the 2011-2015 CS
In this strategy period WAZ will implement all its activities along the five strategic
areas of focus given below:
i) Service delivery - with the objective of significantly increasing the number of poor and marginalised people with access to sustainable safe water, improved hygiene and sanitation in all WAZ operational areas. This objective and activities under it will be in line with Aim 1 of the WaterAid Global Strategy which states that: “We will promote and secure poor people‟s rights and access to safe water, improved hygiene and sanitation.”
ii) Sector capacity development - with the objective of supporting and building the capacity of its partners and selected key stakeholders to effectively deliver safe and sustainable water, sanitation and hygiene services. Activities under this objective will be aligned to Aim 2 “We will support government and service providers in developing their capacity to deliver safe water, improved hygiene and sanitation.” iii) Sector financing - with the objective of successfully advocating for and contributing to increased resources and improved targeting of investments to meet the needs of the WASH sector, equitably and transparently. Work under this objective will be aligned to Aim 3 “We will advocate for the essential role of safe water, improved hygiene and sanitation in human development”.
iv) Influencing work - with the objective of influencing the achievement of
increased access to safe and sustainable water, improved hygiene and sanitation.
Activities under this objective will also be aligned to Aim 3 above.
v) Organisational Development (OD) - with the objective of growing into and
becoming an effective and credible people-centered organization that will deliver
its strategy, be recognised as a lead in its field and an employer of choice, HR and

11 | P a g e
OD activities under this objective will be aligned to Aim 4 – “We will further
develop as an effective global organisation recognised as a leader in our field and
for living our values”.
Appendix 2 shows the strategic aims, change objectives and indicators for the CS.
2.0 LOOKING BACK
2.1 Key shifts and progress over the last CS period WAZ worked with D-WASHE Committees and DHMTs as implementing partners
up to the time when new RWSS institutional framework came into effect in 2004.
In compliance with this framework, Local Authorities (LAs) are responsible for rural
water supply and sanitation while the role of DWASHE committees is to provide
technical support to the LAs. As a result WAZ forged new partnerships with Local
authorities, local NGOs, and small scale private contractors. An overview of the
programmes WaterAid in Zambia has implemented through its partners as at 2009
is presented in Appendix 3.
Up until 2004, the focus of WaterAid‟s programme in Zambia had been
predominantly rural. However, following a scoping study conducted by WaterAid in
2003-04, an urban programme was developed. The scoping study pointed to the
fact that there was a growing need for peri urban water supply and sanitation
facilitation and that if the need was not addressed access to safe water and
sanitation in urban areas would have worsened and greatly exacerbated water
borne and other diarrheal diseases. This implementation paradigm was embodied
within the Country Strategy 2006-2010 and WAZ established peri urban projects in
Lusaka while developing Small Town projects in Monze and Mwense in Luapula
province. In this new strategy WAZ seeks to enhance its urban programme by
supporting two small town projects in Southern and Luapula provinces while
expanding its peri-urban work in Lusaka City.
In terms of approaches, WAZ has evolved from the focus area approach
employed in the past CS to district wide approaches in order to accelerate
progress to the achievement of local water and sanitation MDG targets (LMDGs).
In 2006, WAZ phased out from Namwala, Itezhi-tezhi, Kaoma and Kafue districts
and decided to scale up activities in Monze, Siavonga and Kazungula districts, in
Southern Province. At the same time new operational districts were identified in
Luapula Province, namely Milenge, Mwense and Samfya districts. This followed a
study conducted by RuralNet Associates which showed that the three districts
were among the ten districts in Zambia with the least watsan coverage. The study
also confirmed that there were no donor organizations providing water and
sanitation interventions in these districts.

12 | P a g e
2.2 Strategic Options for the CS 2006 - 2010 WaterAid‟s Country Strategy (2006-10) came into operation in April 2006 and was
mainly anchored on continued rural focus as the cornerstone of the country
programme. Among the strategic options embedded in the strategy were; (i)
decentralized service delivery, (ii). improved sector efficiency and effectiveness,
(iii) increased sanitation focus, (iv) low cost technology, (v) school sanitation and
hygiene, (vi) private sector partnerships, (vii) advocacy and influencing, and (viii)
programme scale up or expansion.
WAZ was committed to improving the quality of the facilities that it supported to
achieve sustainable coverage and promoting affordable technical and operational
innovations in its work. The Strategy was developed following analysis of the
above strategic options, building on successes scored and working towards some
shifts in view of the dynamics of the water and sanitation sub sector in Zambia.
This strategy was aligned to the WaterAid Corporate Strategy 2005-2010.
Key strategic objectives of the 2006-10 CS were:
1. To develop and support different approaches of implementation of watsan
programmes resulting in effective delivery of WASH services and strengthened
local capacity to attain local MDG targets and further contribute to global
MDGs;
2. To develop capacity at all levels of the programme to raise the profile of the
WASH sector and influence others on good practice within the sector;
3. To build effective skills and knowledge among WAZ partners, staff and
participating communities for them to deliver sustainable WASH services, and
influence permanent hygiene behavior change in target communities;
4. To create awareness of Community Water Resource Management (CWRM)
principles among key stakeholders and communities to address the issues of
water depletion and contamination.
5. To describe and analyze the work of WAZ and key issues in the sector for
dissemination at all levels; and
6. To mobilise additional resources for the water, sanitation and hygiene sector
for the CP.
2.3 Financial resources over the period 2004/05 – 09/10 The Country Programme budget spends from 2004/2005 financial year to 2009/10
has seen a significant growth as shown in Table 1 and the graph below. In 2004-
05, the total spend was GBP 612,196, growing over the years to GBP 1,266,783 in
2008/09 and 1,018,718 in 2009/10 when a slump was experienced.

13 | P a g e
This growth (from 1 percent to 74 percent) is attributed to the expansion of
programmes in Southern Province and growth into three districts in Luapula
province.
Table 1: Programme Spend 2004/05-2009/10
Period (Financial year) Amount (in GBP) % Growth
2004/05 (base year) 612,196 -
2005/06 618,516 1.0 2006/07 677,944 9.6 2007/08 726,643 7.2
2008/09 1,266,783 74.3 2009/10 1,018,718 -19.6
Fig 1 Graphical presentation of Spend analysis
0
200,000
400,000
600,000
800,000
1,000,000
1,200,000
1,400,000
2004/05 2005/06 2006/07 2007/08 2008/09 2009/10
Am
ou
nt
in G
BP
Period (Financial Year)
Programme Spends 2004-2010
The 19.6 percent slump in fiscal 2009/10 was occasioned by the Global Financial
crisis that made it difficult for the CP to raise enough funds to meet the funding
gap in the Essential Budget for that year. The overall growth for the entire period
2004/05 to 2009/10 was 66 percent.
2.4 Programme outreach for the period 2004-10 During the 2004-10 period, the programme recorded the following results as confirmed by
the Country evaluation of 2008 which focused on the relevance and effectiveness of the
Country Programme and the sustainability of its interventions. For the first two years
(2004/05 and 2005/06) the CP underperformed by 63 percent on water and 39 percent on
sanitation. This underperformance was largely due to i) over ambitious planning by
partners, and ii) WAZ‟s phasing into new districts without comprehensive analysis and
target forecasting.

14 | P a g e
However, the performance of the Country Programme during the current strategy has
generally been relatively impressive, with set targets for water surpassed by 14 percent.
Sanitation targets however were under achieved by 24 percent.
Table 2 below shows performance against targets for water and sanitation for the period
2005/06 to 2009/2010.
Table 2: Performance against targets 2005/06 - 2009/10
Year Water Sanitation
Planned Reached
Growth
(%)
Planned Reached
Growth
(%)
2005/06 16,713 14,565 -13 29,191 18,802 -36
2006/07 22,300 28,482 28 46,000 28,411 -38
2007/08 18,600 24,014 39 21,640 19,269 -11
2008/09 37,100 39,700 7 35,426 35,670 1
2009/10 25,990 34,140 31 34,512 25,326 -27
Totals 120,703 140,901 14 166,769 127,478 -24
2.4.1 Strengths and achievements of the Country Programme
Despite its size in comparison to other Country Programmes in the region, WAZ
has positioned itself well to execute its mandate. The CP has a growing team that
has worked well with its partners and government. Further, it is considered
relevant and aligned to the national sector policy context, notwithstanding the fact
that the latter context is rapidly changing. The CP is also guided by WaterAid‟s
institutional and operational policies.
A major strength of WAZ is its working through partners in the delivery of its
services. The programme has established formal partnerships with Local
Authorities (LAs) as agents of the MLGH through Rural Water and Sanitation Units
which have been established in all districts where WAZ is working and through
district-based partner NGOs who deliver WASH services directly to the
communities. The LAs and partner NGOs also perform planning, monitoring and
supervisory functions in the districts. The Country Programme has also become
much more geographically focused and has concentrated on achieving high levels
of coverage before moving to new areas. In 2009 WAZ signed Partnership
Agreements with Keepers Zambia Foundation (KZF) and Vision Africa Regional
Network (VAREN) in line with the recommendations of the programme evaluation
to expand urban work. The Country Programme also executed a Memorandum of
Understanding (MoU) with Southern Water and Sewerage Company (SWASC) to
implement peri-urban and small-towns projects in Chisekesi in Monze district.
WAZ has been a notable stakeholder in the WASH sector and participates in
coordination committees and other sector meetings. The Country Programme is
known and recognized for its championing of sanitation, and in particular its efforts
to push forward the National Sanitation Strategy. WAZ is also a member of the
water sector Cooperating Partners forum and a Board member of the NGO WASH
Forum. Most of WAZ projects have operated according to a fairly conventional (but

15 | P a g e
well-executed) model of subsidized service delivery. The one exception - an
exciting one - is the Self Supply project in Luapula, in which it has been possible to
stimulate real demand which has translated into household cash investments in
improving water points without the need for government or other subsidy.
The essence of the Self Supply project is illustrated in Box 1 below:
Source: WaterAid Zambia Country Programme Evaluation -2009
2.4.2 Lessons Learned
1. The urban programme has had greater focus on sanitation than water supply.
This is because there was a need to increase sanitation access rates which
were lower than those of water. In addition, the cost of investment in sanitation
as compared to water was assumed to be lower and thus could reach more
people and attain scale. In peri-urban areas however, it was learned that the
actual cost of delivering water is lower than that of sanitation due to the rocky
ground formation in Lusaka in particular, and the complex nature of peri urban
areas in general.
2. Results from a WaterAid sustainability study showed that there were failures of
about 30 percent of water facilities failed especially where there were no active
or functional Water Committees. As regards sanitation, the failure rate was 45
percent and this was mainly attributed to poor quality of construction,
workmanship, floods and unsuitable soil formations.
3. Despite WAZ training a number of artisans in some areas to support the
construction of water and sanitation facilities, some households opted to
replace their own latrines because they could not afford to pay the artisans. As
a result, WAZ has created superfluous capacity in some communities which,
however, could be utilized in other areas.
4. Latrine construction in flood prone areas with high water tables and unsuitable
soils has been a major challenge in both Luapula and the Southern Province.
Although people appreciated the improved latrines, which could be easily
cleaned and therefore hygienic, some of these facilities ended up collapsing.
As a result, WAZ piloted ecological sanitation latrines as an alternative
Box 1 Self Supply Project – Luapula Province
The WaterAid / Unicef Self-Supply Project in Luapula Province represents a radically different way of working compared to other partnerships and interventions in the Country Programme. First, the implementation is under the direct control of WAZ rather than via a partner organisation. Second and more importantly, the project is enabling rural water supply and sanitation upgrading to take place with zero subsidy for materials. Initial results (as reported to the Evaluation Team led by Sally Sutton) are very encouraging, with some households now investing in concrete well-rings and others for improvements to source protection using local materials.

16 | P a g e
technology although the adoption rate was low due to traditional taboos around
the perception of handling human waste.
5. Implementing peri-urban projects in major cities such as Lusaka has been a
bigger than anticipated challenge not only for WAZ but also for other
organizations such as CARE International, JICA and Lusaka Water and
Sewerage Company (LWSC), which have also promoted urban sanitation.
However, it was learned that benefits of improved sanitation can be achieved
quicker where there is good community engagement and networking among
community based organizations.
6. In terms of Equity and Inclusion, the programme did not sufficiently mainstream
Gender, HIV and Climate Change in its programming yet the three issues had
a direct bearing on how communities participated in accessing watsan
services, how community decisions in watsan access and management were
made and how climate variability over the years has affected access to water.
In addition to this, not much emphasis was placed on Disaster Preparedness
and Disaster Risk Reduction (DP and DRR) to ensure communities understood
issues of disaster mitigation and how community knowledge and resilience to
these factors can be shored up.
3.0 SITUATION ANALYSIS 3.1 Country Background Zambia is a landlocked Sub Saharan country sharing borders with Malawi, Mozambique, Tanzania, Namibia, Botswana, Zimbabwe, Angola and Congo DR. It is located between 80 North and 180 South 220 and 340 East and 260 West enjoying a sub tropical climate with three distinct seasons. The average attitude is 1,200m above sea level with the highest parts in the north-east and a steady fall in elevation in the south and south-west. The hot and dry seasons run from mid-August to mid-November, the cold dry season from May to mid-August while the rainy season is from November to April.
The country has a land area of 752,614km² of which 11,980Km² (16 percent) is
water stored in lakes, swamps and rivers. The population of Zambia, with annual
growth rate of 2.4 percent, stood at 9.9 million in 2000 has a population density of
13 persons per square km. The country is divided into 9 provinces and has 73
districts.
Historically, Zambia has been ravaged by droughts and floods but in recent
decades the frequency and severity of these climatic hazards have increased. In
the last seven years of this decade Zambia has had to endure droughts in
2000/01, 2001/02, and 2004/05 while floods occurred in 2005/06 and 2006/07.
The impact of these droughts and floods included inadequate water recharge and
the consequent lowering of the water table, drying of boreholes and rivers and
inundation of water points and sanitation facilities especially in both rural and peri-
17 | P a g e
urban areas. The Southern province is particularly vulnerable and experiences
critical water shortages during drought conditions.
Climate change is a major factor in defining Zambia‟s social and economic life. In
the past 3 decades the country has seen rapidly changing climatic patterns with
lower average rainfalls, shorter rain seasons and hotter dry seasons. Flash
flooding and regular dry spells within the rainy seasons are usually followed by
outbreaks of diarrhea, cholera and other water-borne diseases especially in peri-
urban areas of Lusaka.
Climate change is often blamed for its impact on the supply and delivery of water
and sanitation services in both rural and urban areas. Incidences of dry boreholes
in Kazungula in Southern province, receding surface water catchments and
flooding in Luapula province occasioning diarrheal infections due to poor
sanitation, for example, are regular features that exert considerable pressure on
government, local authorities and other sector stakeholders. In view of the above
challenges, the World Bank chose Zambia as one of its focus countries in climate
change impacts and adaptation assessments in Africa. In this CS, WAZ will
explore opportunities to influence government and stakeholders to focus on
climate change awareness, Disaster Preparedness and Disaster Risk Reduction
(DP and DRR) and adaptive and innovative technologies pertaining to water
storage such as sand dams, surface water management, rainwater harvesting
among others.
3.2 Political Context Zambia is a multi party democracy led by the Movement for Multi-party Democracy (MMD) which has been at the helm since 1991. The political governance of the country is structured into three arms of governments namely the Legislature, the Judiciary and the Executive. The government has been implementing a policy of decentralization and the focus has been to give increased authority and responsibility to local authorities (District Councils and Municipalities). Each district is divided into constituencies which are further divided into wards which are the lowest government administration units at district level. The National Assembly consists of 150 democratically elected Members of
Parliament (MPs). Ten (10) MPs are nominated by the President. The country
completed drafting the National Constitution, launched the Sixth National
Development Plan and commenced the 2010 national census in October 2010.
National presidential and parliamentary elections will be held later in 2011. Chiefs
who are recognized in the local government system under the House of Chiefs
administer traditional land under customary tenure but have over the years been
divesting parts of the land to government for various development projects. An
example of this land divestiture is that of the Lumwana mine in Solwezi where a
new mine has started operations as well as the Nansanga farming block in
Serenje where government has opened up a large agricultural scheme.

18 | P a g e
3.3 Economic and Social Development Zambia has attained tremendous economic recovery from the stagnation experienced in the 1990s during which the harsh policies of Structural Adjustment Programmes (SAPs) were implemented. The recovery has been measured by differences in the average economic growth recorded at about 2.1 percent in the 1990s and 6.1 percent in the period 2006-2008, as well as other macroeconomic indicators recorded within this period. This positive growth and the country‟s economic recovery have been variously attributed to the mining, agriculture, tourism, wholesale and retail trade, and construction.
Several analysts and economic commentators1 contend that Zambia‟s economy
escaped the impact of the global crisis in good shape mainly due to the strong
rebound in copper prices in 2009 and a strong performance by the agriculture
sector. At the start of the economic and financial crisis, the collapse in copper
prices in the second half of 2008 hit the mining industry hard resulting in laying of
some employees, while a number of mines were forced to down size, restructure
or shut down. The rebound in copper prices in 2009 boosted mining activities with
the sector contributing 10 percent to GDP, which surged to 15.8 percent after
expanding by only 2.5 percent in 2008. After expanding by 6.3 percent in 2009,
the economy was set to grow by about 6.6 percent in 2010 and about 7 percent in
2011.
Headline inflation declined from 16 percent in January 2009 to 9.9 percent by
year-end. This was mainly attributed to a decline in food inflation from 21.3
percent to 8 percent over the same period. The inflation outlook remains
favourable and it is expected that inflation will drop to just below 10 percent by
year-end 2010. Table 3 below shows various economic trends for the period 2004-
2008.
Table 3: Economic indicators 2004-2008
Year
Economic data Poverty incidence
Annual
Inflation GDP Rural (%) Urban (%)
2004 17.5 5.0 78 53
2005 15.9 5.1 No data No data
2006 8.2 6.2 80 34
2007 8.9 6.2 No data No data
2008 16.6 5.7 N/a N/a
2009 9.9 6.4 No data No data
Source: CSO, SNDF drafts, Economic Reports 2004; 2005; 2006; 2007; 2008
An analysis of macroeconomic indicators for the period 2004-2008 shows that
despite economic growth averaging 6 percent per annum, it did not translate into
corresponding poverty reduction and poverty levels remained high at 64 percent in
2006, having marginally reduced from 68 percent in 2004. Poverty reduction
1 Including ABSA Capital in their advisory note on Zambia dated 4 June 2010
19 | P a g e
efforts, after closer scrutiny, reveal inequalities between urban and rural areas. For
the period 2004 to 2006, rural poverty increased by 2 percent to 80 percent and
urban poverty reduced to 34 percent (CSO, 2006).
According to the CSO in the LCMS (2006) the unemployment rate for the whole
country was 14 percent.2 Forty-three (43) percent of the work force was
considered employed and another 12 percent constituted the unpaid family labour.
HIV with a prevalence rate of 12 percent, and food insecurity in many parts
Zambia continue to ravage the country.
One reason why poverty has not significantly reduced in spite of the improved
economic performance, as argued by analysts and commentators, was the weak
growth-poverty relationship. Concentration on mining and mining related
investments has failed to foster enough poverty alleviation, particularly in the rural
areas where about 65 percent of the poor live and obtain their livelihood from rain
fed agriculture. On the other hand, high poverty levels in the rural areas have been
compounded by the poor performance of the agriculture sector which employs the
majority of the people, 67 percent (FNDP, Mid Term Review 2009).
There was also a high rural-urban migration driven mainly by prospects of
employment and a better life. Despite the rural-urban migration the bulk of the
population in Zambia (65 percent) still lives in rural areas (LCMS, 2006).
According to Muchima (2006), the mushrooming of informal settlements in major
towns in Zambia is a result of not only a failed National Housing Policy but also the
migration of people from the rural areas into the urban areas. Consequently,
Zambia experiences high levels of urbanization which in turn affect the provision of
basic services to urban population. Urban population is now more than 35 percent
of the national population, accounting for more than 4.6 million people. The lack of
access to safe and adequate of water and sanitation in the peri urban and low
income areas is argued to be as a result of the deficiency of infrastructure to meet
the increasing demand. According to a 2009 NWASCO report, the urban water
coverage is 74 percent and 36 percent sanitation, excluding pit latrines often in an
unimproved state. The disparity suggests insufficient targeting of the sanitation
needs of the poor.
Almost 80 percent of the children in Zambia, about 1.2 million, are considered to
be stunted, wasted or underweight (CSO, 2006). The proportion was higher for
rural areas accounting for about 70 percent of such children.
2 Unemployment rate shows the proportion of the economically active population of the working age ( 12
and above).
20 | P a g e
The Fifth National Development Plan (FNDP) estimated that if the country
continues on this growth path, progress towards halving the 1990 poverty levels of
70 percent by 2015 will be difficult (MoFNP, 2006b). Zambia is among the low
human development countries ranking 164 out of 182 countries on the UN Human
Development Index table for 2009.
3.4 Overview of WASH
In Zambia, urban and rural access to safe water supply and sanitation has been
increasing marginally since the 1990s. However, sanitation services have either
been reducing or virtually remained the same, with the situation being worse in
rural areas. For instance, between 1990 and 2000, the proportion of households
with access to safe drinking water in Zambia increased only marginally from 48 to
51 percent, while the proportion of households with access to improved sanitation
actually reduced from 17 to 15 percent.3 National access to safe water was
recorded at 58 percent (LCMS, 2006), while the population that had access to
sanitation declined from 70 percent in 2004 to 63.9 percent in 2006. In rural areas,
37 percent had access to safe water in 2004 which, increased to 43 percent in
2006.
On the other hand, 59 percent of households in Zambia have own latrines, while
7.3 percent use communal latrines, and another 4.6 percent used neighbors‟ pit
latrines. The MDG Progress Report for 2008 indicates that Zambia could
potentially meet Target 10 – which requires the country to „halve, by 2015, the
proportion of the population without sustainable access to safe drinking water and
basic sanitation.‟
JMP, on the other hand, data suggests that Zambia is on an upward trend but at a rate that is not fast enough to achieve the MDG targets as national water coverage will only increase to 64 percent. The sanitation coverage on the other hand will have increased to 50 percent only in 2015. In terms of agreed national targets, these are set at 75 percent for rural water coverage and 66 percent for sanitation.
The Water Supply and Sanitation sector in Zambia has undergone a number of changes. Government and sector players have been involved in developing and implementing new strategies intended to improve access to water supply and sanitation services, especially by the poor and marginalised. Between 2004 and 2006, access to safe water improved from 37 percent to 58 percent, while sanitation access decreased from 70 percent to 64 percent.
There is a dearth of district annualised disaggregated information on access to
safe water and sanitation services in Zambia, especially for rural areas. The CSO,
for example, in its latest LCMS Report only makes blanket statements on the
percentage of the population by type of excreta disposal mechanism. With regard
to access to water the same report only provides the percentage accessing safe
water.
3 Mphuka C, "The Cost of Meeting the MDGs in Zambia" -2005 study
21 | P a g e
Efforts made by WaterAid working with JMP and government agencies in
Southern Africa to reconcile WASH sector data and mapping, is something that
needs to be built upon to enhance sector information to inform service delivery. In
this Strategy, WAZ will support government in establishing a reliable IMS system
that will facilitate better resource and facility planning and monitoring.
3.5 Rights, Equity and Inclusion Analysis The poor, marginalized and rural communities in Zambia have consistently been
excluded from water and sanitation service provision. The commercialization of
water and sanitation in the urban areas has come with negative cost recovery
management, hence creating affordability challenges for the poor people. Women
have also been excluded from WASH services mainly due to lack of access to
resources and participation in decision making structures inherent in the social
system as well as the tendency for gender to be isolated as a specific issue rather
than a cross cutting concern in WSS interventions. People Living with HIV and
Aids (PLWHAs) are also stigmatized and unable to enjoy their rights to WASH
effectively while the disabled suffer challenges of accessing household and public
water and sanitation facilities that do not respond to their needs vis-à-vis the
design and siting of watsan facilities.
Exclusion from WASH in the rural communities emanates from the country‟s
skewed development pattern which has seen concentrated WSS investment and
regulation in the urban areas. At the grassroots level, most Zambians see water in
terms of survival and as a basic human right which was not the view at the
national level, or in legislation until recently when the country included access to
water and sanitation as a basic human right in the Draft National Constitution. This
followed the UN resolution of September 2010 on the matter.
At the national level the focus is to maximise the economic potential of water
resources. In this regard, grassroots institutions are excluded from policy
formulation with the result that the policy, legal and institutional frameworks mainly
focus on the urban water sector and provision of water rights to the more affluent
Zambian communities.4 This has made access to improved services to rural
communities an important area of focus.
Other challenges affecting the fulfillment of obligations in WASH by duty bearers
have included poor decision making, and poor allocation and release of budgets.
In Zambia, the highly centralised nature of resources causes a number of
bottlenecks which have resulted in underutilization and poor targeting of available
resources. This has further been compounded by the existence of multiple donor
projects that are poorly integrated with national and district level plans.5
4 Chileshe, P, Trottier, J and Wilson, L (2005) - Translation of water rights and water management in Zambia
International: workshop on „African Water Laws: Plural Legislative Frameworks for Rural Water Management in Africa‟, 26-28 January 2005, Johannesburg, South Africa 5 Slaymaker, T & Newborne:P Implementation of Water Supply & Sanitation Programmes under PRSPs -
Synthesis of research findings from sub-Saharan Africa

22 | P a g e
4.0 SECTOR REVIEW
Policy and institutional reforms which were initiated by the government in the late
1980s culminated in the development and adoption of the National Water Policy of
19946. This policy provides the overall framework for the water sector. It covers
water resources management, urban and rural water supply and sanitation, water
quality and water tariffs. Since then, the management and regulation of water and
sanitation activities have been governed by two ministries; the Ministry of Energy
and Water Development (MEWD) for Water Resource Management and
Development (WRMD) and the Ministry of Local Government and Housing
(MLGH) responsible for Rural Water Supply and Sanitation (WSS). The
responsibility for water policy formulation however, has remained the mandate of
MEWD which ostensibly has better institutional and operational capacity than
MLGH.
In this regard, two major programmes underpin the implementation of water supply
and sanitation in Zambia. These are the NRWSSP and NUWSSP though the latter
was still in draft as at December 2010. Alongside these, the Sector has continued
to undergo a series of reforms with new strategies developed, institutional reforms
initiated and new laws proposed.
The background to the water sector reform programme can be divided into three
periods as shown in the Appendix 3. The first period starting from 1964 to 1972
was a mixed economy with a growing private sector. From independence in 1964,
the Government aimed at transforming the economy including access to water
supply and sanitation through a series of five year national development plans.
The second period of transformation for the water sector coincided with the period
1972 to 1991 when Zambia became a one party state with emphasis on increased
state participation in all spheres of economic activities. Central government and
local authorities were unable to sustain funding to the water and sanitation
programmes which started in the 1960s. Consequently, water and sanitation
infrastructure deteriorated and fell into disrepair.
In 1991, Zambia reverted to a multi-party state and mixed economic management
in which Government reduced its direct involvement in economic affairs and
concentrated on formulating enabling policies to facilitate expansion of private
sector participation in the economy. In this new environment a National Water
Policy was adopted in 1994 to address water and sanitation problems inherited
from the previous era.
6 The revised National Water Policy of 2010 was adopted in March 2010
23 | P a g e
4.1 Sector Policies and Strategies
The 1994 National Water Policy ushered in a new sector management regime and
promoted the separation of water resources management from water supply and
sanitation. Other policy measures included the separation of regulatory and
executive functions; devolution of authority to local authorities; achieving eventual
full cost recovery for Water Supply and Sanitation through user fees among
others. The rationale for the revision of the 1994 National Water Policy includes
the need for the policy to address new challenges and modern approaches in the
management of water resources. The revised (2010) National Water Policy
therefore, embraces modern principles of water resources management and
provides policy space for addressing challenges of poverty reduction and other
cross sectoral interests in the water sector. Further, the revised National Water
Policy takes into account the National Decentralisation Policy.
In 1996, the Government adopted the WASHE (Water, Sanitation, and Health
Education) concept, a national strategy for the improvement of WSS services. This
strategy facilitates the involvement of the rural population in assessing priorities;
determining affordable and sustainable technology; management; operation and
maintenance; and improving the health and hygiene practices in rural
communities. The strategy is being implemented through district level committees
(D-WASHEs), which are part of the formal district level planning process under the
new institutional arrangements which mandate the local authorities with the
responsibility of service provision.
Several programmes guiding the implementation of water and sanitation activities
in the country have been developed by the Zambian government such as the
National Rural Water Supply and Sanitation Programme (NRWSSP, 2006 – 2010).
This Programme seeks to improve and increase access to water supply and
sanitation services, and to achieve the Millennium Development Goals (MDG) for
water supply and sanitation, and ultimately meet the National Vision for Universal
Coverage by 2030 (MLGH, 2007)7. The NRWSSP provides a blueprint for the
implementation of the Rural Water Supply and Sanitation (RWSS) sector
programmes, whose core strategy for the delivery of services is based on the
principle that devolution of responsibility, authority and funding to the Local
Authorities (LAs) is the way forward for planning and implementation of RWSS
programmes.
The NRWSS embodies a no-subsidy provision that requires communities to make
a capital contribution of K1.5m before accessing a borehole. This provision has
caused the exclusion of communities and households who do not have the ability
to raise the money upfront. To this end a number of steps have been taken by the
NGO WASH Forum to advocate for the removal of the provision and thus enable
7Ibid
24 | P a g e
stakeholders like WAZ and its partners to scale up the provision of safe water and
sanitation.
The Sustainable Operations Maintenance Programme (SOMAP) is another
programme which seeks to improve sustainability of water supply facilities in
schools, health centers and communities in order to improve the health and
economic well-being of the most vulnerable groups of rural populations, including
persons affected by HIV and AIDS. SOMAP, from its inception, was aligned to
NRWSSP to accelerate the above mentioned activities. The Government has also
created the Devolution Trust Fund (DTF) which is a financing mechanism
supported by Cooperating Partners focusing on WASH provision to poor
communities. DTF specifically provides financial support to the Commercial
Utilities (CUs) to enable them to reach poor populations in peri-urban areas.8
4.2 Legal framework for the Sector
Principally, the water sector is still guided by Chapter 28 of the Water Supply and
Sanitation Act (1997). The Act incorporates the establishment of Commercial
Utilities (CUs) as well as the National Water and Sanitation Committee (2000) as
the regulator for WASH. Currently, there are 11 licensed Water Utilities in the
country providing 70-80 percent water supply services and 30-40 percent
sanitation services. The National Water and Sanitation Council (NWASCO) is the
institution responsible for administering and enforcing the Water Supply and
Sanitation Act. Other pieces of legislation relevant to the Water Supply and
Sanitation sector include the Environmental Protection and Pollution Control Act
Chapter 204 of 1990, the Public Health Act Chapter 295 of 1930 and the Local
Government Act Chapter 281 of 1991. In addition, a Water Resources
Management Bill has been prepared and awaits Parliamentary debate, approval
and assenting to by the President.
4.3 Sector Coordination
There have been considerable efforts to improve coordination in the sector. The
Joint Assistance Strategy to Zambia (JASZ, 2006/7) is one coordination
mechanism on national development interventions outlined in the FNDP. In
particular, JASZ assigns roles and responsibilities to Cooperating Partners (CPs),
government and other stakeholders in the sector. In addition, efforts to adopt the
Sector Wide Approach (SWAp) are expected to improve single managed (pooled)
funding, harmonization and policy dialogue and Aid effectiveness. The sector has
also seen the coordination from NGOs through the NGO WASHE forum which
also provided a platform for knowledge sharing and coordination.
8 USAID; ZAMBIA: Water and Sanitation Profile
25 | P a g e
4.4 Sector Financing
Many of the sector players are agreed to the SWAp basket funding arrangement in
terms of activities and approaches. The objective of the basket fund is to
harmonise various processes including the source and flow of funds, sector
programming, reporting, transaction costs and coordination. In 2009 the Zambian
Government allocated ZMK214 billion (approximately £26 million) to water and
sanitation services.
Current projections for sector finance suggest that without substantial increases,
the MDGs are unlikely to be met. A projected cost estimate for the NRWSSP
(2006-2015) suggests a total requirement of about US$362m covering both capital
costs (US$260m) and operational costs (US$45m) at district level, US$11m at
community level, US$27m in sector development costs and US$18 m for the
national operating budget. These figures are considerably higher than the
currently planned donor funding which amounts to US$90 million leading up to
2010. Further, donor funding in Zambia has tended to be project-based though
steps are now being undertaken to harmonize the approach through the
formalisation of the Informal Donor Group (IDM), which meets regularly for
programmatic discussions on aid policy and common approaches and
procedures.9
JMP suggests that total investment requirements to reach the MDG targets for
improved water supply amount to 88.1 million US dollars per year of which 44.3
million dollars per year would be for new infrastructure and 43.8 million US dollars
per year for the rehabilitation of non functional infrastructure. The total investment
requirements for sanitation coverage per year to achieve the MDG targets
amounts to 14.1 million US dollars of which 7.2 million US dollars per year would
be for new investments and 6.8 million US dollars for rehabilitation requirements.
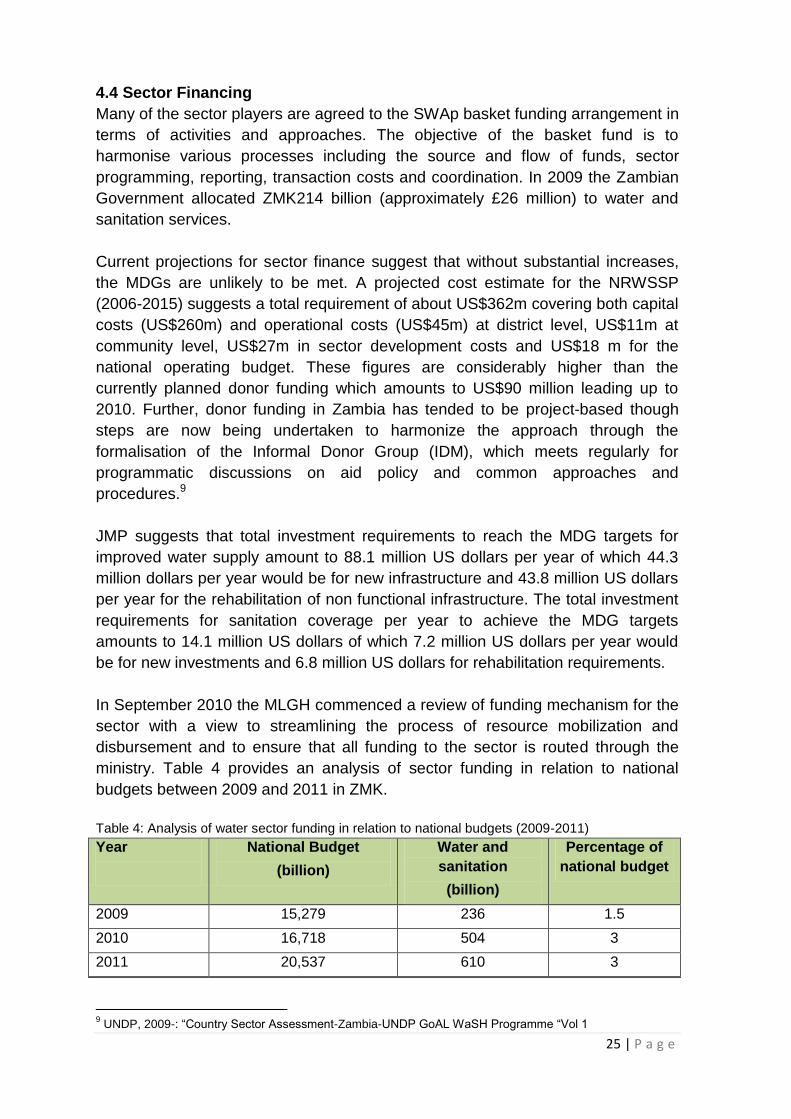
In September 2010 the MLGH commenced a review of funding mechanism for the
sector with a view to streamlining the process of resource mobilization and
disbursement and to ensure that all funding to the sector is routed through the
ministry. Table 4 provides an analysis of sector funding in relation to national
budgets between 2009 and 2011 in ZMK.
Table 4: Analysis of water sector funding in relation to national budgets (2009-2011)
Year
National Budget
(billion)
Water and
sanitation
(billion)
Percentage of
national budget
2009 15,279 236 1.5
2010 16,718 504 3
2011 20,537 610 3
9 UNDP, 2009-: “Country Sector Assessment-Zambia-UNDP GoAL WaSH Programme “Vol 1

26 | P a g e
Source: CP Wash Forum 2010
4.5 Institutional arrangements and sector capacity
One of the important measures of the Water Sector Reforms was the transfer of all functions for rural water supply from the Department of Water Affairs (DWA) in the Ministry of Energy and Water Development (MEWD) to the Department of Housing and Infrastructure Development (DHID), in the Ministry of Local Government and Housing (MLGH). Additionally, the DHID has the remit of implementing WSS policies for urban and rural areas. The transfer entailed building institutional capacity within the DHID to assume these new functions. Therefore GRZ established the Rural Water Supply and Sanitation Unit (RWSSU) in 2003 to carryout central level functions as provided in the National Water Policy and supporting strategies and to co-ordinate and promote the affairs of rural water supply and sanitation in the country.
The skills composition and requirements for the DHID are multi-disciplinary and include policy and institutional, public health, sociology, information management and communications, advocacy and water engineering expertise. Government in the NRWSSP recognizes the absence of dedicated RWSS units in most local authorities and thus provides latitude for D-WASHE committees to continue to assist the Councils in the management of the RWSS sub-sector for the time being. Human and institutional capacity weaknesses in managing and implementing various WSS programmes emerged as one of the key bottlenecks in delivering water supply and sanitation services at central, provincial and district level.
The RWSS sub-sector has for a number of reasons lagged behind the urban
WSS. In spite of central Government streamlining responsibilities and passing an
appropriate policy and legal framework for the sector, institutional developments
have been slow such as the full transfer of executive functions currently
undertaken by other line ministries to local governments, delays in increasing
resources to the sector, and institutional capacity building in local authorities,
amongst others.
4.6 Performance Monitoring and Accountability
Performance monitoring and accountability have been a challenge in the WASH
sector. The situation has been compounded by lack of a national M&E framework.
This has had negative effects on the way WASH activities are implemented,
monitored and evaluated. However, in the Rural Water Supply and Sanitation sub-
sector, Cooperating Partners have supported the development of an Information
Management System (IMS) based on the principles of sustainability, participation
and use of a single unified system. When operationalised, the IMS will be used as
a mapping tool for water and sanitation facilities and will be key to informing the
planning and monitoring of the rural WSS sector performance at district and
national levels.
Currently, sector information is compiled from Central Statistical Office figures,
annual reports from NWASCO, and occasional sector assessments such as the
peri-urban baseline study undertaken by NWASCO in 2006. While NWASCO
provides good management information systems for urban WSS, the rural sub-

27 | P a g e
sector lacks any structured monitoring framework. Sector monitoring activities
need to be linked to the MLGH which has ultimate responsibility for planning and
monitoring developments in RWSS. To address this issue, a monitoring system for
RWSS has been piloted in three provinces by the MLGH. Plans and funding to roll
it out nationwide are in place with support from donors, but due to capacity
constraints, very little activity has taken place within MLGH. Delays may be partly
attributed to the need for getting agreement on key concepts, standards and
definitions in the sector.
4.7 Summary of Sector Blockages and challenges
WaterAid in Zambia has through various processes identified sector blockages,
some of which may impact negatively on the new Country Strategy. In 2009, and
previously through a number of studies leading to the development of this CS,
some blockages and challenges faced in the CS period 2006-2010 were identified.
The new CS 2011-2015 will seek to address some of the challenges presented
below:
1. Weak institutional and human resource capacity of the sector ministry and
allied government departments and partner NGOs. There are major
shortages of staff in Government with the necessary skills and experience
to drive the sector. The few staff in key positions of responsibility are over-
stretched and unable to engage effectively. Very few NGOs have
experienced staff in water and sanitation projects.
2. The slow pace of decentralisation is preventing districts from taking on their
full responsibilities under the NRWSSP.
3. Weak information management in WAZ and partner organizations to profile
and document activities. WAZ has generated a great deal of lessons
through its interventions over the years, but not much of this has been
documented and published.
4. Weak sector harmonization and coordination. WAZ however promotes and
support the operations of the NGO WASH Forum and participates in
several sector forums to promote sector advocacy, coordination and
harmony thereby forestalling the proliferation of differing approaches by the
many different sector players.
5. Weak MIS and a water point mapping system which stifle effective sector
planning and service delivery. The MIS and database by MLGH is not well
developed and structured. Mapping of water points and other watsan
infrastructure has not progressed since 2006 and many water points in
many districts in the country have not been mapped and data captured on
the national data base.
6. Weak linkages between WASHE and other sectors such as health,
education and environment, in areas of HIV, Malaria programmes and
climate change (DDR). This has been due to poor mainstreaming of such
activities.
28 | P a g e
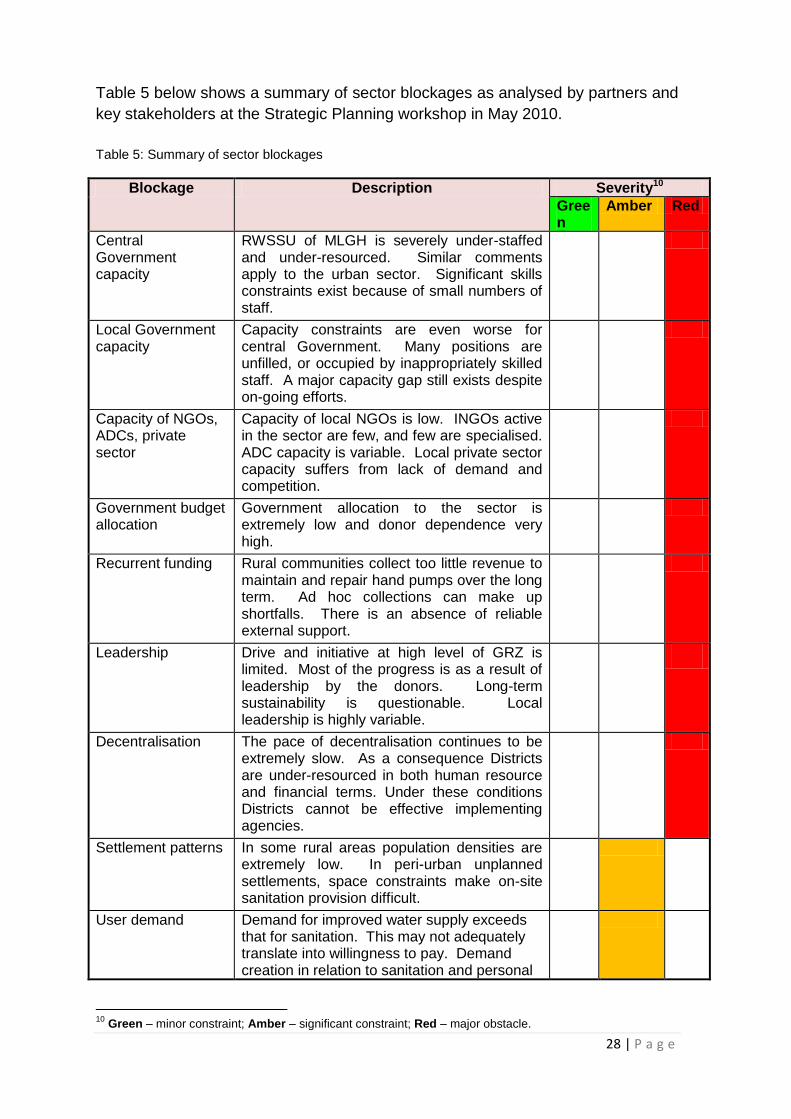
Table 5 below shows a summary of sector blockages as analysed by partners and
key stakeholders at the Strategic Planning workshop in May 2010.
Table 5: Summary of sector blockages
Blockage Description Severity10
Green
Amber Red
Central Government capacity
RWSSU of MLGH is severely under-staffed and under-resourced. Similar comments apply to the urban sector. Significant skills constraints exist because of small numbers of staff.
Local Government capacity
Capacity constraints are even worse for central Government. Many positions are unfilled, or occupied by inappropriately skilled staff. A major capacity gap still exists despite on-going efforts.
Capacity of NGOs, ADCs, private sector
Capacity of local NGOs is low. INGOs active in the sector are few, and few are specialised. ADC capacity is variable. Local private sector capacity suffers from lack of demand and competition.
Government budget allocation
Government allocation to the sector is extremely low and donor dependence very high.
Recurrent funding Rural communities collect too little revenue to maintain and repair hand pumps over the long term. Ad hoc collections can make up shortfalls. There is an absence of reliable external support.
Leadership Drive and initiative at high level of GRZ is limited. Most of the progress is as a result of leadership by the donors. Long-term sustainability is questionable. Local leadership is highly variable.
Decentralisation The pace of decentralisation continues to be extremely slow. As a consequence Districts are under-resourced in both human resource and financial terms. Under these conditions Districts cannot be effective implementing agencies.
Settlement patterns In some rural areas population densities are extremely low. In peri-urban unplanned settlements, space constraints make on-site sanitation provision difficult.
User demand Demand for improved water supply exceeds that for sanitation. This may not adequately translate into willingness to pay. Demand creation in relation to sanitation and personal
10
Green – minor constraint; Amber – significant constraint; Red – major obstacle.
29 | P a g e
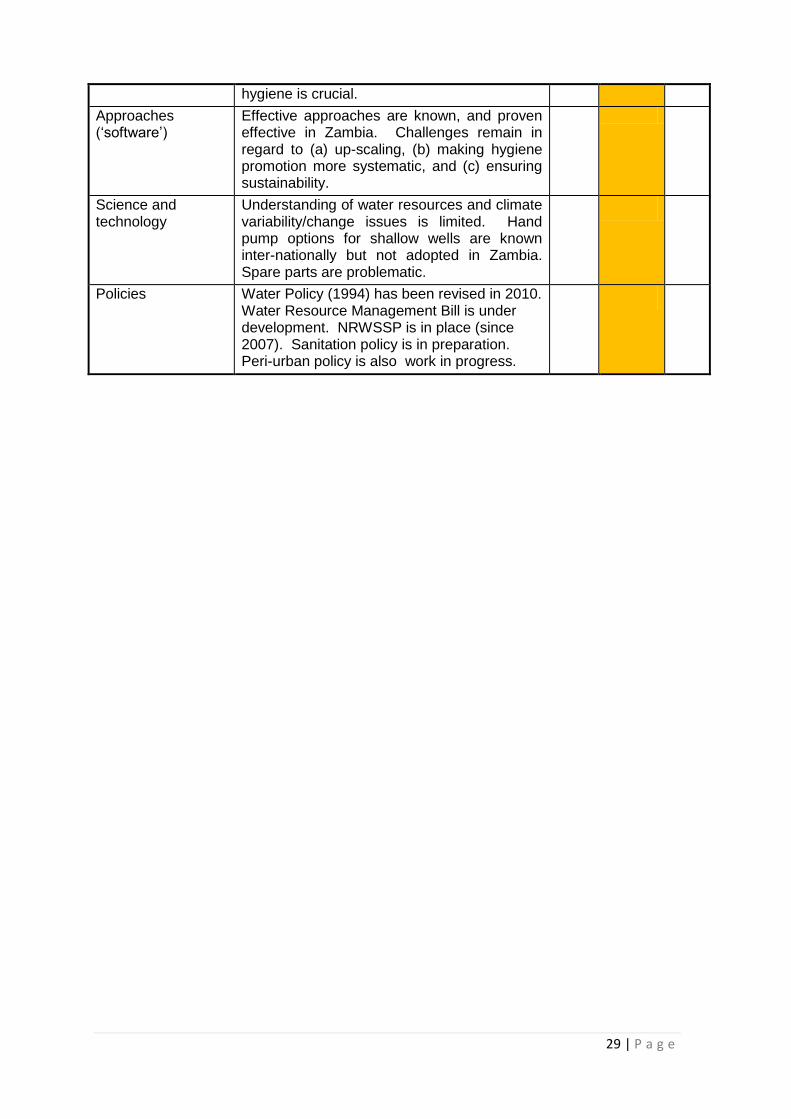
hygiene is crucial.
Approaches („software‟)
Effective approaches are known, and proven effective in Zambia. Challenges remain in regard to (a) up-scaling, (b) making hygiene promotion more systematic, and (c) ensuring sustainability.
Science and technology
Understanding of water resources and climate variability/change issues is limited. Hand pump options for shallow wells are known inter-nationally but not adopted in Zambia. Spare parts are problematic.
Policies Water Policy (1994) has been revised in 2010. Water Resource Management Bill is under development. NRWSSP is in place (since 2007). Sanitation policy is in preparation. Peri-urban policy is also work in progress.

30 | P a g e
5.0 WATERAID ZAMBIA COUNTRY STRATEGY 2011-2015
The Country Strategy for the period 2011 – 2015 will be implemented within the
crucial final years of the MDGs in 2015 and the termination point of the SNDP
(2011-2015) as well as the termination of the WaterAid Global Strategy (2009-
2015). As in the previous CS, this Strategy is also poised to increase scale
towards the attainment of Local MDGs and contribute to the global MDGs and the
country‟s Vision 2030. The CS will be implemented within the framework of the
Sixth National Development Plan (SNDP) and will be aligned to the WaterAid
Global Strategy, ensuring that the Country Programme sufficiently responds to key
sector challenges and policy shifts made therein.
5.1 Outline of Strategic issues for the Country Strategy WAZ, through various planning and consultation processes, has identified a
number of strategic issues which require attention in the new country strategy.
These issues have been clearly articulated in the situation and sector analysis
above. Some of the key strategic issues that will be the focus of this CS are
discussed under two contexts; External and Internal. External strategic issues
refer to mandate and impact level issues which WAZ should address in its CS.
These are issues which reflect some of the sector challenges and blockages
which require the attention of all sector players including WAZ, while internal
strategic issues are an inward reflection of institutional and operational aspects of
WAZ which need to be addressed in order to effectively implement WASH
programmes over the CS implementation horizon to 2015.
5.1.1 External Strategic issues The following are the key external strategic issues which the CS seeks to address:
1. Limited human resource capacity- District Councils and several WAZ partner
NGOs face challenges in human resources, the major one being staff attrition
rates resulting in a number of RWSS units being terribly understaffed and NGO
staffing levels lower than the needed capacities. This human resource gap has
lead to ineffective service delivery and low monitoring of watsan activities as
well as delayed roll out of government sector policies and strategies such as
the National Urban Water and Sanitation Programme (NUWSSP) which was
still in draft as at December 2010, and the Information Management System
(IMIS) which has not yet been operationalised .
WAZ will support government in ensuring that adequate funding is placed in
the sector to recruit and retain key technical staff in the various units. WAZ will
also render administrative support to these districts units to ensure progression
of WASH activities while encouraging and supporting NGO partners in
resource mobilization and organization development.
2. Low sector funding - Funding to the sector remains low and it is evident that
31 | P a g e
sector players particularly Government, Cooperating Partners including International NGOs, have to substantially increase funding to both the urban and rural water supply and Sanitation programmes if Zambia is to attain its local MDG targets and achieve the MDG goals on water supply and sanitation by 2015. The high capital cost of WASH infrastructure further compounds the situation of low sector funding. A review of the FNDP period indicates that the water sector was not one of the priority sectors in as far as resource allocation was concerned. For instance, the sector was allocated a paltry 1.5 percent of the national budget in 2009. This level of funding has had a negative impact on the performance of the sector. In the 2010 and 2011 budget years the allocation to the sector as a percentage of the national budget was only 3% percent for both years.
3. Government still prioritizes funding to Agriculture (6.0 percent), Health (8.6 percent), Education (18.6 percent) and Defence (7.2 percent). Despite the FNDP declaring WASH as one of the six priority sectors, clearly this is not matched by the resource profile.
WAZ will engage and lobby sector ministries, Members of Parliament, Chiefs
and sector key stakeholders to increase funding to the sector. WAZ will also
strengthen in country fund raising donor agencies that have water and
sanitation in their Country Assistance Strategies. DfID, the EC, UNICEF,
Danida and Irish Aid are targeted for this effort. In-country fund raising will
complement WA and government funding, and increase the scale of long term
funding contracts that assure the growth and continuity of WAZ activities in the
country.
4. Low functionality and sustainability of watsan infrastructure: there is a high
failure rate of both sanitation and water facilities. Low functionality has also
been attributed to the receding water table in a number of areas which in part
could be a manifestation of the impact of climate change. Lack of institutional
arrangements for the effective management of community structures, and the
emphasis on hardware over software, are all contributing factors to the low
functionality and sustainability of some of the facilities including those
supported by WAZ.
WAZ will strengthen community based governance structures to ensure that
access, ownership and control of WASH infrastructure and services is
enhanced. WAZ will also work with the private sector and other agencies to
deliver targeted capacity building activities. Appropriate and cost effective
technologies will also be studied and adopted to enhance efficient service
delivery. Linkages with technical and research institutions and support from
TSU in WA UK will help further WAZs research objectives.
5.1.2 Internal Strategic Issues The main internal strategic issues that the CS seeks to address are presented
below:
32 | P a g e
1. Weaknesses in organizational effectiveness: a major internal WAZ
challenge in recent years has been high staff turnover which has inevitably
affected the implementation of the Country Programme. Key programme
positions such as that for Planning Monitoring and Evaluation (PME) have
remained vacant for over two years while the position of Rural Programme
Manager was only filled in the last year of the current CS. The programme
has faced challenges in recruiting for the position of PMEO potential
candidates asked for more than the programme could remunerate.
WAZ will develop and implement an action plan from the outcomes of the
Employee Engagement Survey (EES) related to staff welfare to ensure that
the right staff are recruited and retained. A skills audit to gauge the levels
and quality of staff needed will also be undertaken by the Senior
Management Team (SMT) in coordination with the Regional Team and the
HR department in the UK.
2. Limited partnership development – partner support and management has a
bearing on how partners contribute to the attainment of the goals articulated
in the CS. Most partners generally have weak financial and organization
development systems which have resulted in underperformance on set
targets and outputs.
WAZ will promote, encourage and link partners to possible sources of
funding and other capacity building support while always endeavoring to
provide institutional development skills. A partner capacity assessment
study will be undertaken within the first year of the CS and partner
development and management will be emphasized throughout the CS
period.
3. Inadequate documentation and knowledge sharing – WAZ, has over the
years conducted or commissioned a number of research studies on
different WASH aspects and gathered a lot of experience from its work.
These have not been effectively analyzed and disseminated this work due
to low staffing, lack of skills in internal documentation. As a result, most of
the research results are not in the public domain. Weak implementation of
Monitoring and Evaluation systems and the low utilization of research
outcomes in on-going programming work have also been major challenges.
WAZ will recruit a Communications Officer and collect, analyse,
disseminate and document all evidence derived from the outcomes of the
research it will undertake.
4. Limited participation in regional and global activities and opportunities -
WAZ has not been actively involved in regional and global activities

33 | P a g e
including those organized and supported by WaterAid mainly due to time,
staff limitations and other constraints and competing demands. A number of
key positions on the structure have yet to be filled.
WAZ will develop its capacities and improve its visibility through its
partners, funding agencies and target communities; and support
government in hosting and participating in major local, regional and
international WASH events.
5.2 Strategic Areas of Focus and Linkages to the Global Strategy Broadly, WAZ‟s strategic aims and objectives to address the above external and
internal issues have been categorized under 5 strategic areas of focus as listed
below and in Table 6. These are also aligned to the Global WaterAid Strategy:
1. Service Delivery
2. Capacity Development
3. Sector Financing
4. Influencing Work, and
5. Organisational Development
WaterAid Global Strategy Aims WaterAid Zambia Country Strategy Aims
Global Aim One We will promote and secure poor people‟s rights and access to safe water, improved hygiene and sanitation
CP Aim One - Service Delivery WAZ will promote and secure poor people‟s rights, and increased access to equitable and sustainable WASHE services, and contribute to meeting the MDG targets for the sector in Zambia.
Global Aim Two: We will support governments and service providers in developing their capacity to deliver safe water, improved hygiene and sanitation
CP Aim Two - Sector Capacity Development WAZ will support the development and strengthening of the capacities of local governments and partners to deliver safe and sustainable water, sanitation and hygiene services to meet Zambia‟s local MDG targets.
Global Aim Three: We will advocate for the essential role of safe water, improved hygiene and sanitation in human development
CP Aim Three - Influencing Work WAZ will support government and other key stakeholders to implement effective policies and good practices for improved and increased access to sustainable safe water and improved hygiene and sanitation. CP Aim Four - Sector Financing WAZ will advocate for, and influence the allocation of adequate resources to the sector and ensure their equitable, transparent and utilization for efficient and sustainable investments.
Global Aim Four: CP Aim Five - Organisational
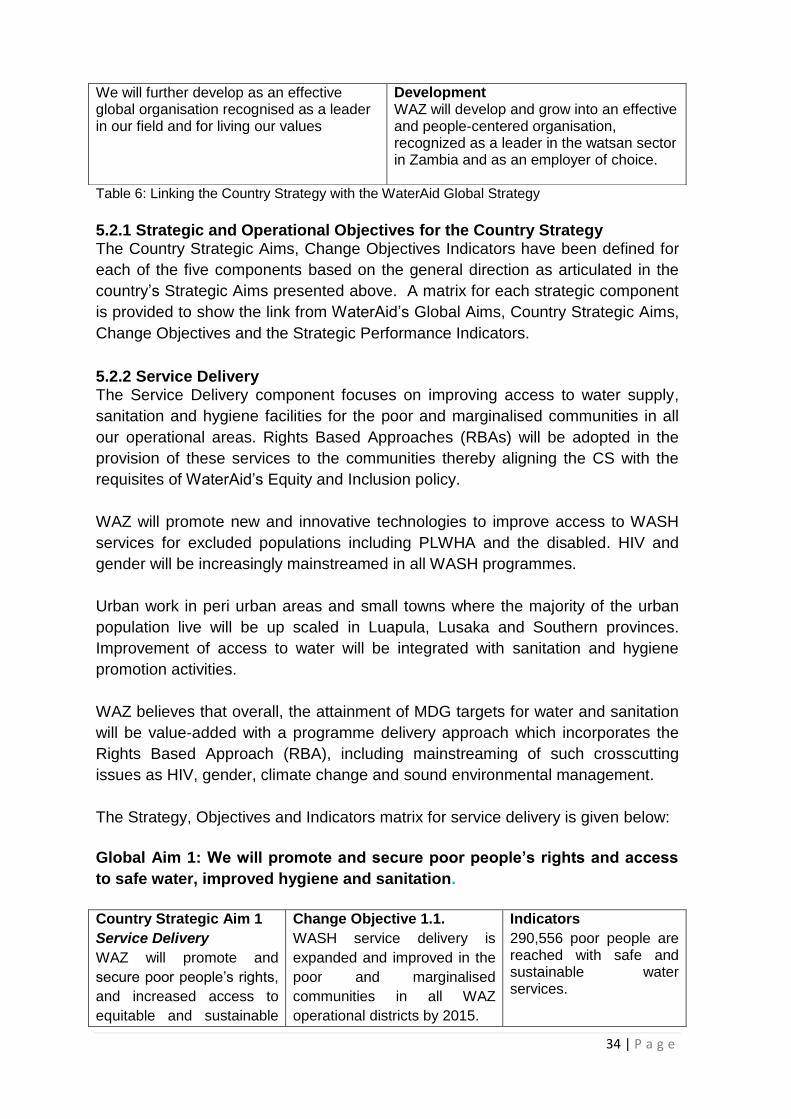
34 | P a g e
Table 6: Linking the Country Strategy with the WaterAid Global Strategy
5.2.1 Strategic and Operational Objectives for the Country Strategy The Country Strategic Aims, Change Objectives Indicators have been defined for
each of the five components based on the general direction as articulated in the
country‟s Strategic Aims presented above. A matrix for each strategic component
is provided to show the link from WaterAid‟s Global Aims, Country Strategic Aims,
Change Objectives and the Strategic Performance Indicators.
5.2.2 Service Delivery The Service Delivery component focuses on improving access to water supply,
sanitation and hygiene facilities for the poor and marginalised communities in all
our operational areas. Rights Based Approaches (RBAs) will be adopted in the
provision of these services to the communities thereby aligning the CS with the
requisites of WaterAid‟s Equity and Inclusion policy.
WAZ will promote new and innovative technologies to improve access to WASH
services for excluded populations including PLWHA and the disabled. HIV and
gender will be increasingly mainstreamed in all WASH programmes.
Urban work in peri urban areas and small towns where the majority of the urban
population live will be up scaled in Luapula, Lusaka and Southern provinces.
Improvement of access to water will be integrated with sanitation and hygiene
promotion activities.
WAZ believes that overall, the attainment of MDG targets for water and sanitation
will be value-added with a programme delivery approach which incorporates the
Rights Based Approach (RBA), including mainstreaming of such crosscutting
issues as HIV, gender, climate change and sound environmental management.
The Strategy, Objectives and Indicators matrix for service delivery is given below:
Global Aim 1: We will promote and secure poor people’s rights and access
to safe water, improved hygiene and sanitation.
Country Strategic Aim 1
Service Delivery
WAZ will promote and
secure poor people‟s rights,
and increased access to
equitable and sustainable
Change Objective 1.1.
WASH service delivery is
expanded and improved in the
poor and marginalised
communities in all WAZ
operational districts by 2015.
Indicators
290,556 poor people are reached with safe and sustainable water services.
We will further develop as an effective global organisation recognised as a leader in our field and for living our values
Development WAZ will develop and grow into an effective and people-centered organisation, recognized as a leader in the watsan sector in Zambia and as an employer of choice.

35 | P a g e
WASHE services, and
contribute to meeting the
MDG targets for the sector
in Zambia.
Change Objective 1.2.
Communities demonstrate
ownership and are managing
WASH facilities effectively in
all WAZ operational districts by
2013.
Evidence of functional
facilities and active
Water Management
structures
Evidence of WASH CBOs
involvement in decision
making processes
Evidence of communities
engaging civic leaders
and authorities to
demand for equitable and
inclusive WASH services
Change Objective 1.3.
Safe hygiene and good
sanitation practices consistent
with national standards are
adopted by communities in all
WAZ operational areas by
2015.
377,723 poor people
reached and have access
to adequate sanitation by
2015
491,040 poor people in all
our operational areas
adopt and practice safe
hygiene.
5.2.3 Sector Capacity Development
WAZ will strengthen the capacity of Local Authorities and NGOs, and support
Government in the implementation of WASHE services via a decentralization
framework and work within the approved national policy frameworks. WAZ will
provide capacity building support to partners and contribute to the logistical and
administrative requirements to enable partner staff undertake WASH activities
effectively.
WAZ will also provide support to the districts to develop and operationalize
information management systems for water and sanitation facilities in areas where
we work to help partners in the effective planning and targeting of resources. The
strategy, objectives and indicator matrix for capacity development is given below:
Global Aim 2: We will support governments and service providers in
developing their capacity to deliver safe water, improved hygiene and
sanitation
Country Strategic Aim 2 Sector Capacity Development WAZ will support the
development and
strengthening of the
Change Objective 2.1.
Institutional, technical and
financial capacities of
government and WAZ partners
sufficiently developed to
effectively implement WASH
Indicators
Evidence of improved technical skills and mainstreaming of Rights Based Approaches (including Equity and
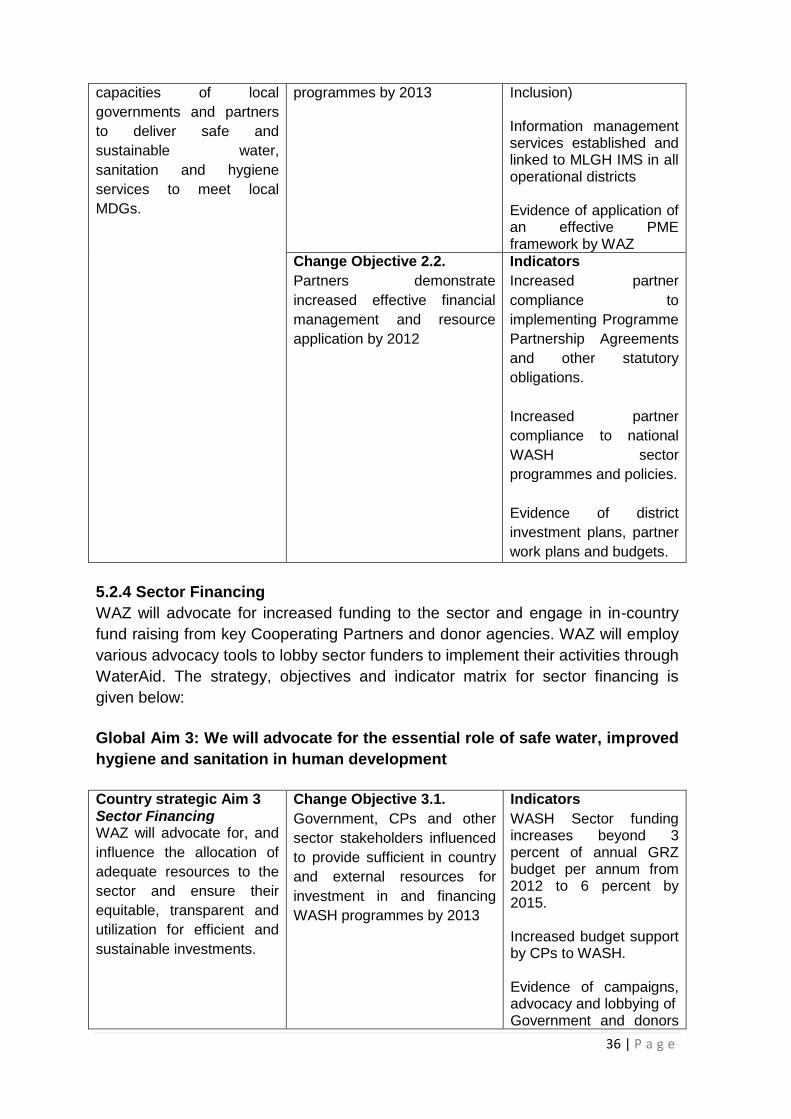
36 | P a g e
capacities of local
governments and partners
to deliver safe and
sustainable water,
sanitation and hygiene
services to meet local
MDGs.
programmes by 2013 Inclusion) Information management services established and linked to MLGH IMS in all operational districts Evidence of application of an effective PME framework by WAZ
Change Objective 2.2.
Partners demonstrate
increased effective financial
management and resource
application by 2012
Indicators
Increased partner
compliance to
implementing Programme
Partnership Agreements
and other statutory
obligations.
Increased partner
compliance to national
WASH sector
programmes and policies.
Evidence of district
investment plans, partner
work plans and budgets.
5.2.4 Sector Financing
WAZ will advocate for increased funding to the sector and engage in in-country
fund raising from key Cooperating Partners and donor agencies. WAZ will employ
various advocacy tools to lobby sector funders to implement their activities through
WaterAid. The strategy, objectives and indicator matrix for sector financing is
given below:
Global Aim 3: We will advocate for the essential role of safe water, improved
hygiene and sanitation in human development
Country strategic Aim 3 Sector Financing WAZ will advocate for, and
influence the allocation of
adequate resources to the
sector and ensure their
equitable, transparent and
utilization for efficient and
sustainable investments.
Change Objective 3.1.
Government, CPs and other
sector stakeholders influenced
to provide sufficient in country
and external resources for
investment in and financing
WASH programmes by 2013
Indicators
WASH Sector funding increases beyond 3 percent of annual GRZ budget per annum from 2012 to 6 percent by 2015. Increased budget support by CPs to WASH. Evidence of campaigns, advocacy and lobbying of Government and donors

37 | P a g e
to increase investment.
Change Objective 3.2.
WASH financial resources
equitably and transparently
utilized for financing
investments in the WASH
sector by 2013
Indicators
Evidence of effective
targeting and delivery of
WASH services by sector
players
5.2.5 Influencing Work
Since its inception, WAZ has distinguished itself for its advocacy and influencing
work. Government and other stakeholders, including Cooperating Partners,
recognize the unique position that WAZ occupies. WAZ will continue its influencing
work anchored with concrete evidence arising from its own experiences, its
research work and policy analyses. WAZ will also invest in knowledge
management and ensure that its research findings and other policy briefs on
WASH activities and processes, are well packaged and made available to the
public. Lobbying with MPs, ministers and donor agencies and possibly political
parties will also be undertaken.
The strategy, objectives and indicator matrix for Influencing work is given below:
Global Aim 3: We will advocate for the essential role of safe water, improved
hygiene and sanitation in human development
Country Strategic Aim 4 Influencing work WAZ will support government and other key stakeholders to implement effective policies and good practices for improved and increased access to sustainable safe water and improved hygiene and sanitation.
Change Objective 4.1.
Effective WASH policies
adopted and timely
implemented by Government
and other key sector players
by 2013.
Indicators
Key WASH sector policies, such as the NUWSSP, SOMAP III and others WASH policies) developed and implemented. Evidence of launching and roll out of WASH policies and programmes.

38 | P a g e
Change Objective 4.2.
Appropriate WASH
approaches, practices and
standard are implemented in
all WAZ operational areas by
2015
Indicators
Evidence of adherence
and compliance with
WASH sector policies.
Adoption rates for
sustainable WASH
approaches and practices
by all sector stakeholders
and communities.
Evidence of reduction of
water borne diseases in
target communities
Number of innovative and
cost effective
technologies and their
replication.
5.2.6 Organizational Development
WAZ continues to grow in size and budget and it is anticipated that additional
resources will be mobilized to effectively implement the CS. WAZ will recruit and
retain highly skilled and experienced staff and improve its management systems,
operations and procedures to ensure effective implementation of its programme. A
skills audit is planned to ensure that the right skills set is available in the
organisation. Skills development and learning will also be promoted.
An appropriate and competitive pay structure will be prepared and proposed to
WA (UK) to ensure that well skilled staff are recruited and retained.
The strategy, objectives and indicator matrix for organizational development is
given below:
Global Aim 4: We will further develop as an effective global organisation recognised as a leader in our field and for living our values. Country Strategic Aim 5 Organizational Development WAZ will develop and grow into an effective and people-centered organisation, recognized as a leader in the watsan sector in Zambia and
Change Objective 5.1.
Highly skilled staff recruited
and retained to implement the
Country Strategy by 2013
Indicators
Existence and number of skilled WAZ staff in place. Improved abilities and skills sets to attract and retain highly skilled staff.
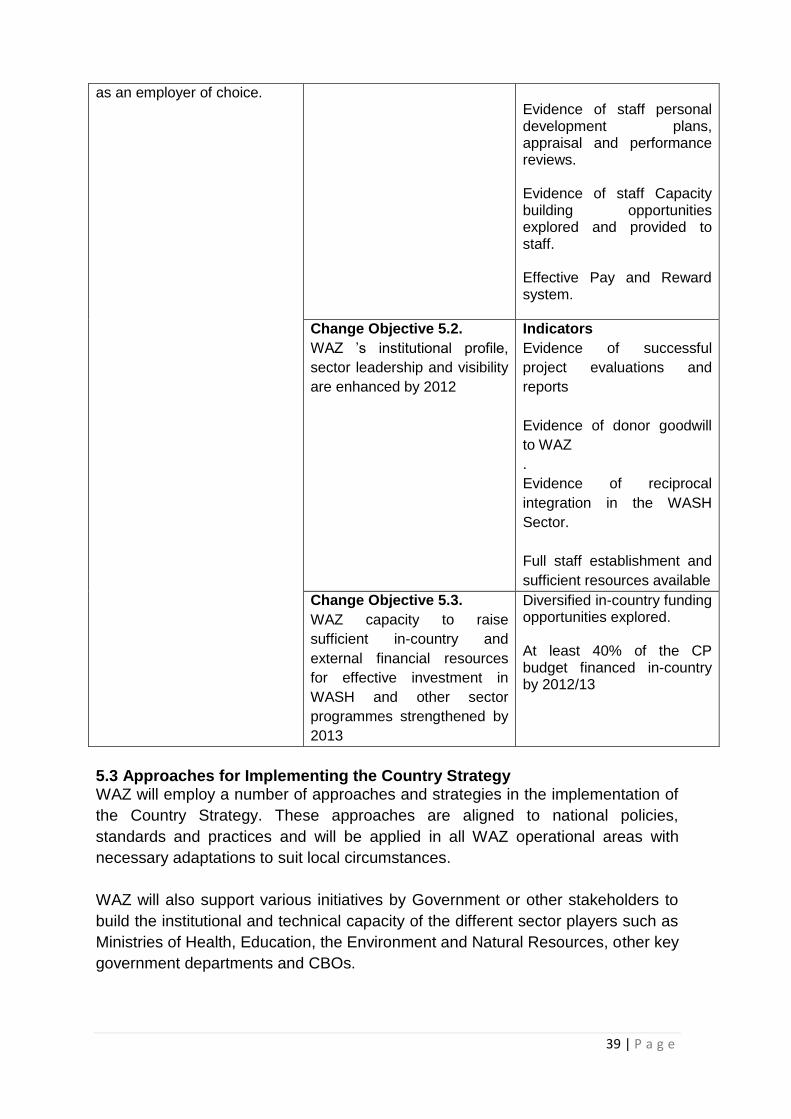
39 | P a g e
as an employer of choice.
Evidence of staff personal development plans, appraisal and performance reviews. Evidence of staff Capacity building opportunities explored and provided to staff. Effective Pay and Reward system.
Change Objective 5.2.
WAZ ‟s institutional profile,
sector leadership and visibility
are enhanced by 2012
Indicators
Evidence of successful
project evaluations and
reports
Evidence of donor goodwill
to WAZ
.
Evidence of reciprocal
integration in the WASH
Sector.
Full staff establishment and
sufficient resources available
Change Objective 5.3.
WAZ capacity to raise
sufficient in-country and
external financial resources
for effective investment in
WASH and other sector
programmes strengthened by
2013
Diversified in-country funding opportunities explored. At least 40% of the CP budget financed in-country by 2012/13
5.3 Approaches for Implementing the Country Strategy WAZ will employ a number of approaches and strategies in the implementation of
the Country Strategy. These approaches are aligned to national policies,
standards and practices and will be applied in all WAZ operational areas with
necessary adaptations to suit local circumstances.
WAZ will also support various initiatives by Government or other stakeholders to
build the institutional and technical capacity of the different sector players such as
Ministries of Health, Education, the Environment and Natural Resources, other key
government departments and CBOs.
40 | P a g e
5.3.1 Targeting Approaches
i. Ward-wide approach – WAZ will use the ward population, poverty levels,
and prevailing water and sanitation coverage rates to inform effective
planning of facilities to be provided. WAZ will use the government approved
Ward structures to identify wards in which interventions will be located.
ii. WAZ, together with its partners, will report on the number of households or
facilities provided in a Ward to fit into MLGH Information Management
System (IMS). WAZ will also embed this data into the WAZ Counting User
Protocol.
iii. Rights Based and Equity and Inclusion approaches that will particularly
include PLWA and the disabled will be rolled out to enable wider reach and
enjoyment of full WASH rights by all.
iv. WAZ will deepen its rural work and broaden peri urban and small town
projects within its operational districts.
v. Evidenced based research and analysis will be undertaken to broaden
WASH technology base.
5.3.2 Service Delivery Approaches
WAZ will continue working in the same implementation areas in Luapula, Southern
and Lusaka provinces, through the decentralized government Ward structures.
Appendix 5 shows the district demographic information on targeted districts for the
CS period 2011-2015.
Service delivery approaches to be applied will be as given below;
i. In line with national watsan policy environment, WAZ will work within the
District Plans of Local Authorities and where no such plans exist, WAZ will
support the development of these plans.;
ii. WAZ will work with Area Development Committees (ADCs) as well as the
local leadership to facilitate effective delivery of WASH services and to
provide local monitoring and community engagements.
iii. WAZ will establish long term partnership with Councils, chiefs and local
CBOs;
iv. WAZ will work through established partnerships with Local Authorities, the
private sector and NGO partners.
v. WAZ will provide support to form and reactivate dormant ADCs,
vi. WAZ will promote awareness on Integrated Water Resources Management
(IWRM) and research on Surface Water Management (SWM) as an option
for arid and ground water-starved areas, and piloting of different options
and innovations like rain water harvesting and treatment of iron, water
purification technologies etc.
vii. Awareness on Climate Change, Disaster Preparedness and Disaster Risk
Reduction will also be provided to WAZ staff, partner and communities
through facilitation by the Disaster Mitigation and Management Unit in
41 | P a g e
government and a civil society network Participatory Ecological Land Use
management (PELUM) among others.
viii. In improving access to WASH, WAZ will support and build on research on
new and emerging watsan technologies for borehole drilling and piping
networks.
ix. Various accepted models of sanitation facilities will be supported e.g.
ecological latrines, improved household latrines, VIP latrines, both for
households and schools.
x. WAZ will facilitate a national meeting for waterpoint mapping and data
reconciliation to contribute to the acceleration of the mapping process in
Zambia.
xi. Approaches such as self supply will be replicated to support rural low
density areas with low cost technology such as improved traditional Hand
dug wells and springs, in addition to upgrading of existing facilities.
5.3.3 Private Sector Participation
i. As part of the implementation process, WAZ will explore the possibilities of
private sector participation in the provision of allied WASH services and
where possible, partnerships will be developed.
ii. Supply Chain promotion and support to artisans (masons, APMs etc) will be
enhanced and strengthened.
5.3.4 Approaches for Sanitation Services
i. While recognizing Government‟s policy on removal of subsidies, WAZ will
still provide WASH services to populations who cannot afford basic
facilities.
ii. WAZ will vigorously lobby government to withdraw the provision for non
subsidy approach to ensure people enjoy their WASH rights unfettered.
This is in pursuance of WA‟s Equity and Inclusion principles. WAZ and the
NGO WASH Forum are studying the implications of this requirement and
will present its position to government.
iii. WAZ will adopt sanitation marketing to stimulate demand in view of no
subsidies approach especially in peri urban areas
iv. WAZ will link sanitation to water supply (communities to benefit from water
should have achieved 60 percent sanitation requirement).
v. WAZ will explore the possibility of including small scale solid waste
management activities for some of its urban area activities.
5.3.5 Mainstreaming approach
WAZ will fully mainstream the major cross cutting issues of HIV, Gender and Climate Change in its work as well as intensify awareness in Disaster Preparedness and Disaster Risk Reduction. Staff and all communities will be sensitized on each of these cross cutting elements and ensure their application in all WASH activities. Equity and Inclusion will also be rolled out in all WAZ operational areas.
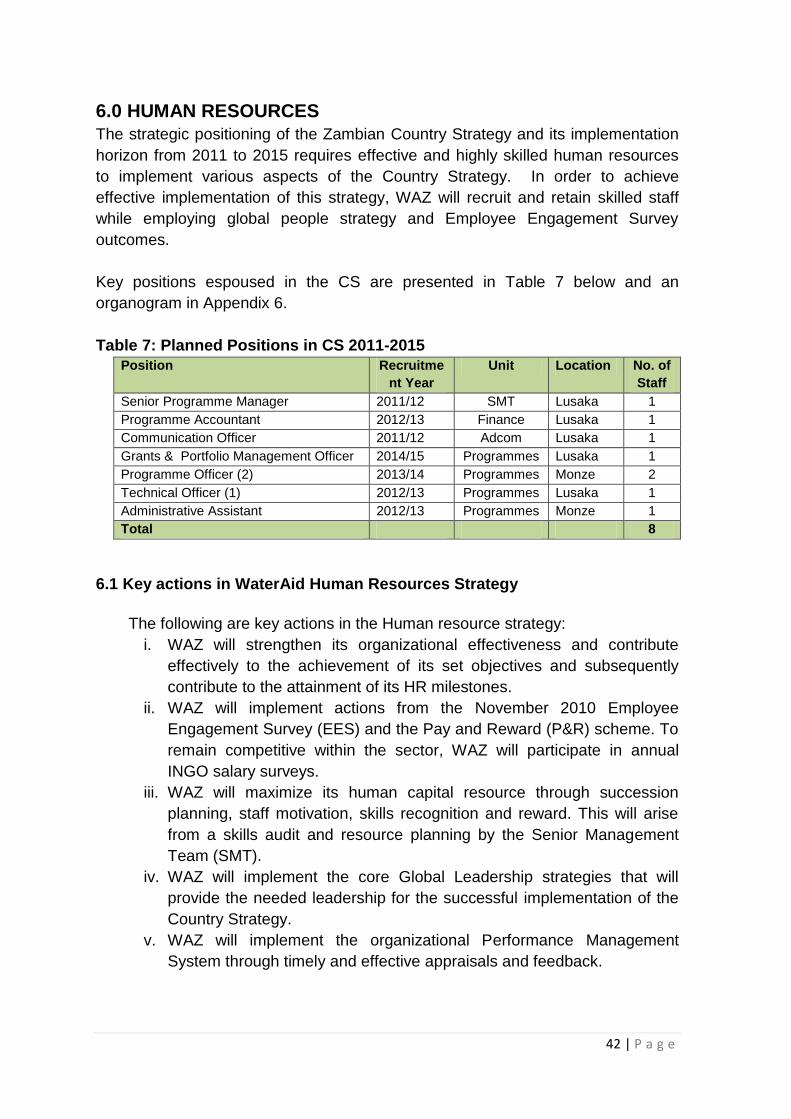
42 | P a g e
6.0 HUMAN RESOURCES
The strategic positioning of the Zambian Country Strategy and its implementation
horizon from 2011 to 2015 requires effective and highly skilled human resources
to implement various aspects of the Country Strategy. In order to achieve
effective implementation of this strategy, WAZ will recruit and retain skilled staff
while employing global people strategy and Employee Engagement Survey
outcomes.
Key positions espoused in the CS are presented in Table 7 below and an
organogram in Appendix 6.
Table 7: Planned Positions in CS 2011-2015
Position Recruitme
nt Year
Unit Location No. of
Staff
Senior Programme Manager 2011/12 SMT Lusaka 1
Programme Accountant 2012/13 Finance Lusaka 1
Communication Officer 2011/12 Adcom Lusaka 1
Grants & Portfolio Management Officer 2014/15 Programmes Lusaka 1
Programme Officer (2) 2013/14 Programmes Monze 2
Technical Officer (1) 2012/13 Programmes Lusaka 1
Administrative Assistant 2012/13 Programmes Monze 1
Total 8
6.1 Key actions in WaterAid Human Resources Strategy
The following are key actions in the Human resource strategy:
i. WAZ will strengthen its organizational effectiveness and contribute
effectively to the achievement of its set objectives and subsequently
contribute to the attainment of its HR milestones.
ii. WAZ will implement actions from the November 2010 Employee
Engagement Survey (EES) and the Pay and Reward (P&R) scheme. To
remain competitive within the sector, WAZ will participate in annual
INGO salary surveys.
iii. WAZ will maximize its human capital resource through succession
planning, staff motivation, skills recognition and reward. This will arise
from a skills audit and resource planning by the Senior Management
Team (SMT).
iv. WAZ will implement the core Global Leadership strategies that will
provide the needed leadership for the successful implementation of the
Country Strategy.
v. WAZ will implement the organizational Performance Management
System through timely and effective appraisals and feedback.

43 | P a g e
A Human Resources Plan the CP will implement in order to successfully deliver
this CS is presented in Appendix 7.
7.0 FINANCIAL RESOURCE PLANNING
This section sets out the financial resources required for the implementation of the
Zambia Country Strategy. It contains a financial projection to cover the five-year
period of funding based on the Essential, Desirable and Ambitious budget
projections that the Zambia Country Programme will require to implement the
Country Strategy. Table 8 and figure 2 below illustrate the funding projections
Table 8: Zambia Country strategy Financial projects (EDA) to 2015/16 (amounts in ZMK'million)
2010/11 2011/12 2012/13 2013/14 2014/15 2015/16 CS Total
Essential 9,306 11,167
13,401
15,545 18,032
20,918 79,063
Growth %
20 20 16 16 20
Desirable 9,306 13,029
14,722
16,931 19,555
22,684 86,921
Growth %
37 13 15 15 15
Ambitious 9,306 16,286
18,729
21,538 24,769
28,484 109,806
Growth %
30 15 15 15 15
Fig 2: Expected annual growth
Under the Essential Budget projection, the CP needs to grow by 20 percent of the
2010/11 original budget in year 1 and 2 before steadying to 16 percent per year in
the third, fourth and fifth year. At this budget level, the CP will deepen and expand
its work in the current districts and grow its small towns and urban work alongside
its influencing work.

44 | P a g e
Under the Desirable Budget projection, the CP desires to grow by 40 percent of
the 2010/11Original Essential budget in year one and 13 percent of CS year one
desirable budget in year two, 15 percent in year three before steadying at 16
percent in fourth and fifth year. The Desirable budget will enable the CP to
increase its visibility and impact in the country and hence become more influential
in the WASH sector in Zambia. At this budget level, the CP intends to grow within
the provinces opening work in one new district in Luapula Province and another
district in Southern province while deepening our work in the current districts
(except Monze) in order to meet the local MDGs for water and sanitation.
Under the Ambitious Budget projection, the CP‟s plan is to grow by 75 percent of
the 2010/11 original essential budget in year one and then steady at 15percent
per year from the second to the fifth. At this budget level, the CP will become more
notable and influential in the WASH sector in Zambia, operating in more and
challenging geographical areas in Zambia thereby generating more learning and
good practices for influencing work. WAZ will work closely with WAUK Fundraising
teams to improve and strengthen its funding mix from the current 20 percent
revised 2010/11 budget) to 40% contracted funds. This will ensure a stable and
predictable cash flow. We will seek to develop strong fundraising and contract
management skills to improve our fundraising success rate and effective
management of donor funds. Table 9 and Figures 3 and 4 illustrate a progressive
growth in the number of people reached with safe water and adequate hygiene
and sanitation services between 2011 and 2015.
Table 9 Projected Numbers of People to be Reached
2010/11 2011/12 2012/13 2013/14 2014/15 2015/16 Total
E Water 30150 41040 49248 57128 66268 76872 290556
Sanitation 42100 53352 64022 74266 86148 99934 377722
D Water 30150 47880 54105 62220 71865 83363 319433
Sanitation 42100 67032 75747 87108 100611 116708 447206
A Water 30150 59850 68828 79152 91025 104679 403534
Sanitation 42100 89775 103242 118728 136538 157019 605302

45 | P a g e
Fig 3 User projections - Water
Fig 4: User projections - Sanitation
020406080
100120140160180
USE
R N
UM
BER
(00
0s)
Financial Year
SANITATION USERS PROJECTED GROWTH
E
D
A
8.0 RISK ANALYSIS
The risks assessment in the Appendix 8a outlines key risks and mitigation
measures grouped in seven areas namely political, environmental, social/cultural,
technological, economic, legal and sectoral.
To mitigate political risks, WAZ will improve CSO and Government relationship
and align its programme to Government WASH policy and programmes.
Considering certain cultural contradicts, WAZ will engage and work with
communities at all levels to provide acceptable, good quality and sustainable
services. Technological and environmental challenges relating to functionality and
sustainability of WASH services will be mitigated by encouraging community
46 | P a g e
ownership, expanding research and development, embarking on documentation
and learning. Fluctuation of the Zambian currency and inflation rates will be
monitored and factored into the planning process throughout the period of this CS.
WAZ will prioritise improved partner monitoring and support to enhance
coordination and collaboration by partners and key stakeholders in the sector.
On the political front WAZ will keep abreast of political events before, during and
after the presidential and general elections in late 2011. WAZ is hopeful that no
political events will disrupt its programmes while being mindful of the possibility of
a number of political changes that might ensue if a new regime is elected. The
Risk matrix is given in Appendix 8.
47 | P a g e
9.0 PLANNING MONITORING AND EVALUATION FRAMEWORK
The monitoring process adopted by WAZ will comprise a regular internal field monitoring plan that will be managed by programme teams in WAZ. An external Mid-Term review and evaluation to assess and evaluate progress of the strategy will be undertaken with support from Programme Effectiveness unit in UK. Regular reports like the annual and six-monthly reports, among others will be submitted. Prior to implementation of projects, baseline studies will report the status of WASH and socio-economic dynamics will be done, while knowledge, attitude and practice surveys will be used to measure communities‟ acceptance of the planned WASH interventions and their ability to foster good practices. The Effectiveness and efficiency of programme and projects will be monitored through programme and/or project performance reviews. Other monitoring tools to be employed will be water point mapping, PME frameworks and the WAZ User Protocols. The M&E matrix for the CS is shown in Appendix 9.
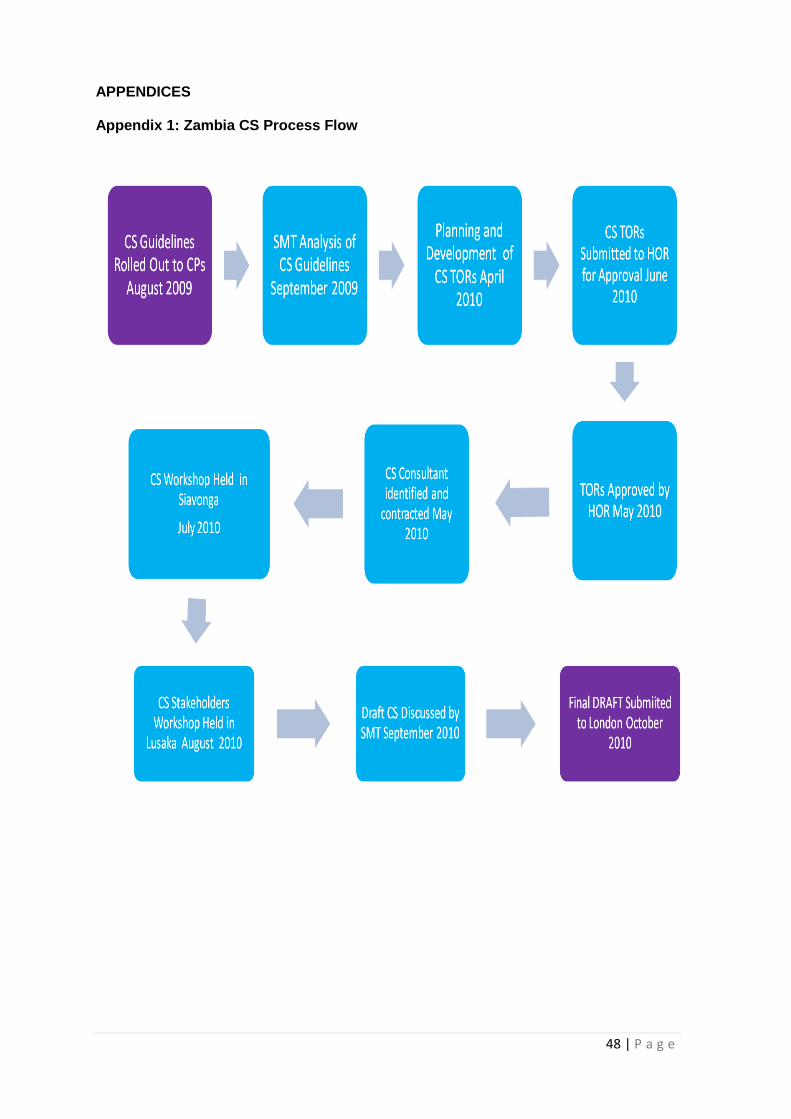
48 | P a g e
APPENDICES Appendix 1: Zambia CS Process Flow
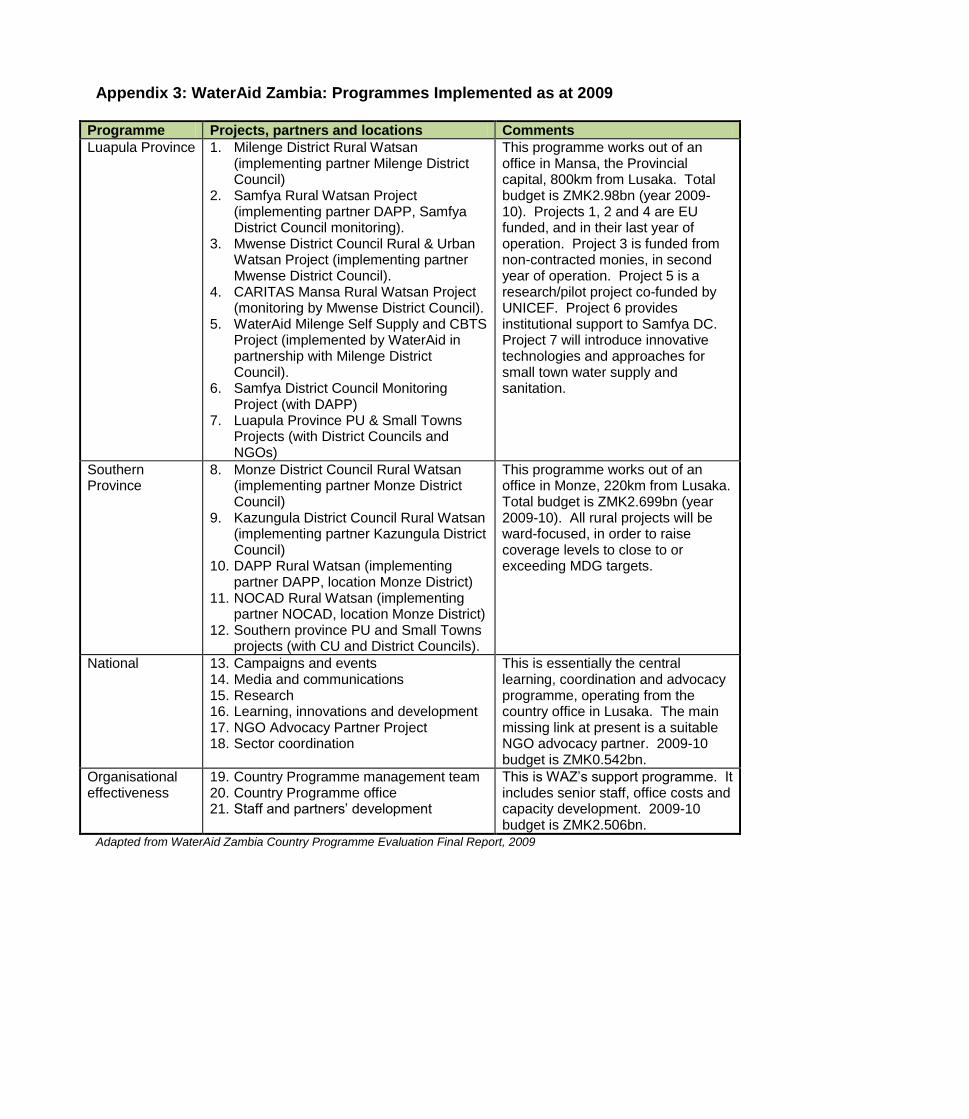
Appendix 3: WaterAid Zambia: Programmes Implemented as at 2009
Programme Projects, partners and locations Comments
Luapula Province 1. Milenge District Rural Watsan (implementing partner Milenge District Council)
2. Samfya Rural Watsan Project (implementing partner DAPP, Samfya District Council monitoring).
3. Mwense District Council Rural & Urban Watsan Project (implementing partner Mwense District Council).
4. CARITAS Mansa Rural Watsan Project (monitoring by Mwense District Council).
5. WaterAid Milenge Self Supply and CBTS Project (implemented by WaterAid in partnership with Milenge District Council).
6. Samfya District Council Monitoring Project (with DAPP)
7. Luapula Province PU & Small Towns Projects (with District Councils and NGOs)
This programme works out of an office in Mansa, the Provincial capital, 800km from Lusaka. Total budget is ZMK2.98bn (year 2009-10). Projects 1, 2 and 4 are EU funded, and in their last year of operation. Project 3 is funded from non-contracted monies, in second year of operation. Project 5 is a research/pilot project co-funded by UNICEF. Project 6 provides institutional support to Samfya DC. Project 7 will introduce innovative technologies and approaches for small town water supply and sanitation.
Southern Province
8. Monze District Council Rural Watsan (implementing partner Monze District Council)
9. Kazungula District Council Rural Watsan (implementing partner Kazungula District Council)
10. DAPP Rural Watsan (implementing partner DAPP, location Monze District)
11. NOCAD Rural Watsan (implementing partner NOCAD, location Monze District)
12. Southern province PU and Small Towns projects (with CU and District Councils).
This programme works out of an office in Monze, 220km from Lusaka. Total budget is ZMK2.699bn (year 2009-10). All rural projects will be ward-focused, in order to raise coverage levels to close to or exceeding MDG targets.
National 13. Campaigns and events 14. Media and communications 15. Research 16. Learning, innovations and development 17. NGO Advocacy Partner Project 18. Sector coordination
This is essentially the central learning, coordination and advocacy programme, operating from the country office in Lusaka. The main missing link at present is a suitable NGO advocacy partner. 2009-10 budget is ZMK0.542bn.
Organisational effectiveness
19. Country Programme management team 20. Country Programme office 21. Staff and partners‟ development
This is WAZ‟s support programme. It includes senior staff, office costs and capacity development. 2009-10 budget is ZMK2.506bn.
Adapted from WaterAid Zambia Country Programme Evaluation Final Report, 2009

50 | P a g e
Appendix 4: Various Policy Instruments and Events 1964-2010
Date Event
1964-1972
The Emergence Plan (1964 – 65) The Transitional Plan (1965 – 1966 First National Development Plan (1966- 1970); The Second National Development Plan (1972 – 1976)
1972 Change to One Party State
1974 Ministerial Policy Statement on “Construction, Maintenance and Operation of Public Water Supplies”
1979 The Third National Development Plan (1979 – 1983)
1987 The Interim National Development Plan (1987 – 88)
1988 First Water Commercial Utility formed
1989 The Fourth National Development Plan (1989-93)
Poverty Reduction Strategy Papers
1991 Change to Multiparty Democracy
1991 Review of International Drinking Water Supply and Sanitation
1993 Cabinet appoints water & sanitation Programme Coordination Unit (PCU)
1994 Cabinet adopts National Water Policy
1994 Sector Strategy for Institutional Legal Framework for WSS services
1995 Water Resources Master Plan Formulated
1996 National Water Sanitation & Health Education Committee established
1997 National Water & Sanitation Act passed
2000 District WASHE Committees established in 62 Districts NWASCO becomes operational
2001 Devolution Trust Fund Becomes operational
2002 Decentralization Policy commences
2003 Rural Water Supply & Sanitation Unit established at MLGH
2006 Fifth National Development Plan
2007 First WSS Sector Joint Review
National Rural Water Supply & Sanitation Programme launched
2009 Sanitation and Hygiene Component of NRWSSP finalized
2009 Joint GRZ/CP Water Sector Review
2010 Revised National Water Policy
2010 Water Act enacted

51 | P a g e
Appendix 5: Overview of the five Strategy Components for the 2011 – 2015 CSP
C. Sector Financing 1. Mobilise additional WAZ
resources for sector activities
2. Advocate for increased budget allocation to the sector,
3. Conduct budget and expenditure tracking and reporting
4. Undertake regular Public Expenditure Reviews
5. Promote transparency and
accountability in the use of
resources
E.Organisational development 1. Staff Recruitment and retention 2. Growth and management of
growth 3. Systems development (PME,
R&D, IT) 4. Learning and knowledge
management 5. Resource Mobilisation 6. Ethics 7. Communication 8. People Management 9. Relationship Management 10. Risk Management
B. Sector Capacity Development 1. Partner support and
development 2. Support to the Decentralisation
process 3. Strengthen data management
especially at district level 4. Support sector coordination
efforts 5. Ensure policy harmonisation
and coherence
D. Influencing work 1. Conduct Advocacy and
facilitate strategic networking
2. Strengthen Knowledge Management
3. Utilise Media and communication in the implementation of WAZ activities
4. Lobbying and Campaigning
5. Policy Research 6. Facilitate and support
innovations in WASH activities
A. Service delivery 1. Employ a Rights Based
Approach in provision of services
2. Promote Equity and inclusion 3. Develop mechanisms and
approaches that promote functionality and sustainability
4. Conduct and promote technological research to improve quality of facilities
5. Support Innovations
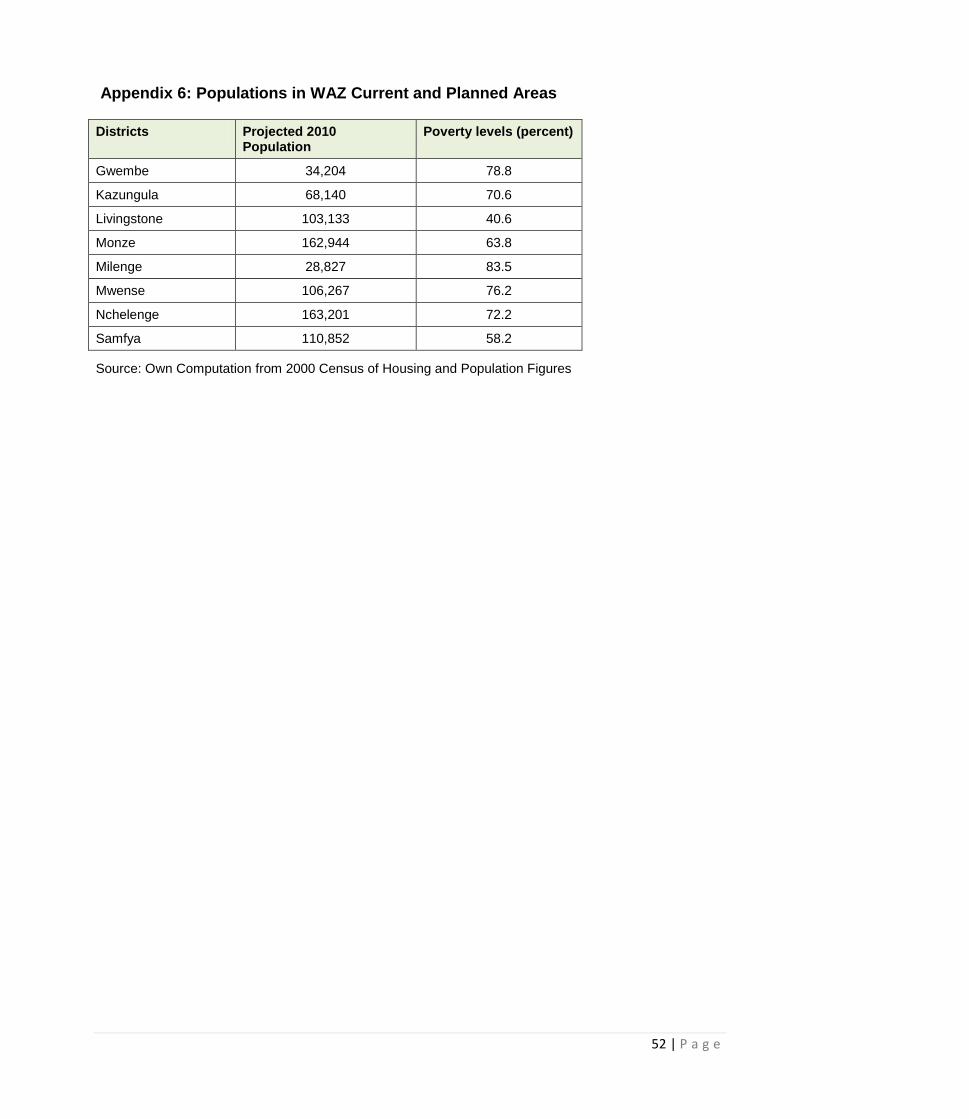
52 | P a g e
Appendix 6: Populations in WAZ Current and Planned Areas
Districts Projected 2010 Population
Poverty levels (percent)
Gwembe 34,204 78.8
Kazungula 68,140 70.6
Livingstone 103,133 40.6
Monze 162,944 63.8
Milenge 28,827 83.5
Mwense 106,267 76.2
Nchelenge 163,201 72.2
Samfya 110,852 58.2
Source: Own Computation from 2000 Census of Housing and Population Figures

53 | P a g e
Appendix 7: WAZ Organogram (existing and planned positions) Legend Existing green Existing, re-aligned black Planned blue
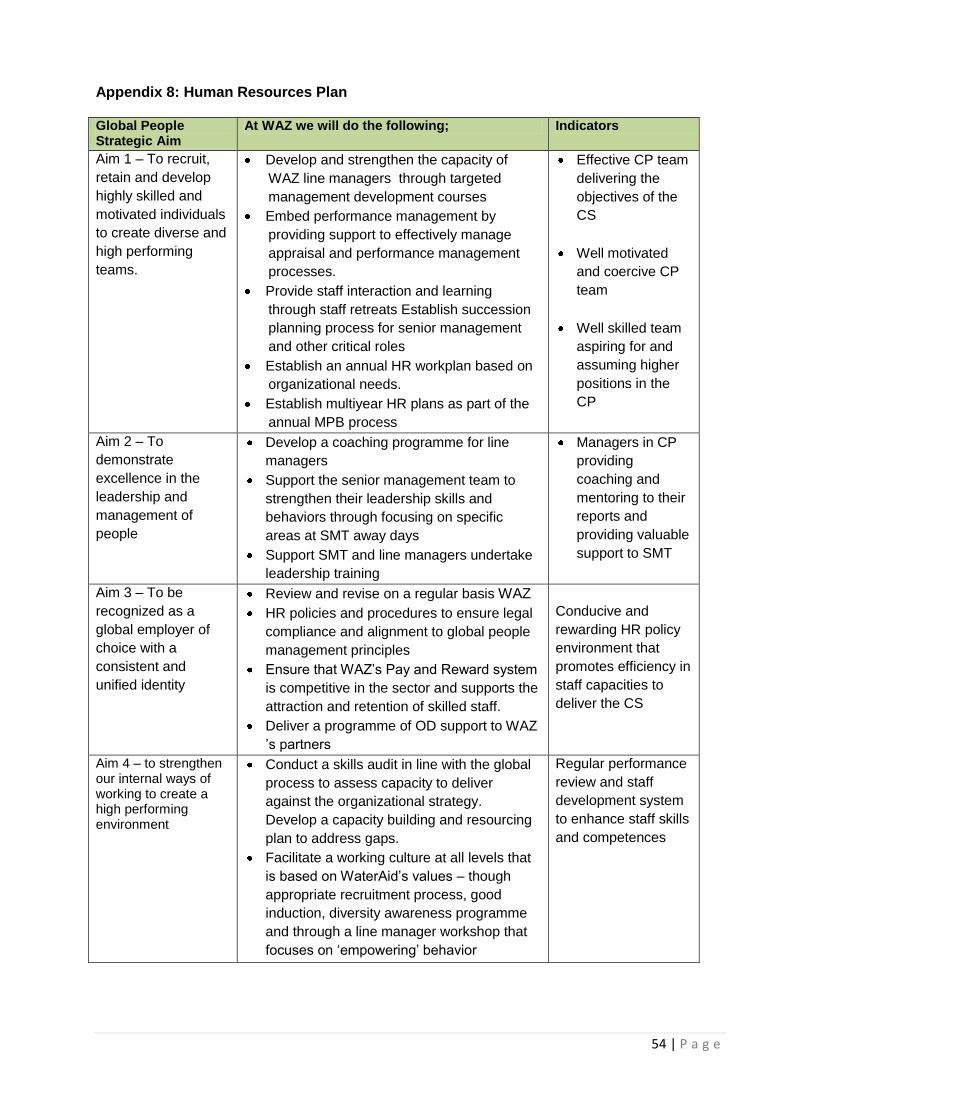
54 | P a g e
Appendix 8: Human Resources Plan Global People Strategic Aim
At WAZ we will do the following; Indicators
Aim 1 – To recruit,
retain and develop
highly skilled and
motivated individuals
to create diverse and
high performing
teams.
Develop and strengthen the capacity of
WAZ line managers through targeted
management development courses
Embed performance management by
providing support to effectively manage
appraisal and performance management
processes.
Provide staff interaction and learning
through staff retreats Establish succession
planning process for senior management
and other critical roles
Establish an annual HR workplan based on
organizational needs.
Establish multiyear HR plans as part of the
annual MPB process
Effective CP team
delivering the
objectives of the
CS
Well motivated
and coercive CP
team
Well skilled team
aspiring for and
assuming higher
positions in the
CP
Aim 2 – To
demonstrate
excellence in the
leadership and
management of
people
Develop a coaching programme for line
managers
Support the senior management team to
strengthen their leadership skills and
behaviors through focusing on specific
areas at SMT away days
Support SMT and line managers undertake
leadership training
Managers in CP
providing
coaching and
mentoring to their
reports and
providing valuable
support to SMT
Aim 3 – To be
recognized as a
global employer of
choice with a
consistent and
unified identity
Review and revise on a regular basis WAZ
HR policies and procedures to ensure legal
compliance and alignment to global people
management principles
Ensure that WAZ‟s Pay and Reward system
is competitive in the sector and supports the
attraction and retention of skilled staff.
Deliver a programme of OD support to WAZ
‟s partners
Conducive and
rewarding HR policy
environment that
promotes efficiency in
staff capacities to
deliver the CS
Aim 4 – to strengthen our internal ways of working to create a high performing environment
Conduct a skills audit in line with the global
process to assess capacity to deliver
against the organizational strategy.
Develop a capacity building and resourcing
plan to address gaps.
Facilitate a working culture at all levels that
is based on WaterAid‟s values – though
appropriate recruitment process, good
induction, diversity awareness programme
and through a line manager workshop that
focuses on „empowering‟ behavior
Regular performance
review and staff
development system
to enhance staff skills
and competences
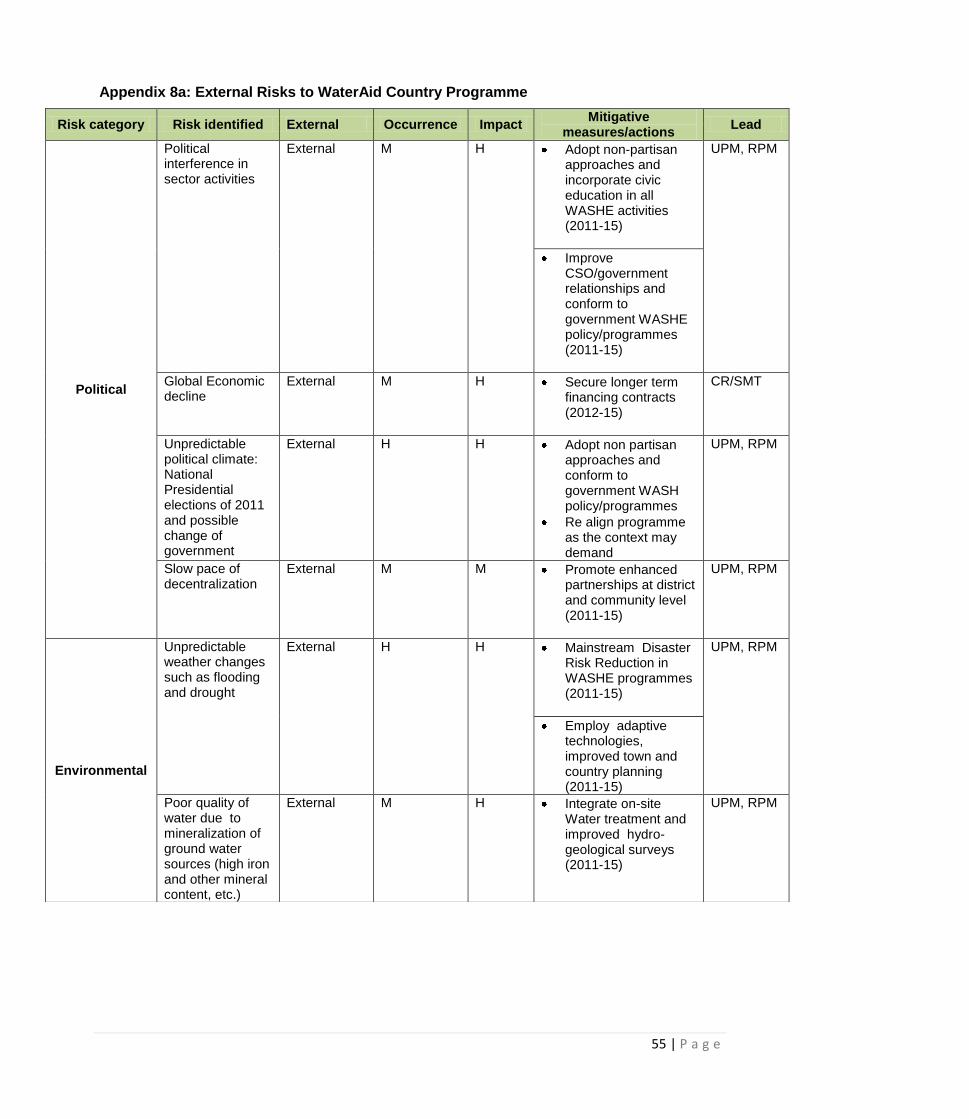
55 | P a g e
Appendix 8a: External Risks to WaterAid Country Programme
Risk category Risk identified External Occurrence Impact Mitigative
measures/actions Lead
Political
Political interference in sector activities
External M H Adopt non-partisan approaches and incorporate civic education in all WASHE activities (2011-15)
UPM, RPM
Improve CSO/government relationships and conform to government WASHE policy/programmes (2011-15)
Global Economic decline
External M H Secure longer term financing contracts (2012-15)
CR/SMT
Unpredictable political climate: National Presidential elections of 2011 and possible change of government
External H H Adopt non partisan approaches and conform to government WASH policy/programmes
Re align programme as the context may demand
UPM, RPM
Slow pace of decentralization
External M M Promote enhanced partnerships at district and community level (2011-15)
UPM, RPM
Environmental
Unpredictable weather changes such as flooding and drought
External H H Mainstream Disaster Risk Reduction in WASHE programmes (2011-15)
UPM, RPM
Employ adaptive technologies, improved town and country planning (2011-15)
Poor quality of water due to mineralization of ground water sources (high iron and other mineral content, etc.)
External M H Integrate on-site Water treatment and improved hydro-geological surveys (2011-15)
UPM, RPM

56 | P a g e
Risk category Risk identified External Occurrence Impact Mitigative
measures/actions Lead
Social/Cultural
Cultural practices contradict good sanitation provision
External L M
Sensitization and civic education of communities, enhanced Watsan facilitation
PMs
Poor infrastructure and accessibility
External H H Advocacy for an equitable and improved application of national resources (e.g. CDF, WDF-urban)
AdComM
Seasonal migrations abandoning WASH infrastructure
External L M Sensitization of communities to localise and diversify income generating activities
RPM,
Low private sector investment in supply and delivery of WASHE services and technologies e.g. drilling, spares, sanitation, hygiene
External M M
Lobby for sector incentives to promote better PPP engagements
CR/SMT
Advocate for duty free status for all watsan hardware imports
Introduction and use of non-community based technologies in WASHE programme
External L M
More research in appropriate technologies and advocate to adopt appropriate technologies
UPM
Economic
Significant currency fluctuations
External M M
Adjust programme plans to meet economic needs
CR/SMT Conduct regular financial monitoring and make timely adjustments to plans in order not to suffer either
Drastic price increases of fuel and materials
External H H
Timely planning and budgeting and centralised procurement of project goods and forward contracting (Every year)
FAM/SMT
Inadequate sector financing and investment in WASHE programmes
External / Internal
H H
Advocacy and influencing for increased sector funding
Enhanced partner support
CR/SMT
Risk identified External Occurrence Impact Mitigative
measures/actions Lead
Mismanagement
External M M Regular PER (Public
Expenditure CR/SMT
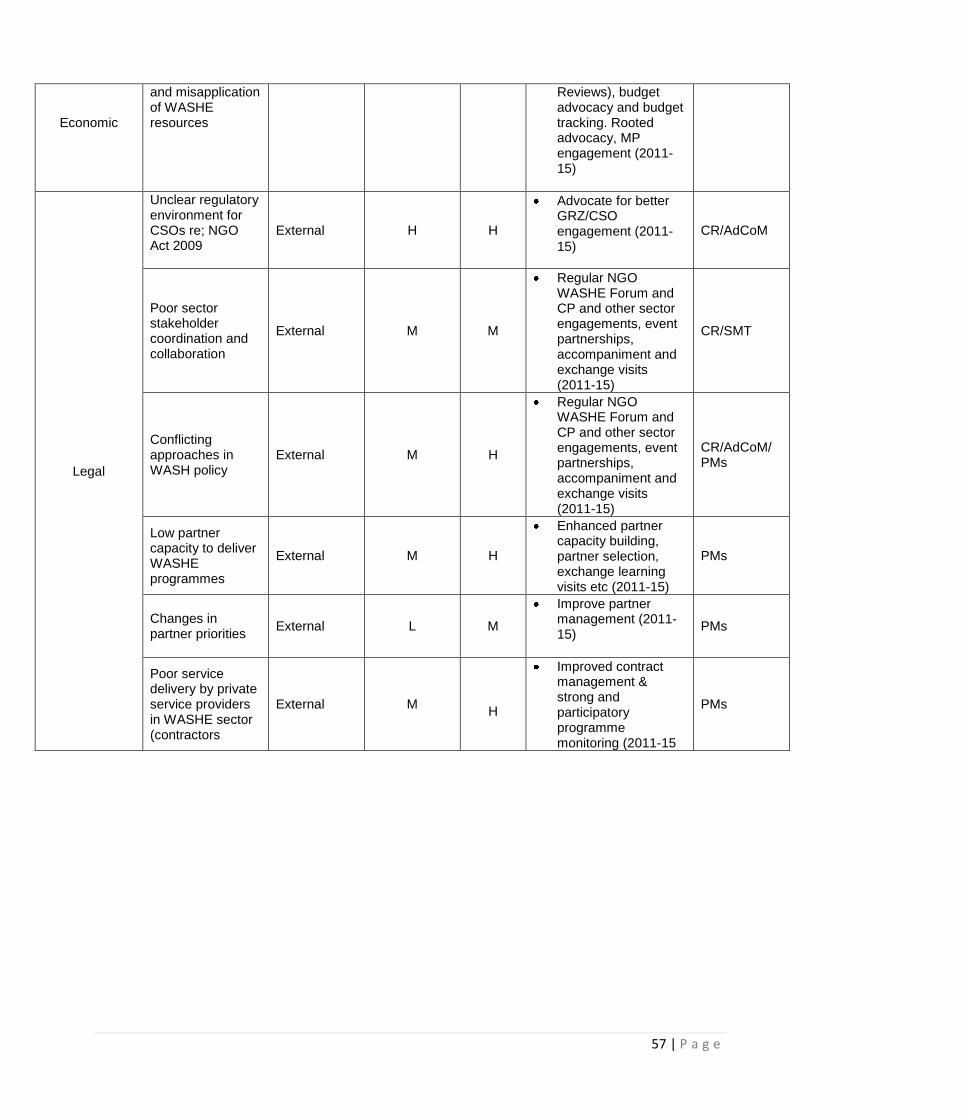
57 | P a g e
Economic
and misapplication of WASHE resources
Reviews), budget advocacy and budget tracking. Rooted advocacy, MP engagement (2011-15)
Legal
Unclear regulatory environment for CSOs re; NGO Act 2009
External H H
Advocate for better GRZ/CSO engagement (2011-15)
CR/AdCoM
Poor sector stakeholder coordination and collaboration
External M M
Regular NGO WASHE Forum and CP and other sector engagements, event partnerships, accompaniment and exchange visits (2011-15)
CR/SMT
Conflicting approaches in WASH policy
External M H
Regular NGO WASHE Forum and CP and other sector engagements, event partnerships, accompaniment and exchange visits (2011-15)
CR/AdCoM/ PMs
Low partner capacity to deliver WASHE programmes
External M H
Enhanced partner capacity building, partner selection, exchange learning visits etc (2011-15)
PMs
Changes in partner priorities
External L M
Improve partner management (2011-15)
PMs
Poor service delivery by private service providers in WASHE sector (contractors
External M
H
Improved contract management & strong and participatory programme monitoring (2011-15
PMs
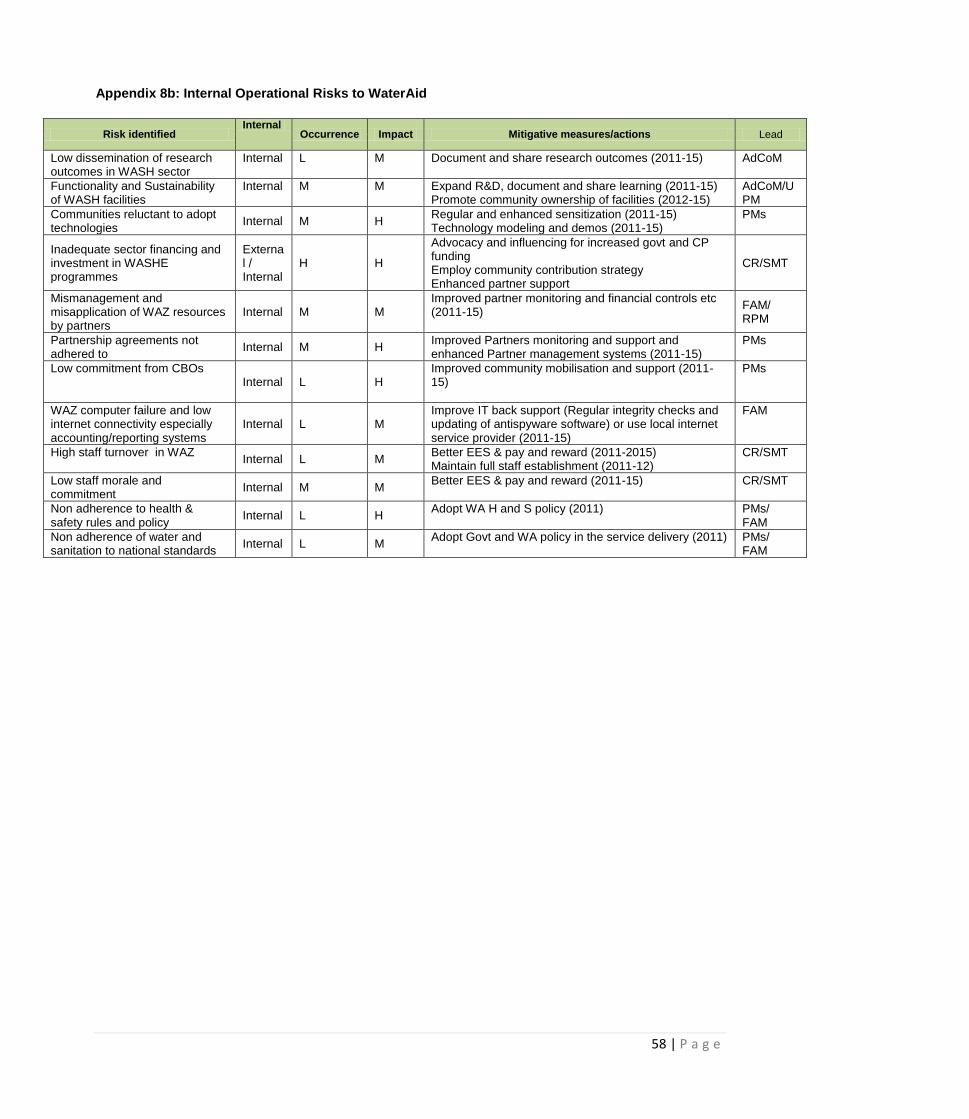
58 | P a g e
Appendix 8b: Internal Operational Risks to WaterAid
Risk identified Internal
Occurrence Impact Mitigative measures/actions Lead
Low dissemination of research outcomes in WASH sector
Internal L M Document and share research outcomes (2011-15) AdCoM
Functionality and Sustainability of WASH facilities
Internal M M Expand R&D, document and share learning (2011-15) Promote community ownership of facilities (2012-15)
AdCoM/UPM
Communities reluctant to adopt technologies
Internal M H Regular and enhanced sensitization (2011-15) Technology modeling and demos (2011-15)
PMs
Inadequate sector financing and investment in WASHE programmes
External / Internal
H H
Advocacy and influencing for increased govt and CP funding Employ community contribution strategy Enhanced partner support
CR/SMT
Mismanagement and misapplication of WAZ resources by partners
Internal M M Improved partner monitoring and financial controls etc (2011-15)
FAM/ RPM
Partnership agreements not adhered to
Internal M H Improved Partners monitoring and support and enhanced Partner management systems (2011-15)
PMs
Low commitment from CBOs Internal L H
Improved community mobilisation and support (2011-15)
PMs
WAZ computer failure and low internet connectivity especially accounting/reporting systems
Internal L M Improve IT back support (Regular integrity checks and updating of antispyware software) or use local internet service provider (2011-15)
FAM
High staff turnover in WAZ Internal L M
Better EES & pay and reward (2011-2015) Maintain full staff establishment (2011-12)
CR/SMT
Low staff morale and commitment
Internal M M Better EES & pay and reward (2011-15) CR/SMT
Non adherence to health & safety rules and policy
Internal L H Adopt WA H and S policy (2011) PMs/
FAM
Non adherence of water and sanitation to national standards
Internal L M Adopt Govt and WA policy in the service delivery (2011) PMs/
FAM
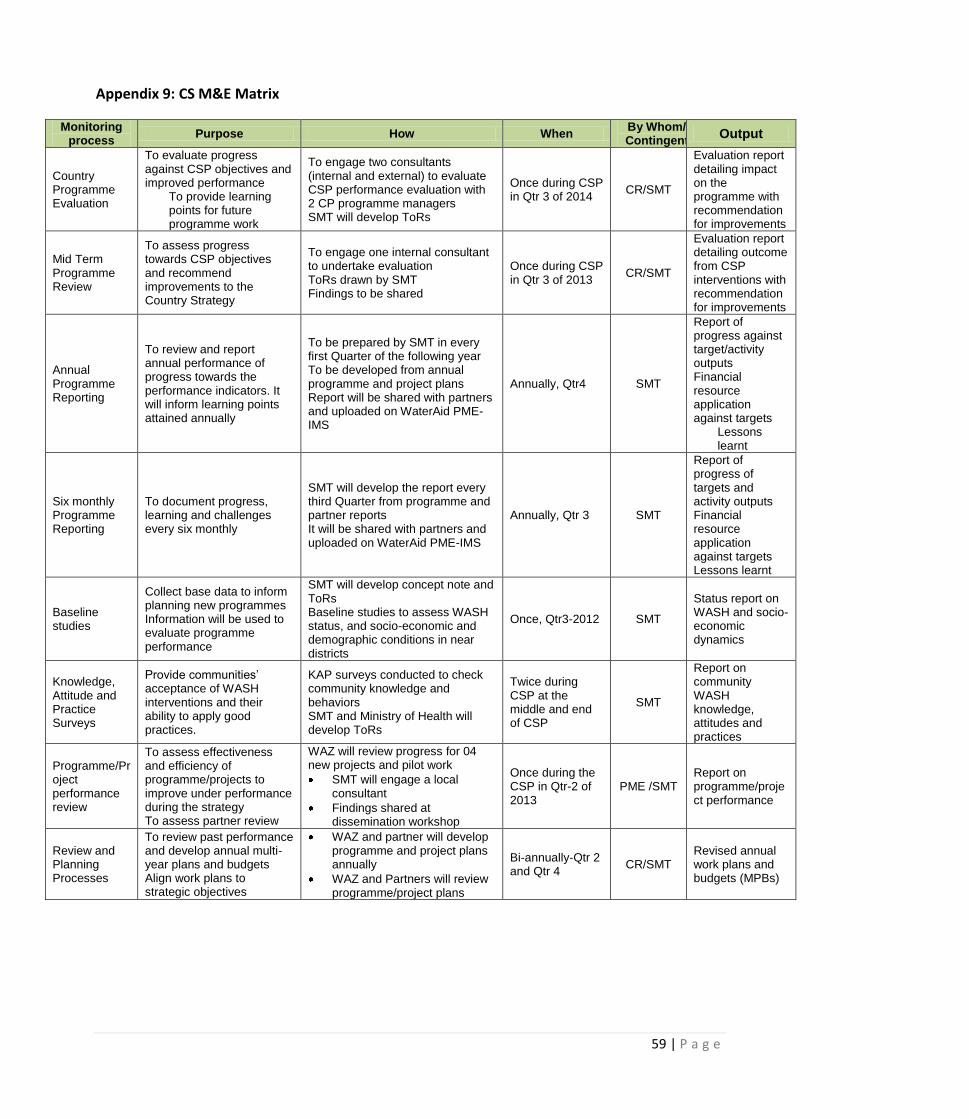
59 | P a g e
Appendix 9: CS M&E Matrix
Monitoring process
Purpose How When By Whom/ Contingent
Output
Country Programme Evaluation
To evaluate progress against CSP objectives and improved performance
To provide learning points for future programme work
To engage two consultants (internal and external) to evaluate CSP performance evaluation with 2 CP programme managers SMT will develop ToRs
Once during CSP in Qtr 3 of 2014
CR/SMT
Evaluation report detailing impact on the programme with recommendation for improvements
Mid Term Programme Review
To assess progress towards CSP objectives and recommend improvements to the Country Strategy
To engage one internal consultant to undertake evaluation ToRs drawn by SMT Findings to be shared
Once during CSP in Qtr 3 of 2013
CR/SMT
Evaluation report detailing outcome from CSP interventions with recommendation for improvements
Annual Programme Reporting
To review and report annual performance of progress towards the performance indicators. It will inform learning points attained annually
To be prepared by SMT in every first Quarter of the following year To be developed from annual programme and project plans Report will be shared with partners and uploaded on WaterAid PME-IMS
Annually, Qtr4 SMT
Report of progress against target/activity outputs Financial resource application against targets
Lessons learnt
Six monthly Programme Reporting
To document progress, learning and challenges every six monthly
SMT will develop the report every third Quarter from programme and partner reports It will be shared with partners and uploaded on WaterAid PME-IMS
Annually, Qtr 3 SMT
Report of progress of targets and activity outputs Financial resource application against targets Lessons learnt
Baseline studies
Collect base data to inform planning new programmes Information will be used to evaluate programme performance
SMT will develop concept note and ToRs Baseline studies to assess WASH status, and socio-economic and demographic conditions in near districts
Once, Qtr3-2012 SMT
Status report on WASH and socio-economic dynamics
Knowledge, Attitude and Practice Surveys
Provide communities‟ acceptance of WASH interventions and their ability to apply good practices.
KAP surveys conducted to check community knowledge and behaviors SMT and Ministry of Health will develop ToRs
Twice during CSP at the middle and end of CSP
SMT
Report on community WASH knowledge, attitudes and practices
Programme/Project performance review
To assess effectiveness and efficiency of programme/projects to improve under performance during the strategy To assess partner review
WAZ will review progress for 04 new projects and pilot work
SMT will engage a local consultant
Findings shared at dissemination workshop
Once during the CSP in Qtr-2 of 2013
PME /SMT Report on programme/project performance
Review and Planning Processes
To review past performance and develop annual multi-year plans and budgets Align work plans to strategic objectives
WAZ and partner will develop programme and project plans annually
WAZ and Partners will review programme/project plans
Bi-annually-Qtr 2 and Qtr 4
CR/SMT Revised annual work plans and budgets (MPBs)