Z Swiss Re Investors, Inc. Z Using DFA to Allocate Capital: Extending the Traditional Approach Dan...
55
Z Swiss Re Investors, Inc. Z Using DFA to Allocate Capital: Extending the Traditional Approach Dan Isaac & Stephen Philbrick 2000 Casualty Loss Reserve Seminar: September 19, 2000
-
Upload
merryl-griffin -
Category
Documents
-
view
218 -
download
0
Transcript of Z Swiss Re Investors, Inc. Z Using DFA to Allocate Capital: Extending the Traditional Approach Dan...

Z
Swiss Re Investors, Inc.
ZUsing DFA to Allocate Capital:
Extending the Traditional ApproachDan Isaac & Stephen Philbrick
2000 Casualty Loss Reserve Seminar:September 19, 2000

Z2
Note to CLRS Participants
Some changes have been made to this presentation subsequent to the CLRS on September 19.
Additional informational slides has been added to both supplement the original presented output and to improve the overall flow.
There have been no substantive changes to the conclusions.
Also, please review the notes attached to some of the slides to achieve a fuller understanding of that particular slide.

Z3
Agenda
Introduction to Capital Allocation
Introduction to DFA Introduction to CUFFS, a sample Insurance Company Extending Traditional Capital Allocation Approaches using
DFA Shapley Illustration Conclusions
Why is Capital Allocated Controversies Metrics and Issues Associated with the Metrics Traditional Capital Allocation Approach

Z4
Capital
Capital Allocation vs. Capital Adequacy
This presentation only address issues relating to Capital Allocations

Z5
Introduction to Capital AllocationIntroduction to Capital Allocation

Z6
Why Allocate Capital?
“The underlying economic point of view taken is that of a reinsurer considering a new contract. The reinsurer has committed surplus to support the variability of his existing book; the new contract will require additional surplus to support its variability.” (Kreps, Reinsurer Risk Loads from Marginal Surplus Requirements)

Z7
Why Allocate Capital?
• to compare managerial performance across business units
• to provide a risk indicator for regulators and other stakeholders
• and to develop a common basis for major decisions, including investment and underwriting strategies, and setting the corporate structure
Capital allocation serves three primary purposes:
(Mulvey, Belfatti and Madsen, Integrated Financial Risk Management: Capital Allocation Issues 1999)

Z8
Capital Allocation is Controversial
“In this paper we have demonstrated that meaningful allocation is a mathematical impossibility…” (Bass & Khury, 1992 Discussion Papers on Insurer Financial Solvency)
“A policy written with a monoline automobile insurance company with $100 million of surplus is not as well protected as a policy written with a large multiline insurance company with $100 million allocated to its automobile line of business”(Charles McClenahan, as quoted by Glenn Meyers, Contingencies, September/October 2000)
“I agree with Chuck’s statement.” Glenn Meyers

Z9
Yet Even the Detractors Note:
“In other words, surplus allocation may be useful as a management tool to help improve the overall return on equity that is of interest to investor-owners…” (Bass & Khury, 1992 Discussion Papers on Insurer Financial Solvency)
“But I also agree with the idea of using capital allocation as an internal management tool…” (Glenn Meyers, Contingencies, September/October 2000)

Z10
Limits of Use
“Furthermore, even greater care must be taken to make sure that such attempts, aimed at the internal management of the enterprise, are not inadvertently extended beyond its natural limited application, to the arena of rate regulation as the sole measure of the soundness of rates.” (Bass & Khury, 1992 Discussion Papers on Insurer Financial Solvency)

Z11
METRICS:
• Statutory Surplus
• Economic Value
• RBC Ratio etc.
• Probability of Ruin (Value at Risk)
• Variance
• Standard Deviation
• Semi-Variance
• Shortfall Measures (Expected Policyholder Deficit, Tail Value at Risk)
Sample Metrics & Allocation Methods
ALLOCATION METHODS:• First-In Marginal Contribution (Standalone)
• Last-In Marginal Contribution (Marginal)
• Shapley Values
Combine Risk Variable and Risk Function• RISK VARIABLE:
• RISK FUNCTION:

Z12
Application of Metrics Issues
Additivity Parameter Risk/Process Risk (CAPM)
Scope
Time Frame Liability versus Assets
Symmetry Not All Failures Are Created Equal

Z13
Traditional Approach to Capital Allocation
No Existing Reserves
One Year of New Business
No Asset Risk
Full Recognition of Ultimate Results at the End of the Year

Z14
Possible Extensions Using DFA
Existing Reserves:
Include existing reserves in addition to one year of new business in capital allocation process
Existing Reserves:
Include existing reserves in addition to one year of new business in capital allocation process
Multiple Years of New
Business:
Allow multiple years of new business to
be written instead of one year of new
business
Multiple Years of New
Business:
Allow multiple years of new business to
be written instead of one year of new
business
Asset Returns:
Allow for volatile asset returns, and allocate capital to
assets
Asset Returns:
Allow for volatile asset returns, and allocate capital to
assets

Introduction to DFAIntroduction to DFA
Z

Z16
Introduction to DFA
Dynamic: Reflects the year-to-year variability and interaction of measurable financial risks.
Financial: Projects 1000 or more sets of probabilistic financial statements (GAAP, Statutory, Economic).
Analysis: Allows a thorough assessment of both risk and reward, thereby aiding in the evaluation and identification of opportunities to improve expected financial results and/or reduce financial variability.

Z17
Introduction to DFA
Optimization & Valuation
• Financial Statements- Economic- GAAP- Statutory
• Financial Strategies• Define Strategic Asset Allocation
TMFIRMCashflow
Statements
Income
Statements
Balance
Sheets
Combining the asset and liability simulations and their interactions creates a robust set of a thousand or more prospective year-by-year financial statements to enhance decision-making.
Economic& Asset
Simulation
By Currency• Inflation• GDP• Interest Rates• Asset class returns• Etc.
Liability &Business
Simulation
By Line of Business• Amount and timing of:
reserves and future losses
• Reinsurance structure• Expenses• Business Plan• Etc.
I4

Z
Introduction to CUFFS Insurance Company Introduction to CUFFS Insurance Company

Z19
0%
10%
20%
30%
40%
1 2 3 4 5 6 7 8 9 10
Existing Reserves Run-off Pattern
52%
10%
2%
17%
19%
Workers Comp
Auto Liability
Property
General Liability
All Other
CUFFS Insurance Company: Existing Reserves
Existing Reserves (by line)
Duration: 2.5

Z20
Financial Conditions• Existing Reserves $ 5,263
million
• Unearned Premium $ 1,729 million
Cash Out Flows
$0
$500,000
$1,000,000
$1,500,000
$2,000,000
$2,500,000
1 2 3 4 5 6 7 8 9 10
Expenses
Unearned Premium
Existing Reserves
CUFFS Insurance Company: Run-off Cash Flows

Z21
Losses and Expenses Paid less Premiums Collected
$0
$500,000
$1,000,000
$1,500,000
$2,000,000
$2,500,000
1 2 3 4 5 6 7 8 9 10
Net Cash Flow
Financial Conditions• Invested Assets $ 9,867
million
• Statutory Surplus $ 3,755 million
Duration: 2.7
CUFFS Insurance Company: Run-off Cash Flows

Z22
0%
10%
20%
30%
40%
1 2 3 4 5 6 7 8 9 10
Accident Year Payment Pattern
23%
9%
2%
48%
18%
Workers Comp
Auto Liability
Property
General Liability
All Other
Written Premium (by line)
Duration: 2.0
CUFFS Insurance Company: Business Plan

Z23
60%
65%
70%
75%
80%
1990 1991 1992 1993 1994 1995 1996 1997 1998 1999 2000 2001 2002 2003 2004
Accident Year
Loss Ratios
• Mean Loss Ratio: 75.2%
• Premium Growth Rate: 1.2%
0
1000
2000
3000
4000
5000
Net
Ear
ned
Pre
miu
m
1990 1991 1992 1993 1994 1995 1996 1997 1998 1999 2000 2001 2002 2003 2004
Year
Earned Premium--- Budget ---
--- Budget ---
CUFFS Insurance Company: Premium Growth & Loss Ratio

Z24
CUFFS Insurance Company: Asset Portfolio Summary
Invested Assets
Asset Mix24%
18%
3%
11%
8%6%
10%
Cash
Treasuries
Corporates
Common Stocks
Municipals
Mortgage Backed
Other
0%10%20%30%40%50%
1-5 Yrs 5-10 Yrs 10-30 Yrs
Maturity Distribution
Fixed Income

Z
Extending Traditional Capital Allocation Approaches using DFAExtending Traditional Capital Allocation Approaches using DFA

Z26
Use Standard Deviation of Statutory Surplus at the end of the time horizon as the Risk Measure
Allocating Capital based on the Marginal Impact of a particular variable (e.g. Difference between With and Without Workers Comp)
Excluded Business is assumed to be Completely Reinsured
Capital Allocation Methodology

Z27
Possible Extensions Using DFA
Existing Reserves:
Include existing reserves in addition to one year of new business in capital allocation process
Existing Reserves:
Include existing reserves in addition to one year of new business in capital allocation process
Multiple Years of New
Business:
Allow multiple years of new business to
be written instead of one year of new
business
Multiple Years of New
Business:
Allow multiple years of new business to
be written instead of one year of new
business
Asset Returns:
Allow for volatile asset returns, and allocate capital to
assets
Asset Returns:
Allow for volatile asset returns, and allocate capital to
assets

Z28
Existing Reserves Clearly can be Very Risky (e.g. Asbestos Reserves) Driven by many of the same factors as the New Business Need to address both “How Much” and “How Long”
- Especially important for Pricing Long-Term Lines
Possible Extensions Using DFA
Existing Reserves:
Include existing reserves in addition to one year of new business in capital allocation process
Existing Reserves:
Include existing reserves in addition to one year of new business in capital allocation process
Multiple Years of New
Business:
Allow multiple years of new business to
be written instead of one year of new
business
Multiple Years of New
Business:
Allow multiple years of new business to
be written instead of one year of new
business
Asset Returns:
Allow for volatile asset returns, and allocate capital to
assets
Asset Returns:
Allow for volatile asset returns, and allocate capital to
assets

Z29
WC - Res
WC - New
AL - Res
AL - New
Prop - Res
Prop - New
GL - Res
GL - New
Capital Allocation Based onNew Business and Existing
Reserves
WC
WC
AL
AL
Prop
Prop
GL
GL
Other
0%
10%
20%
30%
40%
50%
60%
70%
80%
90%
100%
Distribution of Written PremiumDistribution of Existing
Reserves
WC
AL
Prop
GL
Capital Allocation Based onNew Business
Existing Reserves

Z30
New Business versus Reserves
Existing Reserves
Different Risk Characteristics
- New Property Business can be very Risky because of Catastrophe exposure
- Largely Eliminated in the Property Reserves
Split by line varies dramatically

Z31
Workers Comp Property
Reserves New Business
Risk Allocation by Line
Existing Reserves

Z32
Multiple Years of New Business Companies do not Close at the End of One Year Some Risks take longer than One Year to Develop
(e.g. Pollution)
Possible Extensions Using DFA
Existing Reserves:
Include existing reserves in addition to one year of new business in capital allocation process
Existing Reserves:
Include existing reserves in addition to one year of new business in capital allocation process
Multiple Years of New
Business:
Allow multiple years of new business to
be written instead of one year of new
business
Multiple Years of New
Business:
Allow multiple years of new business to
be written instead of one year of new
business
Asset Returns:
Allow for volatile asset returns, and allocate capital to
assets
Asset Returns:
Allow for volatile asset returns, and allocate capital to
assets

Z33
Multiple Years of New Business
WC - Res WC - Res
WC - New WC - New
AL - Res AL - Res
AL - NewAL - New
Prop - Res
Prop - Res
Prop - NewProp - New
GL - Res
GL - Res
GL - New
GL - New
0%
10%
20%
30%
40%
50%
60%
70%
80%
90%
100%
1-Year 5-Year
Other

Z34
Time Diversification changes Impact of Different Risk Factors
- Reduces Impact of High Severity Claims (e.g. Property)
- Increases Impact of Inflation Sensitive Lines (e.g. Workers Comp)
Reflects ongoing nature of the company
Reflects wider range of Risks faced by Insurance Companies
- Recognition Delay on Reserves
- Pricing Risk
Multiple Years of New Business
Impact of Expanding the Time Frame

Z35
Asset Returns:
Large Source of Volatility
- Becoming even more so with dropping Premium to Surplus ratios and increasing Equity allocations
Correlated to Liabilities because of Inflation Sensitivity
Possible Extensions Using DFA
Existing Reserves:
Include existing reserves in addition to one year of new business in capital allocation process
Existing Reserves:
Include existing reserves in addition to one year of new business in capital allocation process
Multiple Years of New
Business:
Allow multiple years of new business to
be written instead of one year of new
business
Multiple Years of New
Business:
Allow multiple years of new business to
be written instead of one year of new
business
Asset Returns:
Allow for volatile asset returns, and allocate capital to
assets
Asset Returns:
Allow for volatile asset returns, and allocate capital to
assets

Z36
Issue:
- Most allocation methods require a “with” and “without” run
What About Assets?
Concern:
- What should be done for “without” assets?

Z37
Two options on the liability side:
1. Don’t write the business
- New Business only
2. Reinsure the business away
“Without” Assets Definition

Z38
Option #1: Assume some fixed rate of return
Advantages: Easy to understand Most similar to the “without” a line
“Without” Assets Definition
Disadvantages: What should the fixed rate be? Can’t be achieved in reality

Z39
Disadvantages:
Can lead to nonsensical results
Option #2: Invest everything in lowest risk asset class
Advantages:
Still relatively simple
Achievable alternative
“Without” Assets Definition

Z40
0%
2%
4%
6%
8%
10%
12%
14%
30%
35%
40%
45%
50%
55%
60%
65%
70%
75%
80%
85%
90%
95%
100%
105%
110%
115%
120%
125%
130%
135%
140%
145%
150%
155%
160%
165%
170%
175%
180%
185%
190%
195%
200%
RBC Ratio
Current Cash
“Without” Assets Definition
Held Statutory Surplus . Required Regulatory (Risk-Based) Capital
RBC Ratio =.

Z41
Option #3: Determine asset allocation that minimizes risk measure
Advantages:
Eliminates possibility of negative capital allocation
“Without” Assets Definition

Z42
0%
2%
4%
6%
8%
10%
12%
14%
30%
35%
40%
45%
50%
55%
60%
65%
70%
75%
80%
85%
90%
95%
100%
105%
110%
115%
120%
125%
130%
135%
140%
145%
150%
155%
160%
165%
170%
175%
180%
185%
190%
195%
200%
RBC Ratio
Current Cash Low Risk Portfolio
“Without” Assets Definition
Held Statutory Surplus . Required Regulatory (Risk-Based) Capital
RBC Ratio =.

Z43
Disadvantages: Much more complex Need a solution for each marginal run Very time consuming, especially for Shapley
values
Option #3: Determine asset allocation that minimizes risk measure
Advantages: Eliminates possibility of negative capital allocation
“Without” Assets Definition

Z44
WC
AL
Prop
GL
0%
10%
20%
30%
40%
50%
60%
70%
80%
90%
100%
Without
Asset Returns
Other
Assets
WC
AL
Prop
GL
With
Other

Z45
Considers Indirect Impacts of Operationse.g. Taxes: Impact of Realizing Gains/Losses on
Balance Sheet depends on prior year Gains and Losses
Easier to Consider Multiple Basis for Allocatione.g. Statutory Surplus and RBC Ratio
Can Consider More Complex Transactions Multi-Year Aggregate Reinsurance Contingent Equity
Other Benefits of Using a DFA Model
Z
Shapley ValuesShapley Values

Z47
Shapley Value Introduction
The Marginal “Last-In” allocation method used thus far only evaluates the marginal risk addition to the business as a whole.
The Shapley Value allocation method expands on the Marginal “Last-In” concept by considering all possible permutations of entry.
Shapley Value evenly splits the mutual covariance between the “With” and “Without” marginal scenarios.

Z48
Line of Standalone AllocatedBusiness Capital Capital
A 1,000 548 B 2,000 1,095 C 3,000 1,643 D 4,000 2,191
Sum 10,000 5,477 Total Company 5,477 Ratio 54.8%
Shapley Value Illustration
Z49
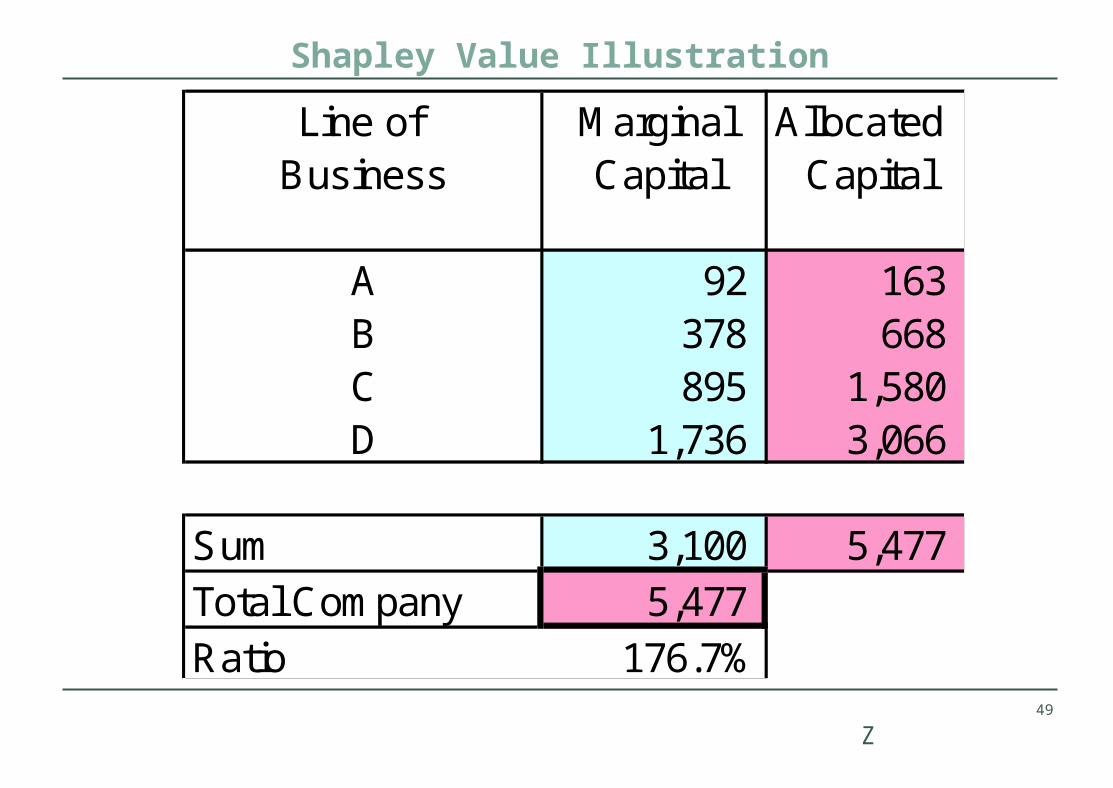
Line of Marginal AllocatedBusiness Capital Capital
A 92 163 B 378 668 C 895 1,580 D 1,736 3,066
Sum 3,100 5,477 Total Company 5,477 Ratio 176.7%
Shapley Value Illustration

Z50
Line of Standalone Allocated AllocatedBusiness Capital Capital Capital
LOB "First-in" "Last-in"A 1,000 548 163 B 2,000 1,095 668 C 3,000 1,643 1,580 D 4,000 2,191 3,066
Sum 10,000 5,477 5,477
Shapley Value Illustration

Z51
Capital Allocation
-500
1,0001,5002,0002,5003,0003,500
A B C D
LOB
"First-in"
"Last-in"
Shapley Value Illustration

Z52
Line of Standalone Allocated Allocated AllocatedBusiness Capital Capital Capital Capital
LOB "First-in" "Last-in" ShapleyA 1,000 548 163 345 B 2,000 1,095 668 906 C 3,000 1,643 1,580 1,654 D 4,000 2,191 3,066 2,572
Sum 10,000 5,477 5,477 5,477
Shapley Value Illustration

Z53
Capital Allocation
-500
1,0001,5002,0002,5003,0003,500
A B C D
LOB
"First-in"
"Last-in"
Shapley
Shapley Value Illustration

Z54
Shapley Value Comparison to Marginal Results
WCWC
ALAL
PropProp
GLGL
0%
10%
20%
30%
40%
50%
60%
70%
80%
90%
100%
Marginal Shapley
Assets
WCWC
ALAL
PropProp
GLGL
0%
10%
20%
30%
40%
50%
60%
70%
80%
90%
100%
Marginal Shapley
Assets
Excluding Assets Including Assets

Z55
DFA is a useful tool when allocating capital
Incorporation of new business and existing reserves makes a difference
Including Assets in the analysis is important
Selection of the Risk Metric is important
Work still needs to be done:
Conclusions
Allocation of the asset-related capital back to line Examining whether the asset mix needs to vary by LOB