z ä sát - Applied and Environmental...
46
1 1 2 Title 3 Detection of Botulinum Neurotoxin Serotype A, B, and F Proteolytic Activity in 4 Complex Matrices with Picomolar to Femtomolar Sensitivity 5 6 Byline 7 F. Mark Dunning 1 , Daniel R. Ruge 1 , Timothy M. Piazza 1,2 , Larry H. Stanker 3 , Füsûn N. 8 Zeytin 1 , and Ward C. Tucker 1 # 9 BioSentinel Pharmaceuticals Inc., 505 S. Rosa Rd., Suite 105, Madison, WI 53719 1 ; 10 Department of Forest and Wildlife Ecology, University of Wisconsin, 204 Russell Labs, 11 1630 Linden Dr., Madison, Wisconsin 53706 2 ; Western Regional Research Center, 12 Agricultural Research Service, Albany, California 94710 3 13 Corresponding author. Mailing address: BioSentinel Pharmaceuticals Inc., 510 14 Charmany Dr., Suite 259, Madison, WI 53719. Phone: (608) 441-8172. Fax: (608) 15 441-8173. E-mail: [email protected]. 16 17 Running Title 18 Detection of Botulinum Neurotoxins in Complex Matrices 19 20 Section 21 Methods 22 Copyright © 2012, American Society for Microbiology. All Rights Reserved. Appl. Environ. Microbiol. doi:10.1128/AEM.01664-12 AEM Accepts, published online ahead of print on 24 August 2012 on June 3, 2018 by guest http://aem.asm.org/ Downloaded from
Transcript of z ä sát - Applied and Environmental...

1
1 2 Title 3 Detection of Botulinum Neurotoxin Serotype A, B, and F Proteolytic Activity in 4 Complex Matrices with Picomolar to Femtomolar Sensitivity 5 6 Byline 7 F. Mark Dunning1, Daniel R. Ruge1, Timothy M. Piazza1,2 , Larry H. Stanker3, Füsûn N. 8 Zeytin1, and Ward C. Tucker1# 9 BioSentinel Pharmaceuticals Inc., 505 S. Rosa Rd., Suite 105, Madison, WI 537191; 10 Department of Forest and Wildlife Ecology, University of Wisconsin, 204 Russell Labs, 11 1630 Linden Dr., Madison, Wisconsin 537062; Western Regional Research Center, 12 Agricultural Research Service, Albany, California 947103 13 Corresponding author. Mailing address: BioSentinel Pharmaceuticals Inc., 510 14 Charmany Dr., Suite 259, Madison, WI 53719. Phone: (608) 441-8172. Fax: (608) 15 441-8173. E-mail: [email protected]. 16 17 Running Title 18 Detection of Botulinum Neurotoxins in Complex Matrices 19 20 Section 21 Methods 22
Copyright © 2012, American Society for Microbiology. All Rights Reserved.Appl. Environ. Microbiol. doi:10.1128/AEM.01664-12 AEM Accepts, published online ahead of print on 24 August 2012
on June 3, 2018 by guesthttp://aem
.asm.org/
Dow
nloaded from
2
Abstract 23 Rapid, high-throughput assays that detect and quantify botulinum 24 neurotoxin (BoNT) activity in diverse matrices are required for environmental, 25 clinical, pharmaceutical, and food testing. The current standard, the mouse 26 bioassay, is sensitive but is low in throughput and precision. In this study, we 27 present three biochemical assays for the detection and quantification of BoNT 28 serotype A, B, and F proteolytic activity in complex matrices that offer picomolar to 29 femtomolar sensitivity with small assay volumes and total assay times of less than 30 24 h. These assays consist of magnetic beads conjugated with BoNT serotype-31 specific antibodies that are used to purify BoNT from complex matrices before 32 quantification of bound BoNT proteolytic activity using the previously described 33 BoTest reporter substrates. Tested matrices include human serum, whole milk, 34 carrot juice, and baby food as well as buffers containing common pharmaceutical 35 excipients. Limits of detection for BoNT/A and BoNT/F were below 1 pM and below 36 10 pM for BoNT/B in most tested matrices using 200 µl samples, and as low as 10 37 fM for BoNT/A with increased sample volume. Together, these data describe rapid, 38 robust, and high–throughput assays for BoNT detection that are compatible with a 39 wide range of matrices. 40 41 Introduction 42 Botulinum neurotoxins (BoNTs) are zinc-dependent endopeptidases 43 produced by members of the bacterial genus Clostridium (17, 36, 64). The seven 44
on June 3, 2018 by guesthttp://aem
.asm.org/
Dow
nloaded from
3
BoNT serotypes, designated A - G, are structurally similar, each comprised of a 45 heavy chain that governs neuron-specific cell binding, cell uptake, and translocation 46 into the cytosol and a light chain that contains endopeptidase activity (35, 43, 45). 47 While cell-surface receptor and endopeptidase substrate specificity differs between 48 serotypes, all BoNTs act by specifically cleaving one or more soluble NSF attachment 49 protein receptor (SNARE) proteins, inhibiting neurotransmitter release at the 50 neuromuscular junction (11, 12, 44, 49, 52-54, 67). This block in neurotransmitter 51 release leads to the flaccid paralysis characteristic of the disease “botulism” and can 52 cause death by respiratory failure resulting from paralysis of the diaphragm and 53 intercostal muscles. BoNTs are extremely toxic with estimated lethal human doses 54 for BoNT/A of 1 – 3 ng/kg by intravenous routes, 10 – 13 ng/kg by inhalation, and 1 55 µg/kg orally, making BoNTs the most lethal substances known (4, 27). 56 The extreme toxicity, neuronal specificity, and ease of dissemination make 57 BoNT a human health and biodefense concern. Human botulism is most commonly 58 associated with BoNT/A, B, E, and F contracted through ingestion and wounds (37). 59 In the United States, infant botulism, commonly contracted by the ingestion of honey 60 or dust containing Clostridium spores (2, 3, 15), was responsible for ~66% of the 61 reported botulism intoxications from 2001–2009 62 (http://www.cdc.gov/nationalsurveillance/botulism_surveillance.html). BoNTs are 63 also considered a biodefense threat of utmost concern warranting a Class A 64 designation from the CDC and HHS (4). Illicit manufacturing of BoNT for terrorism 65 purposes is documented (63, 69). In all botulism cases, whether naturally occurring 66
on June 3, 2018 by guesthttp://aem
.asm.org/
Dow
nloaded from

4
or intentional, early diagnosis of intoxication is critical for effective treatment and 67 identifying the source of the toxin (60). 68 BoNT’s specificity for neurons and the neuromuscular junction and long 69 biological half-life (>4 months for BoNT/A)(59) is extensively and increasingly 70 utilized for cosmetic and therapeutic applications. The Food and Drug 71 Administration approved BoNT-based drug products for treatment of a variety of 72 conditions including glabellar lines, strabismus, cervical dystonia, and chronic 73 migraines. Dozens of “off-label” applications are also documented (9, 21, 58) and 74 new applications are being pursued through modification of the toxin (26, 48). 75 However, the extreme toxicity of BoNT requires accurate toxin quantification for 76 correct dosing. Underdosing may result in a lack of effective treatment while 77 overdosing puts patients at risk of dangerous and potentially deadly side effects. 78 The mouse lethality bioassay is the accepted, standard method for detecting 79 and quantifying BoNT activity in clinical, environmental, and pharmaceutical 80 samples (1, 37, 51); although, there is no single, mandated protocol and different 81 testing facilities may follow unique protocols. The mouse bioassay is applicable to 82 all BoNT serotypes and is extremely sensitive, with a limit of detection (LOD) of 5–83 10 pg of BoNT/A (25). The mouse bioassay also reports a physiological response, 84 death, that requires a fully functional toxin capable of binding and entering neurons 85 before cleaving its SNARE substrate. The assay is performed by injecting mice 86 intraperitoneally with ~0.5 – 1 ml sample per mouse and recording the time of and 87 number of deaths over 2 – 7 days, depending on the protocol being followed. As 88 expected, the assay is low throughput and requires highly trained personnel, 89
on June 3, 2018 by guesthttp://aem
.asm.org/
Dow
nloaded from

5
operating in specialized animal facilities. In addition, ethical concerns associated 90 with animal usage has led to public calls to replace the mouse bioassay in clinical 91 and pharmaceutical testing (6, 7, 10, 32). The lack of standardized assay protocols 92 among testing labs also leads to variable quantification results for the same sample 93 (14, 56). Indeed, while both Botox® and Dysport®, two BoNT/A therapeutics, 94 share the same unit definition (one mouse 50% lethal dose per unit, mLD50), one 95 study found 1 U of Botox® was equivalent to between 2-11 U of Dysport®, 96 depending on the testing lab (39); although, a more recent study concluded a 97 BoTox®:Dysport® equivalency of 1:2-4 U (66). A similar dose inequality was 98 reported between the BoNT/A therapeutic Xeomin® and BoTox® (31). These dose 99 inequalities put patient safety at risk. Alternative, animal-free, standardizable 100 assays for the detection of BoNT activity with mouse bioassay sensitivity are a 101 critical need for diagnostic, environmental, biodefense, and pharmaceutical testing. 102 We previously reported the development of the BoTest A/E and B/D/F/G 103 assays (50). These assays utilize fluorogenic protein reporters consisting of an N-104 terminal cyan fluorescent protein (CFP) moiety and C-terminal yellow fluorescent 105 protein derivative Venus moiety linked by a BoNT substrate, residues 141-206 of 106 SNAP25 in BoTest A/E and residues 33-94 of synaptobrevin in BoTest B/D/F/G. In 107 the absence of cleavage, excitation of CFP results in Förster Resonance Energy 108 Transfer (FRET) to Venus, quenching CFP emission and exciting Venus emission. 109 Upon linker cleavage by BoNT, the CFP and Venus become separated, preventing 110 FRET; CFP emission increases and Venus emission decreases. The ratio of these 111 two emissions gives a quantitative measure of BoNT activity. Furthermore, as long 112
on June 3, 2018 by guesthttp://aem
.asm.org/
Dow
nloaded from

6
as the BoNT remains active, the BoTest reporters will continue to be cut, thus the 113 assay can be read until the desired sensitivity is achieved. Femtomolar (BoNT/A) 114 and picomolar (BoNT/B and F) limits of detection (LOD) are possible with the 115 BoTest assays using purified toxins. 116 In this study, we report the development of in vitro assays for the 117 quantification of BoNT/A, B, and F activity in complex matrices. These assays utilize 118 the BoTest A/E and B/D/F/G substrates coupled to immunological methods in a 119 medium to high throughput format and are capable of detecting BoNT with 120 picomolar to femtomolar sensitivity. Recently, we used such an approach to 121 develop an assay for the detection of BoNT/E in avian blood samples (47). Together, 122 these assays present an ideal alternative for routine and rapid testing and 123 quantification of BoNT in a wide variety of applications. 124 125 Materials and Methods 126 Protein Expression. Protein expression plasmids containing HcR/A and F were 127 kindly provided by J. T. Barbieri (Medical College of Wisconsin- Milwaukee) and 128 expressed as previously described (47). The BoTest A/E and B/D/F/G reporters 129 were purified as previous described (50). 130 131 Antibodies and preparation of immunoprecipitation beads. Purified Anti-HcR/A and 132 F IgY was generated by GeneTel Laboratories (Madison, WI) using HcR/A and F, 133 respectively, for immunization and antigen-specific purification. Anti-BoNT/B 134 mouse monoclonal antibody mcs92-32-1-10 was kindly provided by L. Stanker 135
on June 3, 2018 by guesthttp://aem
.asm.org/
Dow
nloaded from
7
(USDA, ARS). Tosyl-activated BcMag magnetic beads (Bioclone, San Diego, CA) were 136 coated with anti-HcR/A (Matrix A), mcs92-32-1-10 (Matrix B), or anti-HcR/F 137 (Matrix F) antibody (5 µg antibody/mg beads) following the manufacturer’s 138 protocol, blocked for 1.5 h at 37 °C with Blocker Casein (Pierce, Rockford, IL), 139 washed, and resuspended to 6 mg/L with PBS-t (0.1% Tween-20). 140 141 BoNT activity assays. All reactions were run in black, flat-bottomed 96 well plates 142 (NUNC, Rochester, NY). For assays that did not include immunoprecipitation (IP), 143 triplicate dilutions of the indicated BoNT/A, B, or F holotoxin concentrations 144 (Metabiologics, Madison, WI) were made in 100 µl BoTest Reaction Buffer (50mM 145 HEPES pH 7.1, 5 mM NaCl, 0.1% Tween20, 10 µM ZnCl2, 5 mM dithiothreitol) 146 supplemented, when indicated, with varying concentrations of human serum 147 albumin (HSA), NaCl, or other test material. Assays were initiated by adding 0.25 148 µM final concentration BoTest A/E or B/D/F/G reporter and incubating at 25 °C 149 (BoTest A/E) or 37 °C (BoTest B/D/F/G). After the indicated period of time, the 150 reporter was excited at 434 nm and emissions collected at 470 and 526 nm using a 151 Varioskan microplate reader (Thermo-Fisher, Waltham, MA). The fluorescence 152 emission ratio was calculated by dividing the emission at 526 nm by the emission at 153 470 nm and plotted as a function of BoNT concentration. 154 For IP experiments including the BoTest Matrix assays, unless otherwise 155 indicated, 20 µl of antibody-conjugated magnetic beads (Matrix beads) were mixed 156 with 20 µL Matrix Binding Buffer (250 mM NaCl, 1% Tween-20, 5% casein, 0.05% 157 sodium azide, 500 mM Hepes-NaOH, pH 7.1). 200 µl sample was then added and 158
on June 3, 2018 by guesthttp://aem
.asm.org/
Dow
nloaded from
8
incubated for 2 h at 25 °C. Beads were then washed three times with 200 µl PBS-t 159 using a BioTek Elx405 magnetic bead-capable plate washer and resuspended in 50 160 µl BoTest Reaction buffer. Proteolytic activity determinations were then initiated by 161 the addition of 0.5 μM BoTest A/E or B/D/F/G reporter in 50 µl BoTest Reaction 162 Buffer. Where indicated, control BoNT dilutions representing 100% pull-down 163 efficiency were made in 50 µl BoTest Reaction buffer and assayed along with the 164 pull-down samples. Samples were incubated at 25 °C (BoNT/A) or 37 °C (BoNT/B 165 and F) in a temperature controlled microplate mixer at 750 rpm (Discovery 166 Scientific, Kelowna, BC, Canada). At the desired time points, the beads were 167 separated on a 96-well magnetic separator (V&P Scientific, San Diego, CA). 168 Following separation, the reporter was excited at 434 nm and emissions at 470 nm 169 and 526 nm collected and the emission ratio (526/470) calculated. For further 170 incubations, where applicable, the beads were resusupended and placed back into 171 incubation. 172 In all experiments, negative control samples were run either in triplicate or 173 nonuplicate (when a LOD determination was made) to monitor for non-specific 174 protease contamination. While these data are not plotted, no background protease 175 activity was observed in any of the presented data. 176 177 Data Analysis. All data analysis was performed using Prism 4.0 (GraphPad Software, 178 La Jolla, CA). Data were fit to the four-parameter logistics equation Y = bottom + 179 [(top – bottom)/1 + 10(logEC50 – x) * Hillslope)], where Y is the response that starts at a 180 top (no activity) and goes to a bottom (assay saturation), x is the logarithm of the 181
on June 3, 2018 by guesthttp://aem
.asm.org/
Dow
nloaded from

9
concentration, and EC50 is the half-maximal (50%) effective concentration. For LOD 182 determinations, serial dilutions of BoNT-spiked samples were compared to control, 183 non-spiked samples (n=9). LOD were defined as having an emission ratio value less 184 than 3 standard deviations (SDs) below control samples. Data interpolations to 185 standard curves were performed using Prism. Percent coefficients of variation 186 (%CV) were calculated by dividing the SD of intra- or inter-assay runs by the 187 average of the run or runs, respectively. 188 189 Complex matrix testing. Complex matrix testing was performed as above with the 190 following modifications. BoNT dilutions were made by first spiking BoNT holotoxin 191 into the tested matrix. Following BoNT addition, the baby food sample (Beech Nut 192 Classic Garden Vegetables) was diluted 1:3 with PBS to reduce sample viscosity. 193 Serial dilutions of the toxin were then made in the tested matrix, except for baby 194 food where 1:3 diluted matrix was used as the diluent. Following dilution, baby 195 food and carrot juice samples were spun 10 min at 14,000 x g to pellet particulate 196 matter. Samples were then assayed with BoTest Matrix assays as described above 197 except the post-IP beads were washed four times with 200 µL PBS-t. 198 199 Protein blotting. 10 µl input, non-bound, BoTest assay, and bead fractions collected 200 during the pull down assay and containing 10 nM (anti-BoNT/A blot) or 10 pM 201 (anti-HSA blot) were separated by SDS-PAGE and transferred to Immobilon-P PVDF 202 membrane (Millipore, Billerica, MA). Blots were probed with anti-BoNT/A 203 (Metabiologics) or anti-HSA (15C7, Abcam, Cambridge, MA) antibody followed by an 204
on June 3, 2018 by guesthttp://aem
.asm.org/
Dow
nloaded from

10
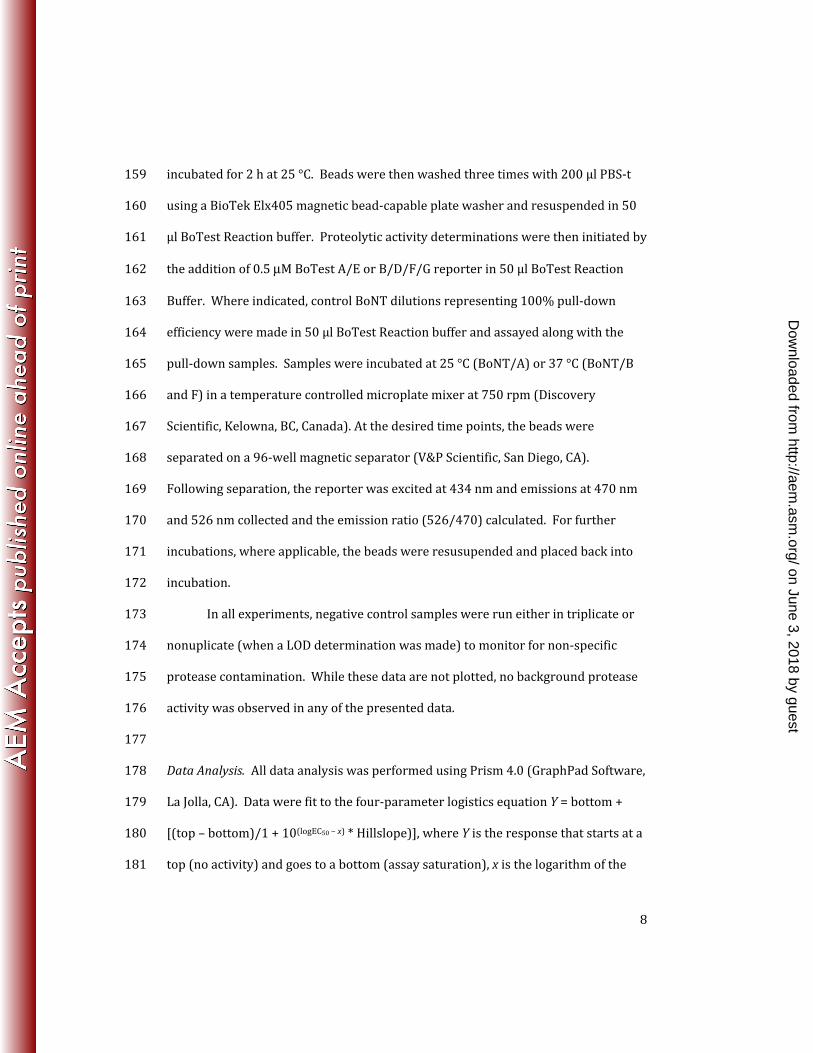
appropriate horseradish peroxidase-conjugated secondary antibody. Signal was 205 generated using SuperSignal West Pico substrate (Pierce) and imaged on a 206 ChemiDoc gel system (Bio-Rad). Densitometry was performed using QuantityOne 207 software (Bio-Rad). 208 209 Results 210 Sample composition influences in vitro BoNT activity determinations 211 Detection of BoNT in environmental, food, and pharmaceutical samples is 212 complicated by the presence of non-BoNT matrix molecules that affect BoNT 213 activity. For example, BoNT-based drug products such as BoTox®, Dysport®, 214 Myobloc®, and Xeomin® all contain varying HSA levels along with other stabilizers 215 or excipients such as NaCl, sucrose, and lactose. We tested the effects of common 216 pharmaceutical excipients on BoNT/A and B activity using the BoTest A/E and 217 B/D/F/G reporters. Tested concentrations ranged from 0.1 to 10 times the 218 concentration of each excipient commonly found in saline resuspensions of BoNT-219 based drug product (see Table S1). Both HSA and NaCl dramatically affected 220 BoNT/A activity determinations (Fig. 1). HSA increased the BoNT/A half-maximal 221 effective concentration (EC50) from 1.4 pM in the absence of HSA to 5.9 and 36.9 pM 222 in the presence of 0.05 and 0.5% HSA, respectively (Fig. 1A). NaCl addition 223 increased the EC50 from 1.6 pM to 19 pM in the absence and presence of 154 mM 224 NaCl, respectively, while decreasing assay dynamic range (the difference in emission 225 ratio between uncleaved and fully cleaved reporter) from 2.0 to 1.1 (arbitrary units; 226
on June 3, 2018 by guesthttp://aem
.asm.org/
Dow
nloaded from
11
Fig. 1B). Sucrose and lactose had no significant impact on the assay up to 4.7 and 227 2.5%, respectively (data not shown). 228 HSA had a modest impact on BoNT/B activity determinations using the 229 BoTest B/D/F/G reporter (Fig. 1C). The addition of 0.5% HSA increased the 230 BoNT/B EC50 from 236 pM to 312 pM and the dynamic range decreased from 3.4 to 231 2.9. In contrast, NaCl impacted both BoNT/B activity determination. Addition of 232 100 mM NaCl increased the BoNT/B EC50 from 261 pM to 3.4 nM and decreased the 233 reporter dynamic range from 3.3 to 1.7 (Fig. 1D). Addition of Na-succinate, pH 5.6 234 also greatly impacted the BoNT/B EC50 and BoTest B/D/F/G dynamic range at 235 concentrations above 10 mM (Fig. 1E). These data demonstrate the large impact 236 even well defined matrix molecules can have on BoNT activity determinations, 237 highlighting the need for methods that allow for the removal of matrix molecules 238 before BoNT activity quantification. 239 240 Development of immunoprecipitation-based BoNT enrichment methods 241 Several strategies can be taken to reduce the effects of interfering 242 compounds including immunological enrichment of desired molecules, 243 immunological depletion of undesired molecules, or simple dilution to reduce 244 matrix effects. We chose to use immunological enrichment through IP as this would 245 allow for (1) adapting the assay to multiple samples types (e.g., food, 246 pharmaceutical, diagnostic), (2) buffer exchanges, and (3) concentrating BoNT from 247 dilute solutions. In the envisioned assay, a BoNT serotype-specific antibody is 248 conjugated to a substrate such as a magnetic bead. The antibody-conjugated beads 249
on June 3, 2018 by guesthttp://aem
.asm.org/
Dow
nloaded from

12
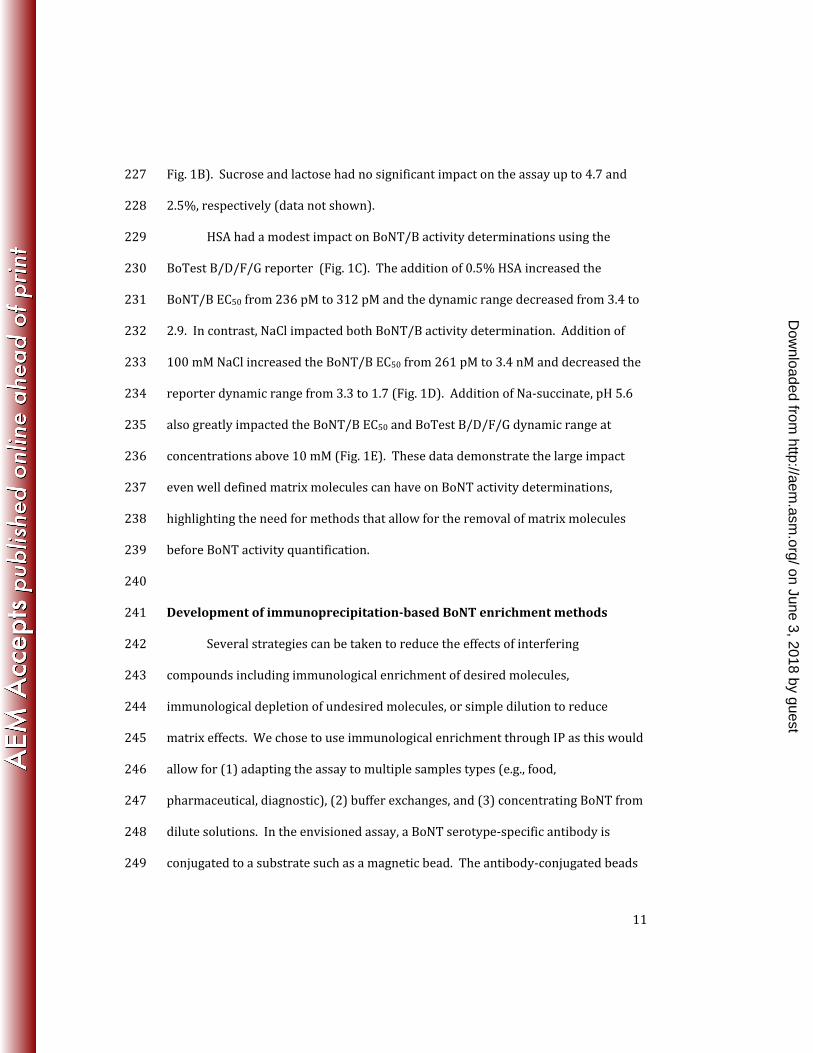
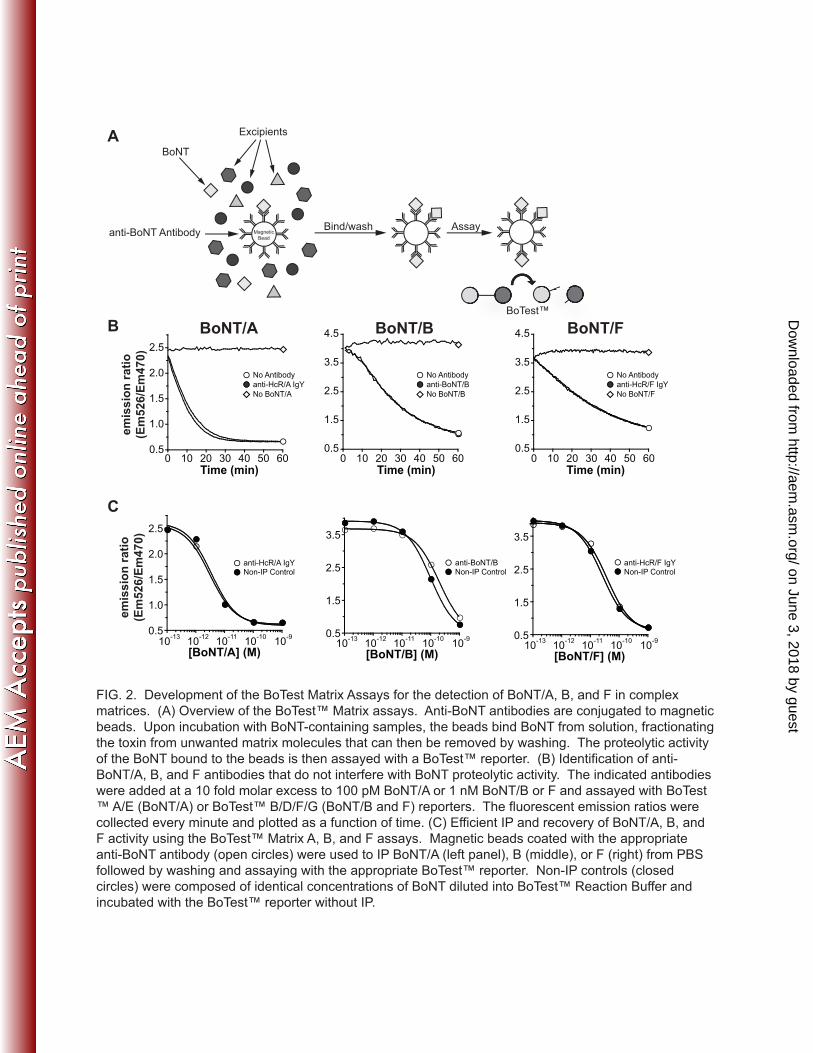
are added to a sample, binding and sequestering the available toxin before removal 250 of unwanted contaminants by washing the beads. Bead-captured BoNT is 251 resuspended in an optimized reaction buffer and quantified with a BoTest reporter 252 (Fig. 2A). While mechanistically straightforward, this method requires an antibody 253 with high specificity and affinity to meet the femtomolar to picomolar LOD found 254 with current animal-based assays. 255 We screened over 60 mono- and polyclonal antibody preparations from in-256 house, commercial, and academic sources. Most antibodies tested were not 257 appropriate for an IP-based activity assay due to antibody-specific inhibition of 258 BoNT proteolytic activity or insufficient affinity to achieve the desired assay LOD 259 (data not shown). We did, however, identify three preparations with sufficient 260 affinity and specificity to meet assay development needs: For BoNT/A and F, we 261 developed IgY polyclonal preparations obtained from chickens immunized with the 262 heavy chain receptor (HcR) subdomain of BoNT/A and F, respectively. HcR 263 immunization has the distinct advantage of directing the antibodies to the heavy 264 chain, rather than the proteolyticaly active light chain. For BoNT/B, we identified a 265 mouse monoclonal antibody previously developed at the USDA. None of these 266 antibodies altered BoNT endopeptidase substrate cleavage kinetics using the BoTest 267 reporters (Fig. 2B). When magnetic beads were coated with anti-BoNT/A, B, or F 268 antibodies and used to IP BoNT from human serum, nearly 100% BoNT activity 269 recovery was observed when compared to a control curve representing 100% assay 270 efficiency (Fig. 2C). 271
on June 3, 2018 by guesthttp://aem
.asm.org/
Dow
nloaded from

13
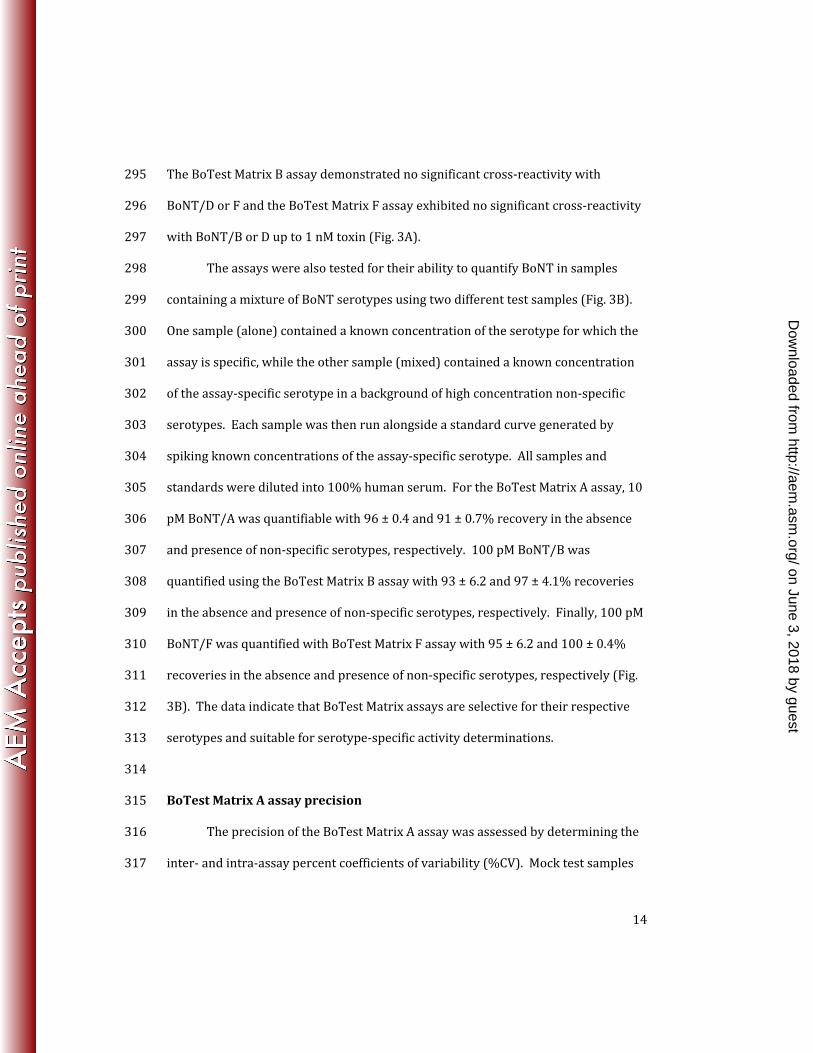
Assay performance was optimized for bead volume, antibody concentration, 272 incubation temperatures, incubation time, and use in a 96-well format to maximize 273 BoNT sensitivity and minimize assay times (Fig. S1). The final optimized assays, 274 which combine IP using magnetic beads coated with anti-BoNT antibodies (Matrix 275 Beads) and activity determination using the BoTest reporters, were named the 276 BoTest Matrix A, B, or F assays, according to the serotype specificity of each assay. 277 278 Serotype specificity of the BoTest Matrix assays 279 BoNT serotypes exhibit significant homology, thus serotype specificity 280 cannot be assumed when developing BoNT detection assays using antibodies (35). 281 To test assay serotype specificity, the BoTest Matrix A assay was titrated with 282 BoNT/A, C, and E, and the BoTest Matrix B and F assays were titrated with BoNT/B, 283 D, and F (Fig. 3). These experiments evaluate the specificity of the bead-conjugated 284 antibodies since the tested non-specific BoNTs can cleave the reporter used in their 285 respective assays. The BoTest Matrix A assay detected BoNT/A with an EC50 of 6.2 286 pM and 1.2 pM after 4 and 24 h, respectively (Fig. 3A). Cross-reactivity was seen 287 between the BoTest Matrix A assay and BoNT/E; although, the assay’s BoNT/E EC50 288 at 24 h was ~438 pM, more than two orders of magnitude higher than that with 289 BoNT/A (~1.2 pM). The BoTest Matrix A Assay BoNT/E LOD was ~1 nM after 4 h 290 and ~100 pM at 24 h compared to BoNT/A LOD of 1 pM at 4 h and 100 fM at 24 h. 291 Thus, the data indicate that the BoTest Matrix A is serotype selective but not specific 292 for BoNT/A. Confirmation of BoNT/A activity, however, could be made by the 293 introduction of a serotype-specific reporter as previously reported for BoNT/E (47). 294
on June 3, 2018 by guesthttp://aem
.asm.org/
Dow
nloaded from
14
The BoTest Matrix B assay demonstrated no significant cross-reactivity with 295 BoNT/D or F and the BoTest Matrix F assay exhibited no significant cross-reactivity 296 with BoNT/B or D up to 1 nM toxin (Fig. 3A). 297 The assays were also tested for their ability to quantify BoNT in samples 298 containing a mixture of BoNT serotypes using two different test samples (Fig. 3B). 299 One sample (alone) contained a known concentration of the serotype for which the 300 assay is specific, while the other sample (mixed) contained a known concentration 301 of the assay-specific serotype in a background of high concentration non-specific 302 serotypes. Each sample was then run alongside a standard curve generated by 303 spiking known concentrations of the assay-specific serotype. All samples and 304 standards were diluted into 100% human serum. For the BoTest Matrix A assay, 10 305 pM BoNT/A was quantifiable with 96 ± 0.4 and 91 ± 0.7% recovery in the absence 306 and presence of non-specific serotypes, respectively. 100 pM BoNT/B was 307 quantified using the BoTest Matrix B assay with 93 ± 6.2 and 97 ± 4.1% recoveries 308 in the absence and presence of non-specific serotypes, respectively. Finally, 100 pM 309 BoNT/F was quantified with BoTest Matrix F assay with 95 ± 6.2 and 100 ± 0.4% 310 recoveries in the absence and presence of non-specific serotypes, respectively (Fig. 311 3B). The data indicate that BoTest Matrix assays are selective for their respective 312 serotypes and suitable for serotype-specific activity determinations. 313 314 BoTest Matrix A assay precision 315 The precision of the BoTest Matrix A assay was assessed by determining the 316 inter- and intra-assay percent coefficients of variability (%CV). Mock test samples 317
on June 3, 2018 by guesthttp://aem
.asm.org/
Dow
nloaded from
15
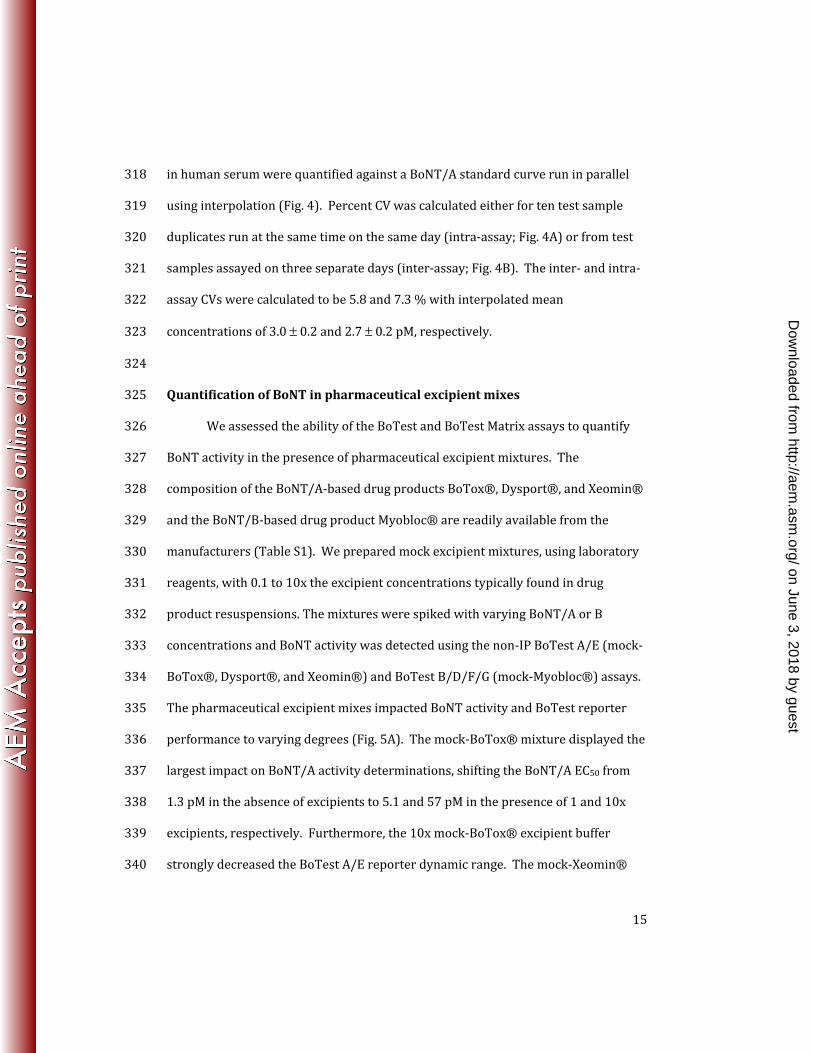
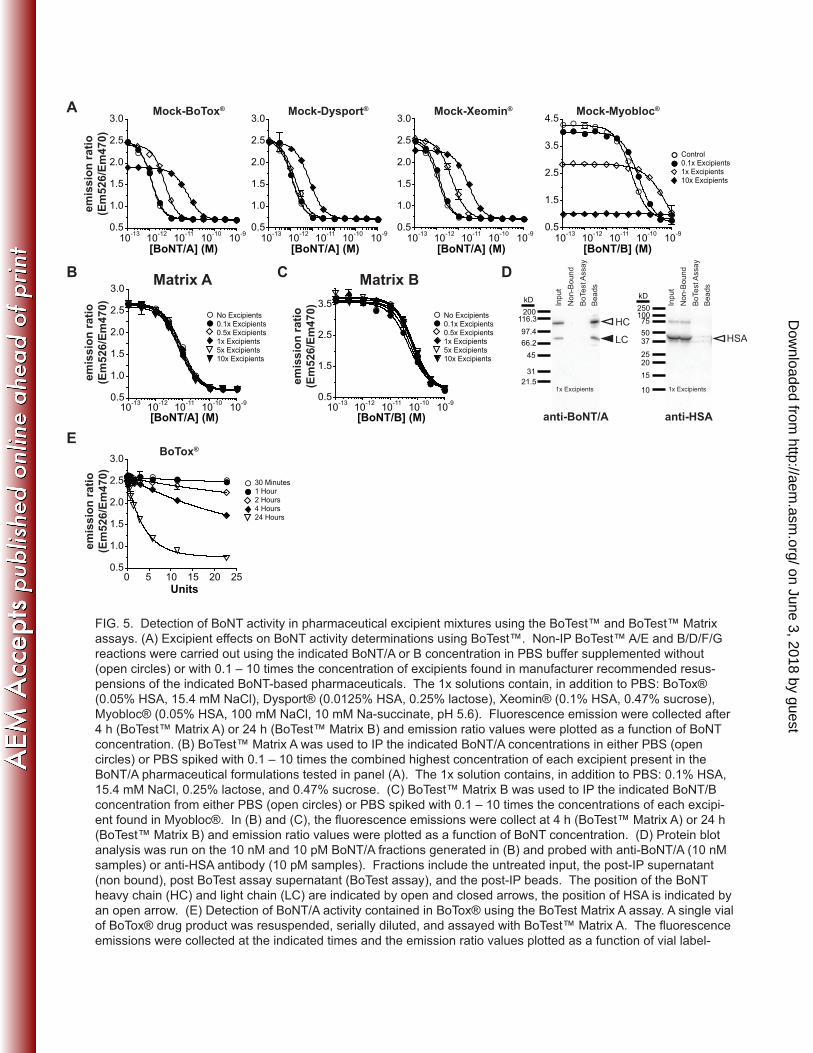
in human serum were quantified against a BoNT/A standard curve run in parallel 318 using interpolation (Fig. 4). Percent CV was calculated either for ten test sample 319 duplicates run at the same time on the same day (intra-assay; Fig. 4A) or from test 320 samples assayed on three separate days (inter-assay; Fig. 4B). The inter- and intra-321 assay CVs were calculated to be 5.8 and 7.3 % with interpolated mean 322 concentrations of 3.0 ± 0.2 and 2.7 ± 0.2 pM, respectively. 323 324 Quantification of BoNT in pharmaceutical excipient mixes 325 We assessed the ability of the BoTest and BoTest Matrix assays to quantify 326 BoNT activity in the presence of pharmaceutical excipient mixtures. The 327 composition of the BoNT/A-based drug products BoTox®, Dysport®, and Xeomin® 328 and the BoNT/B-based drug product Myobloc® are readily available from the 329 manufacturers (Table S1). We prepared mock excipient mixtures, using laboratory 330 reagents, with 0.1 to 10x the excipient concentrations typically found in drug 331 product resuspensions. The mixtures were spiked with varying BoNT/A or B 332 concentrations and BoNT activity was detected using the non-IP BoTest A/E (mock-333 BoTox®, Dysport®, and Xeomin®) and BoTest B/D/F/G (mock-Myobloc®) assays. 334 The pharmaceutical excipient mixes impacted BoNT activity and BoTest reporter 335 performance to varying degrees (Fig. 5A). The mock-BoTox® mixture displayed the 336 largest impact on BoNT/A activity determinations, shifting the BoNT/A EC50 from 337 1.3 pM in the absence of excipients to 5.1 and 57 pM in the presence of 1 and 10x 338 excipients, respectively. Furthermore, the 10x mock-BoTox® excipient buffer 339 strongly decreased the BoTest A/E reporter dynamic range. The mock-Xeomin® 340
on June 3, 2018 by guesthttp://aem
.asm.org/
Dow
nloaded from
16
buffer also strongly inhibited BoNT/A activity, shifting the BoNT/A EC50 from 1.1 341 pM in the absence of excipients to 5.1 and 29 pM in the presence of 1 and 10x 342 excipients, respectively. The mock-Dysport® buffer only significantly impacted the 343 BoTest A/E assay at 10x excipient concentration, shifting the BoNT/A EC50 from 1.1 344 pM (no excipients) to 7.5 pM with 10x excipients. Mock-Myobloc® excipients 345 dramatically impacted BoNT/B activity and BoTest B/D/F/G reporter performance. 346 The BoNT/B EC50 shifted from 163 pM to 3.4 nM and assay dynamic range 347 decreased from 3.5 to 1.8 in the absence and presence of 1x excipients, respectively. 348 Further increases in excipient concentration to 5 and 10x resulted in complete 349 failure of the assay, presumably the result of high NaCl concentrations (> 500 mM) 350 and low pH. Clearly, accurate BoNT activity determination requires the removal of 351 excipients. 352 We next tested whether the BoTest Matrix assays were capable of 353 fractionating BoNT from excipients and quantifying BoNT activity regardless of 354 excipient load. Two master excipient buffers were generated, which at 1x contain 355 the highest concentration of each excipient found among the three BoNT/A 356 pharmaceuticals (BoTox®, Dysport®, and Xeomin®) or the single BoNT/B 357 pharmaceutical (Myobloc®; Table S1). Varying BoNT concentrations were then 358 spiked into 0.1 – 10x master excipient mixtures and BoNT activity assayed using the 359 BoTest Matrix A or B assays. The BoTest Matrix A assay efficiently detected BoNT/A 360 endopeptidase regardless of excipient concentration (Fig. 5B). BoTest Matrix A EC50 361 values ranged from 7.4 to 9.5 pM with no correlation between EC50 and excipient 362 concentration. The BoTest Matrix B assay also effectively quantified the BoNT/B 363
on June 3, 2018 by guesthttp://aem
.asm.org/
Dow
nloaded from

17
activity contained in all pharmaceutical excipient mixtures. BoTest Matrix B EC50 364 values ranged from 48 to 74 pM with no correlation between assay EC50 values and 365 excipient concentration (Fig. 5C). 366 We verified separation of BoNT/A from the excipient HSA during the course 367 of a BoTest Matrix A assay. Four fractions were collected during the testing of a 1 368 nM BoNT/A sample in 1x excipients- the pre-assay input, a post-IP non-bound 369 supernatant, a BoTest A/E reaction supernatant, and the final, post-assay Matrix 370 beads. Each fraction was analyzed by Western blot for the presence of HSA and 371 BoNT/A (Fig. 5D). As expected, BoNT/A was found in the input and post-assay 372 Matrix bead fractions, indicating that BoNT/A was effectively sequestered to the 373 Matrix bead surface during the assay. HSA was largely present only in the input and 374 post-IP non-bound fractions. Densitometry analysis indicated 89% HSA was left in 375 the post-IP supernatant while <6% non-specifically bound the Matrix A beads. 376 These data indicate that the BoTest Matrix assay can effectively fractionate BoNT/A 377 from unwanted matrix molecules. 378 As a final test of the assay’s ability to detect the activity contained in 379 reconstituted drug products, we used the BoTest Matrix A assay to detect the 380 BoNT/A activity contained in 100U vials of clinical-grade BoTox®. These 381 experiments directly address whether the BoTest Matrix A assay can detect the 382 activity contained in a lyophilized and then reconstituted drug product. A single 383 BoTox® vial was reconstituted in 0.9% saline and serially diluted in PBS-t from 384 454.5 to 0.2 U/ml. Each sample was then subjected to the BoTest Matrix A assay 385 with reaction and read times between 30 min and 24 h (Fig. 5E). Less than 10 U of 386
on June 3, 2018 by guesthttp://aem
.asm.org/
Dow
nloaded from
18
activity could be detected in 2 h and <1 U in 24 h, demonstrating the BoTest Matrix 387 assays’ sensitivity and immunity to pharmaceutical excipients. 388 389 BoTest Matrix assays are compatible with a variety of complex matrices 390 We assessed whether the BoTest Matrix assays are compatible with highly 391 complex matrices using a panel of sample types consisting of milk, human serum, 392 baby food, and carrot juice. Unlike the well-defined mix of excipients presented by 393 pharmaceutical samples, environmental and food samples are highly varied, often 394 with unpredictable compositions. Non-neutral pH, fat content, salt content, and 395 viscosity, to name a few variables, may present not only sample processing issues 396 but directly interfere with BoNT activity determinations. To account for these 397 potential issues, additional sample processing steps were introduced to the BoTest 398 Matrix assay protocol. A binding buffer containing HEPES and casein was spiked 399 into all samples before IP to neutralize pH and to reduce non-specific binding to the 400 Matrix beads. Baby food samples were diluted to reduce viscosity and matrices 401 containing particulate matter were centrifuged following dilution to clarify the 402 supernatant before subjugation to the assay (see Methods, Fig. 6). 403 For these experiments, as with the other experiments presented in this 404 study, we used the purified 150 kDa holotoxin form of BoNT/A, B, and F (38). 405 Clostridium naturally produces the toxin as a complex of variable molecular weight 406 consisting of the core neurotoxin and neurotoxin-associated proteins (NAPs) (33, 407 62). These toxin complexes are produced during a food contamination; however, the 408 stability of BoNT complexes is highly pH dependent. For example, BoNT/A complex 409
on June 3, 2018 by guesthttp://aem
.asm.org/
Dow
nloaded from
19
disassociates into holotoxin and NAPs above pH ~6.25 (22, 29). The inclusion of a 410 binding buffer during food sample IP results in pH neutralization and, thus, the toxin 411 will be expected to exist in holotoxin form regardless of whether the test samples 412 were generated with BoNT holotoxin or complex. Holotoxin was used in these 413 experiments because of its high purity and precise molecular weight, allowing 414 accurate spiking of food samples with known BoNT concentrations. In addition, we 415 performed experiments comparing BoNT/A holotoxin and complex spiked into 416 human serum at equal mLD50 dosages and found very similar results regardless of 417 toxin form (Fig. S2). 418 Sample compatibility issues were first identified by spiking samples with 419 varying BoNT/A, B, or F concentrations and attempting to measure BoNT activity 420 directly with the BoTest assays with no IP treatment. The ability to detect BoNT 421 activity was highly matrix dependent (Fig. 6A and Table 1). BoNT/A was detectable 422 in all samples but assay sensitivity and dynamic range were highly matrix 423 dependent. BoNT/B and F were even less detectable in the different matrices with 424 BoNT/B and F proteolytic activity completely undetectable in human serum. These 425 results re-emphasize the need for separation methods to reliably detect BoNT 426 activity in complex matrices. 427 The BoTest Matrix assay, however, readily detected BoNT/A, B, or F activity 428 in all matrices (Fig. 6B and C). Assay sensitivity was time-dependent in all matrices 429 tested as demonstrated with BoNT/A-spiked samples and the BoTest Matrix A assay 430 (Fig. 6B). Furthermore, BoNT/B and F activity was readily detected regardless of 431 the sample-type with picomolar sensitivities possible within 4 h (Fig. 6C). Table 1 432
on June 3, 2018 by guesthttp://aem
.asm.org/
Dow
nloaded from
20
summarizes the BoTest Matrix assays LOD in as a function of BoNT serotype, sample 433 type, and read time. LOD varied based on BoNT serotype and tested matrix and 434 were only calculated based on half-log dilutions (for a given sample type, the LOD 435 was the first data point that fell 3 SD below control values.) BoNT/A sensitivity was 436 the least dependent on matrix effects, with limits of detection below 3.33 pM after 4 437 h and 0.333 pM by 24 h for all matrices. BoNT/B and F sensitivity was more 438 variable across the tested matrices. BoNT/B detection ranged from 30 – 100 pM 439 after 4 h to 3.3 – 10 pM after 24 h. Sensitivity to BoNT/F ranged from 10 – 30 pM 440 after 4 h to 1 – 10 pM after 24 h. These data are presented as BoNT holotoxin 441 concentration because of the unit’s highly defined nature. While picogram 442 toxin:mLD50 conversion values are dependent on the testing lab and mouse bioassay 443 protocol being run, one mLD50 can be approximated as 10 pg of BoNT/A, 30 pg of 444 BoNT/B, and 100 pg of BoNT/F (~0.3 pM, 1 pM, and 3.3 pM BoNT when in 200 µL, 445 respectively) (20, 68) (Metabiologics, personal communication). These results 446 indicate that the BoTest Matrix A, B, and F assays are powerful tools for quantifying 447 BoNT in highly complex matrix environments, including both serum and foodstuffs. 448 449 Detection of low femtomolar BoNT/A concentrations in large sample volumes 450 One advantage of an IP strategy is that the antibody-coated Matrix beads can 451 concentrate BoNT from highly dilute samples. We therefore tested the ability of the 452 BoTest Matrix A assay to detect highly diluted BoNT/A activity in a large sample 453 volume. Parallel assays were run on varying BoNT/A concentrations diluted into 454 either 200 µl or 15 ml PBS-t. After 4 h BoTest A/E reaction time, the EC50 for the 455
on June 3, 2018 by guesthttp://aem
.asm.org/
Dow
nloaded from
21
200 µl and 15 ml samples were 5.3 pM and 250 fM and LOD were 1 pM and 10 fM, 456 respectively (Fig. 7). The results demonstrate that the BoTest Matrix assay can 457 recover highly diluted BoNT/A from large sample volumes and that low femtomolar 458 assay LODs are possible with increased sample volume. 459 460 Discussion 461 The development of rapid, medium- to high-throughput assays to measure 462 BoNT activity in environmental, food, and pharmaceutical samples is of utmost 463 importance for patient, biodefense, and food safety as well as reducing government 464 and industry dependency on animal methods. Several in vitro BoNT detection assays 465 were reported in recent years that detect BoNT endopeptidase activity using 466 peptide substrates with fluorescence-, chromatography-, or mass-spectrometry-467 based outputs, some with sufficient sensitivity to be useful for diagnostic and food 468 testing purposes (5, 18, 28, 30, 40, 55). Notably, several publications detail the 469 coupling of mass spectrometry methods to immunological techniques resulting in 470 assays that detect BoNT in a wide range of substances with mouse bioassay 471 sensitivity (8, 13, 34, 46, 65). Indeed, these are the first assays described that can 472 detect multiple BoNT serotypes with demonstrated applicability to diagnostic 473 samples including fecal samples. Use of these methods, however, is limited to a few 474 qualified laboratories due to instrument and training requirements associated with 475 mass spectrometry-based readouts. Other reported assays lack the throughput 476 required for routine BoNT testing, are not applicable to multiple BoNT serotypes, or 477 have not been demonstrated to be applicable to complex sample testing. 478
on June 3, 2018 by guesthttp://aem
.asm.org/
Dow
nloaded from
22
The BoTest Matrix Assays offer several distinct advantages over existing 479 BoNT in vitro detection platforms (50). The BoTest Matrix assays can be executed 480 using instrumentation and techniques commonly found in government and 481 industrial laboratories. The only specific instrument requirement for the assays is a 482 microplate reader with ability to detect emission at two wavelengths, although a 483 magnetic-bead compatible plate washer greatly increases assay throughput. The 484 assays detect picomolar to sub-picomolar concentrations of BoNT in a wide variety 485 of matrices including pharmaceutical, human-derived, and food samples (Fig. 5 and 486 6). The assays are largely immune to sample composition with only minor protocol 487 modifications required to account for sample-specific characteristics (e.g. pH and 488 particulate matter). Finally, along with the recently reported BoTest Matrix E assay 489 (47), the BoTest Matrix assays offer coverage of the four BoNT serotypes most 490 relevant to human health, BoNT/A, B, E, and F (41). Thus, the BoTest Matrix assays 491 offer a single solution for human-related BoNT testing. 492 The BoTest Matrix assay also addresses many of the shortcomings of the 493 mouse bioassay, including high variability, long assay times, and the general use of 494 animals. The inter-assay and inter-laboratory CV of the mouse bioassay was 495 reported to be 20–40% (42, 56). Pharmaceutical testing laboratories overcome 496 these precision issues by using as many as 200 mice per sample which, combined 497 with a need to test product at many points during production, leads to very high 498 costs and animal usage. The BoTest Matrix assays, however, have inter- and intra-499 assay CVs of <10% (Fig. 4) utilizing 96-well plate formatting with assay times under 500 24 h. Thus, these assays can dramatically increase sample throughput while 501
on June 3, 2018 by guesthttp://aem
.asm.org/
Dow
nloaded from

23
reducing overall assay times. Finally, as an animal-free alternative for BoNT testing, 502 the BoTest Matrix assay can aid testing laboratories in conforming with recent US 503 and European government efforts to reduce animal use in manufacturing and 504 research including the European Unions ban on animal-testing in cosmetics and the 505 US Animal Welfare Act’s 3 Rs- reduction, refinement, and replacement (24). 506 Replacement of the mouse bioassay in drug product manufacturing alone would 507 result in a large reduction in animal usage as it is estimated 600,000 mice are used 508 during BoNT production each year (10). 509 The BoTest Matrix assays will not be applicable to all testing procedures, 510 applications that require assessments of BoNT’s ability to enter neurons and impair 511 synaptic activity will continue to rely animal testing until a suitable cell-based assay 512 is developed. However, there are many situations where animal testing is not 513 required. Examples include in-process BoNT-based drug substance manufacturing 514 (the mouse bioassay is required for final drug product) (61), bioterrorism or health 515 emergency events where BoNT detection needs to be completed in hours at 516 laboratories not qualified to run animal assays (16, 23), environmental sampling 517 where the cost of the mouse bioassay prevents the acquisition and analysis of 518 comprehensive data sets (47), and food challenge testing where scientists need to 519 determine the susceptibility of toxin production in food (57). The assays presented 520 in this study offer low cost, high-throughput, standardized methods that, for many 521 applications, are adequate as a testing end-point and can potentially replace most 522 pharmaceutical, biodefense, and diagnostic procedures where a quantitative 523 determination of BoNT presence is required. 524
on June 3, 2018 by guesthttp://aem
.asm.org/
Dow
nloaded from
24
The samples tested in this study represent a large cross-section of matrix 525 properties, from high fat (whole milk) and foodstuff (baby food) to clinical (human 526 serum) and a vector for a documented outbreak (carrot juice)(19). No clear 527 trending was observed towards one tested matrix being more difficult than another 528 and assay performance is expected to vary slightly from sample to sample. While it 529 is impossible to test all possible sample matrices, we were able to detect BoNT/A, B, 530 and F at mouse to near-mouse assay sensitivity in this broad matrix sampling with 531 small sample sizes (200 µL) (Fig.6). As demonstrated with PBS, increasing the 532 sample size should further increase assay sensitivity (Fig. 7). 533 The BoTest Matrix assays will ultimately require inter-lab validation and 534 studies using “real-world” samples to be accepted for many applications. For food 535 testing, as an example, food-challenge studies will be required to verify the ability of 536 the assay to detect BoNT produced by Clostridium, rather than more artificial 537 introductions, and ensure that assay sensitivity is sufficient. Such studies, if 538 successful, would empirically demonstrate the BoTest Matrix assay’s utility and 539 eventually lead to a viable, long-term replacement of current animal based methods. 540 541 Acknowledgements 542 The authors thank N. Mischler, W. Herbert, and K. Mack-Brandt for assistance with 543 obtaining BoTox® and J. Austin, D. Atapattu, and H. Olivares for valuable discussions 544 and advice. This research was supported in part by a NSF SBIR award (IIP-1127245 545 to BioSentinel Inc.) and a Department of Defense contract (W81XWH-07-2-0045 to 546
on June 3, 2018 by guesthttp://aem
.asm.org/
Dow
nloaded from
25
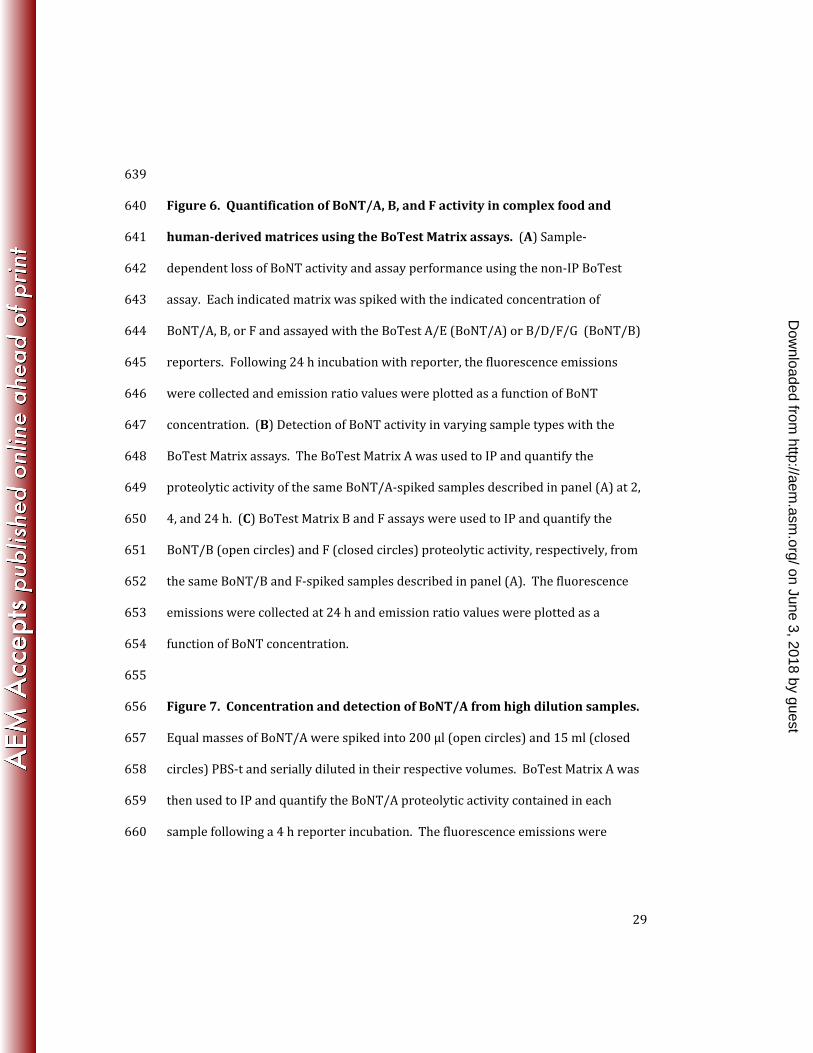
BioSentinel Inc.). T. Piazza is supported in part by the US Geological Survey (USGS) 547 National Wildlife Health Center and the National Park Service. 548 549 Use of trade, product, or firm names does not imply endorsement by the U.S. 550 government. 551 552 M. Dunning, D. Ruge, T. Piazza, F. Zeytin, and W. Tucker are employees or owners of 553 BioSentinel Inc. BioSentinel currently manufactures some of the reagents presented 554 in this report and intends to commercialize some or all of the methods presented 555 here. 556 557 Figure Legends 558 Figure 1. NaCl inhibits BoNT/A and B activity while HSA only significantly 559 affects BoNT/A activity. The indicated concentrations of BoNT/A (A, B) or 560 BoNT/B (C, D, E) holotoxin were incubated with the BoTest A/E (BoNT/A) or 561 BoTest B/D/F/G reporter (BoNT/B) in the presence of the indicated concentration 562 of HSA (A, C), NaCl (B, D), or Na-succinate pH 5.6 (E). Control samples (open 563 circles) were not supplemented with HSA, NaCl, or Na-succinate. Emission ratios 564 (526/470) were collected after a 4 h incubation. 565 566 Figure 2. Development of the BoTest Matrix Assays for the detection of 567 BoNT/A, B, and F in complex matrices. (A) Overview of the BoTest Matrix assays. 568 Anti-BoNT antibodies are conjugated to magnetic beads. Upon incubation with 569
on June 3, 2018 by guesthttp://aem
.asm.org/
Dow
nloaded from

26
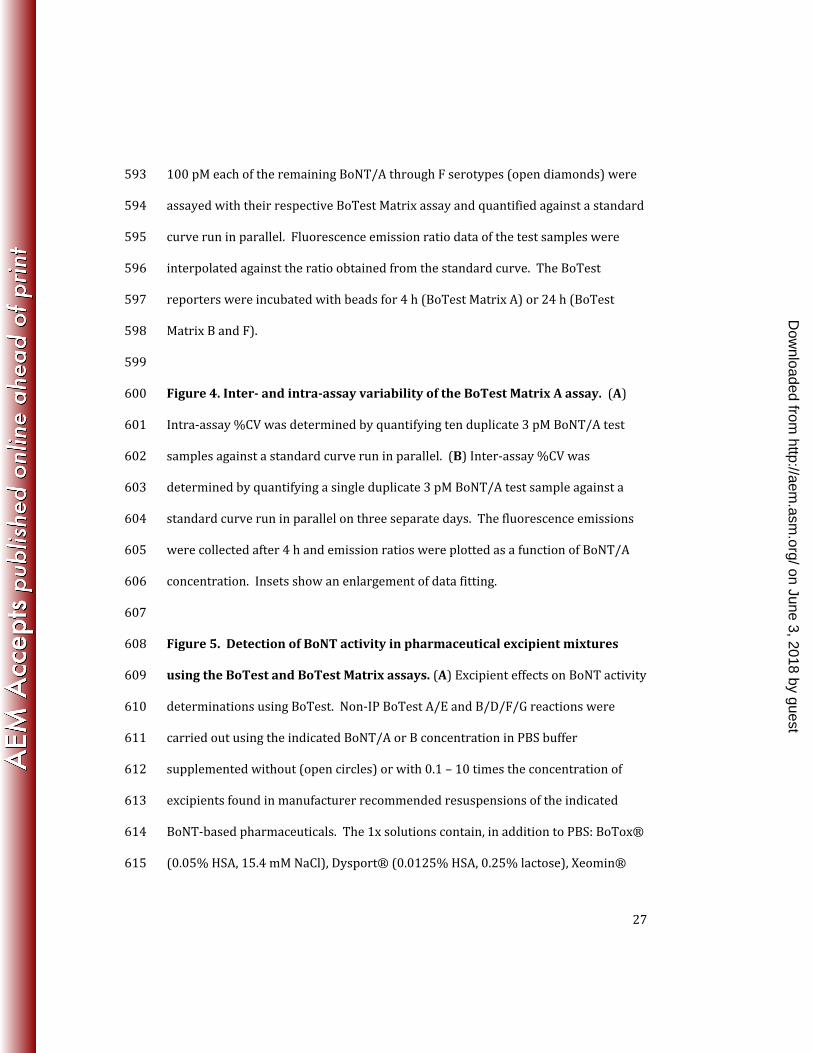
BoNT-containing samples, the beads bind BoNT from solution, fractionating the 570 toxin from unwanted matrix molecules that can then be removed by washing. The 571 proteolytic activity of the BoNT bound to the beads is then assayed with a BoTest 572 reporter. (B) Identification of anti-BoNT/A, B, and F antibodies that do not interfere 573 with BoNT proteolytic activity. The indicated antibodies were added at a 10 fold 574 molar excess to 100 pM BoNT/A or 1 nM BoNT/B or F and assayed with BoTest A/E 575 (BoNT/A) or BoTest B/D/F/G (BoNT/B and F) reporters. The fluorescent emission 576 ratios were collected every minute and plotted as a function of time. (C) Efficient IP 577 and recovery of BoNT/A, B, and F activity using the BoTest Matrix A, B, and F assays. 578 Magnetic beads coated with the appropriate anti-BoNT antibody (open circles) were 579 used to IP BoNT/A (left panel), B (middle), or F (right) from PBS followed by 580 washing and assaying with the appropriate BoTest reporter. Non-IP controls 581 (closed circles) were composed of identical concentrations of BoNT diluted into 582 BoTest Reaction Buffer and incubated with the BoTest reporter without IP. 583 584 Figure 3. Serotype specificity of the BoTest Matrix assays. (A) The indicated 585 BoTest Matrix assay was used to detect the indicated concentration of assay-specific 586 or non-specific BoNT. Fluoresce emissions were collected after 4 h for BoTest Matrix 587 A (24 h data in insert) or 24 h for BoTest Matrix B and F. Emission ratios were 588 plotted as a function of BoNT concentration. (B) Ability of the BoTest Matrix assays 589 to quantify assay-specific BoNT in a mixed background. Test samples containing a 590 known concentration of the assay-specific BoNT serotype (10 pM for BoTest Matrix 591 A, 100 pM for BoTest Matrix B and F) in the absence (closed circles) or presence of 592
on June 3, 2018 by guesthttp://aem
.asm.org/
Dow
nloaded from
27
100 pM each of the remaining BoNT/A through F serotypes (open diamonds) were 593 assayed with their respective BoTest Matrix assay and quantified against a standard 594 curve run in parallel. Fluorescence emission ratio data of the test samples were 595 interpolated against the ratio obtained from the standard curve. The BoTest 596 reporters were incubated with beads for 4 h (BoTest Matrix A) or 24 h (BoTest 597 Matrix B and F). 598 599 Figure 4. Inter- and intra-assay variability of the BoTest Matrix A assay. (A) 600 Intra-assay %CV was determined by quantifying ten duplicate 3 pM BoNT/A test 601 samples against a standard curve run in parallel. (B) Inter-assay %CV was 602 determined by quantifying a single duplicate 3 pM BoNT/A test sample against a 603 standard curve run in parallel on three separate days. The fluorescence emissions 604 were collected after 4 h and emission ratios were plotted as a function of BoNT/A 605 concentration. Insets show an enlargement of data fitting. 606 607 Figure 5. Detection of BoNT activity in pharmaceutical excipient mixtures 608 using the BoTest and BoTest Matrix assays. (A) Excipient effects on BoNT activity 609 determinations using BoTest. Non-IP BoTest A/E and B/D/F/G reactions were 610 carried out using the indicated BoNT/A or B concentration in PBS buffer 611 supplemented without (open circles) or with 0.1 – 10 times the concentration of 612 excipients found in manufacturer recommended resuspensions of the indicated 613 BoNT-based pharmaceuticals. The 1x solutions contain, in addition to PBS: BoTox® 614 (0.05% HSA, 15.4 mM NaCl), Dysport® (0.0125% HSA, 0.25% lactose), Xeomin® 615
on June 3, 2018 by guesthttp://aem
.asm.org/
Dow
nloaded from

28
(0.1% HSA, 0.47% sucrose), Myobloc® (0.05% HSA, 100 mM NaCl, 10 mM Na-616 succinate, pH 5.6). Fluorescence emission were collected after 4 h (BoTest Matrix 617 A) or 24 h (BoTest Matrix B) and emission ratio values were plotted as a function of 618 BoNT concentration. (B) BoTest Matrix A was used to IP the indicated BoNT/A 619 concentrations in either PBS (open circles) or PBS spiked with 0.1 – 10 times the 620 combined highest concentration of each excipient present in the BoNT/A 621 pharmaceutical formulations tested in panel (A). The 1x solution contains, in 622 addition to PBS: 0.1% HSA, 15.4 mM NaCl, 0.25% lactose, and 0.47% sucrose. (C) 623 BoTest Matrix B was used to IP the indicated BoNT/B concentration from either PBS 624 (open circles) or PBS spiked with 0.1 – 10 times the concentrations of each excipient 625 found in Myobloc®. In (B) and (C), the fluorescence emissions were collect at 4 h 626 (BoTest Matrix A) or 24 h (BoTest Matrix B) and emission ratio values were plotted 627 as a function of BoNT concentration. (D) Protein blot analysis was run on the 10 nM 628 and 10 pM BoNT/A fractions generated in (B) and probed with anti-BoNT/A (10nM 629 samples) or anti-HSA antibody (10 pM samples). Fractions include the untreated 630 input, the post-IP supernatant (non bound), post BoTest assay supernatant (BoTest 631 assay), and the post-IP beads. The position of the BoNT heavy chain (HC) and light 632 chain (LC) are indicated by open and closed arrows, the position of HSA is indicated 633 by an open arrow. (E) Detection of BoNT/A activity contained in BoTox® using the 634 BoTest Matrix A assay. A single vial of BoTox® drug product was resuspended, 635 serially diluted, and assayed with BoTest Matrix A. The fluorescence emissions 636 were collected at the indicated times and the emission ratio values plotted as a 637 function of vial label-defined units. 638
on June 3, 2018 by guesthttp://aem
.asm.org/
Dow
nloaded from
29
639 Figure 6. Quantification of BoNT/A, B, and F activity in complex food and 640 human-derived matrices using the BoTest Matrix assays. (A) Sample-641 dependent loss of BoNT activity and assay performance using the non-IP BoTest 642 assay. Each indicated matrix was spiked with the indicated concentration of 643 BoNT/A, B, or F and assayed with the BoTest A/E (BoNT/A) or B/D/F/G (BoNT/B) 644 reporters. Following 24 h incubation with reporter, the fluorescence emissions 645 were collected and emission ratio values were plotted as a function of BoNT 646 concentration. (B) Detection of BoNT activity in varying sample types with the 647 BoTest Matrix assays. The BoTest Matrix A was used to IP and quantify the 648 proteolytic activity of the same BoNT/A-spiked samples described in panel (A) at 2, 649 4, and 24 h. (C) BoTest Matrix B and F assays were used to IP and quantify the 650 BoNT/B (open circles) and F (closed circles) proteolytic activity, respectively, from 651 the same BoNT/B and F-spiked samples described in panel (A). The fluorescence 652 emissions were collected at 24 h and emission ratio values were plotted as a 653 function of BoNT concentration. 654 655 Figure 7. Concentration and detection of BoNT/A from high dilution samples. 656 Equal masses of BoNT/A were spiked into 200 µl (open circles) and 15 ml (closed 657 circles) PBS-t and serially diluted in their respective volumes. BoTest Matrix A was 658 then used to IP and quantify the BoNT/A proteolytic activity contained in each 659 sample following a 4 h reporter incubation. The fluorescence emissions were 660
on June 3, 2018 by guesthttp://aem
.asm.org/
Dow
nloaded from
30
collected and emission ratio values plotted as a function of BoNT/A concentration in 661 each dilution. 662 663 References 664 1. AOAC International. 2001. AOAC International, Clostridium botulinum and 665 its toxins in foods (method 977.26 section 17.7.01), Gaithersburg, MD. 666 2. Arnon, S. S. 1980. Honey, infant botulism and the sudden infant death 667 syndrome. West J Med 132:58-9. 668 3. Arnon, S. S. 1980. Infant botulism. Annu Rev Med 31:541-60. 669 4. Arnon, S. S., R. Schechter, T. V. Inglesby, D. A. Henderson, J. G. Bartlett, M. 670
S. Ascher, E. Eitzen, A. D. Fine, J. Hauer, M. Layton, S. Lillibridge, M. T. 671 Osterholm, T. O'Toole, G. Parker, T. M. Perl, P. K. Russell, D. L. Swerdlow, 672 and K. Tonat. 2001. Botulinum toxin as a biological weapon: medical and 673 public health management. JAMA 285:1059-70. 674 5. Bagramyan, K., J. R. Barash, S. S. Arnon, and M. Kalkum. 2008. Attomolar 675 detection of botulinum toxin type A in complex biological matrices. PLoS One 676 3:e2041. 677 6. Balls, M. 2003. Botulinum toxin testing in animals: the questions remain 678 unanswered. Altern Lab Anim 31:611-5. 679 7. Balls, M. 2010. Replacing the animal testing of botulinum toxin: time to 680 smooth out the wrinkles. Altern Lab Anim 38:1-2. 681
on June 3, 2018 by guesthttp://aem
.asm.org/
Dow
nloaded from

31
8. Barr, J. R., H. Moura, A. E. Boyer, A. R. Woolfitt, S. R. Kalb, A. Pavlopoulos, 682 L. G. McWilliams, J. G. Schmidt, R. A. Martinez, and D. L. Ashley. 2005. 683 Botulinum neurotoxin detection and differentiation by mass spectrometry. 684 Emerg Infect Dis 11:1578-83. 685 9. Benecke, R., and D. Dressler. 2007. Botulinum toxin treatment of axial and 686 cervical dystonia. Disabil Rehabil 29:1769-77. 687 10. Bitz, S. 2010. The botulinum neurotoxin LD50 test - problems and solutions. 688 ALTEX 27:114-6. 689 11. Blasi, J., E. R. Chapman, E. Link, T. Binz, S. Yamasaki, P. De Camilli, T. C. 690 Sudhof, H. Niemann, and R. Jahn. 1993. Botulinum neurotoxin A selectively 691 cleaves the synaptic protein SNAP-25. Nature 365:160-3. 692 12. Blasi, J., E. R. Chapman, S. Yamasaki, T. Binz, H. Niemann, and R. Jahn. 693 1993. Botulinum neurotoxin C1 blocks neurotransmitter release by means of 694 cleaving HPC-1/syntaxin. EMBO J 12:4821-8. 695 13. Boyer, A. E., H. Moura, A. R. Woolfitt, S. R. Kalb, L. G. McWilliams, A. 696 Pavlopoulos, J. G. Schmidt, D. L. Ashley, and J. R. Barr. 2005. From the 697 mouse to the mass spectrometer: detection and differentiation of the 698 endoproteinase activities of botulinum neurotoxins A-G by mass 699 spectrometry. Anal Chem 77:3916-24. 700 14. Brin, M. F., and A. Blitzer. 1993. Botulinum toxin: dangerous terminology 701 errors. J R Soc Med 86:493-4. 702 15. Brook, I. 2007. Infant botulism. J Perinatol 27:175-80. 703
on June 3, 2018 by guesthttp://aem
.asm.org/
Dow
nloaded from

32
16. Broussard, L. A. 2001. Biological agents: weapons of warfare and 704 bioterrorism. Mol Diagn 6:323-33. 705 17. Cai, S., B. R. Singh, and S. Sharma. 2007. Botulism diagnostics: from clinical 706 symptoms to in vitro assays. Crit Rev Microbiol 33:109-25. 707 18. Capek, P., and T. J. Dickerson. 2010. Sensing the deadliest toxin: 708 technologies for botulinum neurotoxin detection. Toxins (Basel) 2:24-53. 709 19. Centers for Disease Control and Prevention. 2006. Botulism associated 710 with commercial carrot juice--Georgia and Florida, September 2006. MMWR 711 Morb Mortal Wkly Rep 55:1098-9. 712 20. DasGupta, B. R., D. A. Boroff, and K. Cheong. 1968. Isolation of 713 chromatographically pure toxin of Clostridium botulinum type B. Biochem 714 Biophys Res Commun 32:1057-63. 715 21. Dmochowski, R., and P. K. Sand. 2007. Botulinum toxin A in the overactive 716 bladder: current status and future directions. BJU Int 99:247-62. 717 22. Eisele, K. H., K. Fink, M. Vey, and H. V. Taylor. 2011. Studies on the 718 dissociation of botulinum neurotoxin type A complexes. Toxicon 57:555-65. 719 23. Eubanks, L. M., T. J. Dickerson, and K. D. Janda. 2007. Technological 720 advancements for the detection of and protection against biological and 721 chemical warfare agents. Chem Soc Rev 36:458-70. 722 24. European Union. 2003. Directive 2003/15/EC of the European Parliament 723 and of the Council. Official Journal of the European Union. 724
on June 3, 2018 by guesthttp://aem
.asm.org/
Dow
nloaded from

33
25. Ferreira, J. L. 2001. Comparison of amplified ELISA and mouse bioassay 725 procedures for determination of botulinal toxins A, B, E, and F. J AOAC Int 726 84:85-8. 727 26. Foster, K. A. 2009. Engineered toxins: new therapeutics. Toxicon 54:587-92. 728 27. Gill, D. M. 1982. Bacterial toxins: a table of lethal amounts. Microbiol Rev 729 46:86-94. 730 28. Gilmore, M. A., D. Williams, Y. Okawa, B. Holguin, N. G. James, J. A. Ross, 731 K. Roger Aoki, D. M. Jameson, and L. E. Steward. 2011. Depolarization after 732 resonance energy transfer (DARET): a sensitive fluorescence-based assay for 733 botulinum neurotoxin protease activity. Anal Biochem 413:36-42. 734 29. Gu, S., S. Rumpel, J. Zhou, J. Strotmeier, H. Bigalke, K. Perry, C. B. 735 Shoemaker, A. Rummel, and R. Jin. 2012. Botulinum neurotoxin is shielded 736 by NTNHA in an interlocked complex. Science 335:977-81. 737 30. Hines, H. B., A. D. Kim, R. G. Stafford, S. S. Badie, E. E. Brueggeman, D. J. 738 Newman, and J. J. Schmidt. 2008. Use of a recombinant fluorescent 739 substrate with cleavage sites for all botulinum neurotoxins in high-740 throughput screening of natural product extracts for inhibitors of serotypes 741 A, B, and E. Appl Environ Microbiol 74:653-9. 742 31. Hunt, T., and K. Clarke. 2009. Potency evaluation of a formulated drug 743 product containing 150-kd botulinum neurotoxin type A. Clin 744 Neuropharmacol 32:28-31. 745
on June 3, 2018 by guesthttp://aem
.asm.org/
Dow
nloaded from
34
32. ICCVAM. 2008. Report on the ICCVAM-NICEATM/ECVAM Scientific 746 Workshop on Alternative Methods to Refine, Reduce or Replace the Mouse 747 LD50 Assay for Botulinum Toxin Testing 08-6416. NIH. 748 33. Inoue, K., Y. Fujinaga, T. Watanabe, T. Ohyama, K. Takeshi, K. Moriishi, 749 H. Nakajima, and K. Oguma. 1996. Molecular composition of Clostridium 750 botulinum type A progenitor toxins. Infect Immun 64:1589-94. 751 34. Kalb, S. R., H. Moura, A. E. Boyer, L. G. McWilliams, J. L. Pirkle, and J. R. 752 Barr. 2006. The use of Endopep-MS for the detection of botulinum toxins A, 753 B, E, and F in serum and stool samples. Anal Biochem 351:84-92. 754 35. Lacy, D. B., and R. C. Stevens. 1999. Sequence homology and structural 755 analysis of the clostridial neurotoxins. J Mol Biol 291:1091-104. 756 36. Lebeda, F. J., R. Z. Cer, U. Mudunuri, R. Stephens, B. R. Singh, and M. 757 Adler. 2010. The zinc-dependent protease activity of the botulinum 758 neurotoxins. Toxins (Basel) 2:978-97. 759 37. Lindstrom, M., and H. Korkeala. 2006. Laboratory diagnostics of botulism. 760 Clin Microbiol Rev 19:298-314. 761 38. Malizio, C. J., M. C. Goodnough, and E. A. Johnson. 2000. Purification of 762 Clostridium botulinum type A neurotoxin. Methods Mol Biol 145:27-39. 763 39. Marchetti, A., R. Magar, L. Findley, J. P. Larsen, Z. Pirtosek, E. Ruzicka, R. 764 Jech, J. Slawek, and F. Ahmed. 2005. Retrospective evaluation of the dose of 765 Dysport and BOTOX in the management of cervical dystonia and 766 blepharospasm: the REAL DOSE study. Mov Disord 20:937-44. 767
on June 3, 2018 by guesthttp://aem
.asm.org/
Dow
nloaded from
35
40. Mason, J. T., L. Xu, Z. M. Sheng, and T. J. O'Leary. 2006. A liposome-PCR 768 assay for the ultrasensitive detection of biological toxins. Nat Biotechnol 769 24:555-7. 770 41. McLauchlin, J., K. A. Grant, and C. L. Little. 2006. Food-borne botulism in 771 the United Kingdom. J Public Health (Oxf) 28:337-42. 772 42. McLellan, K., R. E. Das, T. A. Ekong, and D. Sesardic. 1996. Therapeutic 773 botulinum type A toxin: factors affecting potency. Toxicon 34:975-85. 774 43. Montal, M. 2010. Botulinum neurotoxin: a marvel of protein design. Annu 775 Rev Biochem 79:591-617. 776 44. Montecucco, C., and G. Schiavo. 1994. Mechanism of action of tetanus and 777 botulinum neurotoxins. Mol Microbiol 13:1-8. 778 45. Montecucco, C., and G. Schiavo. 1995. Structure and function of tetanus and 779 botulinum neurotoxins. Q Rev Biophys 28:423-72. 780 46. Parks, B. A., J. D. Shearer, J. Baudys, S. R. Kalb, D. C. Sanford, J. L. Pirkle, 781 and J. R. Barr. 2011. Quantification of botulinum neurotoxin serotypes A and 782 B from serum using mass spectrometry. Anal Chem 83:9047-53. 783 47. Piazza, T. M., D. S. Blehert, F. M. Dunning, B. M. Berlowski-Zier, F. N. 784 Zeytin, M. D. Samuel, and W. C. Tucker. 2011. In vitro detection and 785 quantification of botulinum neurotoxin type e activity in avian blood. Appl 786 Environ Microbiol 77:7815-22. 787 48. Pickett, A., and K. Perrow. 2011. Towards new uses of botulinum toxin as a 788 novel therapeutic tool. Toxins (Basel) 3:63-81. 789
on June 3, 2018 by guesthttp://aem
.asm.org/
Dow
nloaded from
36
49. Rossetto, O., G. Schiavo, C. Montecucco, B. Poulain, F. Deloye, L. Lozzi, 790 and C. C. Shone. 1994. SNARE motif and neurotoxins. Nature 372:415-6. 791 50. Ruge, D. R., F. M. Dunning, T. M. Piazza, B. E. Molles, M. Adler, F. N. Zeytin, 792 and W. C. Tucker. 2011. Detection of six serotypes of botulinum neurotoxin 793 using fluorogenic reporters. Anal Biochem 411:200-9. 794 51. Schantz, E. J., and D. A. Kautter. 1978. Microbiological methods: 795 standardized assay for Clostridium botulinum toxins. J AOAC 61:96-9. 796 52. Schiavo, G., C. Malizio, W. S. Trimble, P. Polverino de Laureto, G. Milan, 797 H. Sugiyama, E. A. Johnson, and C. Montecucco. 1994. Botulinum G 798 neurotoxin cleaves VAMP/synaptobrevin at a single Ala-Ala peptide bond. J 799 Biol Chem 269:20213-6. 800 53. Schiavo, G., O. Rossetto, F. Benfenati, B. Poulain, and C. Montecucco. 801 1994. Tetanus and botulinum neurotoxins are zinc proteases specific for 802 components of the neuroexocytosis apparatus. Ann N Y Acad Sci 710:65-75. 803 54. Schiavo, G., O. Rossetto, S. Catsicas, P. Polverino de Laureto, B. R. 804 DasGupta, F. Benfenati, and C. Montecucco. 1993. Identification of the 805 nerve terminal targets of botulinum neurotoxin serotypes A, D, and E. J Biol 806 Chem 268:23784-7. 807 55. Scotcher, M. C., L. W. Cheng, and L. H. Stanker. 2010. Detection of 808 botulinum neurotoxin serotype B at sub mouse LD(50) levels by a sandwich 809 immunoassay and its application to toxin detection in milk. PLoS One 810 5:e11047. 811
on June 3, 2018 by guesthttp://aem
.asm.org/
Dow
nloaded from
37
56. Sesardic, D., T. Leung, and R. Gaines Das. 2003. Role for standards in 812 assays of botulinum toxins: international collaborative study of three 813 preparations of botulinum type A toxin. Biologicals 31:265-76. 814 57. Sharma, S. K., and R. C. Whiting. 2005. Methods for detection of Clostridium 815 botulinum toxin in foods. J Food Prot 68:1256-63. 816 58. Sinha, D., K. Karri, and A. S. Arunkalaivanan. 2007. Applications of 817 Botulinum toxin in urogynaecology. Eur J Obstet Gynecol Reprod Biol 133:4-818 11. 819 59. Sloop, R. R., B. A. Cole, and R. O. Escutin. 1997. Human response to 820 botulinum toxin injection: type B compared with type A. Neurology 49:189-821 94. 822 60. Sobel, J. 2005. Botulism. Clin Infect Dis 41:1167-73. 823 61. Straughan, D. 2006. Progress in applying the Three Rs to the potency testing 824 of Botulinum toxin type A. Altern Lab Anim 34:305-13. 825 62. Sugii, S., and G. Sakaguchi. 1975. Molecular construction of Clostridium 826 botulinum type A toxins. Infect Immun 12:1262-70. 827 63. Sugishima, M. 2003. Aum Shinrikyo and the Japanese law on bioterrorism. 828 Prehosp Disaster Med 18:179-83. 829 64. Tonello, F., S. Morante, O. Rossetto, G. Schiavo, and C. Montecucco. 1996. 830 Tetanus and botulism neurotoxins: a novel group of zinc-endopeptidases. 831 Adv Exp Med Biol 389:251-60. 832
on June 3, 2018 by guesthttp://aem
.asm.org/
Dow
nloaded from

38
65. Wang, D., J. Baudys, S. R. Kalb, and J. R. Barr. 2011. Improved detection of 833 botulinum neurotoxin type A in stool by mass spectrometry. Anal Biochem 834 412:67-73. 835 66. Wohlfarth, K., T. Sycha, D. Ranoux, H. Naver, and D. Caird. 2009. Dose 836 equivalence of two commercial preparations of botulinum neurotoxin type A: 837 time for a reassessment? Curr Med Res Opin 25:1573-84. 838 67. Yamasaki, S., A. Baumeister, T. Binz, J. Blasi, E. Link, F. Cornille, B. 839 Roques, E. M. Fykse, T. C. Sudhof, R. Jahn, and et al. 1994. Cleavage of 840 members of the synaptobrevin/VAMP family by types D and F botulinal 841 neurotoxins and tetanus toxin. J Biol Chem 269:12764-72. 842 68. Yang, K. H., and H. Sugiyama. 1975. Purification and properties of 843 Clostridium botulinum type F toxin. Appl Microbiol 29:598-603. 844 69. Zilinskas, R. A. 1997. Iraq's biological weapons. The past as future? JAMA 845 278:418-24. 846 847 848
on June 3, 2018 by guesthttp://aem
.asm.org/
Dow
nloaded from

A
0.5
1.0
1.5
2.0
2.5
3.0
em
iss
ion
ra
tio
(Em
52
6/E
m4
70
)
10-13
10-12
10-11
10-10
10-9
10-8
Control0.005% HSA0.025% HSA0.05% HSA0.25% HSA0.5% HSA
[BoNT/A] (M)
B
Control5mM NaCl15.4mm NaCl50mM NaCl100mM NaCl154mM NaCl
0.5
1.0
1.5
2.0
2.5
3.0
em
iss
ion
ra
tio
(Em
52
6/E
m4
70
)
10-13
10-12
10-11
10-10
10-9
10-8
[BoNT/A] (M)
0.5
1.5
2.5
3.5
4.5
Control0.005% HSA0.025% HSA0.05% HSA0.25% HSA0.5% HSA
10-13
10-11
10-9
10
[BoNT/B] (M)
-7
C D
em
iss
ion
ra
tio
(Em
52
6/E
m4
70
)
0.5
1.5
2.5
3.5
4.5
Control10 mM NaCl50 mM NaCl100 mM NaCl500 mM NaCl1 M NaCl
10-13
10-11
10-9
10
[BoNT/B] (M)
-7
em
iss
ion
ra
tio
(Em
52
6/E
m4
70
)
FIG. 1. NaCl inhibits BoNT/A and B activity while HSA only significantly affects BoNT/A activity. The
indicated concentrations of BoNT/A (A, B) or BoNT/B (C, D, E) holotoxin were incubated with the BoTest™
A/E (BoNT/A) or BoTest™ B/D/F/G reporter (BoNT/B) in the presence of the indicated concentration of
HSA (A, C), NaCl (B, D), or Na-succinate pH 5.6 (E). Control samples (open circles) were not supple-
mented with HSA, NaCl, or Na-succinate. Emission ratios (526/470) were collected after a 4 h incubation.
E
0.5
1.5
2.5
3.5
4.5
10-13
10-11
10-9
10
[BoNT/B] (M)
-7
Control1 mM Na-succinate, pH 5.65 mM Na-succinate10 mM Na-succinate50 mM Na-succinate100 mM Na-succinate
em
iss
ion
ra
tio
(Em
52
6/E
m4
70
)
on June 3, 2018 by guesthttp://aem
.asm.org/
Dow
nloaded from
0 10 20 30 40 50 600.5
1.0
1.5
2.0
2.5
Time (min)
em
iss
ion
ra
tio
(Em
52
6/E
m4
70
)
anti-HcR/F IgYNon-IP Control
B
0.5
1.5
2.5
3.5
4.5
0 10 20 30 40 50 60Time (min)
BoTest™
Magnetic
Bead
Excipients
BoNT
anti-BoNT AntibodyBind/wash Assay
A
anti-BoNT/BNon-IP Control
0.5
1.5
2.5
3.5
4.5
0 10 20 30 40 50 60Time (min)
anti-HcR/A IgY
No Antibody
No BoNT/A
anti-HcR/F IgY
No Antibody
No BoNT/F
anti-BoNT/B
No Antibody
No BoNT/B
C
[BoNT/B] (M)10
-1310
-1210
-1110
-1010
-90.5
1.5
2.5
3.5
[BoNT/F] (M)10
-1310
-1210
-1110
-1010
-90.5
1.5
2.5
3.5
em
iss
ion
ra
tio
(Em
52
6/E
m4
70
)
0.5
1.0
1.5
2.0
2.5
[BoNT/A] (M)10
-1310
-1210
-1110
-1010
-9
anti-HcR/A IgYNon-IP Control
BoNT/A BoNT/FBoNT/B
FIG. 2. Development of the BoTest Matrix Assays for the detection of BoNT/A, B, and F in complex
matrices. (A) Overview of the BoTest™ Matrix assays. Anti-BoNT antibodies are conjugated to magnetic
beads. Upon incubation with BoNT-containing samples, the beads bind BoNT from solution, fractionating
the toxin from unwanted matrix molecules that can then be removed by washing. The proteolytic activity
of the BoNT bound to the beads is then assayed with a BoTest™ reporter. (B) Identification of anti-
BoNT/A, B, and F antibodies that do not interfere with BoNT proteolytic activity. The indicated antibodies
were added at a 10 fold molar excess to 100 pM BoNT/A or 1 nM BoNT/B or F and assayed with BoTest
™ A/E (BoNT/A) or BoTest™ B/D/F/G (BoNT/B and F) reporters. The fluorescent emission ratios were
collected every minute and plotted as a function of time. (C) Efficient IP and recovery of BoNT/A, B, and
F activity using the BoTest™ Matrix A, B, and F assays. Magnetic beads coated with the appropriate
anti-BoNT antibody (open circles) were used to IP BoNT/A (left panel), B (middle), or F (right) from PBS
followed by washing and assaying with the appropriate BoTest™ reporter. Non-IP controls (closed
circles) were composed of identical concentrations of BoNT diluted into BoTest™ Reaction Buffer and
incubated with the BoTest™ reporter without IP.
on June 3, 2018 by guesthttp://aem
.asm.org/
Dow
nloaded from

A
B
Matrix A Matrix B
Standard CurveBoNT/A AloneBoNT/A Mixed
Matrix A
[BoNT/A] (M)
em
iss
ion
ra
tio
(Em
52
6/E
m4
70
)
10-13
10-12
10-11
10-10
10-9
0.5
1.0
1.5
2.0
2.5
3.0
Standard CurveBoNT/B AloneBoNT/B Mixed
Matrix B
[BoNT/B] (M)
0.5
1.5
2.5
3.5
10-13
10-12
10-11
10-10
10-9
Standard CurveBoNT/F AloneBoNT/F Mixed
Matrix F
[BoNT/F] (M)
0.5
1.5
2.5
3.5
10-13
10-12
10-11
10-10
10-9
BoNT/ABoNT/CBoNT/E
[BoNT] (M)
em
iss
ion
ra
tio
(Em
52
6/E
m4
70
)
10-13
10-12
10-11
10-10
10-9
0.5
1.0
1.5
2.0
2.5
3.0
BoNT/BBoNT/DBoNT/F
[BoNT] (M)
0.5
1.5
2.5
3.5
10-13
10-12
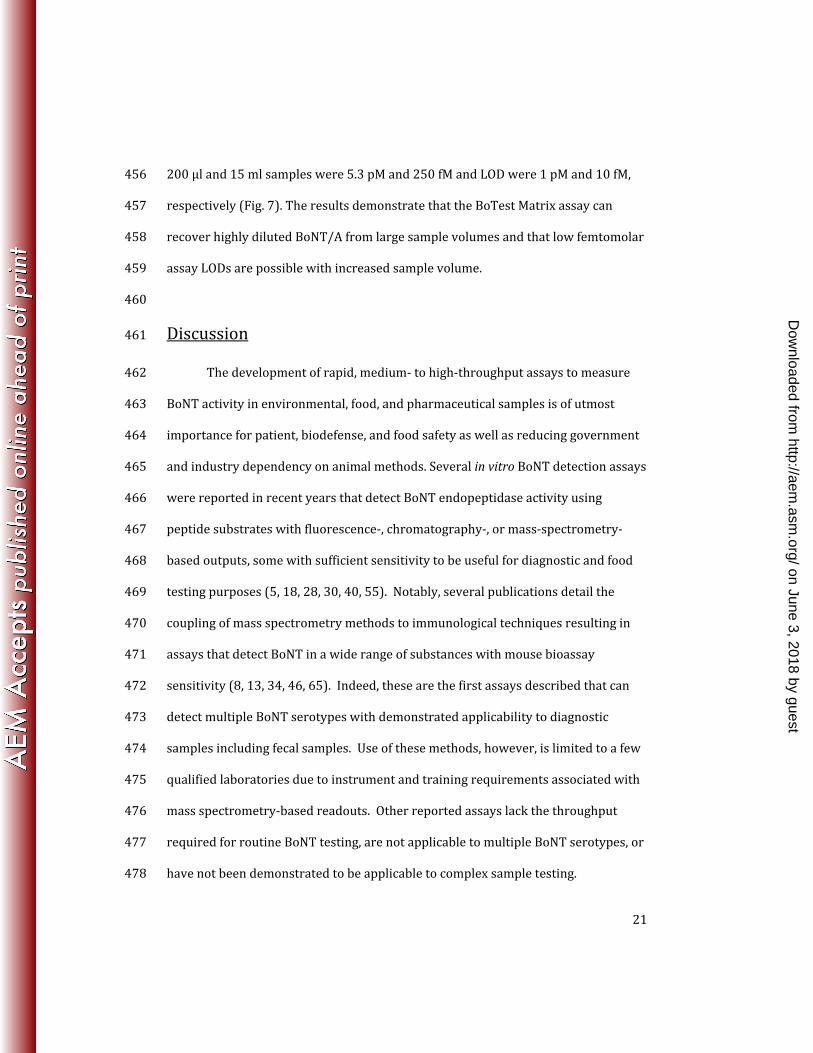
10-11
10-10
10-9
[BoNT] (M)
0.5
1.5
2.5
3.5
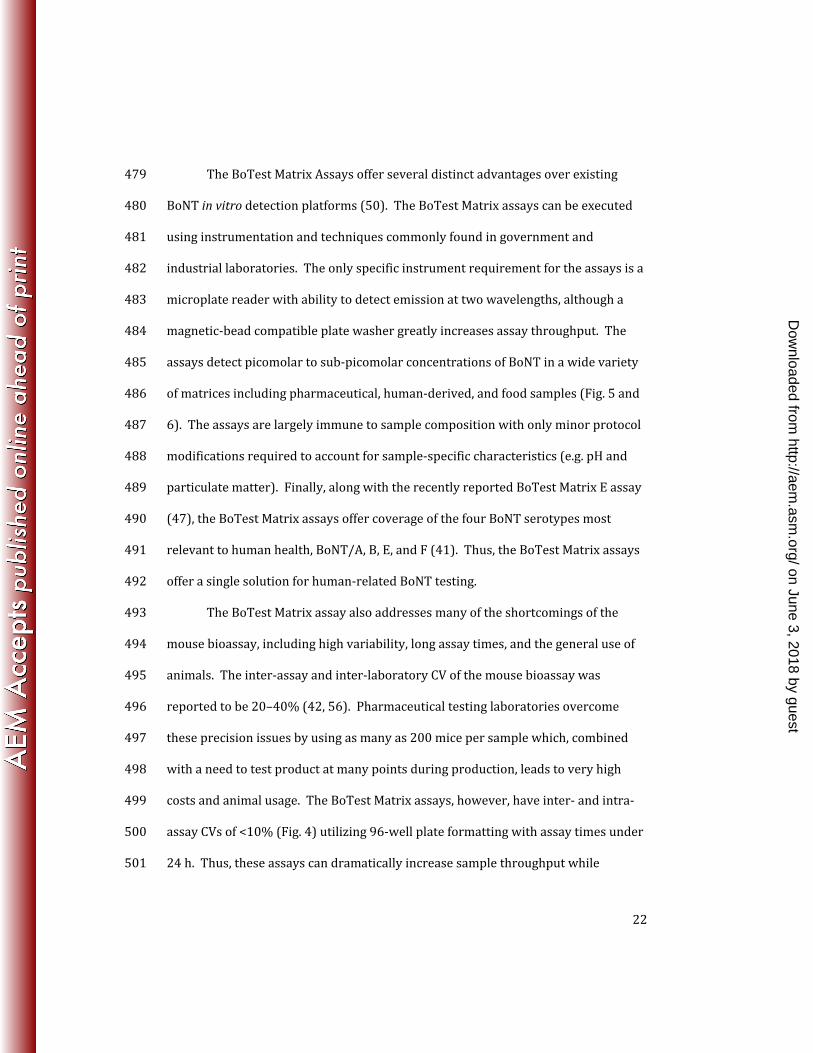
10-13
10-12
10-11
10-10
10-9
Matrix F
BoNT/FBoNT/BBoNT/D
FIG. 3. Serotype specificity of the BoTest™ Matrix assays. (A) The indicated BoTest Matrix assay was
used to detect the indicated concentration of assay-specific or non-specific BoNT. Fluoresce emissions
were collected after 4 h for BoTest™ Matrix A (24 h data in insert) or 24 h for BoTest™ Matrix B and F.
Emission ratios were plotted as a function of BoNT concentration. (B) Ability of the BoTest™ Matrix
assays to quantify assay-specific BoNT in a mixed background. Test samples containing a known
concentration of the assay-specific BoNT serotype (10 pM for BoTest™ Matrix A, 100 pM for BoTest™
Matrix B and F) in the absence (closed circles) or presence of 100 pM each of the remaining BoNT/A
through F serotypes (open diamonds) were assayed with their respective BoTest™ Matrix assay and
quantified against a standard curve run in parallel. Fluorescence emission ratio data of the test samples
were interpolated against the ratio obtained from the standard curve. The BoTest™ reporters were
incubated with beads for 4 h (BoTest™ Matrix A) or 24 h (BoTest™ Matrix B and F).
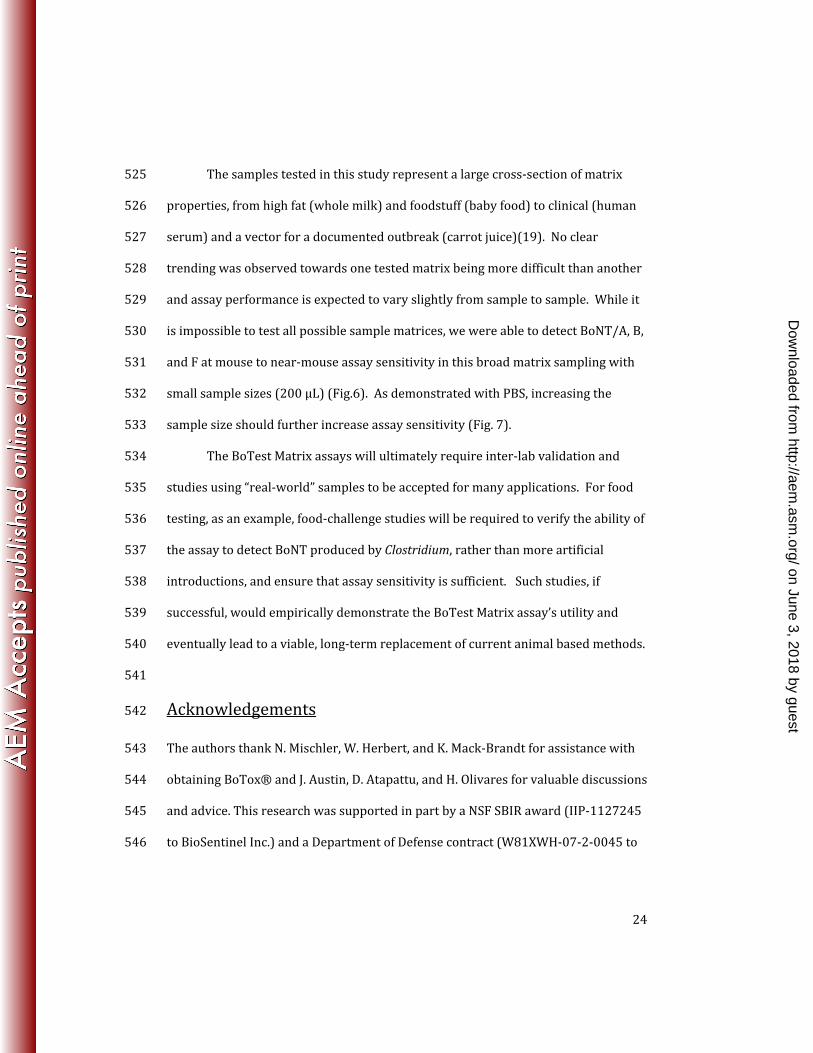
on June 3, 2018 by guesthttp://aem
.asm.org/
Dow
nloaded from

A B
Standard Curve, Day 1Standard Curve, Day 2Standard Curve, Day 3Test Sample, Day 1Test Sample, Day 2Test Sample, Day 3
10-12
10-111.5
2.0
Inter-Assay
%CV 5.81
[BoNT/A] (M)
em
iss
ion
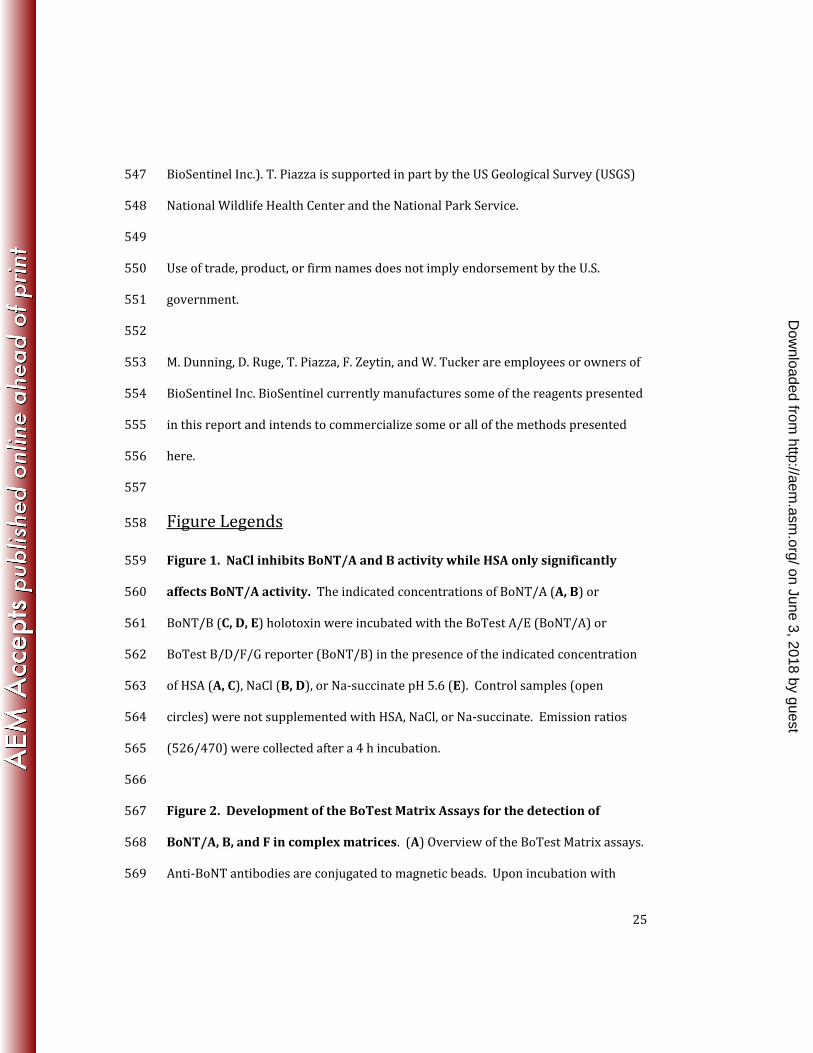
ra
tio
(Em
52
6/E
m4
70
)
10-13
10-12
10-11
10-10
10-9
0.5
1.0
1.5
2.0
2.5
Standard CurveTest Samples
1.5
2.0
10-12
10-11
Intra-Assay
%CV 7.33
[BoNT/A] (M)
em
iss
ion
ra
tio
(Em
52
6/E
m4
70
)
10-13
10-12
10-11
10-10
10-9
0.5
1.0
1.5
2.0
2.5
FIG. 4. Inter- and intra-assay variability of the BoTest™ Matrix A assay. (A) Intra-assay %CV was
determined by quantifying ten duplicate 3 pM BoNT/A test samples against a standard curve run in
parallel. (B) Inter-assay %CV was determined by quantifying a single duplicate 3 pM BoNT/A test
sample against a standard curve run in parallel on three separate days. The fluorescence emissions
were collected after 4 h and emission ratios were plotted as a function of BoNT/A concentration. Insets
show an enlargement of data fitting.
on June 3, 2018 by guesthttp://aem
.asm.org/
Dow
nloaded from
em
iss
ion
ra
tio
(Em
52
6/E
m4
70
)Mock-BoTox® Mock-Dysport®
[BoNT/A] (M)
Mock-Xeomin®
B
A
D
[BoNT/B] (M)
Mock-Myobloc®
CMatrix B
10x Excipients5x Excipients1x Excipients0.5x Excipients0.1x ExcipientsNo Excipients
[BoNT/B] (M)10
-1310
-1210
-1110
-1010
-90.5
1.5
2.5
3.5e
mis
sio
n r
ati
o
(Em
52
6/E
m4
70
)
Matrix A
0.5
1.0
1.5
2.0
2.5
3.0
[BoNT/A] (M)10
-1310
-1210
-1110
-1010
-9
em
iss
ion
ra
tio
(Em
52
6/E
m4
70
)
10x Excipients5x Excipients1x Excipients0.5x Excipients0.1x ExcipientsNo Excipients
250 100 75
50 37
25 20
15
10
kD
1x Excipients
Inp
ut
No
n-B
ou
nd
Bo
Te
st A
ssa
y
Be
ad
s
200 116.3
97.4
66.2
45
31
21.5
kD
1x Excipients
Inp
ut
No
n-B
ou
nd
Bo
Te
st A
ssa
y
Be
ad
s
anti-BoNT/A anti-HSA
0.5
1.5
2.5
3.5
4.5
10-13
10-12
10-11
10-10
10-9
[BoNT/A] (M)
-90.5
1.0
1.5
2.0
2.5
3.0
10-13
10-12
10-11
10-10
10
Control0.1x Excipients1x Excipients10x Excipients
0.5
1.0
1.5
2.0
2.5
3.0
10-13
10-12
10-11
10-10
10-9
[BoNT/A] (M)
0.5
1.0
1.5
2.0
2.5
3.0
10-13
10-12
10-11
10-10
10-9
EBoTox®
0 5 10 15 20 250.5
1.0
1.5
2.0
2.5
3.0
30 Minutes1 Hour2 Hours4 Hours24 Hours
Units
em
iss
ion
ra
tio
(Em
52
6/E
m4
70
)
HC
LC HSA
FIG. 5. Detection of BoNT activity in pharmaceutical excipient mixtures using the BoTest™ and BoTest™ Matrix
assays. (A) Excipient effects on BoNT activity determinations using BoTest™. Non-IP BoTest™ A/E and B/D/F/G
reactions were carried out using the indicated BoNT/A or B concentration in PBS buffer supplemented without
(open circles) or with 0.1 – 10 times the concentration of excipients found in manufacturer recommended resus-
pensions of the indicated BoNT-based pharmaceuticals. The 1x solutions contain, in addition to PBS: BoTox®
(0.05% HSA, 15.4 mM NaCl), Dysport® (0.0125% HSA, 0.25% lactose), Xeomin® (0.1% HSA, 0.47% sucrose),
Myobloc® (0.05% HSA, 100 mM NaCl, 10 mM Na-succinate, pH 5.6). Fluorescence emission were collected after
4 h (BoTest™ Matrix A) or 24 h (BoTest™ Matrix B) and emission ratio values were plotted as a function of BoNT
concentration. (B) BoTest™ Matrix A was used to IP the indicated BoNT/A concentrations in either PBS (open
circles) or PBS spiked with 0.1 – 10 times the combined highest concentration of each excipient present in the
BoNT/A pharmaceutical formulations tested in panel (A). The 1x solution contains, in addition to PBS: 0.1% HSA,
15.4 mM NaCl, 0.25% lactose, and 0.47% sucrose. (C) BoTest™ Matrix B was used to IP the indicated BoNT/B
concentration from either PBS (open circles) or PBS spiked with 0.1 – 10 times the concentrations of each excipi-
ent found in Myobloc®. In (B) and (C), the fluorescence emissions were collect at 4 h (BoTest™ Matrix A) or 24 h
(BoTest™ Matrix B) and emission ratio values were plotted as a function of BoNT concentration. (D) Protein blot
analysis was run on the 10 nM and 10 pM BoNT/A fractions generated in (B) and probed with anti-BoNT/A (10 nM
samples) or anti-HSA antibody (10 pM samples). Fractions include the untreated input, the post-IP supernatant
(non bound), post BoTest assay supernatant (BoTest assay), and the post-IP beads. The position of the BoNT
heavy chain (HC) and light chain (LC) are indicated by open and closed arrows, the position of HSA is indicated by
an open arrow. (E) Detection of BoNT/A activity contained in BoTox® using the BoTest Matrix A assay. A single vial
of BoTox® drug product was resuspended, serially diluted, and assayed with BoTest™ Matrix A. The fluorescence
emissions were collected at the indicated times and the emission ratio values plotted as a function of vial label-
on June 3, 2018 by guesthttp://aem
.asm.org/
Dow
nloaded from

Milk Human Serum Carrot Juice Baby Food
[BoNT/A] (M)
em
iss
ion
ra
tio
(Em
52
6/E
m4
70
)
[BoNT/F] (M)[BoNT/B] (M)
A
B
2hrs4hrs24hrs
10-14
10-13
10-12
10-11
10-10
0.5
1.5
2.5
3.5
4.5
MilkHuman SerumBaby FoodCarrot Juice
0.5
1.5
2.5
3.5
4.5
5.5
10-14
10-13
10-12
10-11
10-10
0.5
1.5
2.5
3.5
4.5
5.5
10-14
10-13
10-12
10-11
10-10
[BoNT/A] (M)10
-1310
-1210
-1110
-1010
-90.5
1.0
1.5
2.0
2.5
3.0
[BoNT/A] (M)10
-1310
-1210
-1110
-1010
-90.5
1.0
1.5
2.0
2.5
3.0
[BoNT/A] (M)
em
iss
ion
ra
tio
(Em
52
6/E
m4
70
)
10-13
10-12
10-11
10-10
10-9
0.5
1.0
1.5
2.0
2.5
3.0
[BoNT/A] (M)10
-1410
-1310
-1210
-1110
-1010
-90.5
1.0
1.5
2.0
2.5
3.0
C
BoNT/BBoNT/F
0.5
1.0
1.5
2.0
2.5
3.0
3.5
4.0
em
iss
ion
ra
tio
(Em
52
6/E
m4
70
)
[BoNT] (M)10
-1310
-1210
-1110
-1010
-90.5
1.0
1.5
2.0
2.5
3.0
3.5
4.0
[BoNT] (M)10
-1310
-1210
-1110
-1010
-90.5
1.0
1.5
2.0
2.5
3.0
3.5
4.0
[BoNT] (M)10
-1310
-1210
-1110
-1010
-90.5
1.0
1.5
2.0
2.5
3.0
3.5
4.0
[BoNT] (M)10
-1410
-1310
-1210
-1110
-1010
-9
Milk Human Serum Carrot Juice Baby Food
FIG. 6. Quantification of BoNT/A, B, and F activity in complex food and human-derived matrices using the
BoTest™ Matrix assays. (A) Sample-dependent loss of BoNT activity and assay performance using the
non-IP BoTest™ assay. Each indicated matrix was spiked with the indicated concentration of BoNT/A, B, or F
and assayed with the BoTest™ A/E (BoNT/A) or B/D/F/G (BoNT/B) reporters. Following 24 h incubation with
reporter, the fluorescence emissions were collected and emission ratio values were plotted as a function of
BoNT concentration. (B) Detection of BoNT activity in varying sample types with the BoTest Matrix assays.
The BoTest™ Matrix A was used to IP and quantify the proteolytic activity of the same BoNT/A-spiked
samples described in panel (A) at 2, 4, and 24 h. (C) BoTest™ Matrix B and F assays were used to IP and
quantify the BoNT/B (open circles) and F (closed circles) proteolytic activity, respectively, from the same
BoNT/B and F-spiked samples described in panel (A). The fluorescence emissions were collected at 24 h
and emission ratio values were plotted as a function of BoNT concentration.
on June 3, 2018 by guesthttp://aem
.asm.org/
Dow
nloaded from
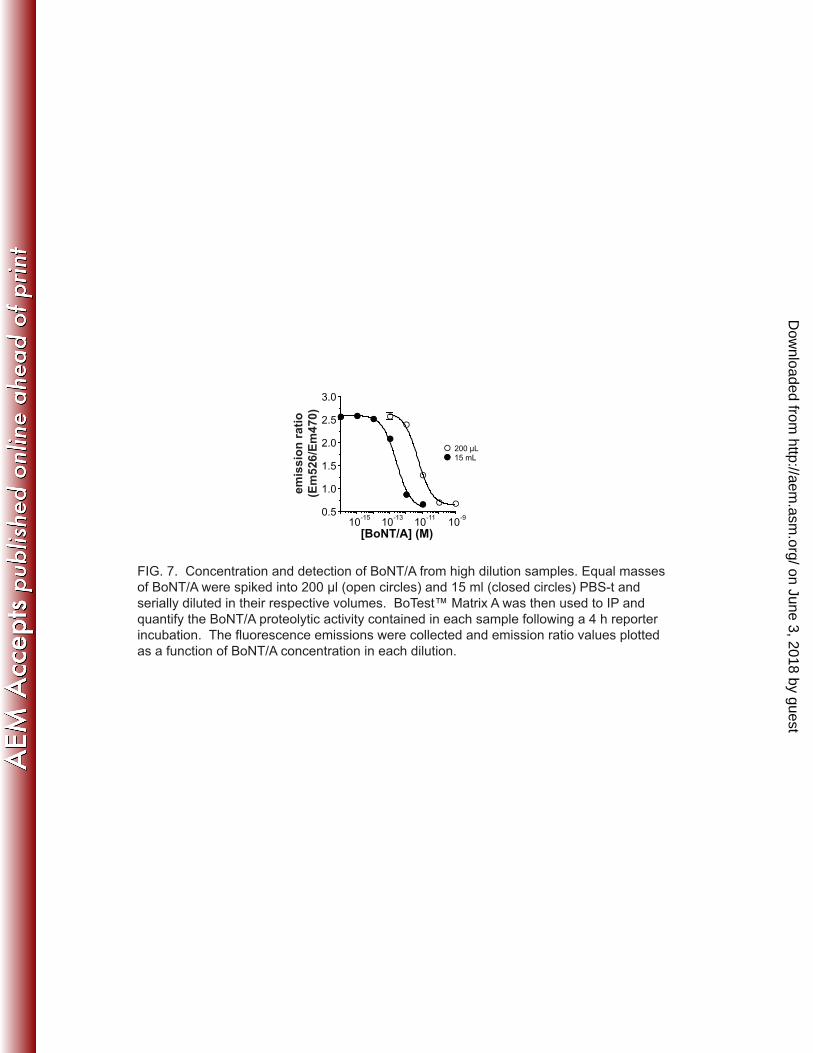
[BoNT/A] (M)
15 mL200 µL
em
iss
ion
ra
tio
(Em
52
6/E
m4
70
)
10-15
10-13
10-11
10-9
0.5
1.0
1.5
2.0
2.5
3.0
FIG. 7. Concentration and detection of BoNT/A from high dilution samples. Equal masses
of BoNT/A were spiked into 200 µl (open circles) and 15 ml (closed circles) PBS-t and
serially diluted in their respective volumes. BoTest™ Matrix A was then used to IP and
quantify the BoNT/A proteolytic activity contained in each sample following a 4 h reporter
incubation. The fluorescence emissions were collected and emission ratio values plotted
as a function of BoNT/A concentration in each dilution.
on June 3, 2018 by guesthttp://aem
.asm.org/
Dow
nloaded from
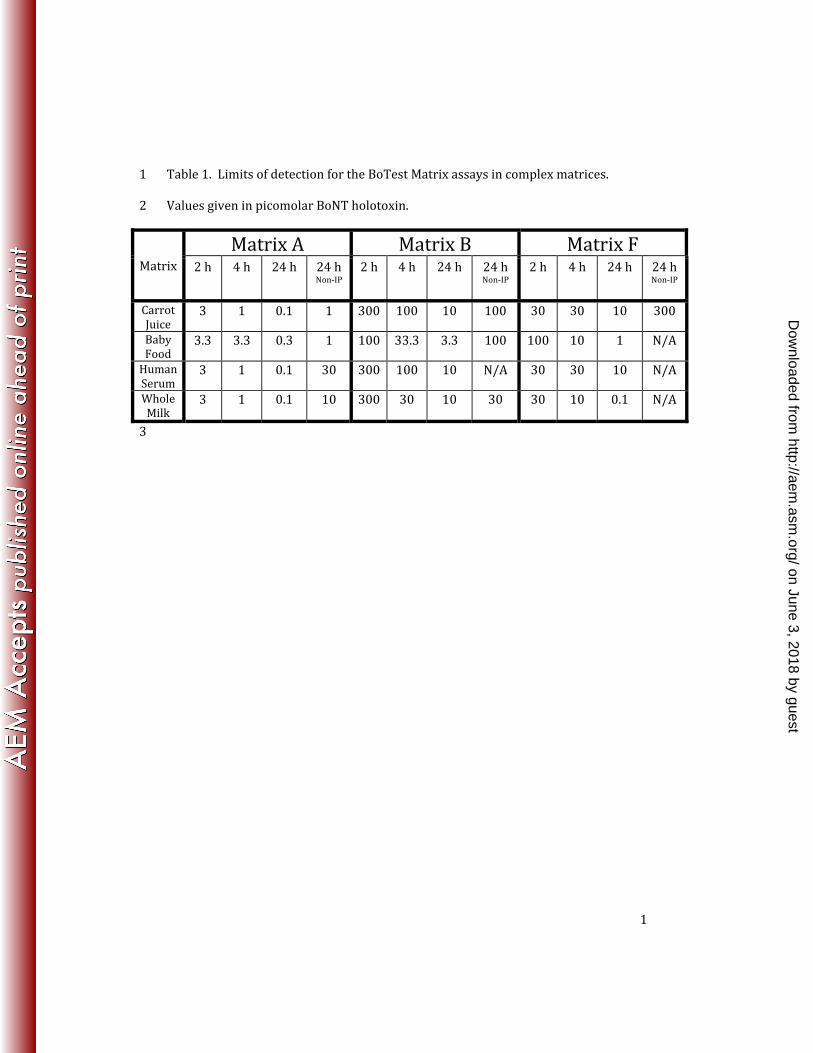
1
Table 1. Limits of detection for the BoTest Matrix assays in complex matrices. 1 Values given in picomolar BoNT holotoxin. 2 Matrix Matrix A Matrix B Matrix F2 h 4 h 24 h 24 h Non-IP 2 h 4 h 24 h 24 h Non-IP 2 h 4 h 24 h 24 h Non-IP Carrot Juice 3 1 0.1 1 300 100 10 100 30 30 10 300 Baby Food 3.3 3.3 0.3 1 100 33.3 3.3 100 100 10 1 N/A Human Serum 3 1 0.1 30 300 100 10 N/A 30 30 10 N/A Whole Milk 3 1 0.1 10 300 30 10 30 30 10 0.1 N/A 3
on June 3, 2018 by guesthttp://aem
.asm.org/
Dow
nloaded from

![ã - Rutgers Business Review · á ë ä b e ä ä ^ \ ] c ä](https://static.fdocuments.us/doc/165x107/5e501dd4dacd2c44a50f8d96/-rutgers-business-review-b-e-c-.jpg)


![Cuadernillo comprension lectora 6º Primaria-2...ä ä ó 35(*817$6 u&¤PR WH JXVWDU D TXH FRQWLQXDVH \ ILQDOL]DVH HVWD KLVWRULD" (VFULEH WX SURSLR WH[WR &RQWHVWD HVWDV 35(*817$6](https://static.fdocuments.us/doc/165x107/5f68f9e3d1158413387641b7/cuadernillo-comprension-lectora-6-primaria-2-358176-upr.jpg)