
Z PRINCIPLE IN GEODATA APPLICATION -...
36
Z PRINCIPLE IN GEODATA APPLICATION Speaker : Vyacheslav Lobzenev
Transcript of Z PRINCIPLE IN GEODATA APPLICATION -...

Z PRINCIPLE
IN GEODATA APPLICATION
Speaker : Vyacheslav Lobzenev

Innovative Centre Company’s scope
Data storage and
catalogization
Remote sensing data
processing
GIS development
IMAGE MEDIA CENTER
software development
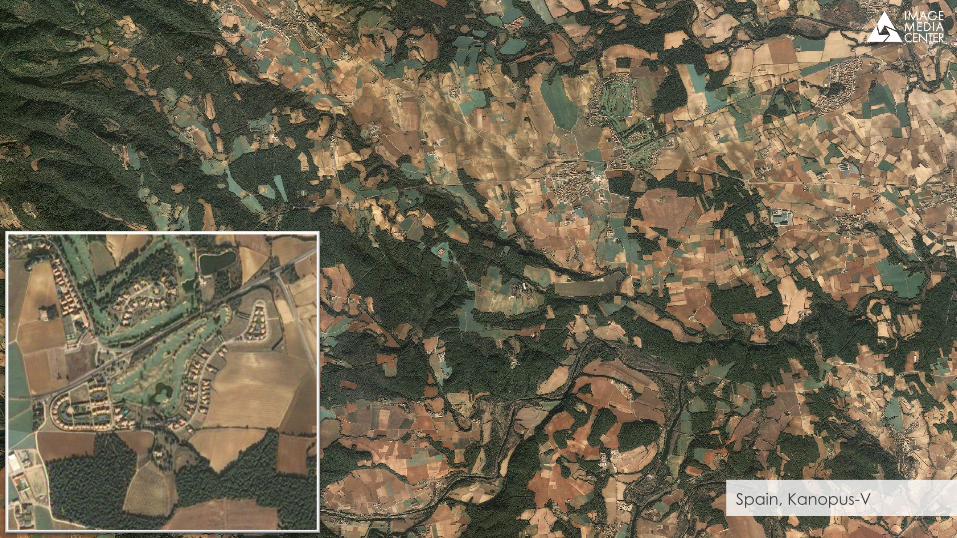
Spain, Kanopus-V

Remote sensing data acquisition automation
Abu Dhabi,
Resurs-P
4
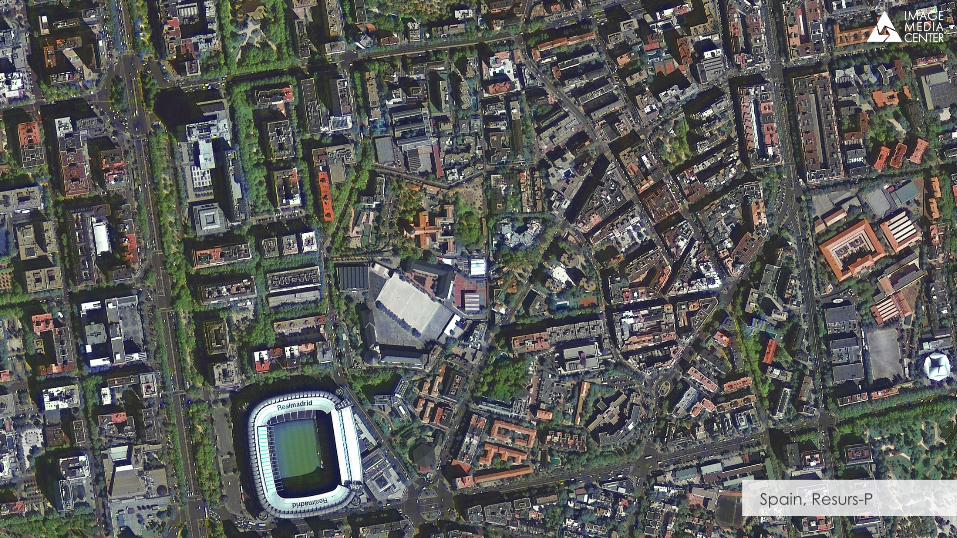
Spain, Resurs-P
6
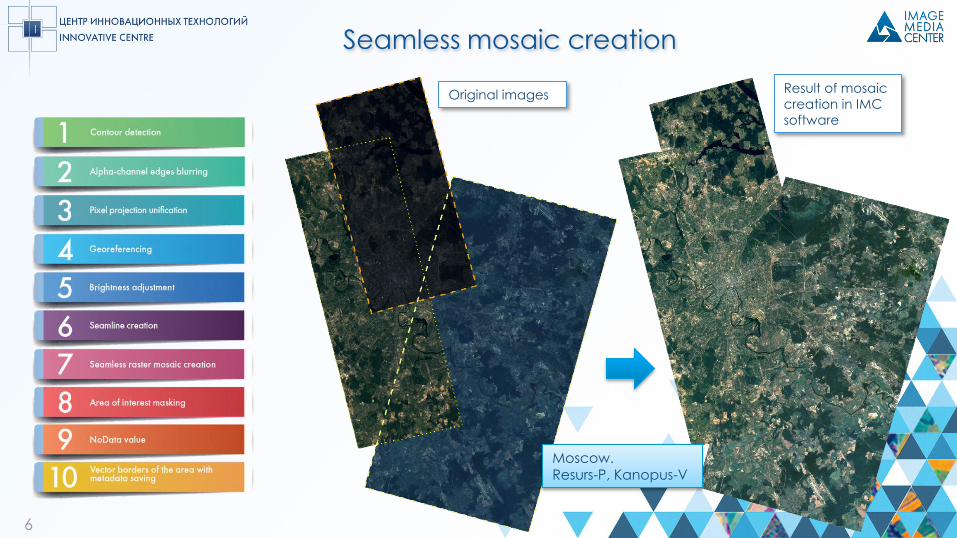
Seamless mosaic creation
Moscow. Resurs-P, Kanopus-V
Original images Result of mosaic
creation in IMC
software

7
Result of automated georeferencing. Moscow. Kanopus-V, Resurs-P
Seamless mosaic
Resurs-P
pixel- 0,72 m
Kanopus-V
pixel- 2,4 m

8
Seamless mosaic automated creation
Resurs-P
pixel - 0,72 m
Kanopus-V
pixel - 2,4 m
Resurs-P
pixel - 0,72 m
Kanopus-V
pixel - 2,4 m
9
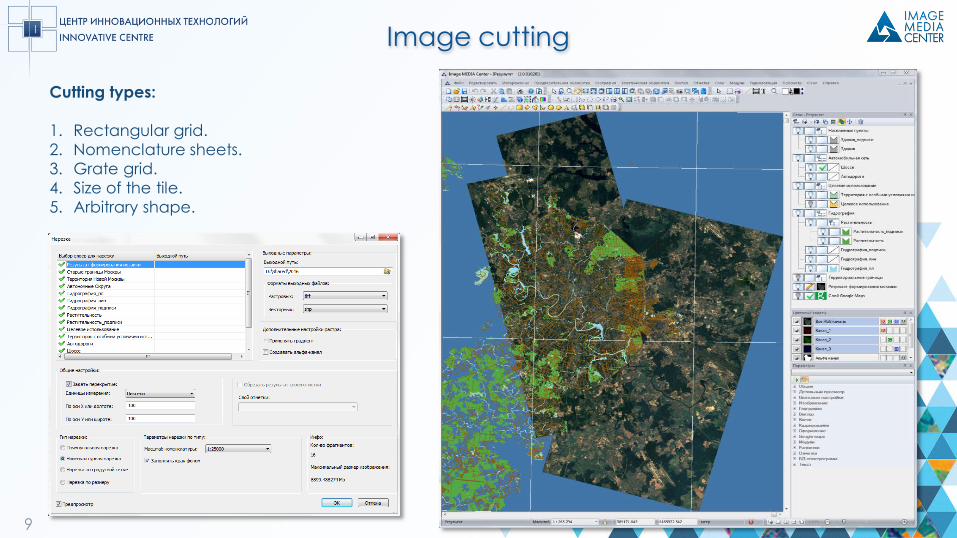
Image cutting
Cutting types:
1. Rectangular grid.
2. Nomenclature sheets.
3. Grate grid.
4. Size of the tile.
5. Arbitrary shape.

Wildfires monitoring
10
Open fire detection. Russian Federation, Landsat-8
RGB composite False color composite Surface temperature map
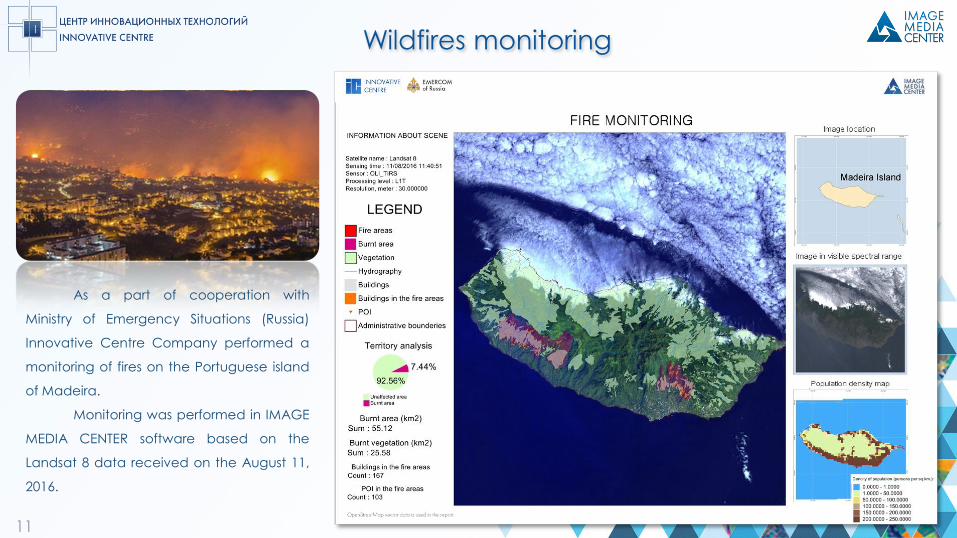
Wildfires monitoring
11
As a part of cooperation with
Ministry of Emergency Situations (Russia)
Innovative Centre Company performed a
monitoring of fires on the Portuguese island
of Madeira.
Monitoring was performed in IMAGE
MEDIA CENTER software based on the
Landsat 8 data received on the August 11,
2016.

Flood monitoring
As a part of cooperation with Ministry of
Emergency Situations (Russia) Innovative
Centre Company performed a flood
monitoring in Kirov on 14.05.2017.
As a result of the flood four districts
are flooded. Houses and streets are
flooded, water reaches entrances of the
buildings.
13
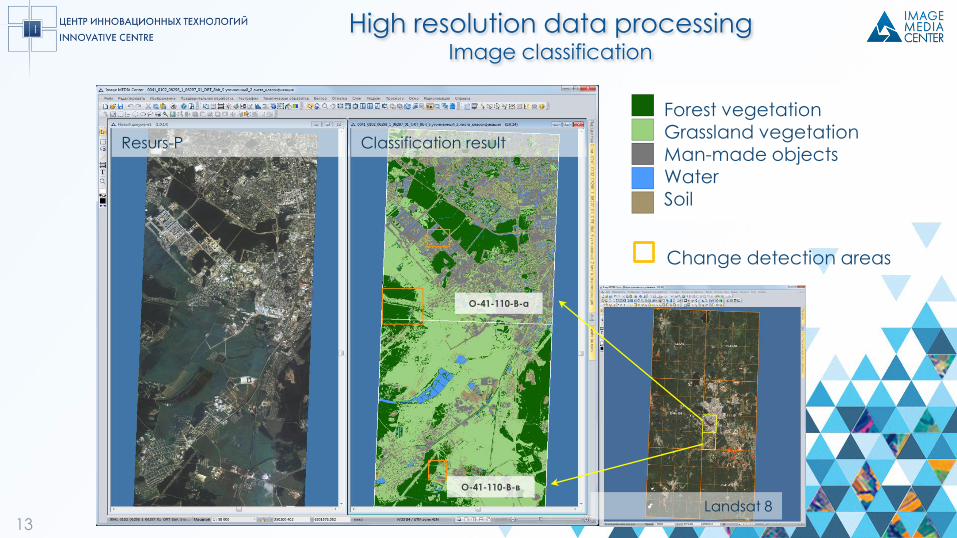
High resolution data processing Image classification
Resurs-P Classification result
Change detection areas
О-41-110-В-а
О-41-110-В-в
Landsat 8
Forest vegetation
Grassland vegetation Man-made objects Water Soil
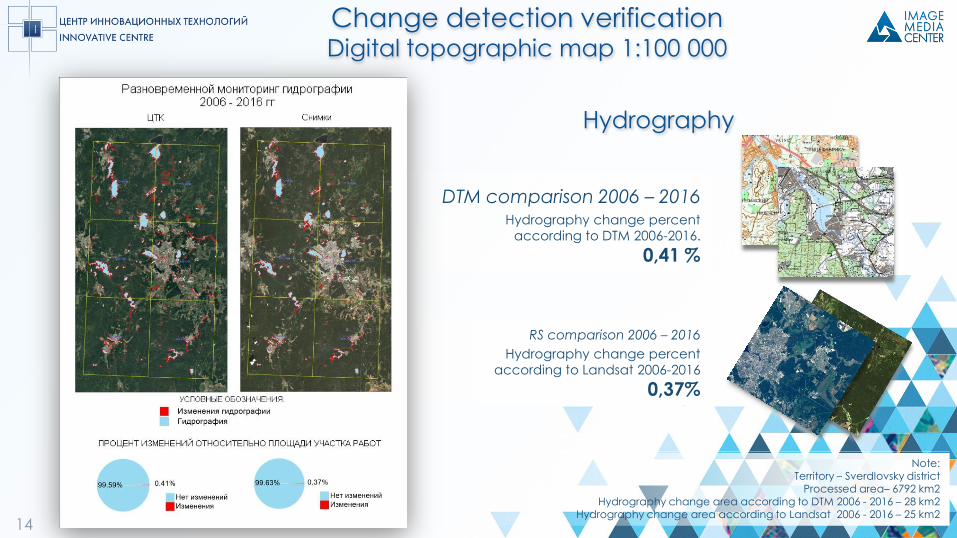
RS comparison 2006 – 2016
Hydrography change percent
according to Landsat 2006-2016
0,37%
DTM comparison 2006 – 2016 Hydrography change percent
according to DTM 2006-2016.
0,41 %
14
Change detection verification Digital topographic map 1:100 000
Hydrography
Note: Territory – Sverdlovsky district
Processed area– 6792 km2 Hydrography change area according to DTM 2006 - 2016 – 28 km2
Hydrography change area according to Landsat 2006 - 2016 – 25 km2
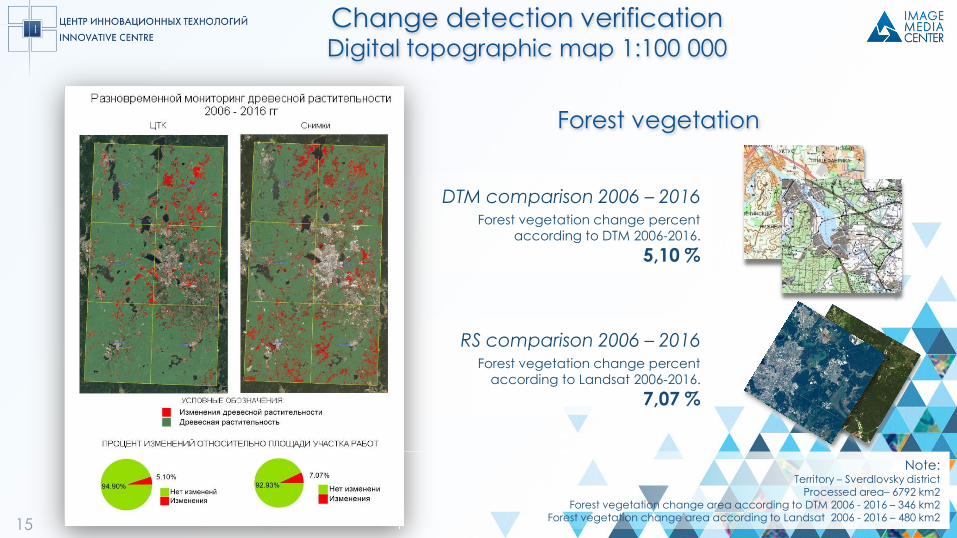
RS comparison 2006 – 2016 Forest vegetation change percent
according to Landsat 2006-2016.
7,07 %
DTM comparison 2006 – 2016 Forest vegetation change percent
according to DTM 2006-2016.
5,10 %
15
Forest vegetation
Note: Territory – Sverdlovsky district
Processed area– 6792 km2 Forest vegetation change area according to DTM 2006 - 2016 – 346 km2
Forest vegetation change area according to Landsat 2006 - 2016 – 480 km2
Change detection verification Digital topographic map 1:100 000

Remote sensing data acquisition and
application development tendencies
16
Aist-2D; ALOS-3; ALOS/PRISM, AVNIR-2; AlSat-2A,2B; Aqua/MODIS;
ASNARO-1; BKA; BlackSky Pathfinder; Cartosat-1 (IRS-P5); Cartosat-2, 2B, 2С, 2D, 2E, 3; CBERS-4; Deimos-2; DMC; DMC-3/TripleSat Constellation-1, 2, 3; DubaiSat-2; Earth-i (EiX2); EgyptSat-2; EO-1/Hyperion, ALI; EROS-A ; EROS-B; Formosat-2; Formosat-5; GeoEye-1; GF-1, 2, 4; Göktürk-1А; Ikonos; Ingenio; IRS-1C, 1D; Kanopus-V; Kanopus-V-IR; KazEOSat-1; KazEOSat-2; Kompsat-2; Kompsat-3, 3А ; Landmapper-BC; Landmapper-HD; Landsat-5; Landsat-7; Landsat-8; Meteor-M 1, 2; Miranda VRSS-1; Monitor; Nigeriasat-2; NuSat -1, 2; Obzor-O; OmniEarth; OptiSAR ; OrbView-3; PerúSAT-1; Resurs-P 1, 2, 3; PlanetScope; Pleiades-1A, 1B; QuickBird; RapidEye; Resourcesat-1 (IRS-P6); Resourcesat-2,2А; Sentinel-2A, 2B; SkySat; Spot-2, 4; Spot-5; SPOT-6, SPOT-7/Azersky; SSOT; Suomi NPP; SuperView-1; TeLEOS-1; Terra/ASTER; TH-1-1, TH-1-2, TH-1-3; THEOS; UrtheCast: Iris, Theia; VNREDSat-1A; WorldView-1; WorldView-2; WorldView-3; WorldView-4; ZY-3; ALOS-2; ALOS(PALSAR); Cosmo-SkyMed 1, 2, 3, 4; Envisat; ERS-1, 2; GF-3; Iceye; Jilin -1; KOMPSAT-5; NovaSAR-S; RADARSAT Constellation 1, 2, 3; RISAT-1; Sentinel-1A, 1B; TerraSAR-X, TanDEM-X; ...
Data sources Tasks
Agriculture
Forestry
Ecology
Mining
Emergency
situations and
military tasks
Other
Transport
Satellite constellation growth
High-resolution satellites number
increase
Archive imagery amount and demand increase
Efficiency of data
acquisition
Number of solvable
tasks
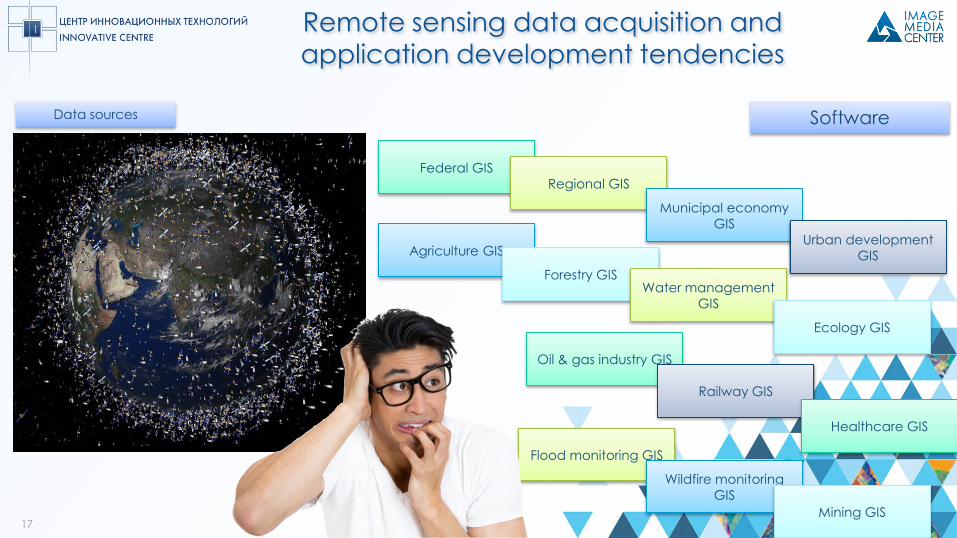
Federal GIS
Regional GIS
Remote sensing data acquisition and
application development tendencies
17
Agriculture GIS
Municipal economy
GIS
Forestry GIS Water management
GIS
Oil & gas industry GIS
Urban development
GIS
Flood monitoring GIS
Wildfire monitoring
GIS
Data sources Software
Ecology GIS
Mining GIS
Railway GIS
Healthcare GIS

X Y Z generation theory
18
In 1991 two people started talking about the distinctive features of age differences for the first time;
they were US researchers Neil Hove and William Strauss. They developed a theory based on differences in values of different generations of people.
The age theory includes three main
components (generations X, Y and Z) and one
additional (baby-boomers).

19
Baby-boomers (1943-1963). They are
good team workers. They are active and
carry on self development, as they have a
huge interest in learning something new.
Their whole life is devoted to work.
Generation Х (1964–1984). Their
distinctive features are hyper-
responsibility, out of box thinking, broad
knowledge base, desire to choose and
change. These people are individualists
and tend to depend only on themselves.
They are hard workers and success-
oriented people.
Generation Y (1983-2003). Scientists also call them a
«thumb generation» because of their habit to type
SMS with their thumbs holding phone in one hand.
They are also known as the «Millennials», «Next
generation», «Network generation». Their main
features are passionate involvement into digital
technologies, high level of education, fast decision-
making. They are oriented on immediate results,
patience is unacceptable.
Generation Z (after 2003). They have attention span of 8 seconds,
highlighting the affects of an increasingly digitalized lifestyle on the
brain. They cannot concentrate on a single task for a long time. The
«8 second filters» developed because the X generation was raised
in the world with unlimited opportunities and not enough time for all
of them.
X Y Z generation theory
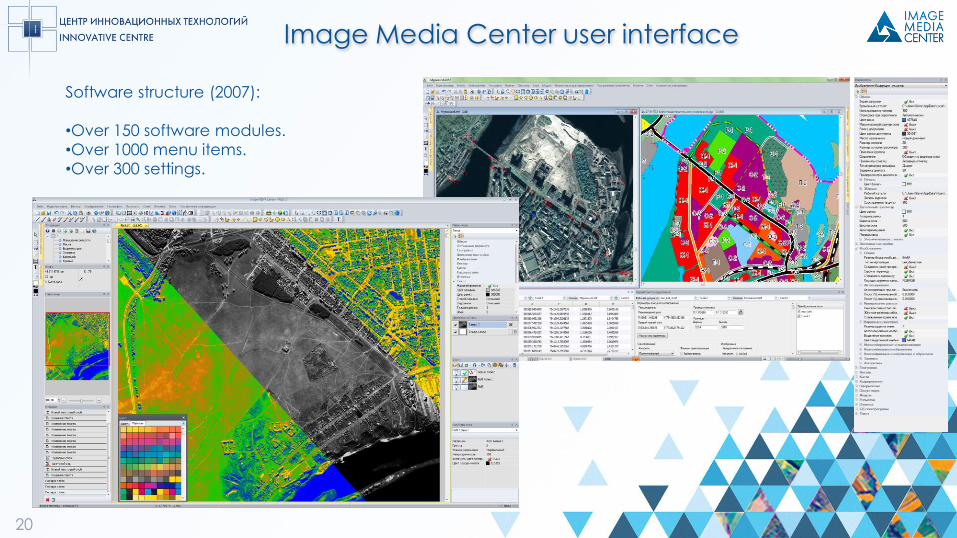
Image Media Center user interface
20
Software structure (2007):
•Over 150 software modules.
•Over 1000 menu items.
•Over 300 settings.

21
Tasks management
in a single informational system
Task selection Area selection
Spatial data processing service
Emergency situations
Forestry
Mining
Agriculture
Transport
Nature reserves Ecology
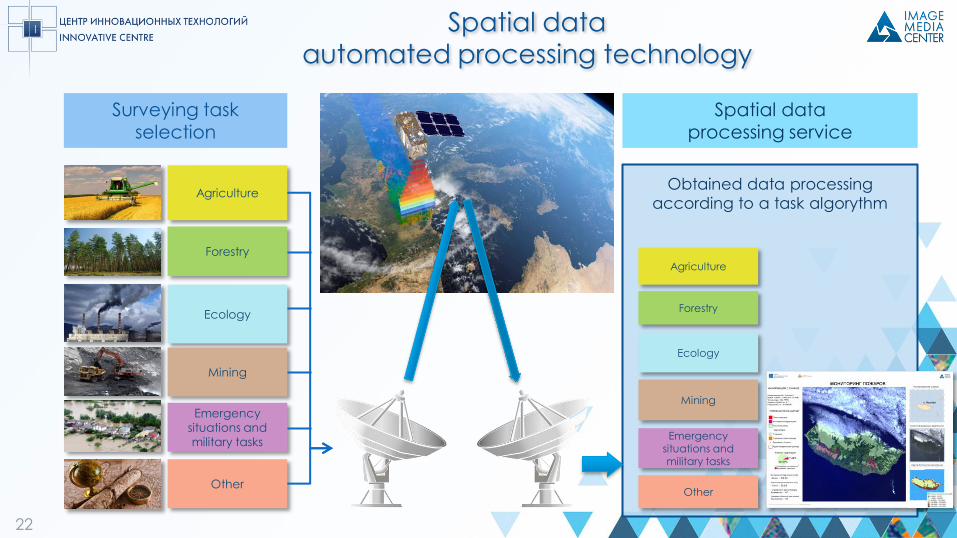
22
Spatial data
automated processing technology
Agriculture
Forestry
Ecology
Mining
Emergency
situations and
military tasks
Other
Surveying task
selection
Spatial data
processing service
Obtained data processing
according to a task algorythm
Agriculture
Forestry
Ecology
Mining
Emergency situations and military tasks
Other

23
Spatial data processing service
Server mode
processing
IMC
Data acquisition
Results
generation
Data input
Database
Database data search and selection
Algorithm selection
Distributed computing resource manager
Spatial data processing service
Processing request
Image Media Center server
24
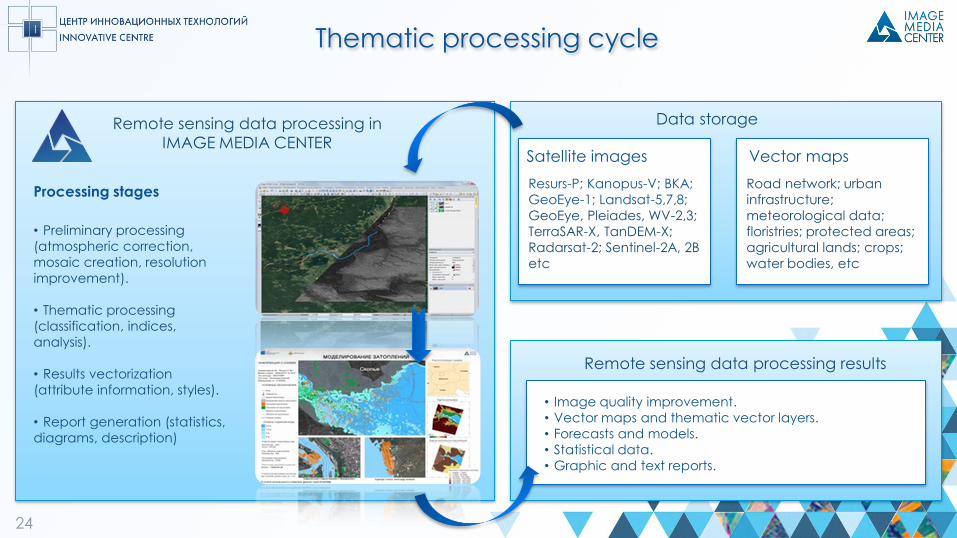
Thematic processing cycle
Remote sensing data processing in
IMAGE MEDIA CENTER
• Preliminary processing
(atmospheric correction,
mosaic creation, resolution
improvement).
• Thematic processing
(classification, indices,
analysis).
• Results vectorization
(attribute information, styles).
• Report generation (statistics,
diagrams, description)
Processing stages
Data storage
Remote sensing data processing results
Satellite images
Resurs-P; Kanopus-V; BKA;
GeoEye-1; Landsat-5,7,8;
GeoEye, Pleiades, WV-2,3;
TerraSAR-X, TanDEM-X;
Radarsat-2; Sentinel-2A, 2B
etc
Vector maps
Road network; urban
infrastructure;
meteorological data;
floristries; protected areas;
agricultural lands; crops;
water bodies, etc
• Image quality improvement.
• Vector maps and thematic vector layers.
• Forecasts and models.
• Statistical data.
• Graphic and text reports.

WEB-service application
Upload materials
requirements
Tasks log
Select necessary
category of tasks

Processing results
visualization on geoportal 26
Attribute information
Image
Vector data
Background map
Processing results log
Results to display

27
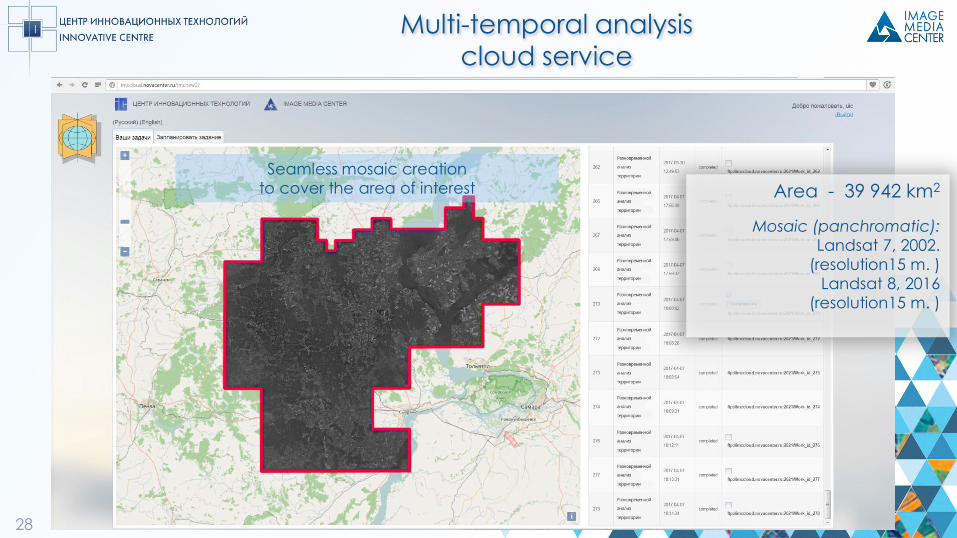
Multi-temporal analysis
cloud service
Ulyanovsky District
Archive data:
7 Landsat 7 images, 2002
Up-to-date data:
5 Landsat 8 images, 2016
Area of interest selection
28
Area - 39 942 km2
Mosaic (panchromatic):
Landsat 7, 2002.
(resolution15 m. )
Landsat 8, 2016
(resolution15 m. )
Seamless mosaic creation
to cover the area of interest
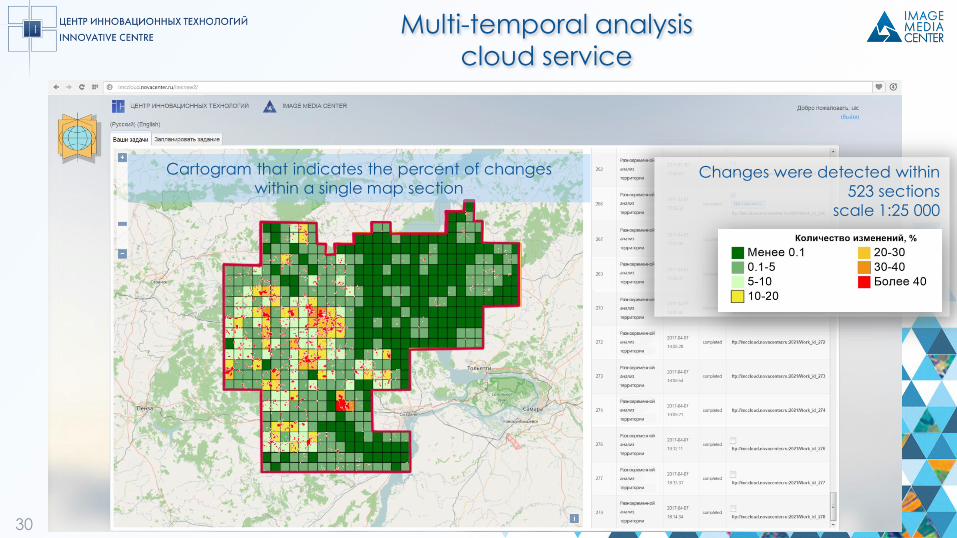
Multi-temporal analysis
cloud service

29
Total area of detected
changes:
1403,37 km2
Number of regions where
changes were registered:
2312
Change detection
Multi-temporal analysis
cloud service
30
Changes were detected within
523 sections
scale 1:25 000
Cartogram that indicates the percent of changes
within a single map section
Multi-temporal analysis
cloud service

31
Change detection report
Report is generated automatically
and contains following data:
raster image and vector layers
area of interest location
statistical data on detected changes(number, area)
Information about map sections where changes were registered
32
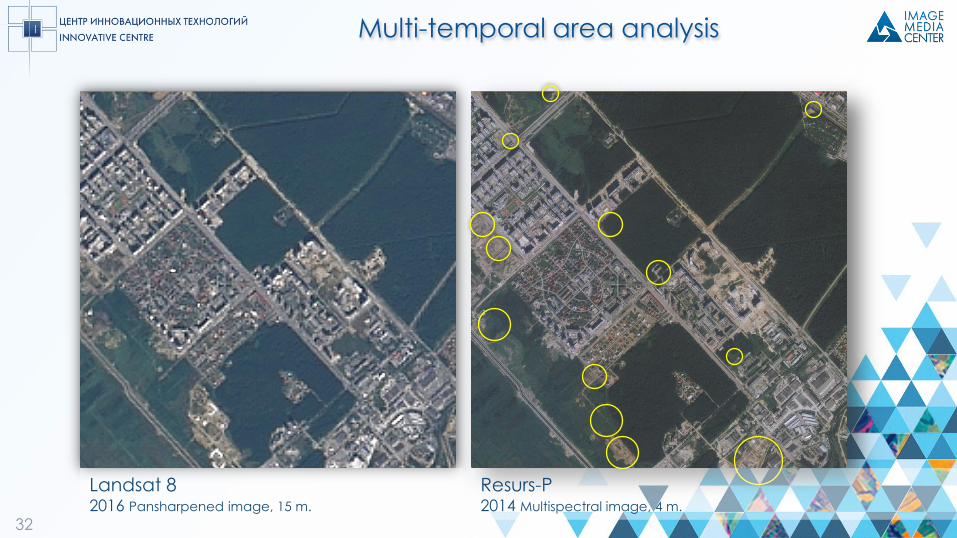
Multi-temporal area analysis
Landsat 8 2016 Pansharpened image, 15 m.
Resurs-P 2014 Multispectral image, 4 m.
33
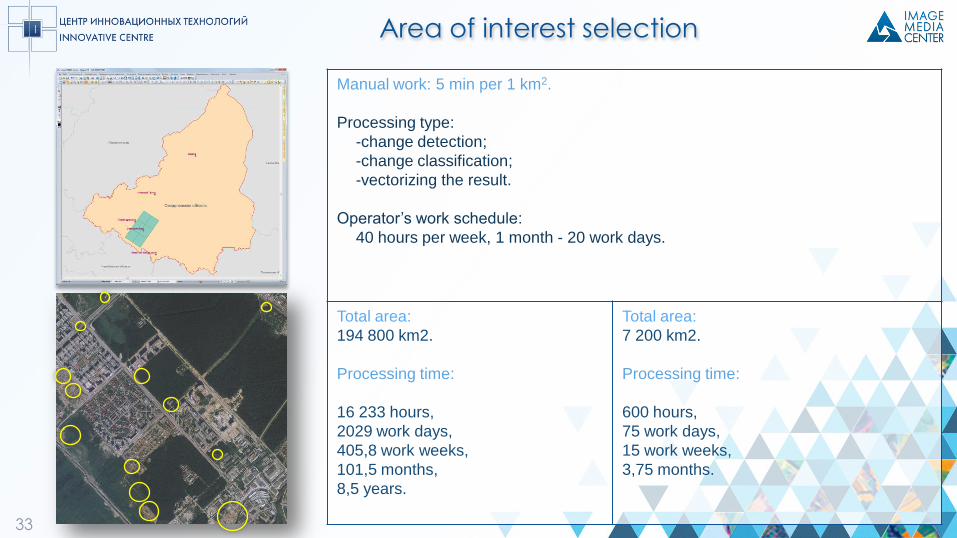
Manual work: 5 min per 1 km2.
Processing type:
-change detection;
-change classification;
-vectorizing the result.
Operator’s work schedule:
40 hours per week, 1 month - 20 work days.
Total area:
194 800 km2.
Processing time:
16 233 hours,
2029 work days,
405,8 work weeks,
101,5 months,
8,5 years.
Total area:
7 200 km2.
Processing time:
600 hours,
75 work days,
15 work weeks,
3,75 months.
Area of interest selection
34
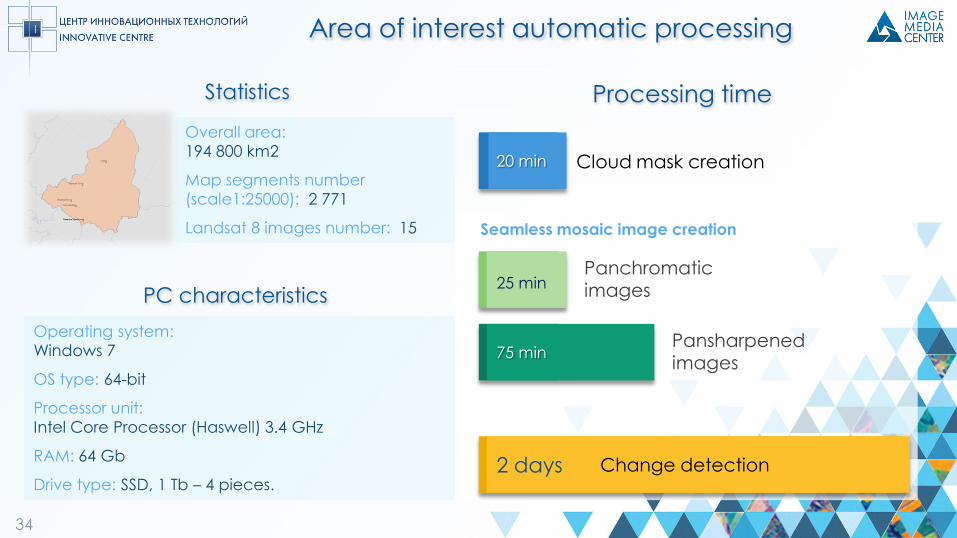
Overall area:
194 800 km2
Map segments number
(scale1:25000): 2 771
Landsat 8 images number: 15
Processing time
Operating system:
Windows 7
OS type: 64-bit
Processor unit:
Intel Core Processor (Haswell) 3.4 GHz
RAM: 64 Gb
Drive type: SSD, 1 Tb – 4 pieces.
PC characteristics
Area of interest automatic processing
Statistics
Change detection 2 days
20 min Cloud mask creation
Seamless mosaic image creation
Panchromatic
images 25 min
Pansharpened images
75 min
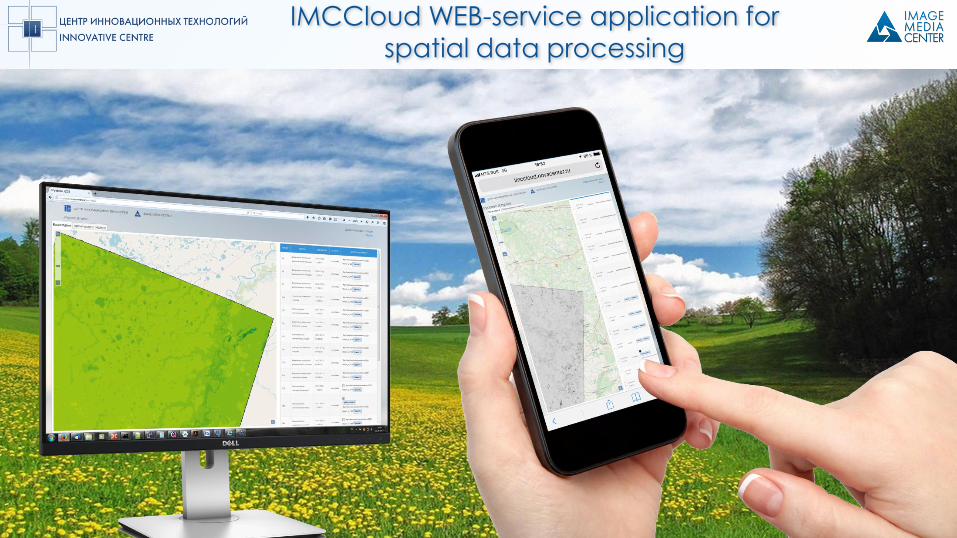
IMCCloud WEB-service application for
spatial data processing

Thank you
for attention
Innovative Centre
129329, Russian Federation, Moscow, Vereskovaya st., 10
Phone/Fax: +7 (499) 189-61-66
E-mail: [email protected]
Website: www.novacenter.ru