YOUR WAY - Mental Health Foundation The Mental Health Foundation acknowledges and thanks all those...
40
YOUR WAY An evaluation of a model of community mental health support developed by Together for Mental Wellbeing
Transcript of YOUR WAY - Mental Health Foundation The Mental Health Foundation acknowledges and thanks all those...

Y O U R WAYAn evaluation of a model of community mental health support
developed by Together for Mental Wellbeing

Acknowledgements
The Mental Health Foundation acknowledges and thanks all those who contributed to this evaluation, including the Evaluation Steering Group, Your Way staff, peer researchers and participants who contributed their expertise and time. We are grateful to Drs Chiara Samele and Norman Urquía of Informed Thinking for assisting with the preparation of this evaluation report.
This report is the result of a three-year independent evaluation of the impact of Together for Mental Wellbeing’s
personalised, community-based mental health services. The project was funded by the Department of Health.

Y O U R W AY
C O N T E N T S
Executive summary 1
Introduction 3
Background 3
Overview of Your Way 3
Evaluation 5
Aims and objectives 5
Methods 5
Evaluation sites 7
Results 11
Baseline characteristics of the sample 11
Wellbeing 13
Health-promoting lifestyle activity 14
Goal identification and attainment 16
Hospital bed use 19
Cost comparisons 19
Participants’ experiences of Your Way 20
Discussion 24
Conclusions 27
Recommendations 28
References 29
Appendices 30

LIST OF TABLES
1: Characteristics of the 13 sites included in the evaluation 8
2: Length of service use before completing baseline data 12
3: Contact with health and social care professionals 13
4: Costs compared by service per month and per annum 20
A1: Assessments collected at each time point by group 30
A2: Participants completing assessments over multiple time points 30
A3: Wellbeing descriptives 31
A4: General health descriptives 31
A5: Exercise descriptives 31
A6: Food descriptives 32
A7: Social life descriptives 32
A8: Dealing with health professionals’ descriptives 32
A9: Finding meaning descriptives 33
A10: Lifestyle profile descriptives 33
LIST OF FIGURES
1: Proportion (%) of participants by Your Way site 11
2: Main diagnostic category 12
3: Mean wellbeing scores over four time points 14
4: Mean HPLP II scores for Group 1 15
5: Identified first goals by participant groups 16
6: Was the first goal achieved at three-month follow-up? 17

Y O U R W AY
E X E C U T I V E S U M M A RY
1
In 2010, Together transformed its Day Centre services into personalised, flexible support services based in the community. This new approach is called Your Way. The Mental Health Foundation conducted a three-year evaluation of Your Way.
The Your Way model has five essential elements:
1. Meaningful personalisation.
2. Open-minded approach and high-quality service.
3. Peer support.
4. Healthy living in the community.
5. Service-user leadership.
People can access support from the service via referrals from Community Mental Health Teams (or in some cases through Supporting People panels), their GP or through self-referral. Those with a personal budget can use this to purchase support from the service.
MethodologyA mixed-methods approach focused on the following aspects of Your Way:
• Increased mental and physical wellbeing.
• Improvements in functional living skills.
• The achievement of self-directed goals.
• A reduction in mental health hospital bed use.
• Improved service-user experiences.
The key outcomes measured were subjective wellbeing and health-promoting lifestyle activity across a 12-month period in 13 of the Your Way sites.
In addition, the evaluation aimed to assess the cost savings provided by Your Way in relation to comparable support delivery, and between service costs pre- and post- transformation to the model.
Semi-structured interviews using schedules based on the five essential elements were conducted by
peer researchers with service users in five of the Your Way sites.
Findings
WellbeingThere were statistically significant increases in wellbeing in the first three months of service use for people who enrolled on the evaluation within a month of accessing support from Your Way.
LifestyleThere were statistically significant improvements in relation to social life and relationships, a sense of meaning, dealing with health professionals, and health-promoting lifestyle activity for people who enrolled on the evaluation within a month of accessing Your Way.
GoalsGoals relating to physical health and wellbeing were the most frequently identified across the sample at baseline, and were rated ‘very important’ for the majority of all participants. The highest proportion of participants who completed baseline data within a month of accessing Your Way achieved their goals at the six-month follow-up time point.
The qualitative interviews identified aspects of Your Way, which service users particularly valued. Your Way created a community and social network that improved resilience. The Your Way staff had an open-minded approach and provided a high-quality service. Service users valued peer support, the experience of self-directed support and the use of incremental goal setting to progress recovery.
The costing comparison exercise was used to examine the differences between the cost of Your Way and the statutory cost of comparable levels of service delivery. This exercise highlighted the challenges of costing voluntary sector services and led to a recommendation regarding strategic action to create a framework for costing voluntary sector services.
2
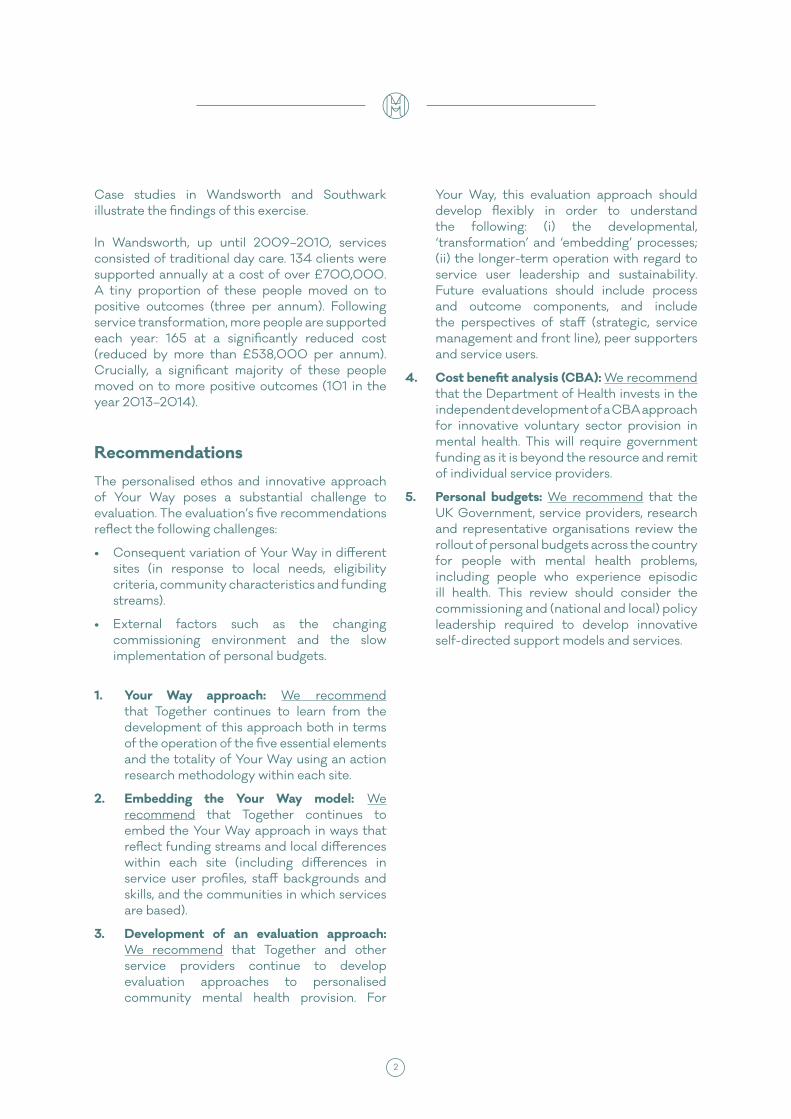
Case studies in Wandsworth and Southwark illustrate the findings of this exercise.
In Wandsworth, up until 2009–2010, services consisted of traditional day care. 134 clients were supported annually at a cost of over £700,000. A tiny proportion of these people moved on to positive outcomes (three per annum). Following service transformation, more people are supported each year: 165 at a significantly reduced cost (reduced by more than £538,000 per annum). Crucially, a significant majority of these people moved on to more positive outcomes (101 in the year 2013–2014).
Recommendations
The personalised ethos and innovative approach of Your Way poses a substantial challenge to evaluation. The evaluation’s five recommendations reflect the following challenges:
• Consequent variation of Your Way in different sites (in response to local needs, eligibility criteria, community characteristics and funding streams).
• External factors such as the changing commissioning environment and the slow implementation of personal budgets.
1. Your Way approach: We recommend that Together continues to learn from the development of this approach both in terms of the operation of the five essential elements and the totality of Your Way using an action research methodology within each site.
2. Embedding the Your Way model: We recommend that Together continues to embed the Your Way approach in ways that reflect funding streams and local differences within each site (including differences in service user profiles, staff backgrounds and skills, and the communities in which services are based).
3. Development of an evaluation approach: We recommend that Together and other service providers continue to develop evaluation approaches to personalised community mental health provision. For
Your Way, this evaluation approach should develop flexibly in order to understand the following: (i) the developmental, ‘transformation’ and ‘embedding’ processes; (ii) the longer-term operation with regard to service user leadership and sustainability. Future evaluations should include process and outcome components, and include the perspectives of staff (strategic, service management and front line), peer supporters and service users.
4. Cost benefit analysis (CBA): We recommend that the Department of Health invests in the independent development of a CBA approach for innovative voluntary sector provision in mental health. This will require government funding as it is beyond the resource and remit of individual service providers.
5. Personal budgets: We recommend that the UK Government, service providers, research and representative organisations review the rollout of personal budgets across the country for people with mental health problems, including people who experience episodic ill health. This review should consider the commissioning and (national and local) policy leadership required to develop innovative self-directed support models and services.

2
Y O U R W AY
I N T R O D U C T I O N
3
Together for mental wellbeing is a national mental health charity that works alongside people with mental health problems towards leading independent, fulfilling lives. They provide a range of services including housing, advocacy,
criminal justice services, and community support. In 2010, Together transformed its Day Centre services into personalised, flexible support
services based in the community. It called this model of support Your Way.
An evaluation was commissioned and funded by the Department of Health. This report describes the evaluation conducted and distils the findings and
outcomes of Your Way.
agenda in mental health. This included the difficulty of deciding which care needs are health and/or social, eligibility issues for fluctuating conditions, the role of care coordinators as gatekeepers, and perceived risks and concerns about the capability of people with mental health needs to always have the insight necessary to design and maintain their own support (3). Individual or personal budgets were seen as an indicator of the success of the personalisation agenda (4).
The Your Way service model was developed within this context. In partnership with commissioners, service users and staff from a Community Mental Health Team in Wandsworth, Together transformed its Day Centre support for adults experiencing mental health problems. The underpinning principle of Your Way is to provide flexible, personalised support that sees individuals defining their own goals and leading their journey to recovery. Your Way staff aim to work alongside carers and other professionals involved in people’s care.
The Your Way model was piloted in Wandsworth and subsequently used to transform more than 20 Together community support services across England.
Background
The 2012 White Paper Caring for our future: Reforming care and support set out a new vision for reforming care and support for older and disabled people, including those with mental health problems (1). The aim was to create a new system that promotes wellbeing and independence to reduce the risk of people reaching crisis point, while at the same time improving their lives.
A personalised approach underpins this policy, which includes people being able to have real choice and control over the care and support they need to achieve their goals. Independence and self-directed support, therefore, are fundamental to this approach (2). Two years prior to the 2012 White Paper, the London Borough of Wandsworth reviewed the provision of their Day Centres for adults experiencing mental health problems. Commissioners in Wandsworth were keen to incorporate a personalisation approach into this redesign, while delivering significant economic savings.
Around the same time, there were increasing difficulties with implementing the personalisation

4
Overview of Your Way
Your Way focuses on working alongside people to achieve the goals they have set themselves, building their resilience and helping them to identify support structures and community resources outside the formal healthcare system. Peer support is a key feature of the service, and individuals have the option of training to become peer supporters themselves.
Your Way uses a ‘whole picture’ approach to supporting someone via relationships with family, friends and neighbours, as well as professionals and other agencies. Support workers use smartphone and netbook technology to work flexibly and adapt their approach to meet individual service-user needs.
The service is underpinned by five essential elements:
1. Meaningful personalisation.
2. Open-minded approach and high-quality service.
3. Peer support.
4. Healthy living in the community.
5. Service-user leadership.
People can access support from the service via referrals from Community Mental Health Teams (or in some cases through Supporting People panels), their GP, or through self-referral. Those with a personal budget can use this to purchase support from the service.

4
Y O U R W AY
E VA L U AT I O N
5
In March 2012, an independent evaluation of Your Way was commissioned by Together using a funding award from the Department of Health. The
Mental Health Foundation undertook a three-year evaluation to assess the impact and benefits of Your Way across 13 sites in England.
Aims and objectives
The evaluation aimed to establish the effectiveness of Your Way as an intervention for people with mental health problems and whether the support provided led to:
• Increased mental and physical wellbeing.
• Improvements in functional living skills.
• The achievement of self-directed goals.
• A reduction in mental health hospital bed use.
• Improved service-user experiences.
The key outcomes measured were subjective wellbeing and health-promoting lifestyle activity across a 12-month period.
In addition, the evaluation aimed to assess the cost savings provided by Your Way in relation to comparable support delivery, and between service costs pre- and post-transformation to the model.
Methods
Evaluation designThe evaluation used a mixed-methods design to collect both quantitative and qualitative data. The quantitative component used a longitudinal exploration to assess the impact of personalised, community-based services on recovery from mental health problems on each of the outcomes of interest over time.
Quantitative data were collected using a series of standardised questionnaires given to participants at four time points (T1–T4):
– T1: Baseline and first access to Your Way.
– T2: Three months after baseline or first access.
– T3: Six months after baseline or first access.
– T4: 12 months after baseline or first access.
QuestionnairesThe following questionnaires were used to collect data on participants’ mental wellbeing, health-promoting lifestyle activity, goal attainment, and hospital bed use:
Baseline demographic characteristics and mental health status: Participants were asked to complete a questionnaire, designed by the evaluation team, about their demographic details, mental health status and previous service use (see Appendix 1).
Wellbeing: Mental wellbeing was assessed using the Warwick-Edinburgh Mental Wellbeing Scale (WEMWBS), a self-completed measure of mental wellbeing developed by researchers at the University of Warwick and Edinburgh (5). The scale comprises 14 items, answered using a five-point scale. The minimum score is 14 and the maximum is 70, with higher scores corresponding to higher mental wellbeing (see Appendix 1).
Health-Promoting Lifestyle Profile II (HPLP II): The HPLP II was designed to measure health-promoting lifestyle activity, and is based on a health promotion model (6). The US-developed HPLP II was adapted by MHF for use in the UK (see Appendix 1). The adapted HPLP II consisted of 42 items grouped into six subscales: general health, exercise, food, social life, dealing with health professionals and finding meaning. Response options for each item are on a four-point scale (never; sometimes; often; always). A mean score is computed for each subscale and for overall lifestyle.

6
Goal Attainment Scaling: Progress in goal achievement was assessed with Goal Attainment Scaling (GAS) (7). At baseline (T1), participants were asked to identify three goals to work towards in the following three-month period. They were then asked to rate these goals in terms of their perceived importance (not at all; a little; moderately; very), and difficulty (not at all; a little; moderately; very). These goals were then revisited at the following time point to assess whether or not the goals had been achieved, and to what degree. This procedure was then repeated at T2 and T3, before measuring a final rating of goal attainment at T4 (see Appendix 1). Hospital bed use: Data on hospital bed use was obtained by self-report. At T1 and T4, participants were asked the number and duration of any inpatient hospital admissions in the previous year.
In the first year of the evaluation, questionnaire data was completed autonomously by Your Way service users, with resources in the local areas used to organise and support the process. At each of the four time points (T1–T4), participants were given the option to self-complete hard copies of the questionnaires, or to complete them online using Survey Monkey. In the second year of the evaluation, a Research Assistant was employed to coordinate the data collection across the participating sites. This action served to maintain greater levels of engagement, and to address quality issues, such as missing data. A prize draw incentive was also introduced at baseline and each follow-up stage for all participants.
Site recruitmentIn the first year of the evaluation, eight Your Way pathfinder sites were selected to participate in the evaluation. In the following year, the number of sites was expanded from eight to 19, in order to maximise the pool of participants. A total of 16 Your Way sites returned data as part of the evaluation.However, the number of sites was reduced to 13 in the final analysis; one Your Way site closed in April 2014 and two sites were excluded as they had only one participant.
Recruitment and number of participantsThe evaluation was designed to focus on people who were new to the service. However, when
services began their transformation to Your Way, existing service users were classed as ‘new clients’. All users of Your Way at each of the 16 evaluation sites were offered the opportunity to participate in the evaluation. This included people of all ages from 16 years and above, with no upper age limit. Your Way staff provided users of the service with consent forms and information sheets about the study, and service users were given the choice to ‘opt in’ to the evaluation.
Originally, it was planned to recruit 600 people to the evaluation, with data collected at each of the four time points described above. However, recruiting this number of participants proved difficult (see Limitations section).
Costing comparison A costing comparison exercise was used to examine the differences between the cost of Your Way and the statutory cost of comparable levels of service delivery.
Qualitative data collection and sitesIt was planned that 30 participants would take part in in-depth qualitative interviews conducted by peer researchers at baseline and again after 12 months to gain more in-depth information about the service.
Two semi-structured interview schedules were developed to capture qualitative data from participants about their experience of using Your Way. Open-ended questions were derived from the five key principles underlying the Your Way model – user leadership and equal partnership; meaningful personalisation; open-minded approach and high-quality service; peer support; and healthy living in the community – and piloted with an existing user of Together’s services.
Peer researchers were selected through an open recruitment process advertised through Together’s Service User Involvement Directorate and via a network of people who used or had used Your Way. Interview training was delivered by the Your Way Development Manager, using materials provided by the Mental Health Foundation.
Between September 2013 and October 2014, peer researchers conducted semi-structured

6 7
baseline and follow-up interviews with participants using Your Way at five of the 13 sites included in the evaluation (South Warwickshire, Hastings, Reading, Wandsworth and Southwark).
Ethical issuesWritten informed consent was obtained from all participants and separate consent was obtained for those participants taking part in qualitative interviews. To ensure participant confidentiality, and the independence of the evaluation, Your Way staff were not directly involved in the data collection. All participants were assigned an individual participant code so as to protect their anonymity. All data were stored in accordance with the Data Protection Act 1998. No formal ethical approval was required as the project was a service evaluation.
Data analysesData from hard-copy questionnaires were entered and stored at Together’s central London office. These were then collated by the Mental Health Foundation and analysed using the Statistical Package for Social Sciences (SPSS) Version 21.0. Descriptive statistics were used to perform frequencies and to calculate total and mean/median scores for relevant outcomes (e.g. wellbeing).
Crosstab analyses were carried out to identify patterns in participants’ goal setting and goal attainment over the course of the evaluation. Crosstab analyses of participants’ goal achievement ratings were also analysed.
Participants missing more than three items of data on the wellbeing measure were excluded from the analysis. Similarly, participants missing more than eight items of data on the health-promoting lifestyle questionnaire were excluded from the analysis.
Interpretative statistics were used to analyse trends in the data, such as changes in wellbeing and health-promoting lifestyle activity scores from T1 to T2, T3 and T4. Wilcoxon signed-rank tests were used to ascertain the statistical significance of any differences detected.
Analysis focused on participants who completed data for more than one time point; participants who did not complete data at baseline were excluded from the analysis.
Costings were quantified by comparing the full service costs prior to the introduction of the Your Way model, with the costs of the Your Way model at stable state. Transition costs were also tracked. Measures of cost savings included comparison of costs per service user, and comparison of Your Way with other services designed to achieve similar levels of service.
Qualitative data were analysed thematically and in relation to Your Way’s five essential elements listed above and to explore which aspects of the model were most meaningful to them. Themes were noted as they arose from the data, many of which were related to the framework provided in the interview schedule. Transcripts were coded in accordance with this framework. The coding framework was subsequently refined, with similar themes merged and sub-themes created where appropriate.
Evaluation sites
Table 1 provides details of the evaluation site characteristics at the point these were collected during October 2014. These include a summary of provision and funding method, availability of peer support, staffing structure, and the number of people supported each month.

8
Nam
e of
ser
vice
(d
ate
serv
ice
tran
sfor
med
to
Your
Way
mod
el)
Sum
mar
y/cu
rren
t pro
visi
on
Building- based
Community-based
Peer support
Num
ber
of p
eopl
e su
ppor
ted
each
mon
th
Fund
ing
met
hod
Staffi
ng
stru
ctur
e
Wan
dsw
orth
(Apr
il 20
11)
Pers
onal
ised
day
sup
port
, inc
lude
s 12
wee
ks c
omm
unit
y-ba
sed
supp
ort o
f six
inte
rven
tion
s an
d lo
nger
-ter
m s
uppo
rt fo
r per
sona
l bu
dget
hol
ders
who
may
be
supp
orte
d to
app
ly fo
r a p
erso
nal
budg
et fo
r lon
ger-
term
sup
port
.Tw
o us
er-l
ed o
rgan
isat
ions
sub
cont
ract
ed to
pro
vide
ope
n ac
cess
dro
p-i
ns fo
r any
one
wit
h a
men
tal h
ealth
pro
blem
.R
e-ab
lem
ent p
rovi
des
prac
tica
l sup
port
bas
ed o
n in
divi
dual
s’
pers
onal
goa
ls. T
his
incl
udes
sig
npos
ting
peo
ple
to s
ervi
ces
or
supp
ort a
nd h
elpi
ng th
em fi
nd w
ays
to s
tay
wel
l.
XX
80 (5
0 lo
ng-t
erm
cl
ient
s, 2
0–3
0
shor
t-te
rm c
lient
s)
Loca
l Clin
ical
C
omm
issi
onin
g G
roup
(CC
G)/
pers
onal
bud
gets
0.5
Pro
ject
C
oord
inat
or/2
.5
FT Y
our W
ay
Wor
kers
/6–1
0 P
eer
Supp
ort V
olun
teer
s or
gani
sing
co
mm
unit
y ac
tivi
ties
and
off
erin
g 1:1
sup
port
Bar
nsle
y
(Apr
il 20
11)
Prov
ides
1:1 s
uppo
rt fo
r peo
ple
fund
ed th
roug
h pe
rson
al b
udge
ts o
r se
lf-fu
nded
. The
ser
vice
is c
ompl
emen
ted
by a
bef
riend
ing
serv
ice,
a
cour
t lia
ison
ser
vice
and
a G
P N
avig
ator
s se
rvic
e. S
uppo
rt is
pr
ovid
ed in
com
mun
ity
loca
tion
s an
d pe
ople
’s h
omes
. The
re is
no
phys
ical
hub
but
dro
p-i
n fa
cilit
ies
are
prov
ided
twic
e a
wee
k.
X
Pers
onal
bud
gets
: 46
Bef
rien
ding
: 19
GP
Nav
igat
ors:
26
Cou
rt L
iais
on
Serv
ice:
3
Pers
onal
bud
gets
/se
lf-fu
ndin
g/sp
ot
fund
ing
Rea
ding
(Apr
il 20
11)
Supp
ort p
rovi
ded
from
a c
entr
al h
ub in
clud
es: d
rop
-in
faci
litie
s,
serv
ice
user
-led
act
ivit
ies,
and
a p
aid
and
volu
ntee
r sup
port
m
odel
. Acc
redi
ted
peer
sup
port
trai
ning
has
bee
n av
aila
ble
sinc
e 20
04
. Gro
up a
ctiv
itie
s, 1
:1 se
ssio
ns (b
y st
aff a
nd p
eer s
uppo
rter
s),
and
supp
ort f
or a
cces
sing
com
mun
ity
faci
litie
s an
d at
tend
ing
appo
intm
ents
/mee
ting
s ar
e al
l ava
ilabl
e.Th
e se
rvic
e al
so in
clud
es re
gula
r out
reac
h in
loca
l hos
pita
ls a
nd
heal
th g
roup
s.
XX
X
135
Loca
l aut
hori
ty
gran
t fun
ding
/Lo
cal C
linic
al
Com
mis
sion
ing
Gro
up (C
CG
)
1 FT
Proj
ect
Coo
rdin
ator
/1 F
T Pe
er V
olun
teer
C
oord
inat
or/2
Sen
ior
Supp
ort W
orke
rs/1
FT
Sup
port
W
orke
r/10
PT
Peer
Su
ppor
t Wor
kers
Sou
th
War
wic
kshi
re
(Jun
e 20
11)
The
serv
ice
has
thre
e co
mpo
nent
s: Fl
oatin
g Su
ppor
t Ser
vice
s,
Supp
orte
d A
ccom
mod
atio
n an
d pe
ople
rece
ivin
g pe
rson
al b
udge
ts.
All
supp
ort i
s pr
ovid
ed in
peo
ple’
s ho
mes
and
in th
e co
mm
unity
. Su
ppor
ting
Peop
le fu
nded
sup
port
is li
mite
d to
two
year
s.
The
serv
ice
won
a b
id fr
om S
trat
ford
Tow
n Tr
ust f
or a
bef
riend
ing
serv
ice
aim
ed a
t tac
klin
g lo
nelin
ess
and
isol
atio
n in
the
Stra
tfor
d To
wn
area
. Sup
port
focu
ses
on h
omel
essn
ess,
debt
, ren
t arr
ears
, he
alth
y liv
ing,
soc
ial i
sola
tion
and
subs
tanc
e m
isus
e, e
tc.
XX
70 p
eopl
e fo
r 3.
75 h
ours
/wee
k th
roug
h th
e Fl
oati
ng S
uppo
rt
Serv
ice
16 S
uppo
rted
A
ccom
mod
atio
n
Loca
l aut
hori
ty
Supp
orti
ng P
eopl
e/in
divi
dual
bud
gets
/se
lf-fu
nder
s
1 Pr
ojec
t C
oord
inat
or/1
Se
rvic
e Le
ader
/7
FT Y
our W
ay
Wor
kers
/2 P
T
Your
Way
Wor
kers
Nor
th
War
wic
kshi
re
(Jun
e 20
11)
The
serv
ice
has
thre
e co
mpo
nent
s: F
loat
ing
Supp
ort S
ervi
ces,
Su
ppor
ted
Acc
omm
odat
ion
and
peop
le in
rece
ipt o
f dir
ect
paym
ents
. All
supp
ort i
s pr
ovid
ed in
the
com
mun
ity.
Sup
port
ing
Peop
le fu
nded
sup
port
is li
mit
ed to
two
year
s.
Supp
ort f
ocus
es o
n to
pics
suc
h as
hom
eles
snes
s, d
ebt,
rent
ar
rear
s, h
ealth
y liv
ing,
dea
ling
wit
h co
rres
pond
ence
, soc
ial i
sola
tion
, ag
orap
hobi
a, s
ubst
ance
mis
use,
etc
. The
ser
vice
sup
port
ed a
gro
up
who
bec
ame
the
Rug
by S
ervi
ce U
ser A
ctiv
ity
Gro
up in
20
12. T
he
serv
ice
user
-led
gro
up a
ims
to re
duce
isol
atio
n w
ith
regu
lar s
ocia
l m
eeti
ngs
and
trip
s aw
ay. T
he s
ervi
ce re
fers
into
the
grou
p an
d su
ppor
ts n
ew p
eopl
e to
thei
r firs
t few
mee
ting
s.
XX
Con
trac
ted
to
supp
ort 5
5 pe
ople
a
wee
k th
roug
h th
e bl
ock
cont
ract
Cur
rent
ly, 1
8 pe
ople
are
fund
ed
thro
ugh
pers
onal
bu
dget
s
Loca
l aut
hori
ty
Supp
orti
ng P
eopl
e/in
divi
dual
bud
gets
/se
lf-fu
nder
s
1 Pr
ojec
t C
oord
inat
or/2
Se
rvic
e Le
ader
s/6
FT
You
r Way
W
orke
rs/4
Pee
r Su
ppor
ters

8 9
Nam
e of
ser
vice
(d
ate
serv
ice
tran
sfor
med
to
Your
Way
mod
el)
Sum
mar
y/cu
rren
t pro
visi
on
Building- based
Community-based
Peer support
Num
ber
of p
eopl
e su
ppor
ted
each
mon
th
Fund
ing
met
hod
Staffi
ng
stru
ctur
e
Sw
ale
(Apr
il 20
12)
Com
mun
ity-
base
d su
ppor
t acr
oss
two
site
s (S
hepp
ey a
nd
Sitt
ingb
ourn
e) w
ith
a fo
cus
on s
ocia
l inc
lusi
on. I
nclu
des
serv
ice
user
-led
act
ivit
ies
to p
reve
nt s
ocia
l iso
lati
on. S
ervi
ce u
sers
lead
on
two
drop
-in
sess
ions
p/w
at a
n in
tern
et c
afé.
No
build
ing-
base
d se
rvic
e, th
ough
som
e sp
ace
shar
ed w
ith
a lo
cal r
esou
rce
cent
re.
Has
a fo
cus
on p
ract
ical
gro
ups
(e.g
. gar
deni
ng, p
hysi
cal e
xerc
ise)
. O
ne-t
o-on
e su
ppor
t is
avai
labl
e fo
r peo
ple
in c
risi
s/th
ose
who
re
quir
e pr
acti
cal i
nter
vent
ions
.
X
177
Loca
l aut
hori
ty
fund
ing
(blo
ck
cont
ract
)
1 FT
Pro
ject
C
oord
inat
or/4
PT
Com
mun
ity
Supp
ort W
orke
rs/3
V
olun
teer
s
Sou
thw
ark
(Apr
il 20
12)
No
phys
ical
loca
tion
wit
h al
l sup
port
del
iver
ed in
com
mun
ity
loca
tion
s ar
ound
the
boro
ugh.
Pee
r sup
port
and
gro
up a
ctiv
itie
s pr
ovid
e su
ppor
t foc
usin
g on
soc
ial i
nclu
sion
. All
supp
ort i
s pr
ovid
ed b
y a
blen
ded
offer
ing
of Y
our W
ay W
orke
rs a
nd P
eer
Supp
orte
rs p
rovi
ding
1:1
supp
ort i
n co
mm
unit
y lo
cati
ons.
Pee
r Su
ppor
ters
and
vol
unte
ers
also
pro
vide
sup
port
to g
roup
act
ivit
ies
that
tak
e pl
ace
in th
e co
mm
unit
y. W
eekl
y dr
op-i
n se
ssio
ns a
re
avai
labl
e.
XX
70Lo
cal C
linic
al
Com
mis
sion
ing
Gro
up, w
ith
pers
onal
bud
gets
fo
r lon
g-te
rm n
eed
PT P
roje
ct
Coo
rdin
ator
/PT
Pee
r Sup
port
C
oord
inat
or/2
FT
You
r Way
W
orke
rs/5
–10
Pee
r Su
ppor
t Wor
kers
Shr
opsh
ire
(Oct
ober
20
12)
1:1 c
omm
unit
y su
ppor
t in
rura
l com
mun
ity
sett
ings
. Ref
erra
ls a
re
from
the
Supp
orti
ng P
eopl
e pa
nel b
ut s
ome
peop
le a
re n
ow s
elf-
fund
ing.
St
aff p
rovi
de p
erso
nalis
ed s
uppo
rt w
ithi
n th
e Su
ppor
ting
Peo
ple
cont
ract
, usu
ally
for h
ousi
ng-r
elat
ed s
uppo
rt. S
uppo
rt is
pro
vide
d in
the
com
mun
ity
and
clie
nt’s
hom
es. A
n offi
ce b
uild
ing
host
s a
wee
kly
drop
-in
serv
ice.
The
sta
ffing
team
att
ends
a fo
od b
ank
drop
-in
and
prov
ides
a re
gula
r com
puti
ng in
itia
tive
.
XX
72 (6
of w
hom
are
se
lf-fu
ndin
g)Lo
cal a
utho
rity
Su
ppor
ting
Peo
ple
1 FT
Pro
ject
Co-
coor
dina
tor/
1 PT
Se
rvic
e Le
ader
/1.5
Yo
ur W
ay
Wor
kers
/3 R
elie
f W
orke
rs/1
Pee
r Su
ppor
ter
Bex
hill
(Oct
ober
20
12)
Dai
ly d
rop
-in
sess
ions
from
two
loca
l hub
s. 1
:1 su
ppor
t is
in
the
cent
re a
nd c
omm
unit
y se
ttin
gs a
s pe
r clie
nt n
eed.
Ser
vice
us
er-l
ed a
ctiv
itie
s ar
e he
ld in
the
cent
re, i
nclu
ding
a s
ervi
ce
user
-run
kit
chen
. Out
com
e-ba
sed
supp
ort p
lans
are
use
d an
d pe
rson
alis
atio
n tr
aini
ng w
as d
eliv
ered
in M
arch
20
13. P
eer s
uppo
rt
trai
ning
was
pro
vide
d in
Feb
ruar
y/M
arch
20
14 a
nd tw
o Pe
er
Supp
orte
rs n
ow p
rovi
de b
oth
1:1 a
nd g
roup
ses
sion
s.
XX
X
120
Lo
cal a
utho
rity
bl
ock
cont
ract
1 FT
Pro
ject
C
oord
inat
or (0
.5
betw
een
Has
ting
s/B
exhi
ll)/2
FT
Team
Le
ader
s (1
at s
ite)
/5
FT Y
our W
ay
Wor
kers
ove
r bot
h pr
ojec
ts

10
Nam
e of
ser
vice
(d
ate
serv
ice
tran
sfor
med
to
Your
Way
mod
el)
Sum
mar
y/cu
rren
t pro
visi
on
Building- based
Community-based
Peer support
Num
ber
of p
eopl
e su
ppor
ted
each
mon
th
Fund
ing
met
hod
Staffi
ng
stru
ctur
e
Bex
hill
(Oct
ober
20
12)
Dai
ly d
rop
-in
sess
ions
from
two
loca
l hub
s. 1
:1 su
ppor
t is
in
the
cent
re a
nd c
omm
unit
y se
ttin
gs a
s pe
r clie
nt n
eed.
Ser
vice
us
er-l
ed a
ctiv
itie
s ar
e he
ld in
the
cent
re, i
nclu
ding
a s
ervi
ce
user
-run
kit
chen
. Out
com
e-ba
sed
supp
ort p
lans
are
use
d an
d pe
rson
alis
atio
n tr
aini
ng w
as d
eliv
ered
in M
arch
20
13. P
eer s
uppo
rt
trai
ning
was
pro
vide
d in
Feb
ruar
y/M
arch
20
14 a
nd tw
o Pe
er
Supp
orte
rs n
ow p
rovi
de b
oth
1:1 a
nd g
roup
ses
sion
s.
XX
X
120
Lo
cal a
utho
rity
bl
ock
cont
ract
1 FT
Pro
ject
C
oord
inat
or (0
.5
betw
een
Has
ting
s/B
exhi
ll)/2
FT
Team
Le
ader
s (1
at s
ite)
/5
FT Y
our W
ay
Wor
kers
ove
r bot
h pr
ojec
ts
Has
ting
s
(Oct
ober
20
12)
As
Bex
hill.
XX
X12
0Lo
cal a
utho
rity
bl
ock
cont
ract
Shar
ed w
ith
Bex
hill
Lew
es
(Oct
ober
20
12)
Two
hubs
pro
vide
1:1
supp
ort a
nd g
roup
act
ivit
ies.
Bot
h off
er d
aily
dr
op-i
n se
ssio
ns a
nd 1
:1 su
ppor
t in
the
build
ing
and
the
com
mun
ity.
Act
ivit
ies
in th
e hu
bs a
re m
ainl
y se
rvic
e us
er le
d. S
uppo
rt is
la
rgel
y fo
cuse
d on
soc
ial i
nter
acti
on, e
mot
iona
l sup
port
and
pr
oble
ms
such
as
soci
al is
olat
ion.
The
cent
re o
ffer
s se
vera
l act
ivit
ies
incl
udin
g a
wee
kly
brea
d cl
ub,
min
dful
ness
ses
sion
s, a
rt g
roup
s, re
adin
g gr
oups
, a c
urre
nt a
ffai
rs
grou
p, a
nd h
ealth
y m
eals
for £
3 pe
r hea
d.
XX
X
Lew
es: 6
2
New
have
n: 1
12
Loca
l aut
hori
ty
bloc
k co
ntra
ct1
FT P
roje
ct
Coo
rdin
ator
bot
h hu
bs/3
FT
and
3 PT
Yo
ur W
ay W
orke
rs
acro
ss b
oth
hubs
New
have
n
(Oct
ober
20
12)
As
Lew
es a
bove
, but
New
have
n te
nds
to p
rovi
de m
ore
debt
s an
d be
nefit
s su
ppor
t.X
XX
See
abov
eLo
cal a
utho
rity
bl
ock
cont
ract
Shar
ed w
ith
Lew
es
Roc
hdal
e
(Apr
il 20
13)
Serv
ice
is p
redo
min
antly
fund
ed th
roug
h Su
ppor
ting
Peop
le
cont
ract
. Com
plem
entin
g th
is fu
ndin
g is
a b
lock
soc
ial i
nclu
sion
gr
ant f
und
and
also
a g
rant
-fun
ded
befr
iend
ing
serv
ice.
The
serv
ice
prov
ides
a p
athw
ay to
bet
ter c
omm
unity
con
nect
ions
, in
crea
sed
inde
pend
ence
and
vol
unte
erin
g op
port
uniti
es. T
he
serv
ice
can
also
sup
port
peo
ple
via
spot
pur
chas
e.
XX
Supp
orti
ng P
eopl
e:
36 Soci
al In
clus
ion:
24
Spot
pur
chas
es: 1
0
Loca
l aut
hori
ty
Supp
orti
ng P
eopl
e/So
cial
Incl
usio
n Fu
nd/S
pot
purc
hase
via
loca
l au
thor
ity
1 FT
Pro
ject
C
oord
inat
or/1
Sen
ior
Supp
ort W
orke
r/4
.5
FT C
omm
unit
y Su
ppor
t Wor
kers
/1
FT H
ousi
ng O
ffice
r
Tabl
e 1:
Cha
ract
eris
tics
of t
he 1
3 si
tes
incl
uded
in th
e ev
alua
tion
10
Y O U R W AY
R E S U LT S
11
Baseline characteristics of the sample
In the final analysis, the number of sites was reduced to 13; two of the original 16 evaluation sites were excluded as they had only one participant and one site closed in April 2014.
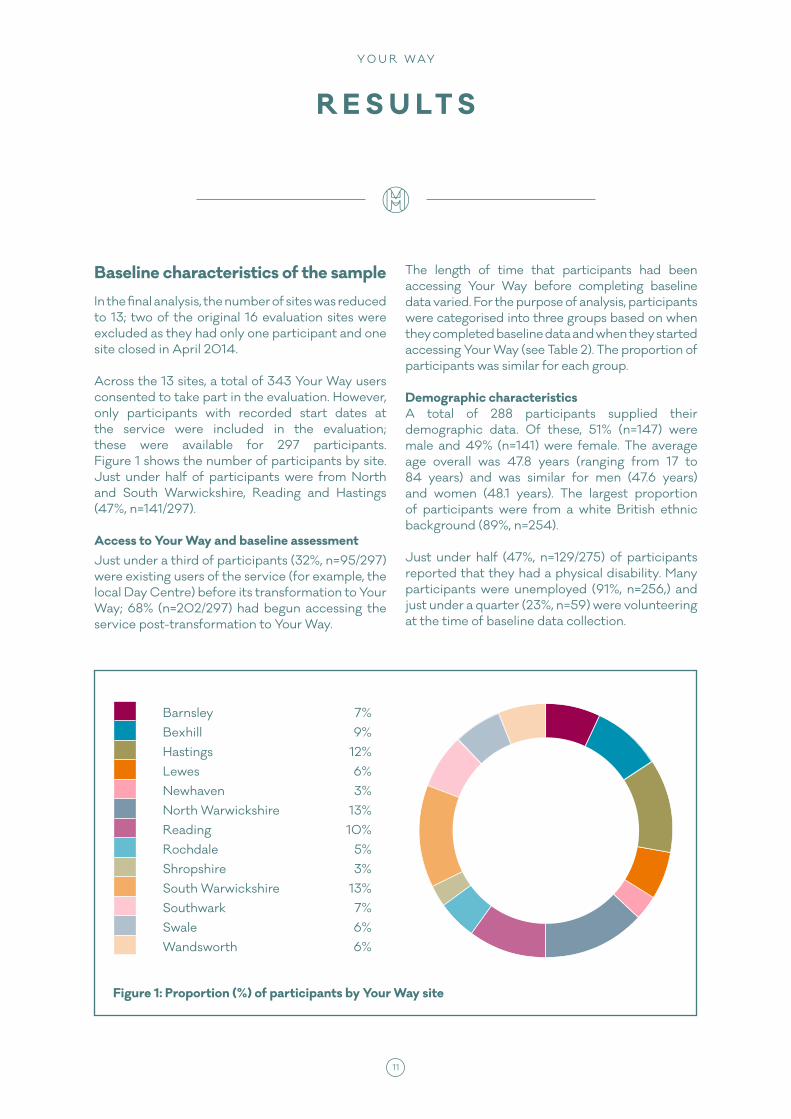
Across the 13 sites, a total of 343 Your Way users consented to take part in the evaluation. However, only participants with recorded start dates at the service were included in the evaluation; these were available for 297 participants. Figure 1 shows the number of participants by site. Just under half of participants were from North and South Warwickshire, Reading and Hastings (47%, n=141/297).
Access to Your Way and baseline assessmentJust under a third of participants (32%, n=95/297) were existing users of the service (for example, the local Day Centre) before its transformation to Your Way; 68% (n=202/297) had begun accessing the service post-transformation to Your Way.
The length of time that participants had been accessing Your Way before completing baseline data varied. For the purpose of analysis, participants were categorised into three groups based on when they completed baseline data and when they started accessing Your Way (see Table 2). The proportion of participants was similar for each group.
Demographic characteristicsA total of 288 participants supplied their demographic data. Of these, 51% (n=147) were male and 49% (n=141) were female. The average age overall was 47.8 years (ranging from 17 to 84 years) and was similar for men (47.6 years) and women (48.1 years). The largest proportion of participants were from a white British ethnic background (89%, n=254). Just under half (47%, n=129/275) of participants reported that they had a physical disability. Many participants were unemployed (91%, n=256,) and just under a quarter (23%, n=59) were volunteering at the time of baseline data collection.
Figure 1: Proportion (%) of participants by Your Way site
Barnsley 7%Bexhill 9%Hastings 12%Lewes 6%Newhaven 3%North Warwickshire 13%Reading 10%Rochdale 5%Shropshire 3%South Warwickshire 13%Southwark 7%Swale 6%Wandsworth 6%

12
Reported diagnosisFigure 2 shows the main diagnostic categories reported by all participants. Depressive disorders were the most common, followed by schizophrenia and other psychotic disorders. Only 5% (n=13) had not received a diagnosis. Most (92%, n=210/228) accepted their psychiatric diagnosis. Of the 39 participants reporting comorbid/other diagnoses, these were mostly mixed anxiety/depression (n=24).
The average age participants became aware of their condition was 27.1 years and the average age of diagnosis was 31.3 years.
According to the three groups described above, the greatest proportion of participants in Groups 1 and 2 reported a main diagnosis of depressive disorders (28%, n=21 and 33%, n=29 respectively). In Group 3, the largest proportion of participants (34%, n=28) reported a main diagnosis of schizophrenia or other psychotic disorders.
Depressive disorders
Schizophrenia and other psychotic disorders
Bipolar and related disorders
Other / Comorbid disorders
Personality disorders
Anxiety disorders
Obessive-compulsive and related disorders
Posttraumatic stress disorder
Substance-related and addictive
Eating disorder
Mai
n D
iagn
osti
c C
ateg
ory
FrequencyFigure 2: Main diagnostic category
0 10 20 30 40 50 60
44 (19.5%)
39 (17.3%)
17 (7.5%)
9 (4%)
3 (1.3%)
2 (0.9%)
1 (0.4%)
1 (0.4%)
53 (23.5%)
57 (25.2%)
Length of service use before completing baseline data Frequency (%)
Group 1 1 month or less 95 (32%)
Group 2 2–12 months 108 (36%)
Group 3 12+ months 94 (32%)
Table 2: Length of service use before completing baseline data

12 13
The majority of participants (95%, n=238/251) reported taking some form of psychotropic medication.
Suicide attemptsOver half (62%, n=171/274) had attempted suicide in the past. The number of attempts ranged from 1–80, with an average of 4.6.
Contact with mental health servicesMany people were in contact with health and social services. The frequency of contact with health and social care professionals is shown in Table 3.
Key outcomesThe key outcomes measured as part of the evaluation were subjective wellbeing and health-promoting lifestyle activity across a 12-month period. The number of participants responding to the wellbeing, health-promoting lifestyle and goal attainment questionnaires varied considerably across the four time points (more details can be found in Appendix 1). Responses declined at six months (T3) and 12 months (T4) by less than a half compared to baseline responses. Despite this outcome, scores are presented across each time point.
Wellbeing
Changes in WEMWBS score following access to Your Way WEMWBS is a 14-item scale answered using a five-point scale. The minimum score is 14 and the
maximum is 70, with higher scores corresponding to higher mental wellbeing. Figure 3 shows the mean wellbeing scores across T1, T2, T3 and T4 data by group, where available (full scores can be found in Appendix 1). Wellbeing scores when compared to those at baseline increased for all three groups, peaking at three months (T2) and dropping after this time. This decline is more notable for Group 3 at six months (T3), which then rises again at 12 months (T4).
Increases in the mean wellbeing score from 37.7 at baseline (T1) to 40.5 at three months (T2) were found to be statistically significant for the 60 service users who completed baseline data within a month of accessing Your Way (Group 1: z=-2.441, p=.015). Although wellbeing scores at six (T3) and 12 months (T4) were higher than the baseline score, these differences were not significant. A total of 16 participants in Group 1 completed the wellbeing questionnaire at T1 and T4, showing an increase in mean scores from 37 at T1 to 39.8 at T4, although this difference was not statistically significant.
The mean WEMWBS score for the 67 participants in Group 2 who completed WEMWBS at both T1 and T2 increased from 36.6 at T1 to 39.7 at T2; a non-parametric test indicates that that increase was significant (z=-2.819, p=.005). Similarly to Group 1, these mean scores were higher between six and 12 months (T3 and T4) compared to the baseline score, but these increases were not statistically significant. It is possible that the reduced sample size at follow-up time points (particularly T3 and T4) may have contributed to the non-significant result.
PsychiatristCommunity Practice
Nurse (CPN)Social Worker
Regularly n=103 (42%) n=67(31%) n=60 (27%)
When I need to be n=91 (37%) n=46 (21%) n=51 (23%)
I choose not to be n=18 (7%) n=15(7%) n=16 (7%)
Never been referred n=36 (15%) n=89 (41%) n=92 (42%)
Table 3: Contact with health and social care professionals

14
Unlike the other groups, the increase in the mean wellbeing score for Group 3 from baseline to three months (T1 to T2) was not statistically significant, although the mean wellbeing score at baseline was higher (see Figure 3). These mean scores dip slightly at six months (T3) (39.5), but return to baseline levels at 12 months (T4) (41.2).
Health-promoting lifestyle activity
Changes in Lifestyle Profile II score following access to Your Way The modified HPLP II is a 42-item scale answered using a four-point scale, composed of six subscales (general health, exercise, food, social life, dealing with health professionals, and finding meaning). The overall score (health-promoting
lifestyle) is a mean of all answers; the six subscale scores are a mean of the responses to the subscale items. The minimum score is 1 and the maximum is 4, with higher scores corresponding to higher health-promoting lifestyle.
Mean scores for health-promoting lifestyle activity show a similar pattern to wellbeing scores in relation to the different groups examined. Figure 4 shows the descriptive scores for the HPLP II for Group 1 at baseline (T1), three months (T2), six months (T3) and 12 months (T4).
Statistically significant increases across the different time points were found for service users in Group 1 (participants who completed baseline data within a month of first accessing Your Way) in relation to improved social life, finding meaning, dealing with health professionals
43
42
41
40
39
38
37
36
35
34
Mea
n W
ellb
eing
Sco
re
Figure 3: Mean wellbeing scores over four time points
T1 (baseline) T2 (3 months) T3 (6 months) T4 (12 months)
Group 1 37.6 40.5 39.8 39.8
Group 2 36.9 39.7 39.2 38.3
Group 3 41.1 42.5 39.5 41.2

14 15
T1 (baseline) T2 (3 months) T3 (6 months) T4 (12 months)
General Health 2.18 2.26 2.29 2.06
Exercise 2.27 2.26 2.34 2.19
Food 2.29 2.33 2.49 2.44
Social Life 2.43 2.61 2.83 2.81
Health Professionals 2.56 2.75 2.83 2.88
Finding Meaning 2.12 2.52 2.51 2.5
Lifestyle 2.3 2.43 2.6 2.44
3.0
2.9
2.8
2.7
2.6
2.5
2.4
2.3
2.2
2.1
2.0
Mea
n S
core
Figure 4: Mean HPLP II scores for Group 1
and lifestyle (see Appendix 1 for inferential statistics). Statistically significant increases in social life and finding meaning were found across each of the four time points, suggesting sustained improvements in these areas which did not occur by chance.
Statistically significant improvements in general health scores were found for participants in Group 2 going from a mean of 2.10 at baseline to 2.29 at three months. Mean scores for exercise also
improved significantly for 114 participants, as did scores for diet at three months.
There were no statistically significant differences found for participants in Group 3 (participants who had accessed Your Way for 12+ months before completing baseline data). Again, scores for this group remained broadly similar throughout the different time points, suggesting maintenance of aggregate lifestyle factors over time rather than overall improvements.

16
Goal identification and attainment
Participants were asked to indicate three equal-weighted goals to work towards over the following months. They were then asked to rate these goals in terms of their importance and perceived difficulty. Participants then revisited these goals at the following time point and rated whether or not they had been achieved, and, if so, to what degree. Here we report the three main goals set by participants and their achievement over time by each of the three groups.
The goals identified were grouped into eight broad categories:1
1. Physical health and wellbeing.
2. Mental health, medication and service use.
3. Social support, family and community.
4. Creative interests and hobbies.
5. Employment, education and volunteering.
6. Housing, legal and financial.
7. Life skills/independence.
8. Personal development/sense of self.
1. A detailed description of goal categories is available in Appendix 2.
5 10 15 20 25 30
Physical health and wellbeing
Firs
t Goa
l Cat
egor
y
Number of participants
Figure 5: Identified first goals by participant groups
Group 1
Group 2
Group 3
0
Personal development, sense of self
Mental health, medication and service use
Social support, family and community
Creative interests and hobbies
Employment, education and volunteering
Housing, legal and financial
Life skills/Independence
22.4%18%
34.9%
3.5%5%6%
17.6%13%
6%
2.4%10%
14.5%
12.9%17%
15.7%
22.4%14%
4.8%
10.6%9%
12%
8.2%14%
6%

16 17
Identifying goalsPhysical health and wellbeing was the most frequently identified first goal across all three groups at baseline (Group 1: n=19/66, Group 2: n=18/66, Group 3: n=29/66). Housing, legal and financial issues (22.4%, n=19) and social support, family and community (17.6%, n=15) were common first goals identified by Group 1. For Group 2 this related to employment, education and volunteering (17%, n=17). Few selected mental health, medication and service use as a primary goal.
Between 72% and 80% of all participants rated their first goal as ‘very important’, but roughly half of these considered this very difficult to attain.
Common second goals for Group 1 included social support, family and community (18.8%, n=15), closely followed by employment, education and volunteering (16.3%, n=13) and physical health and wellbeing (15%, n=12). For Groups 2 and 3, physical health and wellbeing were important (Group 2: 22.6%, n=21; Group 3: 23.5%, n=19). The majority of participants in all three groups rated their second goal as ‘very important’ (Group 1: 71.3%, n=57; Group 2: 70.7%, n=65; Group 3: 64.8%, n=54). However, up to half of all participants
rated their second goal very difficult or moderately difficult to achieve.
Third goals were more varied between groups. Participants from Groups 1 and 2 were likely to identify goals concerning social support, family and community (18.6%, n=13; 23.3%, n=20), while Group 3 identified creative interests and hobbies (23%, n=17).
A high proportion of participants from all groups (between 69% and 82%) rated these third goals as very important. The majority of participants from all three groups rated their third goal as being very difficult to achieve (Group 1: 58%, n=40; Group 2: 57.1%, n=48; 41.1%, n=30).
Achieving goals at three monthsAround half of all participants had achieved their first goal (Group 1: 46%, n=23; Group 2: 45.8%, n=27: Group 3: 56%, n=28), with 81 reporting that this was not achieved. For some (n=17), achieving this first goal was better than expected, but 50 participants felt this was ‘worse than before’, particularly those in Group 2 (73% or 25).
Across the three groups, participants were marginally more likely to report having achieved
28 (56%)
22 (44%)
Group 3Yes
No
Figure 6: Was the first goal achieved at three-month follow-up?
Number of participants
22 24 26 28 30
23 (46%)
27 (54%)
Group 1Yes
No
20
27 (45.8%)
32 (54.2%)
Group 2Yes
No
32 34
Was
the
first
goa
l ach
ieve
d?

18
their second goal (n=77), which was largely as expected, compared to those who reported not having achieved their goal by the three-month follow-up (n=73). Respondents from Group 3 seemed to be more likely than respondents in the other two groups to report having achieved their goal (58.7%, n=27).
More participants reported not having achieved their third goal (25.4% or 73) compared to those who had (19.1% or 55).
Setting new goals at three monthsParticipants set three new goals for themselves to achieve over the following three months. At this point in the evaluation, all participants would have been accessing a Your Way service for at least three months (Groups 2 and 3 may have been using the service for longer) and would have had some experience (and received some support) with setting personal goals as part of the goal attainment aspect of the Your Way model.
The largest proportion of participants from each of the three groups identified their first goal as related to employment, education and volunteering (Group 1: 24.5%, n=12; Group 2: 26%, n=13; Group 3: 20.9%, n=9).
Participants from Group 1 also frequently identified first goals related to housing, legal and financial issues (18.4%, n=9), closely followed by goals related to participants’ mental health, medication and service use, and social support, family and community (14.3%, n=7).
Participants in Group 2 also frequently identified goals related to social support, family and community and personal development/sense of self (16%, n=8). Participants from Group 3 frequently identified first goals that were related to physical health and wellbeing (18.6%, n=8) and mental health, medication and service use (16.3%, n=7).
Participants across all three groups were likely to describe the achievement of their first goal as being ‘very important’ and ‘very difficult to achieve’.
Participants from Group 1 most frequently identified a second goal related to physical health
and wellbeing, and employment, education and volunteering (20.5%, n=9). This group were least likely to identify second goals related to mental health, medication and service use, and creative interests and hobbies (4.5%, n=2).
The second goals identified by participants from Group 2 were most frequently related to physical health and wellbeing (32.2%, n=15). Participants from Group 3 most frequently identified goals related to employment, education and volunteering (19.5%, n=8).2
Achieving goals at six monthsAt six months, 44 of all participants (27%, 44/163) responding at this time point achieved their first goal, particularly those in Group 1 (57.1%, n=16). However, 56 (34.3%, 56/163) participants reported not achieving this and a higher proportion of these were in Group 3 (54.5%, 18/94).
Overall, 17% (48/287) participants achieved their second goal and 16% (45/287) did not. Similar proportions were found for participants across each group regarding their second goal. Participants from Groups 1 and 3 who were unable to achieve their second goal were most likely to report their goal achievement as ‘worse than before’ (Group 1: 66.7%, n=8; Group 3: 60%, n=9).
A total of 39 participants (13.6%) reported achieving their third goal and 45 (15.7%) indicated they had not, which was similar across all three groups. Of those who achieved their third goal at the six-month follow-up, the largest proportion of participants across all three groups reported having achieved their third goal ‘as expected’, particularly in Group 2 (58.8%, n=10) and Group 3 (53.8%, n=7).
Achieving goals at 12 monthsDespite fewer respondents at this time point, 34 (12%, 34/287) participants in total reported achieving their first goal. Most participants in Group 3 had achieved their first goal at 12 months (80%, n=16), while Group 1 showed less goal attainment at this stage (35.3%, n=6).
The majority of participants across all three groups reported having achieved their second goal at 12 months (Group 1: 57.1%, n=8; Group 2:
2. The number of respondents identifying their third goal at this three-month point were too few to analyse meaningfully.

18 19
56.5%, n=13; Group 3: 66.7%, n=12), with Group 3 showing the largest proportion of participants who had achieved their second goal. Twenty- seven participants achieved their third goal at 12 months, mostly in Groups 2 or 3 (Group 2: 65%, n=13; Group 3: 62.5%, n=10), but reported not having achieved this.
Hospital bed use
A total of 272 participants responded to the question regarding hospital bed use at baseline. Just under a third (28%, n=76) had at least one admission to psychiatric hospital in the previous year. The average length of admission was approximately 50 days.
Twenty-nine participants provided responses regarding admission to hospital at baseline and at 12 months. Of the nine participants that had an admission in the year prior to baseline data collection, the majority (n=6) had not returned to hospital in the subsequent year. Of the remaining three participants who had returned to hospital, one had been admitted twice with a total length of stay of 90 days.
Cost comparisons
A cost analysis was carried out to compare costs of the new service with existing services. The methodology drew on an approach previously used by the London School of Economics in partnership with the Mental Health Foundation for a community-based intervention (8).
Due to economies of scale, there is a difference between the average cost per person using the service and the marginal cost of each additional person using an existing service.
Service cost comparison data usedCosts were measured at 2011/2012 prices. Unit costs for health and social care services were sourced from the Personal Social Services Research Unit (PSSRU) Unit Costs of Health and Social Care 2012 (9) and NHS reference costs (10, 11). Where needed, unit costs were inflated using the Hospital and Community Health Services (HCHS) Pay and Prices Index (9).
Staff comparators usedStaff and service equivalents are used for cost comparisons, based on roles and functions performed, level of skill and training required and, where appropriate, salary levels.
Your Way service income modelsIncome from services supplied has been provided in five components: statutory grants, personal budgets, other grants, fundraising income and other income. The services reviewed here are commissioned using different funding models and funding sources. Some are block funded, e.g. some older contracts are paid a lump sum to provide a service against a specification, whereas others are funded on the basis of number of hours delivered or people supported. A small number are spot funded, i.e. bought on an individual basis as required by the commissioner. Some services are funded by individuals with personal budgets, and a relatively small number are self-funded. A number of services receive Supporting People funding and some services have a grant-funded component.
Your Way cost componentsThe costs associated with services include four components: staffing, property, administration and learning/development. Staff costs are the largest component.
Services are delivered in various settings including existing service buildings, community locations and people’s own homes. Some locations have a rent cost, others are rent free but have responsibilities or commitments, and some use community buildings. Property costs are identified for each project for each year of operation. Some services have moved, or are moving, away from fixed physical locations.
The office and administrative costs are a relatively small component of the overall costs. Although currently small, effective peer support and, in particular, the development of people from service users to peer supporters to further careers needs to be considered.
ExclusionsThe North and South Warwickshire services have been excluded as there is no comparison data available for the services provided.

20
Note that the statutory comparators for Southwark and Shropshire do not reflect the true cost that would be incurred if the Your Way services were being provided by statutory staff; the cost comparisons do not include the full cost of providing the support, just the hourly cost of equivalent staff time. The Your Way costs include the full cost of providing a service, including administrative and office costs.
The cost comparisons in Table 4 only provide a partial view of the transformation from traditional services to Your Way. The following analysis offers more details of the cost benefit changes in two settings, Wandsworth and Southwark, based on the cost of the services before and after transition.
In Wandsworth, up until 2009–2010, services consisted of traditional day care. 134 clients were supported annually at a cost of over £700,000. A tiny proportion of these people moved on to positive outcomes (three per annum). Following service transformation, more people are supported each year: 165 at a significantly reduced cost (reduced by more than £538,000 per annum). Crucially, a significant majority of these people
moved on to more positive outcomes (101 in the year 2013–2014).
In Southwark, the transformation from traditional day care to Your Way took place a couple of years later and drew on the lessons learnt from Wandsworth. Before transformation, in 2011– 2012 Southwark supported 94 people over the year at a cost of over £261,000. Following transformation, in the year 2013–2014, 82 people were supported with a cost reduction of over £87,000 per annum.
Participants’ experiences of Your Way
Here we describe service users’ experiences of Your Way both in relation to the model’s five essential elements, and any perceived improvements to be made to the service. This is based on a total of 41 service users who participated in in-depth interviews, 14 of which completed both baseline and 12-month follow-up interviews. Qualitative interviews took place at five of the 13 evaluation sites: Hastings, Reading, Southwark, South Warwickshire and Wandsworth.
Table 4: Costs compared by service per month and per annum
ServiceCost per month Cost per annum
Your Way Statutory Difference Your Way Statutory Difference
Barnsley £21,818 £35,334 £13,516 £261,817 £424,008 £162,191
Bexhill £12,500 £27,288 £14,788 £150,000 £327,456 £177,456
Hastings £12,500 £27,288 £14,788 £150,000 £327,456 £177,456
Reading £16,250 £28,636 £12,386 £195,000 £343,632 £148,632
Rochdale £14,917 £31,547 £16,630 £179,000 £378,560 £199,560
Shropshire £9,000 £8,283 -£717 £108,000 £99,392 -£8,608
Southwark £10,937 £6,821 -£4,161 £131,240 £81,856 -£49,834
Wandsworth £10,937 £15,088 £4,151 £131,240 £181,056 £49,816

20 21
Community and social networkParticipants across all sites described Your Way as a community of people, of staff and peers, who provide support to each other to stay healthy and well.
‘I enjoy coming to Reading Your Way because people here understand you, and you don’t have to explain an awful lot. And it’s one of the few places I can come when I’m having a bad day. So the support I get from them is keeping me social and active and in a good routine.’ (B8)
‘What I’ve got from Wandsworth Your Way I’m passing on to other people. The community matters, and I’m part of that community. And I think now, I do matter myself.’ (B10)
Some service users felt that receiving support from Your Way had helped them to expand their network of social support, particularly for those who had previously lacked this. For these service users, accessing Your Way had enabled them to reduce their social isolation, giving them the opportunity to engage with others who had experienced similar issues, and to discuss their mental health concerns.
‘I don’t isolate myself as much as I used to. I like to socialise more with people.’ (F6)
‘It’s helped me break the isolation. It’s just nice to have somewhere to come where you’re understood and I don’t need to explain myself. It’s nice to feel understood.’ (F7)
‘It enables you to stop feeling so isolated within your own illness, and you are able to see that there are other people who are really successfully living with their illness, as well as some people who aren’t having such a good time at the moment.’ (B8)
An open-minded approachThe open-minded, open-access approach adopted by Your Way enabled respondents to view it as a safe space in which to seek support and advice on a daily basis, but also at times of increased need. Your Way staff and the service’s community of peers helped to provide both practical and emotional support to respondents, helping them to feel less alone during periods of ill health. The flexible nature of Your Way support had also
helped some respondents to re-engage back into the community.
‘Your Way makes sure you’re feeling OK. If you’re down, you get to speak to them. Their phone is on 24/7.’ (B11)
‘I felt really unsafe and alone and isolated and overwhelmed by it all. The structure of coming here and knowing there is support, knowing that I’m not alone; I feel a measure of safety. It’s like a coping thing.’ (B7)
‘It’s a daily event, I can come every day. Before I came here I would never do art, I certainly wouldn’t have done yoga, and I’m loving yoga at the moment. And to do it in a therapeutic environment that’s safe with other people who are like you, you can’t beat that. It’s an essential part of my life.’ (B8)
The value of peer support Peer support takes place when people with experience of mental distress support each other towards better wellbeing, as people of equal value and on a reciprocal basis, using their own lived experience as a tool for support. Peer support is a core part of Your Way and, for many respondents, this was considered one of the most meaningful and helpful elements.
The provision of peer support was considered valuable by many participants; friendships were formed and participants felt better understood by their peer supporters.
‘They’re better friends than I’ve ever had actually. They’ve suffered similar things, if not the same thing, and we have an understanding.’ (F5)
‘Peer support is so valuable because the people [peer supporters] have felt it … where you’ve been. By talking to a peer support worker, you know they’ve been where you’ve been, but they managed to get over it.’ (F8)
‘Years ago when I was very depressed, it got me out of the house, so that I could be with people that understood me.’ (B4)
‘If I didn’t have that help, and also me helping other people as well … I think I would be six feet under.’ (B10)

22
More resilienceParticipants reported having learnt a variety of approaches to managing their health and wellbeing from the Your Way team, including practical coping skills and day-to-day self-management techniques. For some, as part of an integrated package of care, support from Your Way staff had helped respondents avoid having to use acute mental health services.
The Your Way support provided a platform for participants to manage their mental health so that their illness was not perceived as an obstacle. The service also opened up potential employment or other opportunities for participants to become involved in.
‘If I’m having a really, really bad crisis, I can always talk to my key worker. It might be a small crisis, so it just needs a 10-minute or 20-minute chat with my key worker which will calm me down and get me a bit more on track. It also helps avoid me needing the mental health service.’ (B3)
‘I’m currently nearly finished the bipolar course. I’ve just started the first of eight sessions in mindfulness, which I think will be life changing for me.’ (B2)
‘Volunteering in the café has helped me look at things in a different way, and possibly see an opening in a career, job or business that I would never have considered before.’ (F2)
‘The more they support you to work with yourself, the more you can start managing on your own.’ (B6)
Participants spoke of feeling empowered to move forward in their lives, having developed an increased confidence in themselves and their abilities to do this.
‘I can see a way ahead, now I’ve done the voluntary coordinators and also the peer support course, I’ve made two films which I’m proud of.’ (B10)
‘Your Way was a catalyst to starting me on my tracks.’ (F9)
‘I’m a lot more confident and I’ve come out of myself.’ (F4)
Goal setting, an incremental processThe majority of respondents felt that support from Your Way had given them a renewed sense of motivation to pursue their personal goals. They highlighted the gradual and progressive nature of goal achievement, and how collaborative relationships with staff and peers supporters were integral to supporting this process. Respondents felt well supported in identifying and pursuing their personal goals, highlighting the importance of setting realistic, short-term goals initially, before exploring longer-term goals and aspirations. This approach enabled respondents to be more structured in identifying and setting personal goals, building their confidence over time.
‘I believe that the stability I have been able to maintain since coming here for the last year has enabled me to go to college.’ (B8)
‘I can’t really see that far in front, but yeah tomorrow, we can set a goal for tomorrow or maybe a few days’ time.’ (B3)
‘My goals are much more lofty now than when I first came here; they were limited to just getting through the day without too much pain.’ (F9)
One respondent reported that, of all the services they were currently accessing, it was the support from Your Way that provided the catalyst for change, meaning that they were finally able to turn things around for themselves.
‘I’ve had so much support and counselling from different services … and it’s been Together which has actually been the catalyst for change.’ (B17)
High-quality serviceA number of participants described the high standard of services and quality of support that Your Way staff provided. The person-centred approach meant that service users’ needs are listened to and put first.
‘They always listen. That’s what the staff are for. That’s why I like it here. They always listen to me.’ (B6)
‘It’s a different sort of support that I’d get from a therapist or a doctor. The understanding is already there.’ (B7)

22 23
One respondent described how Your Way differed from other mental health services because it focused on their strengths and mental health recovery rather than their illness. Participants also described not feeling judged by staff and being treated as equals when interacting with Your Way staff.
‘The support here is not so much about illness. It’s more a wellness-directed thing and it’s much more appropriate to me.’ (B2)
‘I’ve received a lot of help over the years but it’s always been from professionals so they are sort of like “them” and “us” or “me” and “them”. It wasn’t an equal relationship.’ (F7)
Service user-directed supportParticipants were able to meet Your Way staff where they wanted and felt they were able to offer feedback on the support received, which would be taken on board.
‘They’ve always said that if I didn’t want to come here they would meet in a café or wherever I wanted to meet.’ (B3)
‘We are in control of what’s going on.’ (F14)
‘All of my care, from everybody in my little circle, we are collaborative. I have a huge input into what happens to me, especially with medication and treatments and therapies and things.’ (F8)
‘People are free to put forward their opinions on what they would like to do, and the staff work very hard to get that sorted.’ (F9)
Areas for service improvementThe lack of barriers in receiving support from Your Way was considered important for a number of participants. Your Way was perceived by some as different to other services in terms of its informality, being user-led and not having to discuss or disclose more information than felt comfortable.
However, some participants preferred earlier opening times for one Your Way service and out-of-hours support, particularly at weekends, which was no longer provided by one site.
‘We used to get support, visits at the weekends, but that’s changed. We only get a phone call at the weekends for my medication reminder. But we want to have a visit, somebody to visit at weekends.’ (F13)
Another participant commented that Your Way needed more workers and resources as staff became busier and ‘booked up’ with other appointments, which, at times, limited their ability to arrange additional support. Despite this, the one-to-one support received was considered very positive.
One site (Wandsworth) originally operated out of two day resources centres before closing one and relocating to an administrative base only. This meant that some service users met with their Your Way support worker in a crowded café, which, at times, was not felt to be an appropriate environment in which to discuss confidential personal matters. It was reported that previously there had been ample space/rooms for having one-to-one meetings, and one participant preferred this setting to their home.
‘It’s good to have one-to-ones, and Alex [the Your Way support worker] comes to where I live and we go to a café. But when I have official letters, maybe sitting in a public environment isn’t the best to have a conversation about benefits. Because you feel self-conscious that people are listening over your shoulder.’ (B16)
Two participants highlighted the need for more support from Your Way with maintaining a healthy weight and improving their physical health.
‘One of my targets is to try and deal with my weight and I know this is a common issue for people who take certain medications; I would like to see more activities for keeping yourself physically well.’ (F9)
One younger respondent reported that they would like Your Way to offer a greater range of activities that were more appropriate for their age group.
‘There isn’t as much that I would like to do. There are no real groups that I can do. A lot of people that I’ve met are quite [a bit] older than me, so it’s not like there’s people around my age that like similar things.’ (B16)

Y O U R W AY
D I S C U S S I O N
24
Wellbeing
Your Way provides an important person-centred service for people with a diagnosed mental health problem. The average wellbeing scores for all three groups (a mean average of approximately 37–41) at baseline were lower than that found for the general population of 52.5 (12). Yet, increases in wellbeing scores were found for all groups at three months and these were significant for Groups 1 and 2. Wellbeing scores appeared to plateau after six months. However, the relatively small number of follow-up participants, particularly at six- and 12-month follow-ups, may have contributed to the non-significant result.
Health-promoting lifestyle activity
Mean scores for health-promoting and lifestyle activities improved for Groups 1 and 2, but remained broadly similar across the different time points for Group 3. For people who enrolled on the evaluation within a month of accessing Your Way (Group 1), there were significant long-term improvements observed in relation to social life and relationships, a sense of meaning, and relationships with health professionals.
Patterns of goal setting and achievement
Physical health and wellbeing was the most frequently identified first goal across all three groups at baseline, and first goals were rated ‘very important’ for the majority of all participants. Goals set by participants in Group 2 were consistently and frequently related to physical health and wellbeing, as well as employment, education and volunteering. This pattern in Group 2 was stable across all time points for goal-setting opportunities (e.g. baseline, three-month, and six-month).
Group 3 had also consistently identified goals related to physical health and wellbeing, closely followed in frequency by goals related
to employment, education and volunteering. In addition, Group 3 was the only group in which goals related to creative interests and hobbies had emerged as a common theme at baseline and six-month time points.
Interestingly, goals related to personal development and sense of self emerged as a common theme across all three groups only at six months. This may indicate that participants, or users of Your Way services, are more likely to set personal development goals after having used the service for some time and becoming accustomed to identifying and achieving goals.
It was also of interest that Group 1 was the only group with a higher focus on goals related to social support, family and community. This may suggest that social isolation is reduced and becomes less of a focus as users of Your Way services increase their access to social support opportunities. However, Group 1 may have also differed in other characteristics (as more recent members of the Your Way service), which may lend a higher propensity to focus on and identify goals related to improving social support, family and community connections.
The proportions of participants who achieved their goals differed across the time points. At three and 12 months, Group 3 showed the highest likelihood of achieving their goals. At six months, however, Group 1 showed the highest proportion of participants who achieved their goals. Group 2 also showed higher goal achievement than Group 3 at six months, although the number of participants were considerably reduced by six months and even more so at 12 months, making it difficult to draw firm conclusions about goal achievement.
An overall trend could be observed in the achievement of goals across all three groups as they showed an increased likelihood of achieving their goals at each follow-up interval, with the exception of Group 1’s enhanced goal achievement at the six-month follow-up (as stated previously). This increase was most notable in participants’

25
achievement of their second goal at the 12-month follow-up, as a majority across all three groups had achieved their goal. This may suggest an incremental improvement in goal achievement over time as service users become more familiar with the goal-setting process, and progress in line with this aspect of the Your Way model.
Hospital use
It is difficult to draw any conclusions about whether Your Way was able to reduce admissions to psychiatric hospital as few participants provided information about this at 12 months.
Cost comparisons
Where Your Way has been able to work on a large scale, it may deliver these services at lower costs than statutory equivalents. This may allow them to reach more people and offer greater variety without increasing the costs.
Current financial and commissioning systems are not designed to provide even the most basic of value-for-money information. This work shows the possibility of making cost comparisons but cannot, in itself, allow commissioners to allocate resources and contracts on the basis of benefit per pound.
Further work is needed to allow such comparisons to be part of everyday commissioning, so that services can cost the full social and care contribution that services provide to their clients and communities that rely on them.
Participants’ experiences
On the whole, the experience of using Your Way was very positive. Staff and peer supporters were valued in terms of the support they provided, and, for some participants, this provided the encouragement and motivation to move forward with their lives and to pursue work and training activities. Building resilience and increasing confidence were other important gains for participants.
Participants highlighted areas for improving Your Way, particularly around opening hours and
providing out-of-hours support and a suitable venue for one-to-one meetings.
Also important was the need for more support in maintaining a healthy weight and improving the physical health of participants, despite the emphasis Your Way places on health-promoting lifestyle activities. This is an important consideration given the reduced life expectancy and physical health problems often associated with certain psychotropic medications (13).
Limitations and factors affecting the evaluation
Participant recruitment in the first year of the evaluation proved challenging. There was an overestimation of service users’ willingness to participate in the evaluation and the capacity of local staff to recruit. Some sites tended towards low-level, outcome-focused, short-term support, which had a negative impact on longer-term engagement with the evaluation overall. As a result, initial data targets were recalculated from 600 service users to 300.
It was anticipated that evaluation participants would have recently begun accessing Your Way. In practice, this was not the case. Around a third of participants had been accessing the service prior to its transformation to Your Way, which made assessing the outcomes of the new service more difficult. However, participants from Group 1 show the ‘true’ impact of Your Way as they received their baseline assessments within a month of joining the service.
To some degree, the evaluation was aligned to the timetable for the rollout of personal budgets, which has been much slower than anticipated. The average actual take-up is around 53% across all care sectors, and for mental health the uptake of personal budgets has been markedly poor at 8.7% (14). This has had an adverse impact on the evaluation overall, as fewer potential service users have been able to buy Your Way services.
At the design stage of the evaluation, the majority of Your Way services were supporting people with moderate to severe mental health issues. The introduction of large-scale funding cuts has
24

26
resulted in significant changes to the eligibility criteria for Your Way, which currently caters for people with severe or critical mental health needs. In some areas, this has resulted in an overall reduction of those eligible to receive further support by 90%; hence, there were fewer new clients available to take part in the evaluation. Instead, many participants included in the evaluation had received Your Way for a relatively long period of time. In this respect, it is possible that the Your Way service had a less dramatic
impact on the outcomes measured if used long-term, instead serving to maintain existing levels of subjective wellbeing and health-promoting lifestyle activity over time.
At some sites, contractual limitations prevented services from fully transforming into personalised services, and these therefore had to be excluded from the evaluation. This again reduced the number of potential participants to Your Way and, subsequently, the evaluation.
Y O U R W AY
C O N C L U S I O N S
27
Your Way was developed to provide a personalised and recovery-oriented service for people experiencing mental health problems. This evaluation highlights the important findings in relation to improvements in wellbeing, health-promoting lifestyles and goal attainment.
There were huge challenges in conducting the evaluation given the differences across Your Way sites and the problems associated with participant recruitment.
On the whole, participants were positive about Your Way and felt understood by staff, and some were able to reduce their contact with statutory services with support from Your Way staff.
Cost comparisons between Your Way and other services appear to suggest some cost benefits if Your Way works on a large-scale basis or is provided as part of a broader range of services rather than in isolation.
It is not clear from the current findings whether hospital bed use was reduced, but there was some indication from qualitative interviews that service users were able to use Your Way to avoid acute care and reduce their reliance on mental health services.
Further work is needed to better understand how innovative, community-based support services can help support people with mental health problems and which groups benefit most.
26
Y O U R W AY
R E C O M M E N D AT I O N S
28
‘Every Your Way relationship starts with a conversation and a blank piece of paper.’
The personalised ethos and innovative approach of Your Way holds a substantial challenge to evaluation.
The following recommendations reflect these two challenges:
• Consequent variation of Your Way in different sites (in response to local needs, eligibility criteria, community characteristics and funding streams).
• External factors, such as the changing commissioning environment and the slow implementation of personal budgets.
1. Your Way approach: We recommend that Together continues to learn from the development of this approach, both in terms of the operation of the five essential elements and the totality of Your Way using an action research methodology within each site.
2. Embedding the Your Way model: We recommend that Together continues to embed the Your Way approach in ways that reflect funding streams and local differences within each site (including differences in service user profiles, staff backgrounds and skills, and the communities in which services are based).
3. Development of an evaluation approach: We recommend that Together and other service providers continue to develop evaluation approaches to personalised community mental health provision. For Your Way, this evaluation approach should develop flexibly in order to understand the following: (i) the developmental, ‘transformation’ and ‘embedding’ processes; (ii) the operation longer-term with regard to service-user leadership and sustainability. Future evaluations should include process and outcome components, and include the perspectives of staff (strategic, service management and front line), peer supporters and service users.
4. Cost benefit analysis (CBA): We recommend that the Department of Health invests in the independent development of a CBA approach for innovative voluntary sector provision in mental health. This will require government funding as it is beyond the resource and remit of individual service providers.
5. Personal budgets: We recommend that the UK Government, service providers, research and representative organisations review the rollout of personal budgets across the country for people with mental health problems, including people who experience episodic ill health. This review should consider the commissioning and (national and local) policy leadership required to develop innovative self-directed support models and services.

Y O U R W AY
R E F E R E N C E S
29
1. HM Government. Caring for our future: Reforming care and support. London: HM Government; 2012.
2. Department of Health. Putting People First: A shared vision and commitment to the transformation of adult social care. London: Department of Health; 2008.
3. Mind. Personalisation in Mental Health: A review of the evidence. London: Mind; 2009.
4. Carr S. Personalisation: A rough guide. Adult Services Report. 2nd ed. Vol 20. London: Social Care Institute for Excellence; 2010.
5. Tennant R, Hillier L, Fishwick R, Platt S, Joseph S, Weich S, Parkinson J, Secker J, Stewart Brown S. The Warwick-Edinburgh Mental Wellbeing Scale (WEMWBS): Development and UK validation. Health and Quality of Life Outcomes. 2007; 5(63): 1–13.
6. Walker SN, Hill-Polerecky DM. Psychometric Evaluation of the Health-Promoting Lifestyle Profile. Nebraska: University of Nebraska Medical Center, NE; 1996.
7. Clarke S, Oades LG, Crowe TP, Deane FP. Collaborative goal technology: Theory and practice. Psychiatric Rehabilitation Journal. 2006; 30(2): 129–136.
8. Lemmi V, Crepaz-Keay D, Cyhlarova E, Knapp M. Peer-led self-management for people with severe mental disorders: An economic evaluation. The Journal of Mental Health Training, Education and Practice. 2015; 10(1): 14–25.
9. Curtis L. Unit Costs of Health and Social Care 2012. Canterbury: Personal Social Services Research Unit at the University of Kent; 2012.
10. Department of Health. NHS Reference Costs 2010–11. London: Department of Health; 2011.
11. Department of Health. NHS Reference Costs 2011–12. London: Department of Health; 2012.
12. Craig R, Mindell J. (eds). Health Survey for England 2012. London: The Health and Social Care Information Centre; 2013.
13. Naylor C, Galea A, Parsonage M, McDaid D, Knapp M, Fossey M. Long-term conditions and mental health: The cost of co-morbidities. London: King’s Fund and Centre for Mental Health; 2013.
14. Last J. 90 per cent not granted mental health personal budgets, says charity CEO. Civil Society. Weblog. [Online] Available from: http://www.civilsociety.co.uk/finance/news/content/14773/90_percent_dont_qualify_for_mental_health_personalisation_says_charity_ceo [Accessed 26 March 2013].
28

A P P E N D I X 1
D E TA I L E D F I N D I N G S F O R W E L L B E I N G A N D H E A LT H - P R O M O T I N G L I F E S T Y L E A C T I V I T Y S C O R E S
30
T1 (baseline) T2 (3 months) T3 (6 months) T4 (12 months)
Gro
up 1
Gro
up 2
Gro
up 3
Gro
up 1
Gro
up 2
Gro
up 3
Gro
up 1
Gro
up 2
Gro
up 3
Gro
up 1
Gro
up 2
Gro
up 3
WEMWBS 91 107 91 60 67 64 35 49 42 16 30 23
HPLP II 89 106 90 61 66 65 35 48 40 16 28 22
Table A1 shows the number of WEMWBS and HPLP II assessments collected from individual participants over the course of the evaluation by group.
Table A1: Assessments collected at each time point by group
Table A2 shows the number of participants that completed assessments over multiple time points by group.
T1/T2 T1/T3 T1/T2/T3 T1/T4 T1/T2/T3/T4
Gro
up 1
Gro
up 2
Gro
up 3
Gro
up 1
Gro
up 2
Gro
up 3
Gro
up 1
Gro
up 2
Gro
up 3
Gro
up 1
Gro
up 2
Gro
up 3
Gro
up 1
Gro
up 2
Gro
up 3
WEMWBS 60 67 64 35 49 42 31 38 33 16 30 23 10 12 14
HPLP II 61 66 65 35 48 40 30 37 32 16 28 22 10 10 14
A2: Participants completing assessments over multiple time points

2
WEM
WB
ST1
T2T3
T4
NM
inM
axM
ean
SD
NM
inM
axM
ean
SD
NM
inM
axM
ean
SD
NM
inM
axM
ean
SD
Gro
up 1
9
114
64
37.6
10.2
60
186
84
0.5
11.1
3520
60
39.8
9.9
1628
66
39.8
9.9
Gro
up 2
107
1659
36.9
10.5
6714
61
39.7
11.2
49
1759
39.2
10.3
3018
5438
.39.1
Gro
up 3
91
1470
41.1
11.6
64
1770
42.
511
.74
215
5939
.510
.423
216
64
1.2
10.4
War
wic
k-Ed
inbu
rgh
Men
tal W
ellb
eing
Sca
le (W
EMW
BS
)
Tabl
e A
3: W
ellb
eing
des
crip
tive
s
HPL
P II
– G
ener
al
Hea
lth
T1T2
T3T4
NM
inM
axM
ean
SD
NM
inM
axM
ean
SD
NM
inM
axM
ean
SD
NM
inM
axM
ean
SD
Gro
up 1
89
14
2.18
.70
06
11
42.
26.6
8135
14
2.29
.667
161
32.
06
.680
Gro
up 2
106
14
2.0
8.6
64
66
13
2.20
.638
48
14
2.29
.617
281
32.
04
.576
Gro
up 3
90
14
2.31
.64
76
51
42.
37.6
514
01
32.
23.6
60
222
32.
45
.510
Hea
lth-
Prom
otin
g Li
fest
yle
Profi
le II
(HPL
P II)
(by
subs
cale
)
Tabl
e A
4: G
ener
al h
ealt
h de
scri
ptiv
es
HPL
P II
– Ex
erci
se
T1T2
T3T4
NM
inM
axM
ean
SD
NM
inM
axM
ean
SD
NM
inM
axM
ean
SD
NM
inM
axM
ean
SD
Gro
up 1
89
14
2.27
.86
36
11
42.
26.9
3435
14
2.34
.938
161
42.
19.8
34
Gro
up 2
106
14
2.11
.887
66
14
2.35
1.074
48
14
2.38
.937
281
42.
25.8
87
Gro
up 3
90
14
2.21
.94
26
51
42.
29.8
794
01
42.
13.8
5322
14
2.31
.898
Tabl
e A
5: E
xerc
ise
desc
ript
ives
3130

32
HPL
P II
– Fo
od
T1T2
T3T4
NM
inM
axM
ean
SD
NM
inM
axM
ean
SD
NM
inM
axM
ean
SD
NM
inM
axM
ean
SD
Gro
up 1
89
14
2.29
.710
61
14
2.33
.598
351
42.
49
.74
216
13
2.4
4.6
29
Gro
up 2
106
14
2.12
.726
66
14
2.18
.783
48
14
2.29
.74
328
13
2.18
.612
Gro
up 3
90
14
2.50
.79
76
51
42.
31.7
894
01
42.
40
.84
122
14
2.4
5.7
39
Tabl
e A
6: F
ood
desc
ript
ives
HPL
P II
– S
ocia
l Lif
e T1
T2T3
T4
NM
inM
axM
ean
SD
NM
inM
axM
ean
SD
NM
inM
axM
ean
SD
NM
inM
axM
ean
SD
Gro
up 1
89
14
2.4
3.6
206
11
42.
61
.80
235
14
2.83
.70
716
14
2.81
.750
Gro
up 2
106
14
2.6
1.7
63
66
14
2.4
7.7
49
48
14
2.52
.74
328
14
2.50
.694
Gro
up 3
90
14
2.74
.680
65
24
2.72
.625
40
14
2.6
8.7
3022
24
2.77
.685
Tabl
e A
7: S
ocia
l lif
e de
scri
ptiv
es
HPL
P II
– H
ealt
h Pr
ofes
sion
als
T1T2
T3T4
NM
inM
axM
ean
SD
NM
inM
axM
ean
SD
NM
inM
axM
ean
SD
NM
inM
axM
ean
SD
Gro
up 1
89
14
2.56
.673
61
14
2.75
.830
351
42.
83.7
8516
14
2.88
1.025
Gro
up 2
106
14
2.67
.76
56
61
42.
56.7
47
48
14
2.58
.821
281
42.
61
.685
Gro
up 3
90
24
2.82
.758
65
24
2.78
.696
40
14
2.70
.79
122
24
3.0
0.7
56
Tabl
e A
8: D
ealin
g w
ith
heal
th p
rofe
ssio
nals
des
crip
tive
s
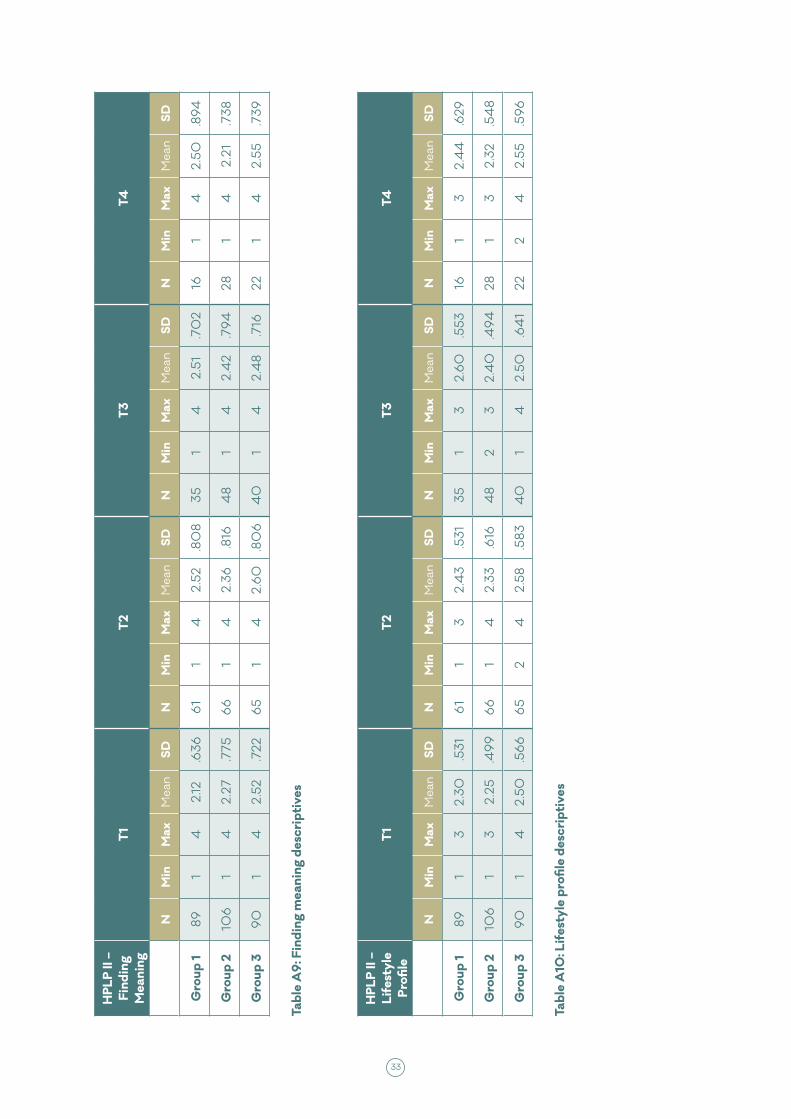
33
HPL
P II
– Fi
ndin
g M
eani
ng
T1T2
T3T4
NM
inM
axM
ean
SD
NM
inM
axM
ean
SD
NM
inM
axM
ean
SD
NM
inM
axM
ean
SD
Gro
up 1
89
14
2.12
.636
61
14
2.52
.80
835
14
2.51
.70
216
14
2.50
.894
Gro
up 2
106
14
2.27
.775
66
14
2.36
.816
48
14
2.4
2.7
9428
14
2.21
.738
Gro
up 3
90
14
2.52
.722
65
14
2.6
0.8
06
40
14
2.4
8.7
1622
14
2.55
.739
Tabl
e A
9: F
indi
ng m
eani
ng d
escr
ipti
ves
HPL
P II
– Li
fest
yle
Profi
le
T1T2
T3T4
NM
inM
axM
ean
SD
NM
inM
axM
ean
SD
NM
inM
axM
ean
SD
NM
inM
axM
ean
SD
Gro
up 1
89
13
2.30
.531
61
13
2.4
3.5
3135
13
2.6
0.5
5316
13
2.4
4.6
29
Gro
up 2
106
13
2.25
.49
96
61
42.
33.6
164
82
32.
40
.494
281
32.
32.5
48
Gro
up 3
90
14
2.50
.56
66
52
42.
58.5
834
01
42.
50.6
41
222
42.
55.5
96
Tabl
e A
10: L
ifes
tyle
pro
file
desc
ript
ives
32

A P P E N D I X 2
G O A L C AT E G O R I E S C O D I N G S C H E M E
34
1. Physical health and wellbeing Goals related to seeking medical or physical healthcare (e.g.
physiotherapy), lifestyle changes (e.g. healthy eating, establishing regular sleeping patterns) and improving physical health and wellbeing (e.g. exercise, losing weight).
2. Mental health, medication and service use Goals related specifically to the treatment of mental health
problems, such as improved adherence to medication, reduction in medication dosage or seeking professional mental health support.
3. Social support, family and community Goals related to connecting with family, friends or other
members in their community, including repairing damaged family relationships, spending more time with family/friends, and using social support services within the community.
4. Creative interests and hobbies Goals ranged from wanting to travel more, visiting museums,
painting and gardening, to finding a hobby and exploring new interests.
5. Employment, education and volunteering Goals included all levels of study, finding employment and/
or voluntary work, and improving employability or developing work-related skill sets, such as building a CV.
6. Housing, legal and financial Goals related to accessing housing or resolving financial or
legal issues, as well as seeking advice or support with managing money and seeking social security benefits.
7. Life skills/independence Goals included any aspect of managing day-to-day living
(e.g. organising, cleaning, shopping) and increasing levels of independence and capacity (for example, using the train to go to London).
8. Personal development/sense of self Goals related to development or improvement of coping skills,
self-management techniques and personal development. These goals ranged from wanting to gain confidence or achieving a sense of calm, to finding ways of reducing self-harming behaviours. Some were reflective in nature, with participants aiming to develop a sense of ‘peace’ or ‘contentment’ in order to contribute to a positive sense of self.
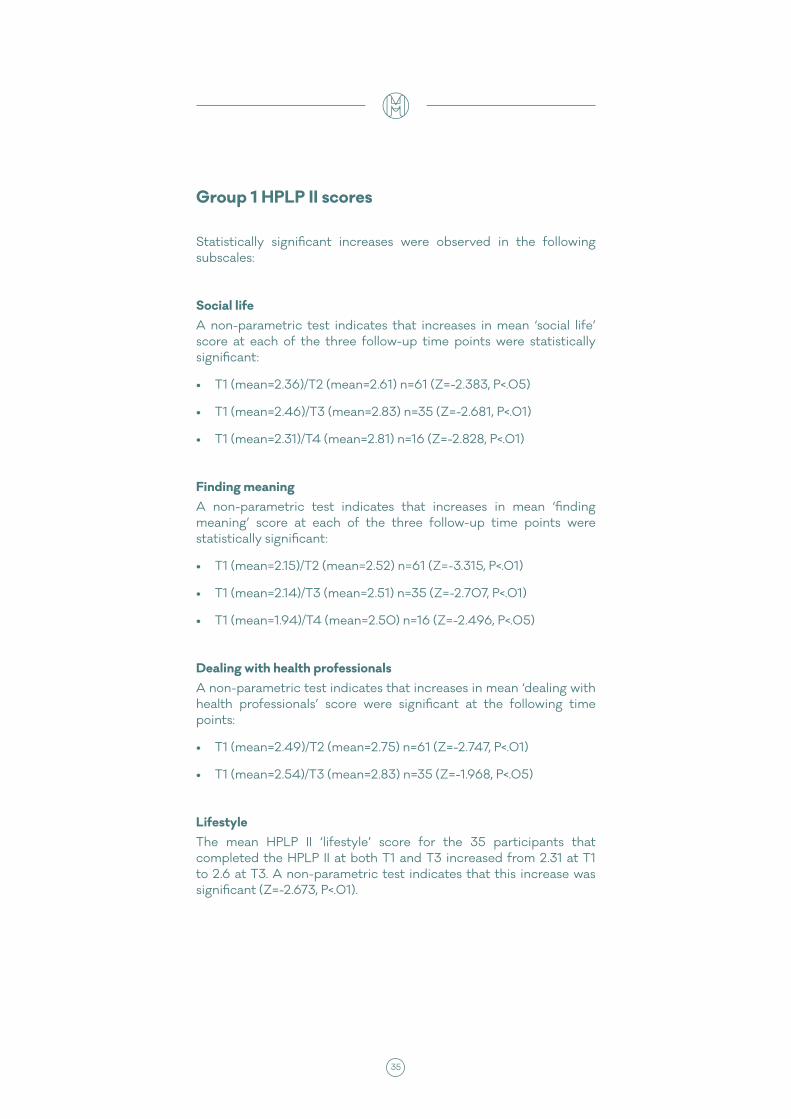
35
Group 1 HPLP II scores
Statistically significant increases were observed in the following subscales:
Social lifeA non-parametric test indicates that increases in mean ‘social life’ score at each of the three follow-up time points were statistically significant:
• T1 (mean=2.36)/T2 (mean=2.61) n=61 (Z=-2.383, P<.05)
• T1 (mean=2.46)/T3 (mean=2.83) n=35 (Z=-2.681, P<.01)
• T1 (mean=2.31)/T4 (mean=2.81) n=16 (Z=-2.828, P<.01)
Finding meaningA non-parametric test indicates that increases in mean ‘finding meaning’ score at each of the three follow-up time points were statistically significant:
• T1 (mean=2.15)/T2 (mean=2.52) n=61 (Z=-3.315, P<.01)
• T1 (mean=2.14)/T3 (mean=2.51) n=35 (Z=-2.707, P<.01)
• T1 (mean=1.94)/T4 (mean=2.50) n=16 (Z=-2.496, P<.05)
Dealing with health professionalsA non-parametric test indicates that increases in mean ‘dealing with health professionals’ score were significant at the following time points:
• T1 (mean=2.49)/T2 (mean=2.75) n=61 (Z=-2.747, P<.01)
• T1 (mean=2.54)/T3 (mean=2.83) n=35 (Z=-1.968, P<.05)
LifestyleThe mean HPLP II ‘lifestyle’ score for the 35 participants that completed the HPLP II at both T1 and T3 increased from 2.31 at T1 to 2.6 at T3. A non-parametric test indicates that this increase was significant (Z=-2.673, P<.01).
34

mentalhealth.org.uk