Your Feedback Matters, To You: Evidence from Extension Services
37
1 Your Feedback Matters, To You: Evidence from Extension Services Maria Jones and Florence Kondylis * Incomplete Draft This Version: October 16, 2014 Empowering users to demand better services has become a keystone of social development programs. We show that offering farmers the opportunity to provide feedback to their agricultural extension provider increases satisfaction with and demand for the service both in current and following periods. We find evidence of spill overs, as other non-user farmers in the vicinity are more likely to take up the extension service. We further investigate the channels through which feedback tools affect users’ demand for a service. We randomize different types of feedback tools to shed light on the role of information in guiding farmers’ appreciation for the service. In one treatment, farmers are asked for general feedback, while in the other we solicit training-by-training ratings. The modes of administration were also randomized: in person vs. over a hotline. We find that all types of feedback tools have large, positive impacts on farmers’ attendance in training and take up of the service in the following year. This suggests that providing additional information on the nature of the service does not have additional value in increasing demand. Yet, who collects feedback matters: local managers have a greater impact, relative to headquarters staff. Cheaper hotline services are as effective as any type of in-person feedback provision. Feedback tools may augment quality purely by signaling higher costs of shirking to the service providers. To disentangle supply-side from demand-side effects, we randomly announce additional monitoring to extension workers in communities with and without feedback tools. Extension workers respond to the announcement in both treated and control. This supports the idea that extension workers did not respond to our intervention by exerting more effort in villages where additional monitoring took place. We conclude that the large impacts feedback tools have on farmers’ demand for extension services are primarily attributable to farmers’ empowerment. 1 Introduction How do feedback mechanisms affect users’ demand for services? Empowering users to demand better services has become a keystone of social programs. International development organizations such as the World Bank (WB) advocate the use of participatory users’ surveys to enhance service
Transcript of Your Feedback Matters, To You: Evidence from Extension Services

1
Your Feedback Matters, To You:
Evidence from Extension Services
Maria Jones and Florence Kondylis *
Incomplete Draft
This Version: October 16, 2014
Empowering users to demand better services has become a keystone of social
development programs. We show that offering farmers the opportunity to provide
feedback to their agricultural extension provider increases satisfaction with and
demand for the service both in current and following periods. We find evidence of
spill overs, as other non-user farmers in the vicinity are more likely to take up the
extension service. We further investigate the channels through which feedback
tools affect users’ demand for a service. We randomize different types of feedback
tools to shed light on the role of information in guiding farmers’ appreciation for
the service. In one treatment, farmers are asked for general feedback, while in the
other we solicit training-by-training ratings. The modes of administration were
also randomized: in person vs. over a hotline. We find that all types of feedback
tools have large, positive impacts on farmers’ attendance in training and take up
of the service in the following year. This suggests that providing additional
information on the nature of the service does not have additional value in
increasing demand. Yet, who collects feedback matters: local managers have a
greater impact, relative to headquarters staff. Cheaper hotline services are as
effective as any type of in-person feedback provision. Feedback tools may augment
quality purely by signaling higher costs of shirking to the service providers. To
disentangle supply-side from demand-side effects, we randomly announce
additional monitoring to extension workers in communities with and without
feedback tools. Extension workers respond to the announcement in both treated
and control. This supports the idea that extension workers did not respond to our
intervention by exerting more effort in villages where additional monitoring took
place. We conclude that the large impacts feedback tools have on farmers’ demand
for extension services are primarily attributable to farmers’ empowerment.
1 Introduction
How do feedback mechanisms affect users’ demand for services? Empowering users to demand
better services has become a keystone of social programs. International development organizations
such as the World Bank (WB) advocate the use of participatory users’ surveys to enhance service

2
provision in their projects.1 The idea is that users are best placed to monitor service delivery, and
can provide crucial information in closing the accountability loop (Banerjee et al., 2010; Björkman
and Svensson, 2009). The spread of users’ feedback tools is not restricted to public interest programs,
with customer surveys being widely adopted by the service industry as a way to retain customers
and boost satisfaction with the service. Yet, while attention has recently been given to beneficiary
monitoring as an accountability tool to improve the quality of services, little is known as to whether
establishing feedback loops can in fact affect users’ demand for these services. Even less explored are
the channels through which feedback mechanisms may lead to higher demand for services. Typically,
“theories of change” associated with users’ feedback loops assume that satisfaction and demand for
the service improve through supply-side effects resulting from improved accountability, and demand-
side effects, as users are empowered to demand better service (World Bank, 2003). However, there is
little evidence on the respective roles of pure accountability relative to demand-side users’
empowerment in improving service delivery.
Remedying informational inefficiencies is central to addressing the low adoption of profitable
technologies among poor farmers.2 Farmers will not adopt new, profitable cultivation practices and
technologies if they do not have information about them. Agricultural extension services aim to
reduce information inefficiencies that hinder the diffusion of new, productive technologies3, and are
particularly prominent in the developing world (Akroid and Smith, 2007). Anderson and Feder
(2003) estimate that 90 percent of the world’s agricultural extension staff is in developing countries.
* Development Economics Research Group, World Bank. Corresponding author: Florence Kondylis, [email protected].
We thank Jasmeen Batra and Cindy Sobieski for superb management of all field work, and Paula Gonzalez for excellent
research assistance. We are grateful to the Ministry of Agriculture and Animal Resources in Rwanda and the staff from the
Land Husbandry, Water Harvesting, and Hillside Irrigation Project for their leadership in this work. We thank One Acre
Fund (Tubura) for their hard work in implementing the feedback interventions and granting us unlimited access to their data.
Finally, we thank the Global Agriculture and Food Security and the i2i fund for generous financial support. We thank Jishnu
Das, David Evans, Xavi Gine, Steve Haggblade, Stuti Khemani, Arianna Legovini, Daniel Stein, for their insightful comments
at various stages of the study, as well as participants in the World Bank Research Group’s Half-Baked seminar. All usual
disclaimers apply, particularly that the views expressed in this paper do not engage the views of the World Bank and its
members. 1 This approach is often referred to, in policy circles, as Participatory Monitoring and Evaluation (PM&E),and includes Citizen
Report Card and Beneficiary Assessment, as outlined here:
http://web.worldbank.org/WBSITE/EXTERNAL/TOPICS/EXTSOCIALDEVELOPMENT/EXTPCENG/0,,contentMDK:2050935
2~menuPK:1278203~pagePK:148956~piPK:216618~theSitePK:410306,00.html. 2 Jack (2011) offers an excellent literature review on the role of informational inefficiencies on the adoption of agricultural
technologies in developing countries. 3 By “productive technology” we refer to a technology that is yield-enhancing under a best practice scenario, as described by
Evenson (2001).

3
Yet, adoption of new technologies is lagging behind. Modern maize varieties are adopted on only 17%
of maize cultivated area in Africa, compared to 90 percent in East and South Asia (Gollin et al.,
2005). Observational evidence on the effectiveness of classic models of extension services is mixed.
Birkhaeuser et al. (1991) find no significant relation between extension provision and on-farm
productivity for traditional training and visit extension programs in SSA. Evenson (2001) and
Dercon et al. (2009) identify positive impacts, while Miller et al. (2008) find attendance in extension
training to be the strongest correlate of adoption of a new technology. Given the budget shares
allocated to extension services across Sub-Saharan Africa, 4 allocating more monetary resources may
not be a viable policy option to improve the supply of extension services to farmers.
Non-governmental extension services are seen as a potential solution to securing higher quality
extension services (Anderson and Feder, 2003; Axinn, 1988; Feder et al., 2001). In fact, NGO and
private sector-operated extension services account for about 17 percent of all extension services. A
literature has emerged that proposes to test alternative modalities to delivering extension services to
farmers, with recent experimental evidence showing that using contact farmers to deploy
information to farmers can be effective in boosting adoption of new technologies (BenYishay and
Mobarak, 2013; BenYishay et al., 2014; Kondylis et al., 2014a and 2014b). These studies focus on
public extension networks and pay little attention to demand-side mechanisms, or on modalities to
make non-governmental extension services work for farmers.
The literature on agricultural extension systems places the accent on demand-side constraint to
private (or fee-based non-governmental)5 extension provision.6 Feder et al. (2001) provide an
exhaustive survey of systems of extension. Their review highlights the tendency general
participation to drop under fee-based extension services, at the risk of excluding the poorest farmers.
Yet, they also mention that fee-based extension services are more client-oriented. We take these
4 This shares, as reported by Akroid and Smith (2007), ranges from 20 to 40 percent of total Ministries of Agriculture budget.
Anderson and Feder (2003) estimate that, in 1988, six billion US dollars were allocated to extension activities worldwide. 5 In the rest of the text, we refer interchangeably to non-governmental and private extension services, since in our context the
extension services are delivered against a fee by an NGO. 6 There are many institutional and political reasons governments are eager to retain centrally administered agricultural
extension systems; see Axinn (1988) for a detailed description of the tradeoffs associated with different extension delivery
systems.

4
observations seriously test the extent to which stronger feedback mechanisms can be leveraged to
combat high levels of dropouts in the context of a fee-based extension service in Rwanda.
We exploit a large randomized controlled trial (RCT) to formally document the impact of feedback
tools on farmers’ demand for a non-governmental agricultural extension program. We show that
offering farmers the opportunity to provide feedback to their extension provider increases
satisfaction and demand for the service both in ongoing and following seasons, and that the effect on
take up spills over to other, non-user farmers in the vicinity. We find that the effects on attendance
in trainings are particularly large for female farmers, with effect size of 50 percent relative to the
control group. Consistent with this jump in attendance, we find large effects on farmers’ perception
of their service provider. This translates into a higher (revealed) demand for the service, as the
incidence of dropouts is reduced by half in treated groups. While only farmers who had taken up the
service in the 2013 season were asked to provide feedback, the effect spills over to non-users: farmers
groups who had access to feedback tools are 28 percentage points more likely to attract new
members, relative to a 8 percent chance in the control group.
We further investigate the channels through which feedback tools affect users’ demand for a
service. Randomizing different types of feedback tools sheds light on the mechanisms that link
feedback provision to higher demand. First, we compare a feedback tool designed to anchor farmers’
expectations of the content and quality of the service, a scorecard, to a simple, open-ended feedback
tool, the logbook. This allows us to test the impact of salience of information on quality standards in
guiding farmers’ appreciation for the service. Our results suggest that anchoring farmers’
expectations on quality standards has no additional impact on their appreciation of service, as
modeled using uptake of the service in the following season. This is not entirely surprising in the
context of a fee-based service, as farmers sign a contract with the provider at the onset of the season
that describes what extension trainings they should receive and outlines the provider’s “service
charter”. In that sense, our results are not inconsistent with recent evidence on the importance of
information in establishing strong accountability lines (Bjorkman et al., 2014). However, we find
that providing information on the content of the training significantly increases male attendance in

5
training relative to an open-ended feedback tool. Similarly, the effect of adding curriculum-based
questions to scorecards increases the magnitude of the impact of scorecards on women’s attendance
in training, although parameter equality cannot be rejected across treatments. These findings are in
line with the idea that farmers may be induced to learn through noticing (Mullainathan et al., 2014),
and that salience of information plays a role in piquing their interest in extension training. However,
we fail to detect a significant increase in yields or knowledge scores as a result of our feedback
experiment.
Second, we randomize feedback collection mechanisms within the logbook treatment arm: a third
of the logbooks are collected in person by the local field manager, who directly supervises the
extension officer, a third are collected in person by a central administrator, and a third are collected
through a free hotline service by a central administrator.7 This allows us to test whether collection
mechanisms (in-person vs. phone-based) and identity of the feedback collector matter. We find that
the identity of the feedback collector matters to farmers when the logbook is collected in person:
paper logbooks have positive impacts on training attendance and farmers’ perceptions only when
collected by a local manager. Yet, phone-based collection has similarly large impacts as in-person
collection by a local manager. This suggests that there may be tradeoffs between anonymity and
direct accountability.
These findings are not inconsistent with a pure supply-side monitoring story, where feedback
tools improve service provision by simply signaling higher costs of shirking to extension officers. We
attempt to disentangle pure supply-side from demand-side effects. For this, we exploit the fact that
scorecards are directly observed by farmers, but not by extension officers.8 We announce to the
extension officers that scorecards will be administered to farmers in random subsets of both our
scorecard treatment communities and our control communities. Should extension officers in fact
perfectly observe which communities receive scorecards, announcing them would have no impact on
their effort levels, and therefore on farmers’ demand and perceptions. In addition, should the effects
7 All logbooks are then similarly transferred to both local and central administrations for follow-up action.
8 Scorecards were administered on days where extension officers were not holding training. We could only run this test in the
scorecard part of the experiment, as logbooks, which stay in the communities, are fully visible to the extension officers.

6
of feedback tools be purely attributable to a surge in supply as a result of monitoring, we would find
the effects of announcing scorecards to be indistinguishable from the combined effect of actually
administering scorecards and announcing scorecards. Yet, the announcement to extension officers
has positive effects on farmers’ demand for the service both in treatment and control communities.
Announcing scorecards only has much smaller effects than actually administering them, with or
without announcement. This lends support to the idea that extension workers did not
overwhelmingly respond to our intervention by exerting more effort in villages where additional
monitoring took place, which is corroborated by other robustness checks. As the additional and net
effects of announcing scorecards are small relative to the effects of scorecards alone, we conclude that
the large impacts feedback tools have on farmers’ demand for extension services are primarily
attributable to farmers’ empowerment.
Our experiment provides evidence on the potential for users feedback mechanisms to address two
main pitfalls of private extension services: farmers may not buy the service beyond the first year, as
returns over the long run are unclear, and the trainings may be tailored to the more sophisticated
farmers (Alwang and Siegel 1994; Anderson and Feder, 2003; Axinn, 1988; Saito 1994). First, we find
that farmers’ access to feedback tools has large, positive impact on subsequent take up of a private
extension service in Rwanda, and that this effect extends to non-users in the vicinity of the treated
groups. This is important as extension services aim to address farmers’ knowledge gaps on an
ongoing basis, and not just to promote new technologies. For instance, securing farmers’ interests in
training in the long is seen as a necessary step in building farmers’ resilience to climate vagaries and
other idiosyncratic shocks (Davis et al., 2014). Second, we find that women, whose demand for
training is lower than that of men in the control, were the most affected by our treatment. This is
consistent with the idea that private extension training may not be aligned with all farmers’ needs
and focus on selling services to the more affluent farmers.9 This may result from a combination of
demand-side constraints, as women’s perceive the benefits of training to be low and supply-side
9 Axinn (1988) cites the need for a two-way communication channel between extension and farmers to reduce these
inefficiencies.

7
inefficiencies, as providers have little information as to what training more marginal farmers require
and, therefore, face higher acquisition costs in reaching this subpopulation.
Finally, while a recent strand of the literature formally documents the impact of users’
involvement in monitoring service provision on service delivery, most of the studies focus on public
services where supply-side constraints are large and incentives may not be fully aligned, or
accountability mechanisms too weak to allow for efficient feedback loops (Banerjee et al, 2010;
Banerjee et al., 2004). Studying a non-governmental, fee-for-service provider allows us to more
directly address demand-side inefficiencies. Users will only pay in the future if they are satisfied,
reinforcing the credibility of a feedback mechanism. Farmers likely understand that the provider
wants their business, and therefore that the provider may credibly be trying to meet users’
expectations.
The remainder of the paper is organized as follows. We place the experiment in the context of
extension services in Rwanda and provide background on beneficiary feedbacks in Section 2. Section
3 details the experimental design and data sources. Section 4 presents the main empirical results.
Section 5 concludes.
2 Motivation and context
This section describes the institutional context of agricultural extension services in Rwanda, and
places our study in the context of beneficiary feedback mechanisms used in development programs.
2.1 Institutional setting
Increasing agricultural productivity is central to the Government of Rwanda’s Economic
Development and Poverty Reduction Strategy. The agricultural sector is the sector with the greatest
potential to reduce poverty in Rwanda. Approximately 85% of the population lives in rural areas and
rural poverty is persistent. The rural poverty rate is 48.7%, compared to 22.1% in urban areas.10
Rwanda is one of the most densely populated countries in Africa, and land is scarce: Smallholders in
10
These figures were published by the Ministry of Finance & Economic Planning (MINECOFIN) in 2013.

8
rural areas farm an average of 0.59 hectares, fragmented into 4 to 5 plots. Despite large efforts to
convert non-cultivated areas into arable land, the scope to increase cultivated area is limited.
Increasing agricultural productivity is essential for sustainable poverty reduction and economic
growth. The public agricultural extension system in Rwanda has limited outreach, providing
information to less than one-third of rural households in 2012 (MINECOFIN, 2013). Poor quality of
service delivery and informational content are also important constraints. Instead of increasing its
investment in public extension services, the government aims to transition from service provider to
“facilitator of the private sector”, as capacity grows and private sector investment increases.11
(Ministry of Agriculture and Animal Resources – MINAGRI, 2013).
As a test case for private agricultural extension service provision, MINAGRI established a
memorandum of understanding with One Acre Fund to provide agricultural extension services for its
flagship Land Husbandry, Water Harvesting and Hillside Irrigation (LWH Project). One Acre Fund,
known in Rwanda as Tubura, seeks to provide “a business solution for smallholder farmers.”12 It
offers farmers a bundle of services, including farm inputs and agricultural extension, on credit.
Tubura’s coverage is substantial, as it reached 130,400 Rwandan farm families in 2013. The
agricultural extension component of the service consists of 11 training sessions over the course of the
year, on topics such as: planting, urea application, nurseries, crop disease identification, safe use of
pesticides, composting, nutrition, harvest, and storage. Trainings are delivered at the farmer group
level, with Field Officers (extension officers) providing in-field follow-up as needed.
One Acre Fund provides a fee-based service, aiming to achieve full recovery of field expenses
through farmer repayment. Globally, 73% of One Acre Fund’s expenses were covered through farmer
repayment in 2013.13 In Rwanda, Tubura clients pay an annual membership fee of approximately
$3.65 (RWF 2500) and 19% interest on loans for agricultural inputs. Membership benefits include:
agricultural extension trainings, delivery of inputs to the cell level,14 weather and yield insurance,
11 Strategic Plan for the Transformation of Agriculture in Rwanda Phase III 12 http://www.oneacrefund.org/our-approach/program-model/ 13 Figures on repayment as a proportion of expenses are not reported at the country level. In 2013, OAF had field operations in
Rwanda, Burundi, Kenya and Tanzania. 14 Rwanda’s administrative divisions, from largest to smallest: districts, sectors, cells, and villages (imidugudu).

9
and in-field follow-up. Tubura Field Officers (FOs) serve as both agricultural extension agents and
loan servicers, facilitating farmer trainings and collecting payments. FOs are supervised by Field
Managers (FMs).
2.2 Feedback mechanisms in development programs
The intervention of interest in our study is akin to a ‘citizen report card’ experiment. This concept
was first developed by civil society organizations in Bangalore, India, in 1993 in response to concerns
about the quality of public services. Citizen report cards provide citizen feedback on various policies /
programs, and are meant to serve as social accountability mechanisms that identify poor
performance and stimulate improvement.15 They are part of an approach to making services work for
the poor that emphasizes “client power.” This approach has gained prominence in the last decade;
the World Development Report 2004 “Making Services Work for Poor People” emphasizes the need to
increase poor citizens’ voice and participation.16 However, as Duflo and Banerjee (2006)17 document,
despite widespread enthusiasm, few programs that increase beneficiary control have been rigorously
evaluated, and the evidence so far is mixed. In addition, feedback mechanisms appear to yield
varying degrees of impact on quality and quantity of service provision, as well as on usage. To some
extent, this could be attributable to differences in implementation protocols, which are typically not
formally tested. For instance, as Duflo and Banerjee (2006) discuss, mediated vs. mechanized
protocols could mean the difference between success and failure for this class of interventions.18
While, ultimately, all citizen report cards and feedback mechanisms prompt users to give feedback
on services, there is no consensus on the best way to elicit that feedback, and little research as to
whether the way in which a report card is implemented matters.
Most citizen report card interventions in development programs target the delivery of health and
education services. Unsurprisingly, the few rigorous evaluations that have been done are also
15 Empowerment Case Studies: Citizen Report Card, Bangalore 16 World Bank Development Report (2004) 17 Banerjee, Abhijit, and Esther Duflo, 2006. “Addressing absence”. Journal of Economic Perspectives, American Economic
Association, vol. 20(1), pages 117-132, Winter. 18 As cited in Banerjee and Duflo (2005), see mediated feedback process in Kremer and Chen, 2001, and mechanized process in
Duflo et al., 2011.

10
specific to those sectors. Bjorkman and Svennson (2009)19 show that community monitoring of public
health facilities—through a citizen report card implemented in a random subset of communities in
Uganda—contributes to the improvement of the quality and quantity of health care, as health unit
staff exert greater effort to serve the needs of the community. There are few examples of citizen
report cards in agriculture. One exception is Mogues et al (2009)20, who find high rates of satisfaction
with extension services in Ethiopia: 92% of men and 94% of women who received extension or expert
advice report being ‘very satisfied’. However, only 8% of those farmers reported adopting any new
practice or use of inputs (whether improved or conventional) over the last two years. Interestingly,
looking at the descriptive statistics from our scorecard experiment, we find similar levels of
satisfaction with the private extension service, with under 3 percent of farmers reporting
unhappiness with any specific training.21 This is despite finding low levels of attendance in training.
Therefore, these large discrepancies between self-reported satisfaction and actual usage may have
more to do with methodological concerns with the reliability of satisfaction surveys. A central
limitation of the methodology is that farmers who do not attend extension trainings do not have a
voice. In our experiment, implementing satisfaction surveys in various forms is the intervention of
interest, and we do not attempt to analyze the results from the data collected in the process.22
Instead, we are interested in the impact of giving farmers a voice on their demand for extension
services.
The literature on citizen empowerment presents mixed evidence on the impact of feedback loops
or scorecards in boosting citizens’ empowerment, and it would at best offer a partial solution to
improve service delivery. In a sense, the main concern for both the service provider and the
government on the quality of service provision is that extension workers’ incentives (Field Officers,
FOs) may not be aligned with farmers’ interests. Indeed, the provider’s main performance indicator
19 Martina Björkman and Jakob Svensson, 2009. "Power to the People: Evidence from a Randomized Field Experiment on
Community-Based Monitoring in Uganda," The Quarterly Journal of Economics, MIT Press, vol. 124(2), pages 735-769, May. 20 Tewodaj Mogues, Marc J. Cohen, Regina Birner, Mamusha Lemma, Josee Randriamamonjy, Fanaye Tadesse and
Zelekawork Paulos, 2009. “Agricultural Extension in Ethiopia through a Gender and Governance Lens”. IFPRI discussion
paper Discussion Paper No. ESSP2 007. 21 The response rate was high, ranging from 56 to 97 percent across the different formats of scorecards. Satisfaction rates do
not appear sensitive to response rate. Satisfaction levels are computed conditioning on a farmer attending a specific training. 22 Since various feedback mechanisms are compared side by side, we could not devise a common metric of satisfaction across
treatment arms, making the exercise fruitless.

11
for an FO is repayment rate on the loans they monitor and number of clients; this raises concern
over the content of their interactions with farmers. Introducing “softer” measures of performance in
their assessment is therefore of interest both in reinforcing satisfaction with and demand for the
service.
3 Experimental Design & Data
The experiment took place in 3 of Rwanda’s 30 districts: Karongi and Rutsiro districts in the
Western province and Rwamagana district in the Eastern province. The sampling frame is all
registered clients of Tubura for Season 2013A, comprising 228 farmer groups.23 We randomly sample
180 of the 228 groups, a total of 1,767 farmers.24
We worked with Tubura and the Ministry of Agriculture to introduce and test a variety of farmer
feedback tools between September 2012 and June 2013, thus covering two agricultural seasons.25 ,
We devise a randomized-controlled trial (RCT) to test two types of feedback tools: scorecards and
logbooks. A third intervention cross-cuts the scorecard treatment and explores the impact of (falsely)
announcing scorecards to FOs in villages where they are (not) administered. Table 1 summarizes the
study design.
The first class of intervention consists of administering two different feedback tools, scorecards
and logbooks, among Tubura farming clients. The scorecard is designed to anchor farmers’
expectations of the content and quality of the service through a series of topic-based questions with
multiple answers, while the logbook is a simple, open-ended feedback tool.
Within our study sample, we randomly assign 90 groups to the scorecard treatment. Scorecards
were administered every three months over the study period; each scorecard surveyed farmers’
experience with three different types of trainings that Tubura FOs were mandated to hold over the
23 While the sampling frame is the population of Tubura clients in 2013A, we use the Tubura client registry in the subsequent
two seasons (Season 2013B and Season 2014A) to track retention of members over seasons and the addition of new members. 24
The average of 10 individuals per farmer group gives us sufficient power to detect fairly small effects; at 85% power the
minimal detectable effect size is .17 standard deviations on the outcomes of interest for as few as 24 control groups. 25
The two main agricultural seasons run from September to February, and February to June. A third season goes from July-
August but is restricted to irrigated land, which corresponds to under 2% of farmers in our sample.

12
last three months. We evenly randomize three different types of scorecards across the 90 groups: a
graphic-based scorecard (designed for respondents with low literacy levels) administered in person
during a group meeting (in the absence of the FO); a questionnaire-style scorecard administered in
person by a trained enumerator; and a questionnaire-style scorecard administered over the
telephone. By holding the content of the scorecard constant across the questionnaire-style and the
phone scorecard, we test whether the way feedback is collected matters to farmers. Similarly,
varying the amount of information provided in the scorecard across the graphic-based and the
phone/questionnaire scorecards allows us to capture the role of information in anchoring farmers
expectations. This is done as follows: in the graphic-based scorecards, we only ask whether a farmer
has received certain trainings and whether she is satisfied with them (e.g., planting training). In
contrast, the phone and in-person survey scorecards ask whether certain skills were taught (e.g.,
“Did your Tubura FO teach you or anyone else in your household how to plant in lines when
sowing?”). The scorecards were then used by Tubura to assess the quality of their service, in a way
that anonymized the group and farmers who provided data but not the responsible FO. The results
(aggregated at the group level) were shared with each treated group in the subsequent round of
scorecard data collection, just before each interview.
We assign 132 groups to the logbook treatment, and evenly allocate three variations of the
logbooks across those 132 groups: a paper logbook collected by the local Tubura Field Manager, a
paper logbook collected by a Tubura monitoring and evaluation staff person from a central level, and
a free feedback hotline. As opposed to the scorecards, which were supply-driven and administered by
our survey team, the logbooks we demand-driven and farmers could log their comments anytime in
any of the format. Each group leader was in charge of storing the paper logbook in her house and
helped other farmers log their feedback. In the hotline treatment, farmers had access to a paper
logbook but had to call in to transmit their feedback to Tubura. We explore complementarities
between scorecards and logbooks, and randomly assign 66 of the scorecard treatment groups to the
logbook intervention, leaving us with 24 pure control farmers groups in the full interaction model.

13
Thirdly, we overlay an “announcement” intervention to our scorecard treatment arm. Tubura
informed its Field Officers (FOs) scorecards may be taking place in half or the groups assigned to the
scorecard treatment, and half of the groups that did not receive a scorecard. This provides a
“placebo” set of groups where the FOs will be told that scorecards might happen but in fact will not
be. Similarly, there will be no announcement for half of the groups where scorecards actually do take
place. Comparing announcement to no announcement provides a test of the extent to which
awareness of the scorecards can itself boost efforts of the FO in training these specific farmers
groups. While we control logbook treatment assignment dummies in our analysis of the
announcement effect, we are not powered to study their interactions.
3.1 Data
We use two sources of data: administrative data from our partner NGO, Tubura, and survey data
administered on a random subset of our study sample. First, we exploit Tubura’s administrative
client database for two years, 2013 and 2014. The client database includes the name of all farmers
who register for Tubura membership in the season, the name of the group to which the farmer
belongs, the Tubura Field Officer and Field Manager responsible for the group, the total amount of
credit requested by the client, the quantity requested of specific agricultural inputs,26 the number of
repayments, and the proportion of the loan repaid. Our study sample was drawn from the 2013 client
database. We track whether these farmers continue with the service in 2014. If a client in 2013 does
not register for the service in 2014, she is considered a dropout. If a farmer was not on the client list
in 2013A, but registers in 2014, we consider her to be a new member. Some clients registered in 2013
(in and outside our study sample) switch farmer group in 2014; we do not consider these farmers to
be either dropouts or new members. In our group-level analysis, we follow the initial 2013 group
composition and apply these definitions of dropouts and new members.
26 Tubura offers DAP, NPK-17, NPK-22, and Urea.

14
Second, we collect a multi-module household survey among Tubura farming clients in our study
sample in June–July 2013.27 The instrument was designed to generate quantitative data on
agricultural production, participation in agricultural extension services, perceptions of agricultural
extension providers, and socioeconomic characteristics. We randomly sample 8 farmers in each of the
180 farmers groups in the study sample, or a total of 1,460 farmers responded to the survey.
3.2 Farmer characteristics
Tubura clients in the sample areas took loans averaging $48 (RWF 32,898) for Season A. Clients
repaid the Season 2013A loans in an average of 6.5 installments. 29% of the farmers took credit in
Season B as well. Loan sizes in Season B are smaller, averaging $29 (RWF 20,060).
19 Tubura Field Officers work in the sample area. They are responsible for 12 farmer groups on
average (minimum 2, maximum18), a total of 134 clients (minimum 20, maximum 209).28 5 Tubura
Field Managers (FM) oversee the Field Officers. They manage an average of 6 of the sampled FOs
each (minimum 2, maximum 9). It is worth mentioning that, typically, a farmer would know who the
FM in charge of her zone is, as FMs supervise enrollment and input delivery meetings.
73% of the sampled households are male-headed. Household heads are on average 45 years old,
and most (77%) have less than a primary school education. The household head is the Tubura client
in 84% of households.
3.3 Balance
We verify that observed socioeconomic characteristics are balanced across our treatment and
control groups. For brevity, we only report results for the main assignment variables: we pool
together the two feedback treatment groups (scorecards and logbooks) in Table 1, and announcement
in Table 2), although the results hold for all treatment arms. We find that most individual and
group-level characteristics are balanced across treatment and control groups, with the exception of
gender of the head and age of the head in the announcement arm. However, these differences are
small; we will control for these characteristics in our regression analysis.
27 Fieldwork was implemented by an independent research firm. 28 Statistics come from Tubura’s administrative records and refers to all Tubura clients in LWH sites.

15
3.4 Threats to identification
Ideally, we would have assigned our intervention at the FO level. However, given the low
number of FOs we had access to (19), we could not satisfy sample size requirements to statistically
detect a reasonable effect size. As FOs serve both treatment and control groups, we worry that our
intervention may displace effort from our farmer group to another. A mitigating factor is that FOs
are incentivized on the basis of farmers’ repayment rate overall. Hence, there is little risk that they
would adjust on the extensive margin and choose to altogether neglect some groups to the benefit of
others, and risk lowering their overall repayment rates. In fact, we find that farmers’ repayment
rates are not affected by our intervention, which suggest that FOs did not respond by shirking in
control farmers groups (Col. 1, Table 11). As an additional check, we verify that training attendance
aggregated up to the group level is not affected by our interventions. For this, we aggregate
individually reported attendance in training at the group level, taking the maximum value of the
dummy for attendance and the average number of trainings attended by group members. This gives
us a measure of access to training within a given group. The results (Cols. 2 and 3, Table 11) suggest
that trainings were equally offered to all groups regardless of their assignment to our interventions.
Instead, we expect that FOs would adjust their effort on the intensive margin, by providing
better service in groups where farmers demand it, while still attending other groups at pre-
intervention levels. However, different FOs may respond differently to the treatments, and, by
nature of the randomization, different FOs served different proportion of treatment and control
groups. We control for FO heterogeneity in all our regression analysis. We will therefore estimate
within-FO variations in farmers’ demand for the service as a result of our interventions.
4 Results
To track the impact of our feedback intervention on farmers’ outcomes, we estimate (1) on a range
of outcomes variables along the causal path.

16
The random assignment of farmers groups into the different treatments—Logbooks (L),
Scorecards (S), Announcement (A), and their interactions (LS, AS)—makes the empirical strategy. In
most specifications, we estimate the following model on men and women farmers separately:
(1)
where, indexes the group member, indexes the farmers group, indexes the extension provider for
group , and indexes the outcome. represents FO effects (for which FO dummies are included),
and is an individual random error term. To draw statistical inference, standard errors are
clustered at the farmer group level, using White’s correction, to account for the unit of randomization
and allow for correlated residuals within farmers group.
4.1 Farmers’ demand for extension services
A. Interactions with extension services
Experimental evidence shows that providing farmers with access to feedback tools increased
usage of extension services, although the impact differs across gender lines (Table 4). The top panel
of the table report regression coefficients, and the lower panel reports a number of additional
statistics, including the p-values of differences in relevant coefficients to guide inference. We
consider five measures of farmers’ interaction with their extension provider: whether farmers know
their local extension agent (Cols. 1 and 6); whether farmers attended any extension trainings over
the last two seasons (Cols. 2 and 7), and if yes, how many trainings (Cols. 3 and 8); whether a farmer
experiences problems with the service (Cols. 4 and 9) and whether she reported the problem to
Tubura (Cols. 5 and 10).
Men’s interactions with extension services were only affected at the intensive margin of their
attendance in training (Col. 3, Table 4), and only in the scorecard treatment. This is a large effect, as
men in the scorecard treatment group attended 0.76 additional training, relative to a mean of 1.01 in
the control group. Providing logbooks did not have any significant impact on men’s attendance,

17
although scorecards interacted with logbooks had a smaller effect on attendance than scorecards
alone.
In contrast, scorecards and logbooks affected women’s interaction with extension services at the
extensive margin: women were 15-19 percentage point more likely to know their extension provider
relative to 54 percent of the control group (Col. 6), and 13-25 percentage point more likely to attend
at least one training a year relative to 18 percent of the control (Col. 7). Although the coefficients
cannot be distinguished statistically, scorecards have the largest impact on attendance, and
interacting scorecards and logbook is relatively less productive. However, we do not detect any effect
at the intensive margin (Col.8).
The differing impact of access to feedback on attendance across gender lines deserves some
scrutiny. Male and female farmers in the control group have very different interactions with the
extension providers, with men 50 percent more likely to know the extension agent, and more than
twice as likely as women to attend training. A plausible interpretation is that, as male and female
farmers face different barriers to attendance, the effect of feedback tools on addressing these
constraints will vary. In the case of men, who had more exposure to extension in the control,
scorecards may have brought additional salience to the types of trainings proposed, prompting them
to attend more frequently. In contrast, logbooks, which did not provide information on training
content, had no effect. In the case of women, who had little exposure, both feedback tools may have
simply increased their general awareness that they were entitled to extension trainings.
We check whether this increase in attendance in trainings affected farmers’ knowledge of the
various techniques through a simple test score (Table 9). We fail to detect any impact on knowledge.
This is not altogether surprising, given the techniques taught were not particularly new to farmers.
We also estimate equation (1) on yields and find no meaningful impact.
Finally, we find that having access to feedback tools did not significantly affect farmers’
propensity to experience and report problems with the service (Table 4, Cols. 4-5, 9-10). This is
reassuring to the extent that it lends support to our main identifying assumption: agents did not

18
reallocate their effort from control to treatment communities. This is also reflected by the fact that
treatment and control farmers experienced similar repayment rates (not reported).
B. Farmers’ perceptions of extension agents
Did our intervention impact farmers’ opinion of the service? To shed light on this question, we
turn to farmers’ perception of their extension agent. We asked farmers a series of question about
their agent’s knowledge of agriculture, teaching skills, and honesty. We asked them to rate them on
a {1,2,3,4} scale, 1 being very bad and 4 being very good. We pool these measures into a single index
and normalize it to a binary variable, with mean 0.60 and 0.66 for men and women respectively in
the control group. We estimate equation (1) on this index for men and women separately (Table 5).
Interestingly, the results suggest that only logbooks influenced farmers’ opinions of the quality of
their extension agents, increasing their propensity to express favorable views by 11-15 percentage
points, or an 18-23 percent increase.
Taken together, these findings indicate that for men, who already have a higher probability of
attending training than women, anchoring expectations of the service in addition to providing a
channel of feedback leads them to demand even more trainings. For women, offering any feedback
tool increases their likelihood of attendance, but the additional gains from anchoring expectations
were insignificantly small. The positive impact of anchoring expectations for men does not persist for
expectations. Anchoring expectations did not lead to an increase in appreciation of their extension
workers for either men or women. In contrast, an open-ended feedback mechanism, the logbook, did
have substantial impacts on perceptions.
C. Farmers’ Take up
While we find that access to feedback significantly affected farmers’ attendance and perception of
their extension agent, it is of interest to check whether our intervention affected farmers’ decision to
take up the service in the following year. In addition to tracking take up decision among existing
service users, we measure the impact of the intervention on locally-placed non-users. We measure

19
the incidence of drop outs and new member enrollment at the group level (cf. Data section). We
estimate the following equation:
(2)
where, indexes the farmer groups, indexes the extension provider for group , and indexes the
outcome. represent FO effects (for which FO dummies are included), and is an individual
random error term. Results are shown in Table 6.
First, we check that our intervention did not affect the structure of farmers’ groups. As farmers
groups can merge and divide up, leading to attrition from one season to another, one was that our
intervention may have affected this dynamic. We estimate (2) on a dummy for group survival that
takes value 1 if the group remains active in the following season, 0 if it dies (Col. 1). The results
indicate that our intervention did not affect a group’s probability to survive across season, allowing
us to interpret changes in the incidence and prevalence of dropouts and new enrollments. We
additionally check for balance in group size in the season contemporaneous with the launch of our
intervention, Season A 2013 (Col. 2). We find that group size was not significantly different across
treatments and control.
Scorecards and logbooks have similarly large effects on the group-level incidence of dropouts.
Groups offered feedback mechanisms were 29-44 percentage points less likely to have at least one
member drop out, relative to an 88 percent incidence in the control group (Col. 6). The intensive
margin indicates a large reduction in dropouts as a result of our intervention as well, with groups
offered logbooks losing 1.94 fewer members than the control, a 46 percent decrease, equivalent to
half a standard deviation (Col.7). Scorecards led groups to lose 1.03 fewer users, although the effect
is not statistically different from zero. To further understand these average effects, we turn to the
distribution of dropouts across treatments and control (Figure 1 and Figure 2). Comparing the
prevalence of dropouts across logbook treatment and control (Figure 1), we see that providing
logbooks shifted the distribution of dropouts towards zero (blue area) and reduced the incidence of
higher dropout rates (red area). This unambiguously reduced the number of dropouts (Table 6, Col.

20
7). Interestingly, the picture is much different under the scorecard treatment (Figure 2): groups who
were offered scorecards were more likely to either have no dropouts, or have a lot of dropouts,
relative to the status quo (in the blue areas). Hence a smaller average effect on the prevalence of
dropouts (Table 6, Col. 7).
By reducing information asymmetries, anchoring farmers’ expectations on the content of service
they should receive may have helped farmers assess the quality of service, and decide to pay for the
service if and only if they are satisfied with the quality and content.
D. Spillovers.
We next test whether providing users with feedback tools had any impact on non-users in the
vicinity. The underlying hypothesis is that the lack of opportunity to influence the delivery of
Tubura’s extension services presents a significant barrier to farmers’ take up.
We regress the number of non-users that have joined a group on our treatment assignment
variables, as described in equation (2). We isolate large, positive spillover effects to non-users in the
vicinity of the treated groups (Table 6). Groups that were offered any channel of feedback were 26-28
percentage points more likely to attract new members (Cols. 4 and 6); these are very large effects
relative to an 8 percent chance in the control group. Looking at the intensive margin, we find that
the type of feedback tool matters. Logbooks had the most persuasive effect, adding on average 1 new
member to a group, or 1.2 standard deviation. Scorecards had a smaller, imprecise effect, adding on
average 0.61 new users. One explanation for the differential in impact between scorecards and
logbooks may be that, as logbooks stayed in the communities over the two seasons, non-user farmers
became fairly aware of their existence. In contrast, scorecards were not directly observable to non-
users.
These large effects on take up of the Tubura service in the vicinity of treated communities
indicate that our intervention addressed a significant barrier to adoption of this service. As
neighboring client farmers gain access to channels of feedback, this may have signaled to non-users
that Tubura will be responsive to their information needs.

21
4.2 Demand-side vs. supply-side effects
The increase in demand for extension services associated with the introduction of feedback tools
is not inconsistent with a pure supply-side monitoring story. It is possible that simply signaling
higher costs to shirking to extension agents would have yielded the same effects on demand. We
devise a simple test of this competing hypothesis. We randomly announce additional monitoring to
extension providers in communities assigned both to receive and not to receive scorecards.29 Should
these effects result from a pure supply-side story, we would find the effects of announcing to be
indistinguishable from the effects of actually implementing scorecards and announcing monitoring.
This would allow us to rule out the demand-side story, that feedback tools empowered farmers to
demand more extension services.
To enhance the credibility of our announcement intervention, we restrict our test to the scorecard
treatment arm, as logbooks stayed with the communities throughout the experiment and were
plausibly visible to the extension agents. We cannot rule out that extension agents had full
knowledge of the location of the scorecards, which would weaken our intervention. However, the data
collection was done by an independent firm that conducted multiple surveys for other purposes in
the villages over the course of the same agricultural seasons, so the scorecards may not have caught
attention, and the telephone scorecards would more likely have gone unnoticed. Should extension
officers perfectly observe the scorecards, then extension officers should not react to false
announcement (i.e., announcement of scorecards in groups which actually did not receive them), and
only respond to the announcement in actual scorecard groups.
There are two important limitations in interpreting the results from this test. First, it will
provide results if the presence/announcement of scorecards has an impact on farmers’ outcomes; if
not, the announcement will have no effect on anything (|YTs|A - YCs|NA|=0). In our context, this is not
a concern as we established above that scorecards affected farmers’ outcomes, either through supply
or demand channels, and that |YTs|A - YCs|NA|>0. Second, we are not sufficiently powered to precisely
29 We could only run this test in the scorecard part of the experiment, as logbooks, which stay in the communities, are fully
visible to the extension officers.

22
estimate and tell apart small differences in estimated parameters. As a result, we are left to
interpret non-statistically meaningful differences. We controlled for the assignment variable to this
“Announcement” intervention and its interaction with the scorecards treatment in all previous
specification, and results are reported in all Tables of results (Tables R.1.-R.4).
The results show that we can reject that FOs cannot tell at all where the scorecards take place,
and adjust their performance to announcement only ([YTs|A-YTs|NA]-[YCs|A-YCs|NA]=0 with |YTs|A-
YTs|NA| >0, |YCs|A-YCs|NA|>0). Should FOs have been able to perfectly tell where the scorecards
happened, we should see that [YTs|A-YTs|NA]=[YCs|A-YCs|NA]=0. We find that this is not the case, as
falsely announcing scorecards has the same effect as truly announcing them in many specifications.
Strikingly, announcing scorecards changes the effect of the scorecard intervention, weakening its
impact on men’s attendance (Col. 3, Table 4), while strengthening its impact on women’s (Col. 7,
Table 4). This corroborates this idea that scorecards affected demand for extension services through
other channels than a pure monitoring story. Hence we conclude that FOs can imperfectly tell and,
thus, imperfectly adjust to the announcement. Our estimates generally support that |[YTs|A-YTs|NA]-
[YCs|A-YCs|NA]|>0 with |YTs|A-YTs|NA|>0 and |YCs|A-YCs|NA|>0.
Overall, while we find some weak evidence that announcing the scorecards had some effect on
farmers’ demand for the service both in actual treatment and control communities, these effects are
much smaller than the effect of the scorecards, and mostly statistically indistinguishable from zero.
This lends support to the idea that the extension workers did not overwhelmingly respond to our
intervention by exerting more effort in villages where additional monitoring took place. As the effects
of announcing monitoring are small relative to the effects of scorecards alone, we conclude that the
large impacts feedback tools have on farmers’ demand for extension services are primarily
attributable to farmers’ empowerment.
4.3 What feedback tool?
We implemented various modalities of both the scorecards and the logbooks, to test for
differences in either impact or cost-effectiveness (Table 8).

23
For the scorecards, we tested a graphics-based scorecard implemented at the group level (visual),
a traditional in-person interview at the household level (in-person), and a telephone interview using
a call center (telephone). There are few statistically distinguishable differences in effect sizes across
the indicators of interest, though the magnitude of effect is consistently larger for in-person and
telephone interviews. For women, we see that the positive impact of the scorecards on training
attendance, noted above, is most pronounced for in-person and telephone scorecards (Col 4). In terms
of cost-effectiveness, the telephone scorecards have clear advantages: impacts are similar to the in-
person interviews, but achieved at one-fifth of the price (Table 10).
For the logbooks, we tested whether who collects the logbooks matters, and whether the modality
of data collection has an impact. Specifically, we compare paper logbooks collected by the local
Tubura Field Manager) to paper logbooks collected by an M&E Officer from Tubura headquarters,
and to a free hotline service for farmers to call in to log their complaints. Reporting to a local
manager creates a chain of direct accountability, as the Field Manager is the direct supervisor of the
Field Officers, but no anonymity. Reporting an M&E officer provides less direct accountability, but
somewhat more anonymity, as the M&E officers are not locally based. Reporting through the hotline
allows for complete anonymity, but no direct accountability as the problem is reported through
headquarters staff. We find that the positive effects of offering logbooks on farmers’ attendance in
trainings (Table 8, cols 1 and 3) and perception of their FO (cols 2 and 4), noted above, are driven by
the logbooks collected by a local manager and the hotline service. The logbooks collected by the M&E
officer have no significant impact. This implies that farmers value having direct accountability and
anonymity, but are willing to make trade-offs between the two. In terms of cost effectiveness, the
hotline service is clearly advantageous: scaled up to the whole of Tubura’s service area, it involves no
travel costs, and takes only two full-time staff at headquarters.
4.4 Sustainability
Finally, we check whether administering feedback tools changes the way users react to future
problems with the delivery of the service. For instance, should farmers feel that the service delivered

24
is still misaligned with their needs despite their feedback, they may get discouraged and give up on
giving feedback, or drop out of the service altogether. This may be especially true when the type of
feedback tool is particularly intensive, as in the scorecard treatment arm. We put this question to
the farmers, and walked them through a number of hypothetical scenarios in which they face issues
with the service. The scenarios covered service delivery issues such as: FO is late to training; FO
asks for repayment and does not provide training; training did not convey useful information; and
FO did not follow up in the farmer’s field. (These questions were administered as a last section of the
module on extension services to avoid biasing responses.) Farmers could pick a variety of responses,
from taking direct action (e.g. complain directly to the officer or to the local manager or local leader),
to doing nothing directly useful (complain to neighbor or friends), to dropping out of the service (stop
repaying, or repay but stop attending). We coded these three categories of responses respectively as
“Do something”, “Do nothing”, and “Drop out” and build three variables that reflect how likely a
farmer would be to take any of these actions. Note that these actions were not mutually exclusive,
and farmers could choose up to two responses.
We estimate equation (1) on these three variables (Table 7). We find that scorecards have
particularly large effects on men’s projected responses to newly arising issues with the extension
service. Men report being 15 percentage points more likely to “do nothing”, relative to a mean of 43
percent in the control group, or a 33 percent increase. The incidence of dropouts also increase by 5
percentage points for men in the scorecard treatment group, or a 200 percent increase, although the
effect is only statistically detected when logbooks are paired with the scorecard intervention. Women
appear to be less affected than men, although the direction of the effects is fully aligned with those
measured on the men sample. The only non-zero effect is that of logbooks on “Dropouts”, implying a
150 percent increase. “Do something” is less likely for both men and women in all treatment arms,
including the false announcement of scorecards, although it is never statistically significant.
In sum, we find some evidence that a more invasive form of feedback such as a scorecard
mechanism may in fact discourage farmers from acting on future issues with the service. In contrast,

25
a simpler less intensive feedback tool, the logbook, seems not to have displaced other forms of
feedback nor discouraged farmers from taking action.
5 Conclusion
We designed and evaluated a large randomized controlled trial to shed light on whether farmers’
ability to influence the quality of the service they receive from a non-governmental extension
provider affects their demand for the service. Our results show that offering feedback channels has
meaningful impacts on securing farmers’ interest and demand for the service, and the positive effects
spill over to non-users in the vicinity. Farmers groups who have access to feedback tools are 28
percentage points more likely to attract new members, relative to control groups that have an 8
percent chance to attract new members. This shows that feedback tools retain farmers but also lower
barriers to take up among non-users.
Men and women respond differently to the feedback tools. This is unsurprising in that levels of
interaction with extension services differ by gender in the control group, implying that women and
men face different demand-side constraints. Offering feedback appears to be particularly effective in
getting women to start interacting with the extension agent, while for men, it intensified
participation with no effect at the extensive margin. Yet, conditional on having interacted with their
agent, men and women experience similar increases in their appreciation of the service when offered
a simple logbook. Anchoring expectations with a content-based scorecard however did not have an
additional positive impact on farmers’ appreciation. This suggests that varying marketing strategies
and service packages could be efficient in securing men and women’s demand for agricultural
services.
The intensity of feedback also seems to matter. Scorecards and logbooks varied in their nature;
logbooks were a more open-ended, demand-based version of the scorecards, available at any time. In
contrast, the scorecards were administered on a rigid schedule, structured with multiple-choice
questions, and provided information to farmers on the services they should expect. That additional
information was particularly effective in getting men to attend training more often relative to an

26
open-ended logbook, while women adjusted their attendance equally across scorecard and logbook
treatments. In terms of perceptions of the service provider, logbooks led both male and female
farmers to form more positive views, while scorecards did not. Similarly, logbooks unambiguously
decreased the incidence and numbers of dropouts in the following season, while scorecards lead to a
lower incidence with no effect on the number of dropouts. This is because dropouts behave bi-modally
under the scorecards treatment, with groups experiencing either large or small numbers of dropouts.
This suggests that scorecards successfully anchored farmers’ expectations, and influenced their
assessment of the provider.
We find that the mode of feedback collection matters less than the literature on Beneficiary
Feedbacks typically presumes. In this context, in-person feedback collection is, if anything, much less
cost-effective than phone-based collection. This was true both for structured scorecards and open-
ended logbooks. However, the identity of the person who collected the logbooks mattered: farmers
responded positively to the intervention when the local manager gathered the logbooks, and not at
all when a central administrator (the M&E officer) did. However, phone-based collection of the
logbook through a free hotline was as effective as collection by the local manager, showing that
farmers may have seen a tradeoff between anonymity and clarity of accountability. Hence, we
conclude that, by significantly cutting costs with no adverse effects, phone-based feedback collection
is preferable for service providers.
Overall, our findings suggest that providing channels for users to voice their opinion on the
service they receive can trigger higher levels of demand. Implicitly, organizations that choose to
establish these channels of communication with their users are likely interested in using the
feedback to guide their operations. This is important, as we find that our more intensive mode of
feedback collection, the scorecard, may have negative impact on farmers’ attitude in the face of
future problems with the service. A policy implication of this finding is that feedback mechanisms
need to be taken seriously by the providers, or risk being counter-productive. When imposed in a top-
down fashion, such as is the case when central governments impose accountability mechanisms at
the sub-national level, where services are managed, their impact may not be warranted.

27
References
Akroyd, S., and L. Smith (2007). “Review of Public Spending to Agriculture”, Oxford Policy
Management, July 2007.
Anderson J.R., and G. Feder (2003). “Rural extension services.” World Bank Policy Research
Working Paper 2976.
Axinn G. (1988), Guide on Alternative Extension Approaches, FAO, Rome.
Banerjee A., R. Banerji, E. Duflo, R. Glennerster, and & S. Khemani (2010). "Pitfalls of Participatory
Programs: Evidence from a Randomized Evaluation in Education in India," American Economic
Journal: Economic Policy, American Economic Association, vol. 2(1), pages 1-30, February.
Banerjee A., A. Deaton, and E. Duflo (2013). “Wealth, Health, and Health Service Delivery in Rural
Rajasthan,” American Economic Review, 94, 326–330.
BenYishay, A., Jones M., Kondylis F., and Mobarak M. (2014) “Technology diffusion and gender”,
Mimeo, World Bank and Yale University.
BenYishay A., and Mobarak A.M., Communicating with Farmers Through Social Networks (2013).
Yale University Economic Growth Center Discussion Paper No. 1030; Yale Economics Department
Working Paper No. 121
Birkhaeuser D., E. Robert, and G. Feder (1991). "The Economic Impact of Agricultural Extension: a
Review." Economic Development and Cultural Change, 39(3): 607–650.
Björkman M. and J. Svensson (2009). "Power to the People: Evidence from a Randomized Field
Experiment on Community-Based Monitoring in Uganda," The Quarterly Journal of Economics, MIT
Press, vol. 124(2), pages 735-769, May.
Bjorkman, Martina and de Walque, Damien and Svensson, Jakob, Information is Power:
Experimental Evidence on the Long-Run Impact of Community Based Monitoring (August 1, 2014).
World Bank Policy Research Working Paper No. 7015.
Davis, K., S.C. Babu, and S. Blom (2014). “The role of extension and advisory services in building
resilience of smallholder farmers”, Building Resilience for Food and Nutrition Security: Conference
Brief 13.
Dercon, Stefan, and Daniel O. Gilligan, John Hoddinott and Tassew Woldehanna (2009). "The
Impact of Agricultural Extension and Roads on Poverty and Consumption Growth in Fifteen
Ethiopian Villages," American Journal of Agricultural Economics, Agricultural and Applied
Economics Association, vol. 91(4), pages 1007-1021.
Evenson, R. (2001). “Economic impacts of agricultural research and extension”, Handbook of
Agricultural Economics, Volume 1, Part A, Pages 573–628.
Feder, G., A. Willett and W. Zijp (2001). “Agricultural extension: Generic challenges and the
ingredients for solutions” in Knowledge Generation and Technical Change: Institutional Innovation
in Agriculture. S. Wolf and D. Zilberman (Eds). Boston, Kluwer.
Gollin, D., M. Morris, and D. Byerlee (2005). "Technology adoption in intensive post-Green
Revolution systems." American Journal of Agricultural Economics 87(5): 1310-1316.
Hanna, R., S. Mullainathan and J. Schwartzstein, 2012. “Learning Through Noticing: Theory and
Experimental Evidence in Farming,” NBER Working Paper 18401.

28
Jack, K.. “Market inefficiencies and the adoption of agricultural technologies in developing
countries.” ATAI White Paper, CEGA (Berkeley) and J-PAL-MIT (2011).
Kondylis, F., V. Mueller, and S. Zhu (2014a). “Seeing is believing? Evidence from an extension
network experiment”. World Bank Policy Research Paper 7000 (August 2014).
Kondylis, F., V. Mueller, G. Sheriff, and S. Zhu (2014b). "Experiment highlights importance of
gender in dissemination of agricultural technologies in Africa". IFPRI Discussion Paper:
http://www.ifpri.org/publication/policy-experiment-mozambique-highlights-importance-gender-
dissemination-sustainable-land.
Miller, M., M. Mariola, and D.O. Hansen (2008). “EARTH to farmers: Ecological management and
sustainable development in the humid tropics of Costa Rica”. Ecological Engineering, Volume 34(4):
349-357.
Ministry of Agriculture and Animal Resources Rwanda – MINAGRI (2013). “Strategic Plan for the
Transformation of Agriculture in Rwanda Phase III. Republic of Rwanda.
Ministry of Finance and Economic Planning Rwanda – MINECOFIN (2013). “Economic Development
and Poverty Reduction Strategy 2013 – 2018: Shaping our Development.” IMF Country Report No.
13/360
World Bank (2003). World Development Report 2004: Making Services Work for Poor People. New
York, NY: Oxford University Press.

29
Figures
Figure 1: Distribution of dropouts, Logbook treatment vs. Control (status quo)
Figure 2: Distribution of dropouts, Scorecard treatment vs. Control (status quo)
30
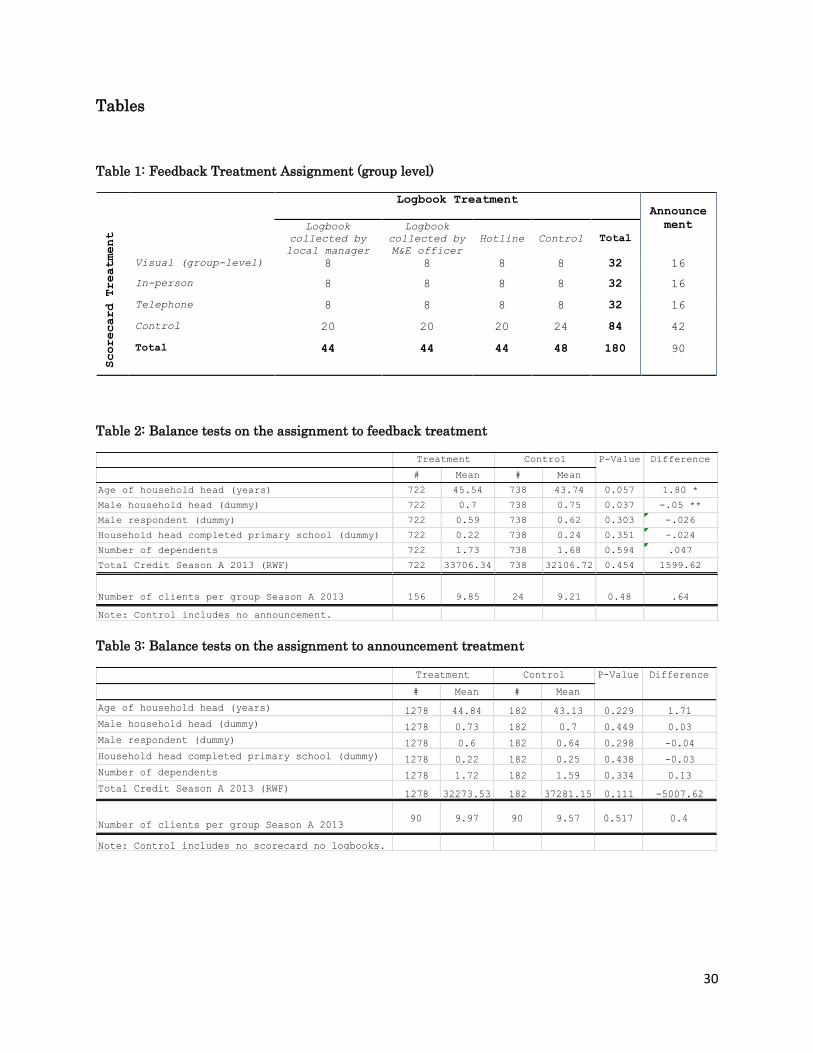
Tables
Table 1: Feedback Treatment Assignment (group level)
Table 2: Balance tests on the assignment to feedback treatment
Table 3: Balance tests on the assignment to announcement treatment
Scorecard Treatment
Logbook Treatment Announce
ment
Logbook
collected by
local manager
Logbook
collected by
M&E officer
Hotline Control Total
Visual (group-level) 8 8 8 8 32 16
In-person 8 8 8 8 32 16
Telephone 8 8 8 8 32 16
Control 20 20 20 24 84 42
Total 44 44 44 48 180 90
# Mean # Mean
Age of household head (years) 722 45.54 738 43.74 0.057 1.80 *
Male household head (dummy) 722 0.7 738 0.75 0.037 -.05 **
Male respondent (dummy) 722 0.59 738 0.62 0.303 -.026
Household head completed primary school (dummy) 722 0.22 738 0.24 0.351 -.024
Number of dependents 722 1.73 738 1.68 0.594 .047
Total Credit Season A 2013 (RWF) 722 33706.34 738 32106.72 0.454 1599.62
Number of clients per group Season A 2013 156 9.85 24 9.21 0.48 .64
Note: Control includes no announcement.
Treatment Control P-Value Difference
# Mean # Mean
Age of household head (years) 1278 44.84 182 43.13 0.229 1.71
Male household head (dummy) 1278 0.73 182 0.7 0.449 0.03
Male respondent (dummy) 1278 0.6 182 0.64 0.298 -0.04
Household head completed primary school (dummy) 1278 0.22 182 0.25 0.438 -0.03
Number of dependents 1278 1.72 182 1.59 0.334 0.13
Total Credit Season A 2013 (RWF)1278 32273.53 182 37281.15 0.111 -5007.62
Number of clients per group Season A 201390 9.97 90 9.57 0.517 0.4
Note: Control includes no scorecard no logbooks.
Treatment Control P-Value Difference

31
Table 4: Farmer Interactions with Extension Services
Knows the
extension
agent
Attended
training
# trainings
attended
Experienced
problems
Reported
problems
Knows the
extension
agent
Attended
training
# training
attended
Experienced
problems
Reported
problems
(1) (2) (3) (4) (5) (6) (7) (8) (9) (10)
Scorecard only -0.04 0.04 0.76** 0.03 0.01 0.19 0.25** -0.02 -0.02 -0.03
[0.08] [0.08] [0.33] [0.04] [0.04] [0.12] [0.10] [0.40] [0.40] [0.06]
Logbook only -0.01 -0.07 -0.05 -0.02 -0.02 0.15* 0.13** 0.2 0.2 -0.01
[0.06] [0.06] [0.22] [0.03] [0.03] [0.08] [0.07] [0.34] [0.34] [0.05]
Scorecard and Logbook 0.05 0.012 0.58* 0.11 0.00 0.12 0.14* 0.21 0.21 -0.02
[0.07] [0.07] [0.35] [0.04] [0.031] [0.1] [0.08] [0.30] [0.30] [0.05]
False announcement 0.07 0.00 0.2 -0.01 -0.02 0.02 0.08 -0.09 0.09 -0.02
[-0.02] [0.06] [0.26] [0.03] [0.02] [0.06] [0.06] [0.40] [0.36] [0.04]
Scorecard and announcement -0.08 0.02 0.26 0.00 -0.01 0.23** 0.32*** 0.29 0.48 -0.04
[0.08] [0.08] [0.24] [0.04] [0.04] [0.11] [0.1] [0.38] [0.4] [0.07]
Observations 887 887 887 887 887 573 573 573 573 573
R-squared 0.01 0.01 0.05 0.03 0.02 0.01 0.03 0.02 0 0.04
Control Mean (Logbook & Scorecard) 0.73 0.38 1.01 0.11 0.09 0.54 0.18 1.57 0.14 0.85
Control SD (Logbook & Scorecard) 1.70 2.02
Control Mean (Announcement) 0.72 0.39 1.27 0.13 0.09 0.66 0.30 1.41 0.11 0.94
Control SD (Announcement) 2.08 1.90
p-values
Scorecard only vs.
Scorecard and Logbook
0.32 0.64 0.07* 0.95 0.78 0.31 0.13 0.40 0.68 0.68
Scorecard only vs.
Scorecard and announcement
0.49 0.73 0.43 0.62 0.41 0.5 0.28 0.14 0.83 0.03**
Scorecard and Logbook vs.
Scorecard and announcement
0.23 0.88 0.35 0.76 0.65 0.19 0.05** 0.52 0.88 0.17
Robust standard errors clustered at the farmers group level.
*** p<0.01, ** p<0.05, * p<0.1
Male Female

32
Table 5: Farmers Perceptions of Extension Provider
Male Female
(1) (2)
Scorecard only -0.01 0.16
[0.09] [0.11]
Logbook only 0.11* 0.15*
[0.06] [0.08]
Scorecard and Logbook 0.14** 0.22**
[0.07] [0.1]
False announcement -0.01 0.10
[0.06] [0.06]
Scorecard and announcement -0.02 0.12
[0.08] [0.11]
Observations 632 378
R-squared 0.05 0.11
Control Mean (Feedback & Scorecard) 0.6 0.66
Control Mean (Announcement) 0.71 0.74
p-values
Scorecard only vs.
Scorecard and Logbook
0.02** 0.36
Scorecard only vs.
Scorecard and announcement
0.9 0.55
Scorecard and Logbook vs.
Scorecard and announcement
0.04** 0.24
Robust standard errors clustered at the farmers group level.
*** p<0.01, ** p<0.05, * p<0.1

33
Table 6: Impacts at the farmer group level
Group
Survival
Size of
group in
Season A
2013
Size of
group in
Season A
2014
New users
joined the
group
(Dummy)
New users
joined the
group
(Number)
Users
dropped out
(Dummy)
Users
dropped out
(Number)
(1) (2) (3) (4) (5) (6) (7)
Scorecard only 0.15 0.14 1.78 0.28** 0.61 -0.44*** -1.03
[0.13] [1.07] [1.39] [0.13] [0.56] [0.14] [1.26]
Logbook only 0.14 -0.04 3.02*** 0.26*** 1.12*** -0.29*** -1.94**
[0.10] [0.88] [0.90] [0.10] [0.37] [0.11] [0.94]
Scorecard and Logbook 0.11 0.55 1.61 0.25** 0.63 -0.23** -0.44
[0.11] [0.98] [1.04] [0.10] [0.40] [0.11] [1.00]
False announcement 0.04 0.16 -0.26 0.02 -0.05 -0.02 0.37
[0.08] [0.84] [0.85] [0.10] [0.42] [0.10] [0.76]
Scorecard and announcement 0.15 -1.00 2.13 0.33** 1.34** -0.54*** -1.80
[0.13] [1.17] [1.37] [0.13] [0.55] [0.14] [1.30]
Observations 180 180 180 180 180 180 180
R-squared 0.38 0.28 0.32 0.11 0.07 0.15 0.19
Control Mean (Logbook & Scorecard)0.67 9.21 5.17 0.08 0.21 0.88 4.25
Control SD (Logbook & Scorecard) 4.01 4.37 0.83 4.06
Control Mean (Announcement) 0.72 9.57 6.77 0.26 0.86 0.68 3.66
Control SD (Announcement) 4.12 4.84 1.7 3.91
p-values
Scorecard only vs.
Scorecard and Logbook
0.7 0.62 0.88 0.77 0.97 0.06* 0.58
Scorecard only vs.
Scorecard and announcement
0.96 0.15 0.72 0.56 0.19 0.28 0.37
Scorecard and Logbook vs.
Scorecard and announcement
0.78 0.19 0.69 0.52 0.13 0.03* 0.32
Robust standard errors clustered at the farmers group level.
*** p<0.01, ** p<0.05, * p<0.1

34
Table 7: Farmer response to a hypothetical future problem
Do
nothing
Do
somethingDrop out
Do
nothing
Do
somethingDrop out
(1) (2) (3) (4) (5) (6)
Scorecard only 0.15* -0.06 0.05 0.01 -0.15 0.01
[0.08] [0.07] [0.04] [0.12] [0.12] [0.03]
Logbook only 0.04 -0.05 -0.02 0.05 -0.07 0.03*
[0.06] [0.06] [0.02] [0.09] [0.09] [0.02]
Scorecard and Logbook 0.15** -0.02 0.05* 0.15 -0.09 0.03
[0.11] 0.05 0.02 [0.09] [0.1] [0.02]
False announcement 0.16** -0.04 -0.01 0.02 -0.04 0.02
[0.06] [0.05] [0.02] [0.07] [0.06] [0.03]
Scorecard and announcement 0.16* -0.08 0.00 -0.02 -0.13 -0.00
[0.08] [0.07] [0.04] [0.11] [0.12] [0.022]
Observations 773 773 773 498 498 498
R-squared 0.04 0 0.01 0.05 0.01 0.01
Control Mean (Feedback & Scorecard)0.43 0.74 0.02 0.39 0.75 0.02
Control Mean (Announcement) 0.45 0.73 0.05 0.5 0.67 0.03
p-values
Scorecard only vs.
Scorecard and Logbook
0.99 0.41 0.96 0.1 0.56 0.09*
Scorecard only vs.
Scorecard and announcement
0.87 0.67 0.09* 0.69 0.87 0.5
Scorecard and Logbook vs.
Scorecard and announcement
0.91 0.34 0.36 0.08* 0.71 0.13
Robust standard errors clustered at the farmers group level.
*** p<0.01, ** p<0.05, * p<0.1
Male Female

35
Table 8: Feedback modalities
Attended
training
Index of
perception
Do
nothing
Attended
training
Index of
perception
Do
nothing
(1) (2) (3) (4) (5) (6)
Scorecard types
Scorecard in person, individual 0.07 -0.02 0.13 0.32*** 0.18 0.02
[0.09] [0.08] [0.09] [0.10] [0.13] [0.13]
Scorecard in person, group 0.05 -0.05 0.15* 0.18* 0.16 0.07
[0.08] [0.09] [0.09] [0.10] [0.13] [0.13]
Scorecard by phone -0.01 0.03 0.17** 0.25** 0.15 -0.03
[0.09] [0.09] [0.08] [0.10] [0.11] [0.13]
Logbook types
Paper logbook x local manager collects -0.12* 0.12** -0.03 0.15** 0.19** 0.06
[0.06] [0.06] [0.07] [0.07] [0.08] [0.09]
Paper logbook x M&E officer collects -0.05 0.09 0.09 0.08 0.11 0.09
[0.07] [0.06] [0.07] [0.07] [0.08] [0.10]
Paper logbook x Hotline service -0.04 0.11* 0.06 0.16** 0.12 0.01
[0.07] [0.06] [0.08] [0.07] [0.08] [0.10]
Observations 887 887 887 573 573 573
Control Mean (Feedback & Scorecard) 0.73 0.38 1.01 0.54 0.18 1.57
Robust standard errors clustered at the farmers group level.
*** p<0.01, ** p<0.05, * p<0.1
Male Female

36
Table 9: Farmer knowledge score
(1) (2) (3) (4)
Fertlizer
applicationAll topics
Fertlizer
applicationAll topics
Scorecard only -12.12 -1.49 -9.69 -3.94
[8.05] [4.59] [10.97] [5.05]
Logbook only -3.92 -4.86 9.44 4.53
[6.31] [3.39] [8.57] [3.55]
Scorecard and Logbook -0.02 -5.18 1.26 3.72
[0.05] [0.11] [10.09] [4.17]
False announcement 2.55 0.98 1.69 3.17
[0.07] [2.89] [7.08] [3.39]
Scorecard and announcement -11.15 0.12 5.33 0.53
[7.96] [4.38] [12.54] [5.12]
Constant -1.29 8.34*** -4.36 4.9
[4.74] [2.76] [5.43] [3.68]
Observations 782 887 506 573
R-squared 0.03 0.03 0.07 0.02
Control Mean (Logbook & Scorecard) 48.15 47.86 32.69 40
Control Mean (Announcement) 47.62 44.54 38.11 41.19
Control SD (Logbook & Scorecard) 48.96 25.29 46.32 27.13
Control SD (Announcement) 47.85 26.1 46.99 25.75
p-values
Scorecard only v.s
Scorecard and Logbook 0.03** 0.19 0.19 0.03**
Scorecard only v.s
Scorecard and announcement 0.86 0.53 0.03** 0.1
Scorecard and Logbook v.s. Scorecard
and announcement 0.12 0.11 0.74 0.47
Robust standard errors clustered at the farmers group level.
*** p<0.01, ** p<0.05, * p<0.1
Male Female

37
Table 10: Scorecard implementation costs
Total Cost Respondents Number of
rounds
Cost per
interview
Visual (group-level) $18,695 322 3 $19.35
In-person $30,465 221 3 $45.95
Telephone $8,305 335 3 $8.26
Table 11: Quantity of extension services delivered at the group level (Robustness check; with FO
fixed effects)
% loan
repaid in
2013
Attended
training
(max)
# trainings
attended
(average)
(1) (2) (3)
Treatment Scorecard 0.08 0 0.39
[2.98] [0.09] [0.26]
Treatment Feedback -0.08 -0.06 0.17
[1.93] [0.07] [0.18]
Announcement 2.2 0.03 0.14
[1.75] [0.07] [0.21]
Treatment Scorecard*Treatment Feedback 1.05 0.12 -0.26
[2.69] [0.09] [0.28]
Treatment Scorecard*Announcement -2.21 -0.08 -0.04
[2.31] [0.08] [0.27]
Constant 98.66*** 0.98*** 0.19
[2.40] [0.08] [0.24]
Control Mean (Logbook & Scorecard) 87.5 0.92 0.79
Control SD (Logbook & Scorecard) 13.13 0.55
Control Mean (Announcement) 89.08 0.91 1.05
Control SD (Announcement) 10.96 0.92
Observations 180 180 180
R-squared 0.52 0.05 0.12
Robust standard errors in brackets
*** p<0.01, ** p<0.05, * p<0.1