Young Physicians and their Views Regarding the Future of the U.S. Healthcare System
25
Practice Arrangements among Young Physicians, and their Views Regarding the Future of the U.S. Healthcare System March 2012
-
Upload
path-of-the-blue-eye-project -
Category
Health & Medicine
-
view
693 -
download
0
Transcript of Young Physicians and their Views Regarding the Future of the U.S. Healthcare System
Practice Arrangements among Young Physicians, and their Views Regarding the Future of the U.S. Healthcare System
March 2012

1
CONTENTS
SECTION Page I BACKGROUND .................................................. 2 II SPECIAL NOTES ............................................... 3 III EXECUTIVE SUMMARY .................................... 4 IV DETAILED RESULTS ........................................ 10
A Current Practice / Arrangement ................. 10
B Practice / Arrangement Preference ........... 15
C Perception of The Affordable Care Act ..... 19
D Views Regarding the Future of the U.S. Healthcare System .............................. 20 APPENDIX - Respondent Profile ............................ 23

2
I BACKGROUND This report highlights the findings from an online survey conducted among younger physicians in the United States (40 years of age and under). Interviewing was conducted in December 2011 by Medical Marketing Research, Inc., on behalf of The Physicians Foundation. The research had a number of key objectives: To create a profile of these younger physicians in terms of their current
practice / arrangement: The size and type of practice, factors influencing their choice of practice, level of satisfaction with their practice / arrangement, and more.
To explore attitudes and opinions regarding such issues as the future
direction of the healthcare system in the U.S.; including views toward the new healthcare reform legislation known as the “Affordable Care Act.”
A total of 500 interviews were targeted, utilizing Medical Marketing Research’s online panel of physicians. Eligible respondents had to be physicians, 40 years of age or under. Quotas were incorporated to (approximately) mirror the universe of physicians in terms of the three broad types of practice (Primary Care Physicians, Medical / Surgical Office-Based Specialists, and Hospital Based-Specialists). The in-tab sample breakdown was as follows: Sample Type of Practice Size (#) Primary Care Physicians (including GP/FP/IM, Ped, OB/GYN) ........... 250
Medical / Surgical Office-Based Specialists ........................................ 175
Hospital-Based Specialists .................................................................... 75

3
II SPECIAL NOTES Where relevant, results among the three practice-type subgroups were tested for statistical significance, at a 90% level of confidence. When results were found to be significantly different a small postscript / letter is inserted immediately to the right of the significantly higher of the two numbers. These postscripts are “p” for the PCPs, “m” for Medical / Surgical office-based specialists, and “h” for Hospital-based specialists. So, for example, if the letter “m” appears to the right of a number in the “PCP” column; that indicates that the PCP percent is significantly higher than the Medical / Surgical office-based percent. Maximum error ranges for the bases shown in the tables (at a 90%
confidence level) are as follows: Sample Size Maximum error range 500 (Total) ........................................................ +/- 3.7 points
250 (Primary Care Physicians)......................... +/- 5.2 points
175 (Medical Surgical-based specialists) ......... +/- 6.2 points
75 (Hospital-based specialists) ..................... +/- 9.5 points
Note that standard error calculation and the use of significance tests apply
to random probability samples and are included herein to serve as a guide-only. Such statistical calculations should be interpreted accordingly.

4
III EXECUTIVE SUMMARY A Overview The typical younger physician in this survey is 37 years of age and is an
employee of a medical group; with the largest single segment being employees of small groups (6 or fewer physicians): 58% are employees of medical groups, and almost half of those (48%) are with the smaller groups. In contrast, 26% are with mid-sized groups (with 7 to 12 physicians), and 26% are with larger groups (13-plus physicians).
These physicians are markedly pessimistic regarding the future of the U.S.
healthcare system, with the “new healthcare legislation” ranking as a strong #1 reason for the pessimism. Many voice considerable cynicism with (what several call) “government’ involvement.”
Financial-related considerations play a key role in the choice of practice/
arrangement. Most cite “income/cash flow” and “employment security” as factors influencing their current arrangement. And among the 27% who changed (or considered changing) their practice/arrangement in the past year, the leading reason given related to “financial issues.”
The vast majority express satisfaction with their current practice /
arrangement (with 35% saying they are “highly satisfied,” and another 45% saying they are “somewhat satisfied”); and most expect to stay with the current practice/ arrangement for 8 years or more. Many (39%) aspire to some form of ownership position in the future (as either sole owner or partner).
B Summary 1 Profile of Practice / Arrangements As mentioned, the average younger physician is an employee of a medical
group. Indeed, 58% are employees of such groups; and the majority of those are with small groups (i.e., with 6 or fewer physicians).
- As one might expect, Hospital-based physicians are more likely to be
hospital employees and, thus, less likely to be employed in a group. Nonetheless, even among this segment, almost half are employees of medical groups (vs. one-third who are hospital employees). However, there was one notably different pattern among the Hospital-based segment:

5
The Hospital-based specialist is much more likely to be an employee
of a large group (with more than 12 physicians). Specifically, 65% of the Hospital-based doctors who are employees of medical groups are with the larger groups. In comparison, among the group-based Primary Care physicians, only 19% are with the larger groups.
Also notable here (and potentially exposing a degree of
dissatisfaction), while 31% of the Hospital-based segment are currently employees of large groups, if given the opportunity to choose, only 12% would prefer such an arrangement.
Not surprisingly – regardless of whether a PCP, Medical office-based
specialist or Hospital-based specialist – many strive for some form of ownership position. Overall, 26% currently have an ownership stake (either sole owner or partner), and if given the opportunity, a significantly higher 39% would opt for such a stake.
What influenced you to change – or consider changing – from your current practice arrangement?
“An opportunity to own my own practice presented itself.”
“I considered changing due to (the) desire to be a partner / owner and work for myself.”
“I feel like I could run my own practice better than it is being run by my boss, the current owner.”
Across the three practice-types:
- One third of the PCPs are currently sole owners or partners in a group,
and, if given the opportunity, over 40% would opt for this. - Among the Medical / Surgical office-based physicians, somewhat fewer
are current owners / partners (25%). But here too, approximately 40% would like to be.
- As one might expect, Hospital-based specialists are significantly less
likely to hold current ownership positions vs. either of the other practice-types: Only 10% of these Hospital-based physicians currently hold some form of ownership. The Hospital-based subset are also somewhat less interested in such future ownership positions: 32% of them would desire such ownership if given the opportunity.

6
Despite our earlier comment (vis-à-vis the disconnect between the
significantly lower percentage of Hospital-based physicians who want to be in large groups vs. the percent who currently are), across the board, most of these young physicians express satisfaction with their current arrangement.
- For example, they expect to stay with their current practice /
arrangement for at least 7 years; with over half planning to stay 8 years or more.
Among the three practice-types, Medical-surgical office-based physicians
anticipate somewhat longer tenures, Hospital-based physicians markedly shorter, with PCPs falling in between. Versus their Medical / Surgical office-based counterparts, the Hospital-based segment are significantly more likely to anticipate staying for 2 years or less, and significantly less likely to anticipate staying for 8 years or more.
- And perhaps more telling: When asked directly, 80% say they are
“satisfied” with their current practice/arrangement (35% saying they are “highly satisfied,” plus 45% who say they are “somewhat satisfied”). In contrast, only 7% say they are “dissatisfied.”
It comes as no surprise that money played a key role in the choice of
practice/ arrangement. When asked about factors that went into making the decision, most (65%) say they were influenced by “income / cash flow,” and over half cite “employment security.”
Also worth noting: For 25%, the single most important factor was that it
was “the only job available.”
2 Recent Change in Practice / Arrangement 27% had changed – or considered changing – their practice / arrangement
in the past year. Among those changing their practice / arrangement in the past year –
financial considerations dominate as the primary reason. 31% cite this as a reason, followed by “location” (11%), “family life / quality of life” (11%) and “autonomy / be my own boss” (10%).
As cited earlier – at least vs. PCPs and Medical / Surgical office-based
physicians – one senses a slightly elevated level of dissatisfaction among the Hospital-based physicians. Echoing our earlier finding, 31% of the Hospital-based segment are currently employees of large groups, yet only 12% would prefer such an arrangement if given the option. And vs. PCP and Medical

7
office-based physicians, the Hospital-based subset anticipates staying in their current practice / arrangement for a shorter time.
- Adding to this impression of elevated dissatisfaction are the findings here
regarding recent change in practice / arrangement: Hospital-based physicians are significantly more likely to have recently changed (or considered changing) their arrangement. Specifically, 43% of this group had changed or considered changing that arrangement in just the past year, vs. 23% of the PCPs and 27% of the Medical / Surgical office-based group.
3 Views regarding the Future of the U.S. Healthcare System These young physicians exhibit considerable pessimism regarding the
future of the U.S. healthcare system:
- When it comes to the Affordable Care Act, 49% believe the impact on their practice will be negative, vs. only 23% who believe it will be positive. Among the three practice-types, the Primary Care physicians exhibited somewhat less pessimism vs. the other two segments: They were a bit more likely to be “positive” or “neutral,” a bit less likely to be negative.
- And well over half (57%) are pessimistic about the future of the U.S.
healthcare system (with over 30% saying they’re “highly pessimistic”). In contrast, only 4% are “highly optimistic,” and 18% who are “somewhat optimistic”. When asked (open-ended) reasons for their pessimism, responses covered a wide spectrum of negatives – with the “new healthcare legislation” leading the way. Indeed, as one peruses the responses to the question, the cynicism voiced by so many – with most of it directed at “government” – stands out:
Why do you feel pessimistic about the future of the U.S. Healthcare System?
“(Because of) government involvement.” “(I) Don’t trust government to do the right thing for patients and physicians or to enact lasting improvements.” “Because the U.S. healthcare system isn’t concerned about the employees or patients. They’re just concerned about the money.” “Government control is a recipe for disaster. They cannot run a business and cannot control expenses. How could they do a good job on healthcare? It is a real joke!”

8
“Government controlled healthcare will be the downfall. Anyone who has worked in government environment such as VA would know this - ask any vet who receives their care through VA how good the system is!” “The current administration is only concerned with money and maintaining their power and socialism.”
“Government regulation has too many strings attached. (It) has not been well thought out. (It) will bankrupt the country. (We are) pushing toward socialist medicine.”
“I do not feel optimistic because of all the increased regulatory burdens on physicians. There will be an increased shortage of physicians to provide primary care and decreased access to care.”
“The very reasons why people come to the U.S. to obtain care (research, quality, availability, cutting edge, good physicians, etc) is being taken away one at a time. The changes that are being made are not made with the patient in mind, but with the 'bottom line' economically in mind. Not once is the patient mentioned in all these changes.” “I think the government is destroying healthcare.” “Large amounts of money are being spent on things outside of actual healthcare; CEO bonuses, pharmaceuticals, malpractice insurance premiums, lawyers, etc. This accompanied with the new 'Customer Service' initiatives that reward physicians who practice bad medicine is clouding the future of medicine.” “Physicians have no say, rather insurance companies dictate care. The focus is saving money for insurance companies not patient care.”
Even many of the responses from those claiming to be “optimistic” about the future have a negative undercurrent:
Why do you feel optimistic about the future of the U.S. Healthcare System?
“It has to get better.”
“It can’t get any worse.”
“As change is being implemented to a more intelligent system for delivering healthcare, or at least, work to change the current dysfunctional system, it is being blocked by insurance companies and drug companies who have more to lose.”

9
“I am concerned about the efforts and actions of those in Washington (who are) more worried about self than the current healthcare system which is very broken right now.”
“I am mostly optimistic but have pessimism towards congress and the public’s ability to enact decent change and regulation.”
“I feel the next president will reverse Obamacare.”

10
IV DETAILED RESULTS A Current Practice / Arrangement Most of these younger physicians are employees of medical groups. As shown in Table 1 – when small, medium and large groups are combined – 58% of the PCPs, and 61% of the Medical office-based specialists, are such employees. And for both of these subgroups, the “small medical group” – with 6 or fewer physicians – ranks as the #1 arrangement.
Table 1
Current Practice / Arrangement Question: How would you describe your current practice arrangement? PCP Med./Surg. Hospital- Total Group Office-Based Based (%) (%) (%) (%) Employee/Small group (2-6 physicians) 28 33 h 29 h 8 Employee/Medium group (7-12 physicians) 15 14 17 9 Employee/Large group (more than 12 physicians) 15 11 15 31 pm (Net – Employee of group) 58 58 61 h 48 Solo Owner 14 20 mh 11 h 1 Group owner/partner 12 12 14 9 (Net-Owner+partner) 26 32 h 25 h 10 Hospital employee 12 7 10 33 pm Teaching 2 1 2 4 Administration 1 - 1 3 Other 1 1 - 1 Base (#) 500 250 175 75
11
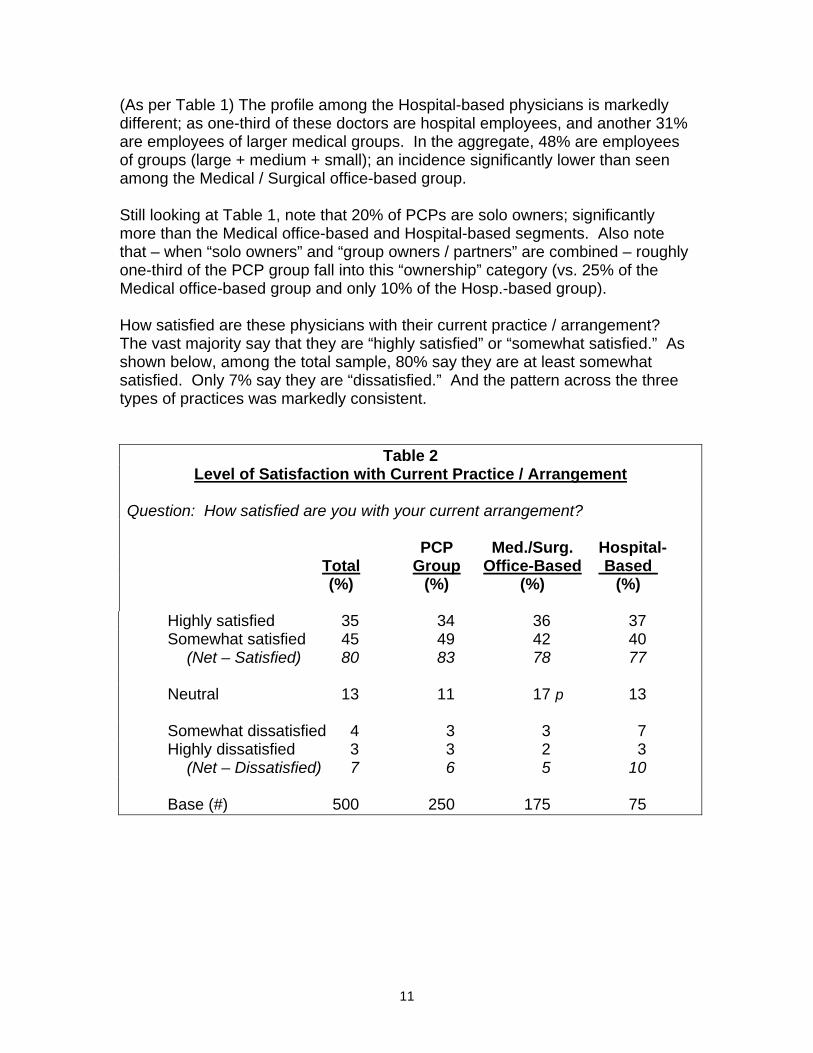
(As per Table 1) The profile among the Hospital-based physicians is markedly different; as one-third of these doctors are hospital employees, and another 31% are employees of larger medical groups. In the aggregate, 48% are employees of groups (large + medium + small); an incidence significantly lower than seen among the Medical / Surgical office-based group.
Still looking at Table 1, note that 20% of PCPs are solo owners; significantly more than the Medical office-based and Hospital-based segments. Also note that – when “solo owners” and “group owners / partners” are combined – roughly one-third of the PCP group fall into this “ownership” category (vs. 25% of the Medical office-based group and only 10% of the Hosp.-based group). How satisfied are these physicians with their current practice / arrangement? The vast majority say that they are “highly satisfied” or “somewhat satisfied.” As shown below, among the total sample, 80% say they are at least somewhat satisfied. Only 7% say they are “dissatisfied.” And the pattern across the three types of practices was markedly consistent.
Table 2 Level of Satisfaction with Current Practice / Arrangement
Question: How satisfied are you with your current arrangement? PCP Med./Surg. Hospital- Total Group Office-Based Based (%) (%) (%) (%) Highly satisfied 35 34 36 37 Somewhat satisfied 45 49 42 40 (Net – Satisfied) 80 83 78 77 Neutral 13 11 17 p 13 Somewhat dissatisfied 4 3 3 7 Highly dissatisfied 3 3 2 3 (Net – Dissatisfied) 7 6 5 10 Base (#) 500 250 175 75

12
Respondents were presented with a list of eight factors that might have influenced their decision regarding choice of practice / arrangement, and asked two questions: Which factors influenced their decision (with results reported in Table 3), and which single factor most-influenced the decision (Table 4). As shown below, 65% say they were influenced by “income/cash flow.” This clearly ranked as the top factor; followed by “employment security,” “family life” and “other physicians.” Note that PCP group physicians were significantly less likely to cite “other physicians” as a factor, compared with those in Medical office or Hospital-based practices. And not surprisingly, Hospital-based specialists appeared relatively less concerned than their PCP or Medical office-based counterparts with “economic / regulatory uncertainty.”
Table 3 Factors Influencing the Choice of Current Practice/Arrangement
Question: What considerations / factors went into your decision to be in your current practice arrangement? Check all that apply. PCP Med./Surg. Hospital- Total Group Office-Based Based (%) (%) (%) (%) Income/cash flow 65 68 63 63 Employment security 53 50 55 60 Family life 46 48 46 43 Other physicians 36 27 45 p 43 p Economic / regulatory uncertainty 35 36 h 39 h 25 Relief from administrative burden 32 32 32 32 Best arrangement for patient care 26 26 27 20 Only job available 7 6 7 8 Other 3 2 4 4 Base (#) 500 250 175 75
13
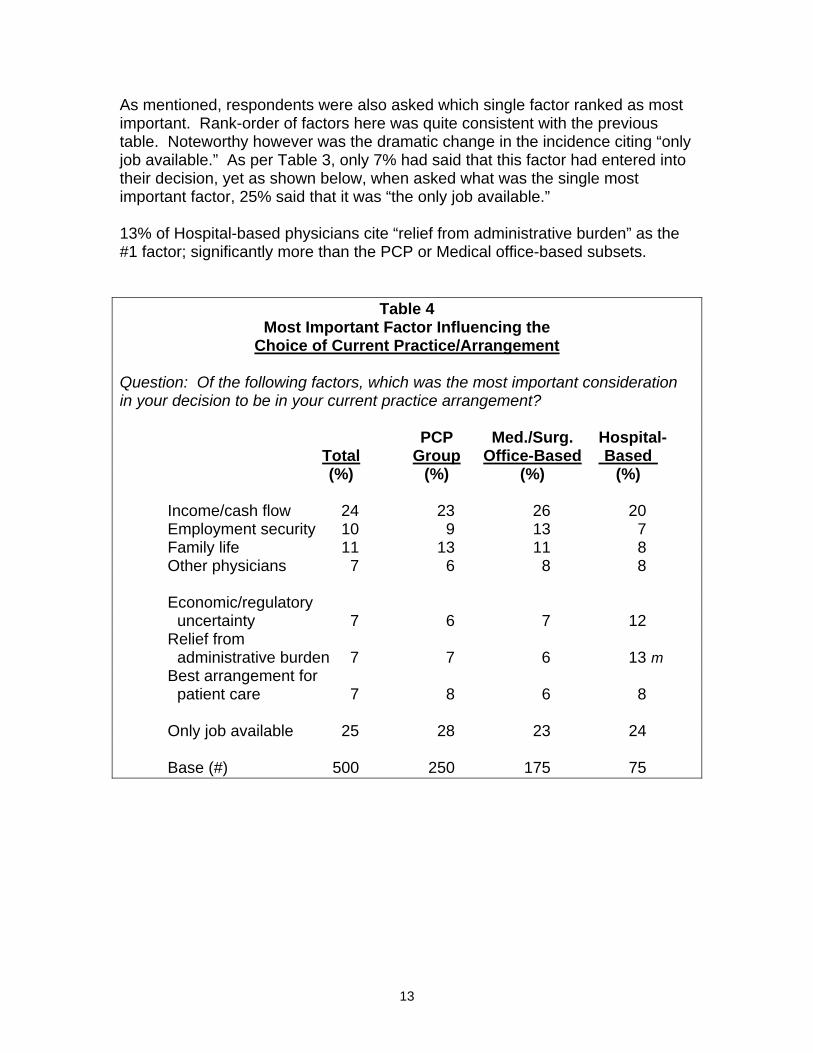
As mentioned, respondents were also asked which single factor ranked as most important. Rank-order of factors here was quite consistent with the previous table. Noteworthy however was the dramatic change in the incidence citing “only job available.” As per Table 3, only 7% had said that this factor had entered into their decision, yet as shown below, when asked what was the single most important factor, 25% said that it was “the only job available.” 13% of Hospital-based physicians cite “relief from administrative burden” as the #1 factor; significantly more than the PCP or Medical office-based subsets.
Table 4 Most Important Factor Influencing the
Choice of Current Practice/Arrangement Question: Of the following factors, which was the most important consideration in your decision to be in your current practice arrangement? PCP Med./Surg. Hospital- Total Group Office-Based Based (%) (%) (%) (%) Income/cash flow 24 23 26 20 Employment security 10 9 13 7 Family life 11 13 11 8 Other physicians 7 6 8 8 Economic/regulatory uncertainty 7 6 7 12 Relief from administrative burden 7 7 6 13 m Best arrangement for patient care 7 8 6 8 Only job available 25 28 23 24 Base (#) 500 250 175 75

14
57% of Medical office-based doctors expect to be in their current practice / arrangement for eight years or more (see Table 5). This is significantly higher than the 44% incidence among the Hospital-based doctors. Indeed, the Hospital-based physicians are significantly less likely to anticipate staying for 8+ years, and significantly more likely to anticipate staying for 2 years or less.
Table 5 # of Years Expecting to Remain in Current Practice / Arrangement
Question: How long do you expect to be in your current practice arrangement? PCP Med./Surg. Hospital- Total Group Office-Based Based (%) (%) (%) (%) 8+ years 52 51 57 h 44 7 - 8 years 6 5 9 3 5 - 6 years 16 16 14 20 3 - 4 years 15 16 12 16 1 - 2 years 11 12 9 17 m Est. Avg (# of yrs) 7.2 7.1 7.7 6.5 Est. Median (# of yrs) 8.1 8.0 8.3 5.9 Base (#) 500 250 175 75

15
B Practice / Arrangement Preference If given the opportunity to choose a practice / arrangement, over 40% of the PCPs would opt for some form of ownership (21% citing “solo ownership,” and 21% citing “group ownership / partnership”). Among the Medical office-based physicians, the incidence was near identical to the PCPs, yet among the Hospital-based group, only 32% say they would choose one of the forms of ownership. Regardless – for all three segments of respondents – the percent that would prefer some form of ownership is significantly higher than the percent that currently have such ownership. For example, among the total sample, 26% currently have an ownership position; vs. 39% who would prefer such a position.
Table 6 Practice / Arrangement Preference
Question: If you could choose any practice arrangement, which one would you choose? PCP Med./Surg. Hospital- Total Group Office-Based Based (%) (%) (%) (%) Group owner/partner 24 21 26 28 Solo Owner 15 21 mh 13 h 4 (Net – owner+partner) 39 42 h 39 32 Employee/Small group (2-6 physicians) 22 25 h 25 h 8 Employee/Medium group (7-12 physicians) 12 10 14 15 Employee/Large group (more than 12 physicians) 10 8 11 12 (Net – employee of group) 44 43 h 50 h 30 Hospital employee 10 8 7 25 pm Administration 3 3 1 4 Teaching 2 2 2 4 Research - 1 - - Other 1 1 1 - Base (#) 500 250 175 75

16
Interestingly – as per Table 1 – 31% of the Hospital-based physicians had said that they were currently employees of large groups (with 13-plus physicians), yet as shown in Table 6 on the previous page, only 12% would choose such an arrangement if given the option.
As shown in Table 7 below, 27% changed or considered changing their practice / arrangement in the past 12 months. Of particular note – referring back to Table 2 – there was little variation across the three segments in terms of the percents who said they were satisfied with their current practice / arrangement, yet there was dramatic variation in terms of the percent changing their arrangement in the past year. Specifically, Hospital-based physicians were significantly more likely to have recently changed (or considered changing) their arrangement: As shown below, 43% of this group had changed or considered changing
that arrangement in just the past year, vs. 23% of the PCPs and 27% of the Medical office-based group.
Table 7 % Who Changed or Considered Changing
their Practice / Arrangement in the Past Year Question: Did you change or consider changing your practice arrangement in the last 12 months? PCP Med./Surg. Hospital- Total Group Office-Based Based (%) (%) (%) (%) Yes (Changed or considered changing) 27 23 27 43 pm No (Did not change or consider changing) 73 77 h 73 h 57 Base (#) 500 250 175 75

17
Among those changing their arrangement in the past year, 32% moved from “employee in a group,” 16% moved from “hospital employee” and 12% moved from “solo or group owner / partner” (Table 7a).
Table 7a Practice / Arrangement Changed From
(Among those who Changed / Considered Changing in the Past 12 Months) Question: If you changed (or considered changing) your practice / arrangement in the last 12 months, which one did you change from? PCP Med./Surg. Hospital- Total Group Office-Based Based (%) (%) (%) (%) Employee in large group (more than 12 physicians) 18 21 17 16 Employee in medium group (7-12 physicians) 7 7 6 9 Employee in small group (2-6 physicians) 17 26 h 17 h - (Net – Employee in group) 32 54 h 40 25 Hospital employee 16 16 9 28 Group owner/partner 7 2 9 13 p Solo Owner 5 9 4 - (Net – Owner/partner) 12 11 13 13 Teaching 4 2 6 6 Research 2 2 - 6 Administration 1 - 2 3 Considered but did not/ have not yet changed 11 11 11 13 Other 9 7 9 13 Base (#) 136 57 47 32

18
Not surprisingly – among those changing their practice / arrangement in the past year – financial considerations dominate as the primary reason. As shown in Table 7b, 31% cite this as a reason, followed by “location” (11%), “family life / quality of life” (11%) and “autonomy / be my own boss” (10%). Interestingly, “location” and “workload” were significantly greater factors among the Hospital-based physicians vs. the PCP or Medical office-based physicians.
Table 7b Reasons Why Changed / Considered Changing Practice / Arrangement (Among those who Changed / Considered Changing in the Past 12 Months)
Question: What influenced you to change or consider changing from your current practice arrangement? PCP Med./Surg. Hospital- Total Group Office-Based Based (%) (%) (%) (%) Financial issues/ economic uncertainty/Income 31 28 34 31 Location 11 9 6 22 pm Family life/quality of life 11 12 9 13 Autonomy/be own boss 10 12 9 6 Reimbursement & insurance issues 8 14 h 6 - Work load 7 5 2 16 pm Administrative changes/ problems 4 9 2 - Improved working conditions 4 2 4 9 Problems with doctors In practice 4 2 9 - Doctors/partner left practice 4 4 4 3 Patient care/continuity 3 5 2 - Have not changed yet 7 5 9 6 Other 15 12 17 19 Base (#) 136 57 47 32

19
C Perception of the Affordable Care Act What do these physicians think of the Affordable Care Act? Generally, reactions are negative: 23% believe that the Act will have a positive impact on their practice (6% saying “highly positive,” plus 17% saying “somewhat positive”). This compares to 49% who feel the impact will be negative. Among the three segments of physicians, the PCPs were less likely to be negative / more likely to be positive or neutral.
Table 8 Perception of the Impact of the “Affordable Care Act”
Question: How do you feel the new health system reform legislation referred to as the Affordable Care Act will impact your practice? PCP Med./Surg. Hospital- Total Group Office-Based Based (%) (%) (%) (%) Highly positive 6 6 4 9 Somewhat positive 17 20 h 16 8 (Net - Positive impact) 23 26 20 17 Neutral 29 30 27 28 Highly negative 28 26 32 23 Somewhat negative 21 18 21 32 pm (Net - Negative impact) 49 44 53 p 55 Base (#) 500 250 175 75

20
D Views regarding the Future of the U.S. Healthcare System Reactions to the Affordable Care Act are largely negative; and the outlook regarding the future of the U.S. healthcare system is even more negative. Well over half (57%) are pessimistic about the future of the healthcare system, with over 30% saying they’re “highly pessimistic.” Only 4% are “highly optimistic,” plus another 18% who report being “somewhat optimistic” (see Table 9). In effect, 2-1/2 times more physicians are pessimistic than optimistic.
Table 9 Level of Optimism regarding the Future of the U.S. Healthcare System
Question: How optimistic are you about the future of the U.S. healthcare system? PCP Med./Surg. Hospital- Total Group Office-Based Based (%) (%) (%) (%) Highly optimistic 4 5 2 8 Somewhat optimistic 18 22 mh 14 12 (Net - Optimistic) 22 27 m 16 20 Neutral 21 16 26 p 25 p Somewhat pessimistic 26 25 29 21 Highly pessimistic 31 32 29 33 (Net - Pessimistic) 57 57 58 54 Base (#) 500 250 175 75

21
Those saying they were pessimistic about the future of the healthcare system were asked why. Table 9a reports the results to this open-ended question. As shown, these physicians provided a large variety of negative responses; with the “new healthcare law” ranking as a strong #1 reason for pessimism.
Table 9a Reasons for Pessimism About the Future of the U.S. Healthcare System
(Among those who are pessimistic) Question: Why do you feel pessimistic about the future of the U.S. healthcare system? PCP Med./Surg. Hospital- Total Group Office-Based Based (%) (%) (%) (%) New healthcare law/regulations 34 33 37 29 Just somewhat/highly pessimistic about the future of healthcare 13 12 13 17 Declining reimbursement 12 11 14 12 Costs will increase 9 6 9 17 p Decrease in physicians income 5 3 8 7 System is a mess & will only get worse 5 5 2 10 m Distrust of government to do the right thing 4 5 3 2 Non-healthcare personnel/ providers will be making many decisions 4 3 6 2 Patient care may suffer due to Government intervention 4 3 4 5 Increase in work/patient load 3 2 3 7 Future will not be great/ going in the wrong direction 3 3 3 2 Medicare is mess/will only get worse 2 2 4 - All other 16 17 19 7 Not sure 4 4 4 - Base (#) 284 141 102 41

22
Those saying they were optimistic about the future of the healthcare system were also asked to provide their reasons why. Unlike the previous table, no particular reason stood out here: 10% simply felt the future would bring “better healthcare,” 10% responded with (what might be considered a pessimistic) “things couldn’t get any worse,” 9% added that “healthcare will be accessible to more people” and 9% couldn’t articulate beyond just a general feeling of optimism.
Table 9b
Reasons for Optimism About the Future of the U.S. Healthcare System (Among those who are optimistic)
Question: Why do you feel optimistic about the future of the U.S. healthcare system? Total (%) Better patient care 10 Can't get any worse/can only get better 10 Healthcare will be accessible to more/all people 9 I'm fairly/highly optimistic about the future of healthcare 9 Moving to a better system/moving in the right direction 6 We have the best physicians/healthcare system in the world 6 Everyone will have insurance 5 New treatments/technologies are coming 5 Expect reimbursement to improve 4 Problems with current system will be eliminated 4 Hope for a change in leadership in Washington 4 Need to get healthcare spending under control 4 Obama Care will be overturned 4 Physicians are still dedicated to patient care 3 All other 18 Don't know 7 Base (#) 111

23
APPENDIX – RESPONDENT PROFILE
Primary Specialty of PCP Group Physicians PCP Group Specialty (%) GP/FP/IM 69 Pediatrician 16 Ob/Gyn 7 Other 8 Base (#) 250
Primary Specialty of Medical/Surgical Office-Based Physicians Med./Surg. Office-Based Specialty (%) Oncologist 27 Cardiologist 9 Urologist 7 Rheumatologist 6 Endocrinologist 6 Pulmonologist 5 Other 40 Base (#) 175
Primary Specialty of Hospital-Based Physicians Hospital-Based Specialty (%) Anesthesiologist 32 ER Physician 29 Radiologist 11 Pathologist 8 Other 20 Base (#) 75

24
Respondent Profile (Cont’d) PCP Med./Surg. Hospital- Total Group Office-Based Based Practice Setting PCP Group (%) 50 100 - - Medical/Surgical Office-Based (%) 35 - 100 - Hospital-Based (%) 15 - - 100 Avg Age (#) 37.3 37.0 37.7 37.6 Region South (%) 30 32 27 32 North (%) 27 26 30 25 East (%) 26 27 26 24 West (%) 16 15 17 19